

Abstract
This study evaluated variation in fibrosis staging caused by depth, pre-load force, and measurement off-axis distance on different ultrasound shear wave elastography (SWE) systems prospectively in 20 patients with diffuse liver disease. Shear wave speed (SWS) was measured with Transient Elastography (TE), acoustic radiation force impulse (ARFI) and two-dimensional shear-wave elastography (2D-SWE). ARFI and 2D-SWE measurements were obtained at different depths (3, 5, 7 cm), with different pre-load forces (4, 7, and 10 Newton and variable), and at 0, 2 and 4 cm off the central axis of the transducer. A single blinded pathologist staged fibrosis using the METAVIR system (F0-F4). Area under the receiver operating characteristic curve (AUROC) to differentiate significant fibrosis (F≥2) was charted. Depth was the only factor that was shown to influence ARFI-derived values, while no acquisition factors were shown to affect 2D-SWE SWS values. ARFI and 2D-SWE for diagnosing significant fibrosis at a depth of 7 cm along the central axis had good diagnostic performance (AUROC= 0.92 and 0.82, respectively), which were comparable to TE. Further investigation of this finding will likely be of interest.
Keywords: Ultrasound elastography, Shear wave, Variation, Liver fibrosis, Depth, Pre-load force, Off-axis
INTRODUCTION
Chronic liver disease (CLD) has an estimated overall prevalence of 14.78% in the United States (Younossi et al. 2011) and comprises a number of different illnesses, all characterized by chronic hepatocyte damage. Irrespective of etiology, CLD follows a common pathophysiologic pathway in which repeated episodes of liver injury are followed by healing, regeneration, and fibrosis. In a significant minority of patients, this ultimately culminates in an irreversible state of fibrosis-induced hepatic dysfunction termed cirrhosis (Pellicoro et al. 2014). Cirrhosis causes an estimated 49,500 deaths in the United States annually, and more than one million deaths worldwide, accounting for 1.95% of all global deaths (Mokdad et al. 2014; Murray et al. 2013). Hepatic fibrosis, the progenitor state of cirrhosis, was originally thought to be irreversible, but is now recognized to be a dynamic process with potential for resolution(Friedman and Bansal 2006). It is therefore clinically important to identify and accurately measure liver fibrosis in CLD patients, both to identify those at risk of cirrhosis and to evaluate for fibrosis progression or resolution.
Histopathologic examination of liver biopsy tissue remains the reference standard for staging hepatic fibrosis. However, liver biopsy has a number of limitations, including invasiveness,(Actis et al. 2007) (Ravindran et al. 2016) high cost, inter-pathologist variation (Burt et al. 2015; Kaswala et al. 2016) and sampling error (Brunt 2016; Parikh et al. 2017; Shiha et al. 2017). As a result, alternative non-invasive staging methods have been proposed including blood tests (Chin et al. 2016; Rosenberg et al. 2004), magnetic resonance elastography (MRE)(Dulai et al. 2016; Petitclerc et al. 2017), and ultrasound elastography (UE)(Crespo et al. 2012; Dhyani et al. 2015; Sigrist et al. 2017). UE approaches that employ acoustic or mechanical force to generate tissue shear waves have been shown to correlate with liver fibrosis stage (Dhyani et al. 2017; Ferraioli et al. 2012; Li et al. 2016; Samir et al. 2015).
In clinical practice, UE measurements show variability that limits their capability to precisely quantify liver fibrosis. There are several reasons for this, including: (1) Technology heterogeneity. Proprietary technologies differ amongst manufacturers, resulting in measurement output heterogeneity (Barr et al. 2015) and manufacturer-dependent liver stiffness measurement correlations with different liver fibrosis stages (Ferraioli et al. 2015); (2) Technique heterogeneity. Elastography measurements obtained using different techniques on the same system and patient may vary. Many technique factors may affect UE measurements, including region of interest (ROI) depth (D’Onofrio et al. 2010; Kaminuma et al. 2011), pre-load force (Mantsopoulos et al. 2015), and phase of inspiration (Yun et al. 2011). Data regarding the magnitude and meaning of these effects for liver fibrosis staging in clinical practice is limited.
The objective of this study was to evaluate the influence of variation in acquisition technique factors on fibrosis staging. We evaluated depth of measurement, operator preload force, and the distance of the ROI from the central axis of the transducer on different ultrasound shear wave elastography (SWE) systems.
METHODS
Patients
This prospective single-institution study was performed at Department of Radiology of Massachusetts General Hospital and approved by the Institutional Review Board (IRB). Twenty subjects with the following criteria were enrolled between 06/0½015 and 09/30/2015. Inclusion criteria: (1) Adult patients (age 18 or older), (2) suspected diffuse liver disease, and (3) non-focal liver biopsy in the past 6 months or scheduled to have liver biopsy in the next 3 months as part of routine clinical care. Exclusion criteria: (1) Pregnancy, and (2) Acute illness/cognitive impairment resulting in the inability to cooperate with ultrasound. Subjects were asked to fast for a minimum of 4 hours before the SWE examinations. Informed consent was obtained from all subjects.
Elastography
Each subject underwent same day elastography using three different elastography methods, which were transient elastography (TE, Echosens, Fibroscan), acoustic radiation force imaging (ARFI, Siemens, S3000) and two-dimensional shear-wave elastography (2D-SWE, SuperSonic Imagine, Aixplorer). All elastography was performed by a single sonologist (LC) with more than 10 years of experience who was not aware of the biopsy results.
Scanning Protocol:
Each patient was scanned with three systems. All measurements were performed in the right lobe of the liver through an intercostal approach while the patients were lying in a supine decubitus position with the right arm in maximal abduction. Scanning was performed at almost the same location in the liver for the three systems. The shear-wave speed (SWS) was used for statistical analyses in our study. The relation of Young’s modulus and SWS is E = 3ρcs2 (E is Young’s modulus, cs is the speed of the shear wave, ρ is the density of tissue). This equation assumes an elastic, linear, isotropic and homogeneous material that is nearly incompressible.
With the FibroScan device (EchoSens, Paris, France), TE shear wave propagation were measured in a volume that approximates a cylinder 1 cm wide and 4 cm long, between 25 mm and 65 mm below the skin surface. All acquisitions were made as per standard protocol recommended by the vendor and by a single investigator (LC) who had been trained and certified as competent by the vendor’s US representative (Sandhill Scientific), and who had completed TE on ten practice subjects prior to study initiation.
ARFI was performed with a Siemens Acuson S3000 ultrasound system (Siemens AG, Erlangen, Germany) using a 4C1 transducer. Ultrasound examination along with elastography measurements at varying depths (3 cm, 5 cm, 7 cm from the skin), pre-load forces (variable (unmonitored, “conventional” technique) and fixed at 4 Newtons (N), 7 N, 10 N) and distance from the ROI to the central axis of the transducer (0 cm, 2 cm, 4 cm) were performed. Two parameters were fixed while one varied. When depth was varied, distance from the ROI to the central axis was fixed at 0 cm and pre-load forces were unmonitored. When pre-load forces varied, the depth was fixed at 5 cm and distance from the central axis was fixed at 0 cm. When distance from the central axis varied, the depth was fixed at 5 cm and pre-load forces were unmonitored. For each measurement, the subject was asked to suspend respiration after a small breath in to minimize breathing motion. 10 valid measurements were performed at each depth, with each pre-load force and at each distance from the central axis for each subject.
2D-SWE was performed with a SuperSonic Imagine Aixplorer ultrasound system (SuperSonic Imagine, Aix-en-Provence, France), using a SC6–1 convex probe. Ultrasound examination along with elastography measurements at varying depths (3 cm, 5 cm, and 7 cm from the skin), force (variable (unmonitored) and fixed at 4 N, 7 N, and 10 N) and distances from the ROI to the central axis of the transducer (0 cm, 2 cm, and 4 cm) were performed during repeated small breath holds. Similar to ARFI, two parameters were fixed while one varied. 10 measurements were also made at each depth, with each pre-load force and at each distance from the central axis for each subject. In order to make measurement, a box of 3.5×2.5 cm was placed in a region of parenchyma free of large vessels, and in which 1-cm-diameter circular region of interest (ROI) was selected. When measurements were made at different depths or different distances from to the axis, the center of the ROI was used as the reference point.
Force-Sensing Ultrasound Probe Attachment
A measurement system developed at MIT (Gilbertson 2014; Gilbertson and Anthony 2013) was used to record real-time transducer force applied on the patient during ultrasound imaging. The system measures the contact forces, torques, and orientation angles of off-the-shelf abdominal ultrasound probes (Figure 1A). The system attaches to the probe via a quick-release, hand-operated, 3D-printed, locking plastic clamshell clamp, which only covered the holding part, not the acoustic part of the probe. The clamp is connected to the 3D-printed plastic shell through an ATI Mini-40 six-axis force/torque sensor (ATI Industrial Automation, Apex, NC), which measures the relative forces applied between the sonographer’s hand and the ultrasound probe. The two halves of the plastic shell attach via magnets. Embedded within the plastic shell is an ADXL-335 tri-axial accelerometer, which measures the orientation of the probe with respect to gravity and enables compensation for probe weight. Forces, torques, and transducer orientation are sampled at a rate of 60 Hz using a custom LabVIEW program, which runs on a Dell Inspiron 17R laptop running Windows 7. A graphical user interface displays the readings in real time. The system, shown in Figure 1B with a 3D-printed mockup probe, is powered by the laptop, and is highly portable. (Gilbertson 2014); Gilbertson and Anthony (2013) demonstrated that the forces applied along the long axis of the probe (Y-axis, as defined in Figure 1A) were more than an order of magnitude greater than the shear forces applied in the other two directions (X- and Z-axes), which were close to the effective resolution (0.35 Newtons) of the device. Therefore, in this study, we investigated forces in the axial direction (Y-axis) only and report these forces in Newtons. For brevity, the term “force” is used to refer to “axial force” throughout this paper. The plastic shell was custom-shaped to clamp around the various ultrasound probes used, and the probes themselves were not mechanically- or electrically-altered in any way.
Fig.1.

Force-sensing Attachment for Ultrasound Probe and force measurement system. A: SolidWorks rendering of the force-measuring probe. B: Photograph of the complete system. The ultrasound probe cable is Velcro-strapped to the device cable to provide strain relief. A steel enclosure houses the electronic components while the laptop displays and records the probe contact state
Histologic Evaluation
A subspecialist pathologist (A.K.B.) with 29 years of experience reviewed the biopsy specimens while blinded to SWE data and clinical information. Fibrosis was staged using the METAVIR system on a five-point ordinal scale ranging from 0 to 4: F0, absent; F1, enlarged fibrotic portal tract; F2, few portal-portal septa but intact architecture; F3, many septa with architectural distortion but no obvious cirrhosis; and F4, cirrhosis (Bedossa and Poynard 1996).
Statistical Analysis
For each SWE method, the median value of 10 acquisitions was analyzed. Descriptive statistics were shown as mean ± standard deviation (SD) or percentages as appropriate. The one-way analysis of variance (ANOVA) test was used to compare mean SWE values obtained by ARFI or 2D-SWE at different depths, with different pre-load forces and at different distances from the central axis of the transducer. Spearman correlation of SWE values of both ARFI and 2D-SWE and fibrosis stage was calculated and the area under the receiver operating characteristic curve (AUROC) of both ARFI and 2D-SWE to differentiate ≥F2 fibrosis from < F2 stages was computed. Comparisons of AUROCs were performed according to the DeLong method (DeLong et al. 1988). Statistical analyses were performed with SPSS Version 23 (SPSS Inc., Chicago, IL, USA). AUROC comparisons were performed with MedCalc version 12.7.0.0 (MedCalc Software, Ostend, Belgium). P<0.05 was considered statistically significant.
RESULTS
Patients
A total of 20 subjects were enrolled in the study (12 males, 8 females, mean age 54 years, range, 23–76 years). The biopsy-determined fibrosis stages of enrolled subjects comprised 13 subjects with <F2 fibrosis and 7 subjects with ≥F2 fibrosis (F0=4, F1=9, F2=3, F3=2, F4=2). The etiology of CLD was hepatitis C virus (HCV)=9, Nonalcoholic steatohepatitis=7, Nonalcoholic fatty liver=2, Autoimmune hepatitis=1, Primary Biliary Cirrhosis=1.
Ultrasound shear wave Elastography
Examples of ARFI and 2D-SWE measurements are shown in Figure 2 and Figure 3. The mean SWE value at each fibrosis stage, measured by each system, at each measurement depth, with each preload force and at each distance from the central axis of the transducer are presented in Table 1–3.
Fig.2.
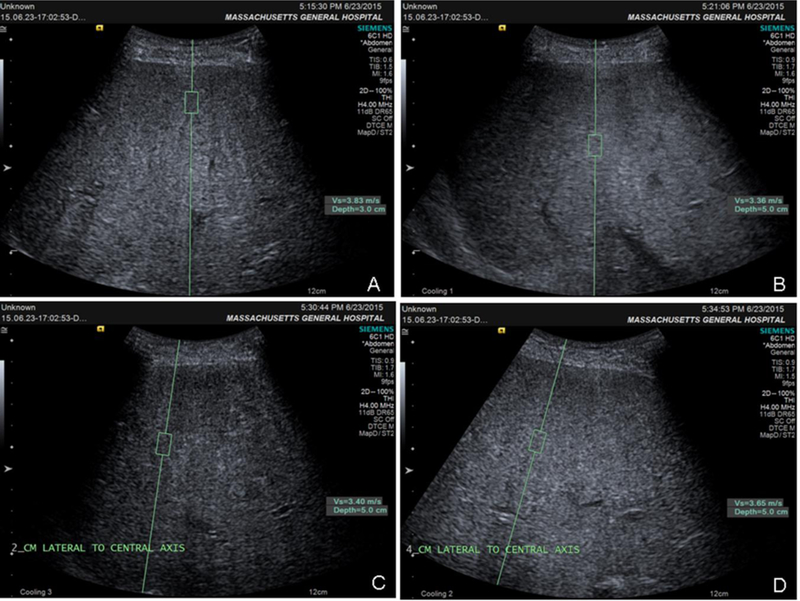
ARFI images of one patient with F4 fibrosis (METAVIR): A, depth=3 cm; B, depth=5 cm; C, distance off-axis=2 cm; D, distance off-axis=4 cm
Fig.3.

D-SWE images of one patient with F4 fibrosis (METAVIR): A, depth=3 cm; B, depth=5 cm; C, distance off-axis=2 cm; D, distance off-axis=4 cm
Table 1.
Mean SWS of the median value of 10 measurements of each patient at different measurement depths for each stages of fibrosis
| Fibrosis | Cases | TE (m/s) (mean±SD) |
Depths |
|||||
|---|---|---|---|---|---|---|---|---|
| ARFI (m/s) | 2D-SWE (m/s) | |||||||
| 3cm (mean±SD) |
5cm (mean±SD) |
7cm (mean±SD) |
3cm (mean±SD) |
5cm (mean±SD) |
7cm (mean±SD) |
|||
| 0 | 4 | 1.29±0.31 | 2.86±0.93 | 1.57±1.09 | 1.33±0.85 | 4.04±1.87 | 2.33±1.09 | 1.33±0.66 |
| 1 | 9 | 1.31±0.31 | 1.86±1.06 | 1.13±0.18 | 1.10±0.18 | 1.72±0.33 | 1.67±0.35 | 2.17±0.57 |
| 2 | 3 | 1.42±0.14 | 2.29±1.28 | 1.27±0.18 | 1.70±0.42 | 2.32±1.10 | 2.92±1.86 | 2.50±0.45 |
| 3 | 2 | 2.30±0.20 | 3.98±0.24 | 1.83±0.25 | 2.30±0.82 | 3.70±0.20 | 2.73±0.83 | 2.45±0.05 |
| 4 | 2 | 3.48±1.69 | 3.28±0.51 | 3.09±0.45 | 2.88±0.04 | 2.78±0.53 | 2.88±0.58 | 3.25±0.85 |
SD: standard deviation
TE: Transient Elastography
ARFI: acoustic radiation force impulse
2D-SWE: two-dimensional shear-wave elastography
Table 3.
Mean SWS of the median value of 10 measurements of each patient at different distances from the central axis of the transducer for each stages of fibrosis
| Fibrosis | Cases | Lateral to central axis (depth of 5cm) |
|||||
|---|---|---|---|---|---|---|---|
| ARFI (m/s) | 2D-SWE (m/s) | ||||||
| 0cm (mean±SD) |
2cm (mean±SD) |
4cm (mean±SD) |
0cm (mean±SD) |
2cm (mean±SD) |
4cm (mean±SD) |
||
| 0 | 4 | 1.57±1.09 | 1.12±0.18 | 1.41±0.50 | 2.33±1.09 | 1.94±0.66 | 2.23±0.35 |
| 1 | 9 | 1.13±0.18 | 1.26±0.41 | 1.70±0.80 | 1.67±0.35 | 1.90±0.38 | 1.95±0.31 |
| 2 | 3 | 1.27±0.18 | 1.25±0.25 | 1.24±0.38 | 2.92±1.86 | 2.32±0.91 | 2.25±0.49 |
| 3 | 2 | 1.83±0.25 | 2.43±0.94 | 2.71±0.83 | 2.73±0.83 | 2.28±0.33 | 2.70±0.80 |
| 4 | 2 | 3.09±0.45 | 3.02±0.39 | 2.99±0.50 | 2.88±0.58 | 3.00±0.45 | 3.38±0.68 |
SD: standard deviation
ARFI: acoustic radiation force impulse
2D-SWE: two-dimensional shear-wave elastography
TE values showed moderate correlation with fibrosis stage (r = 0.58, P=0.009), and moderate accuracy for detecting significant fibrosis (F≥2) (AUROC =0.88) (Table 4 and Figure 4)
Table 4.
AUROC for the predictive value for significant fibrosis (F≥2 METAVIR) of TE and association between TE and fibrosis stage
| Test result variable |
Cut-off(m/s) | Sensitivity | Specificity | Area(95%CI) | SE | Asymptotic Sig. | Spearman’s | |
|---|---|---|---|---|---|---|---|---|
| r | P | |||||||
| TE | 1.42 | 0.86 | 0.77 | 0.88(0.73–1.00) | 0.078 | 0.006* | 0.60 | 0.005 |
AUROC is area under the receiver operating characteristic curve
SE: standard error
Asymptotic Sig: asymptotic significant
TE: Transient Elastography
Fig.4.

AUROC for the predictive value of TE and ARFI performed at different depths for the presence of significant fibrosis (F≥2 METAVIR): TE and ARFI were all obtained along the central axis of the transducer, ARFI3cm, ARFI5cm and ARFI7cm were measurements made at the depth of 3 cm, 5 cm and 7 cm from the skin, respectively
Variation with Depth
The one-way ANOVA test showed a significant difference of ARFI SWS value across the three different depths (P=0.003). However, a significant ARFI difference was shown between 3 cm vs. 5 cm (P=0.002) and 3 cm vs. 7 cm (P=0.003), but not between 5 cm vs. 7 cm (P=0.926). Our study showed a significant correlation between ARFI measurements (at 5 cm and 7 cm depths from the skin) and fibrosis stage (r=0.54, and r=0.67, respectively) (P<0.05), but no correlation was found at a 3cm depth from the skin (r=0.19, P=0.425). The AUROCs of ARFI for distinguishing significant fibrosis (F≥2) at depths of 3 cm, 5 cm, and 7 cm demonstrated moderate to high diagnostic performance (0.70, 0.85 and 0.92), but no significant differences were found among them (P=0.353 for 3 cm vs. 5 cm, P=0.064 for 3 cm vs. 7 cm, and P=0.240 for 5 cm vs. 7 cm). (Table 5 and Figure 4).
Table 5.
Results for ARFI and 2D-SWE at different measurement depths
| Test result variable |
AUROC | Spearman’s | ANOVA | |||||||
|---|---|---|---|---|---|---|---|---|---|---|
| Cut-off (m/s) | Sensitivity | Specificity | Area(95%CI) | SE | Asymptotic Sig. | r | p | p | ||
| ARFI | 3cm | 2.57 | 0.71 | 0.69 | 0.70(0.46–0.95) | 0.126 | 0.143 | 0.19 | 0.425 | 0.003 |
| 5cm | 1.51 | 0.71 | 0.92 | 0.85(0.67–1.00) | 0.090 | 0.013* | 0.54 | 0.014* | ||
| 7cm | 1.46 | 0.88 | 0.92 | 0.92(0.80–1.00) | 0.061 | 0.002* | 0.67 | 0.001* | ||
| 2D-SWE | 3cm | 2.18 | 0.71 | 0.69 | 0.61(0.34–0.89) | 0.140 | 0.428 | −0.03 | 0.894 | 0.482 |
| 5cm | 1.68 | 0.86 | 0.69 | 0.76(0.55–0.98) | 0.111 | 0.057 | 0.31 | 0.182 | ||
| 7cm | 2.28 | 0.86 | 0.77 | 0.82(0.63–1.00) | 0.097 | 0.022* | 0.62 | 0.004* | ||
AUROC is area under the receiver operating characteristic curve for predictive values for significant fibrosis (F≥2 METAVIR)
SE: standard error
Asymptotic Sig: asymptotic significant
ARFI: acoustic radiation force impulse
2D-SWE: two-dimensional shear-wave elastography
The one-way ANOVA test showed no significant difference of 2D-SWE SWS value among different depths (P=0.482). 2D-SWE measurements at 7 cm under the skin showed a significant correlation with fibrosis stages (r=0.62, P=0.004), and no correlation was found at the depths of 3 cm or 5 cm (r=−0.03, and 0.31) (P>0.05). The AUROCs of 2D-SWE for distinguishing significant fibrosis (F≥2) at 3 cm, 5 cm and 7 cm depths showed mild to moderate diagnostic performance (0.61, 0.76, and 0.82), but no significant differences were found among them (P=0.076 for 3 cm vs. 5 cm, P=0.245 for 3 cm vs. 7 cm, and P=0.701 for 5 cm vs. 7 cm). (Table 5, Figure 5).
Fig.5.

AUROC for the predictive value of TE and 2D-SWE performed at different depths for the presence of significant fibrosis (F≥2 METAVIR): TE and 2D-SWE measurements were all obtained with variable pre-load force and along the central axis of the transducer, SWE3cm, SWE5cm and SWE7cm were measurements made at the depth of 3 cm, 5 cm and 7 cm form the skin, respectively
The depths from liver capsule to measurement points were also measured, median (interquartile range, IQR) value were 1.17 (0.68–1.46) cm, 3.04 (2.64–3.53) cm and 5.12 (4.63–5.55) cm for depths at 3cm, 5 cm and 7 cm from skin respectively.
Pre-load force
The one-way ANOVA test did not show a significant ARFI SWS value difference between the different pre-load forces (P=0.131). ARFI measurements with variable (unmonitored, “conventional” technique) and 10 N pre-load force demonstrated significant correlation with fibrosis stage (r=0.54 and r=0.46, respectively) (P<0.05), while measurements with pre-load force of 4 N and 7 N had no correlation with fibrosis stage (r=0.19 and r=0.24, P>0.05). The AUROCs of ARFI for distinguishing significant fibrosis (F≥2) with variable, 4 N, 7 N, and 10 N pre-load force were: 0.85, 0.70, 0.71, and 0.78, but no significant difference was detected between these applied forces (P=0.313 for variable vs. 4 N, P=0.109 for variable vs. 7 N, P=0.313 for variable vs. 10 N, P=0.933 for 4 N vs. 7 N, P=0.687 for 4 N vs. 10 N, and P=0.476 for 7 N vs. 10 N) (Table 6, Figure 6).
Table 6.
Results for ARFI and 2D-SWE with different pre-load forces
| AUROC | Spearman’s | ANOVA | ||||||||
|---|---|---|---|---|---|---|---|---|---|---|
| Test result variable | Cut-off(m/s) | Sensitivity | Specificity | Area(95%CI) | SE | Asymptotic Sig. | r | p | p | |
| ARFI | variable | 1.50 | 0.71 | 0.92 | 0.85(0.67–1.00) | 0.090 | 0.013* | 0.54 | 0.014* | 0.131 |
| 4N | 1.51 | 0.88 | 0.54 | 0.70(0.47–0.93) | 0.117 | 0.143 | 0.19 | 0.425 | ||
| 7N | 1.39 | 0.71 | 0.69 | 0.71(0.48–0.95) | 0.121 | 0.122 | 0.24 | 0.309 | ||
| 10N | 1.475 | 0.71 | 0.85 | 0.78(0.53–1.00) | 0.123 | 0.048* | 0.46 | 0.043* | ||
| 2D-SWE | variable | 1.68 | 0.86 | 0.69 | 0.76(0.55–0.98) | 0.111 | 0.057 | 0.31 | 0.182 | 0.922 |
| 4N | 1.95 | 0.71 | 0.69 | 0.71(0.45–0.97) | 0.132 | 0.132 | 0.26 | 0.266 | ||
| 7N | 1.63 | 0.84 | 0.69 | 0.76(0.53–0.98) | 0.115 | 0.063 | 0.38 | 0.099* | ||
| 10N | 1.85 | 0.71 | 0.69 | 0.74(0.50–0.97) | 0.120 | 0.088 | 0.36 | 0.121 | ||
AUROC is area under the receiver operating characteristic curve for predictive values for significant fibrosis (F≥2 METAVIR)
SE: standard error
Asymptotic Sig: asymptotic significant
ARFI: acoustic radiation force impulse
2D-SWE: two-dimensional shear-wave elastography
Fig.6.
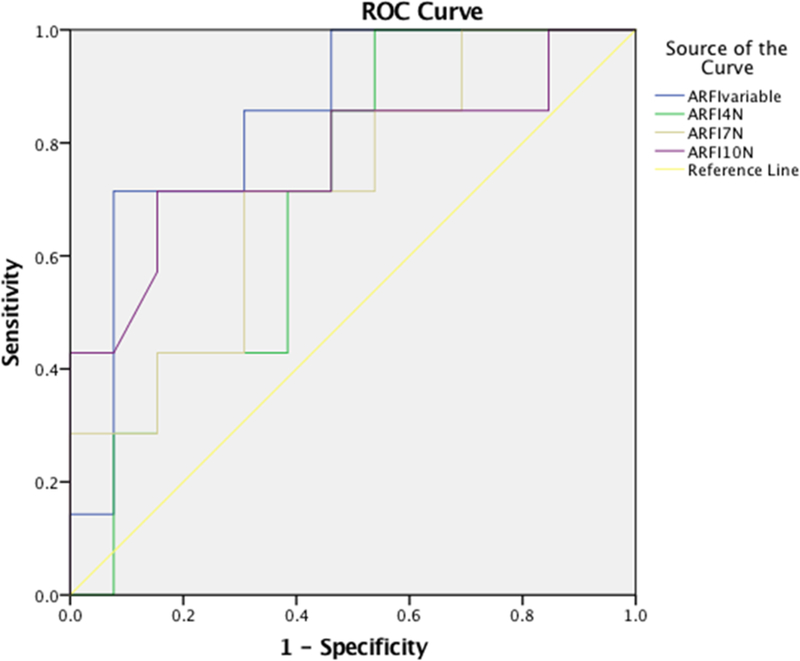
AUROC for the predictive value of ARFI performed with different pre-load forces for the presence of significant fibrosis (F≥2 METAVIR): ARFI were all obtained at a depth of 5 cm from the skin and along the central axis of the transducer, ARFIvariable, ARFI4N, ARFI7N and ARFI10N were measurements made with variable, 4 N, 7 N and 10 N pre-load force, respectively.
The one-way ANOVA test did not detect a significant difference of 2D-SWE SWS value across different applied pre-load forces (P=0.922). No correlation was shown between 2D-SWE SWS value and pre-load force (variable: r=0.31, 4 N: r=0.26, 7 N: r=0.38, or 10 N: r=0.36). The AUROCs of 2D-SWE measurements for distinguishing significant fibrosis (F≥2) with pre-load forces of variable, 4 N, 7 N, and 10 N showed moderate diagnostic performance (0.76, 0.71, 0.76 and 0.74, respectively), but no significant difference was detected among them (P=0.515 for variable vs. 4 N, P=0.930 for variable vs. 7 N, P=0.676 for variable vs. 10 N, P=0.427 for 4 N vs. 7 N, P=0.645 for 4 N vs. 10 N and P=0.424 for 7 N vs. 10 N) (Table 6, Figure 7).
Fig.7.
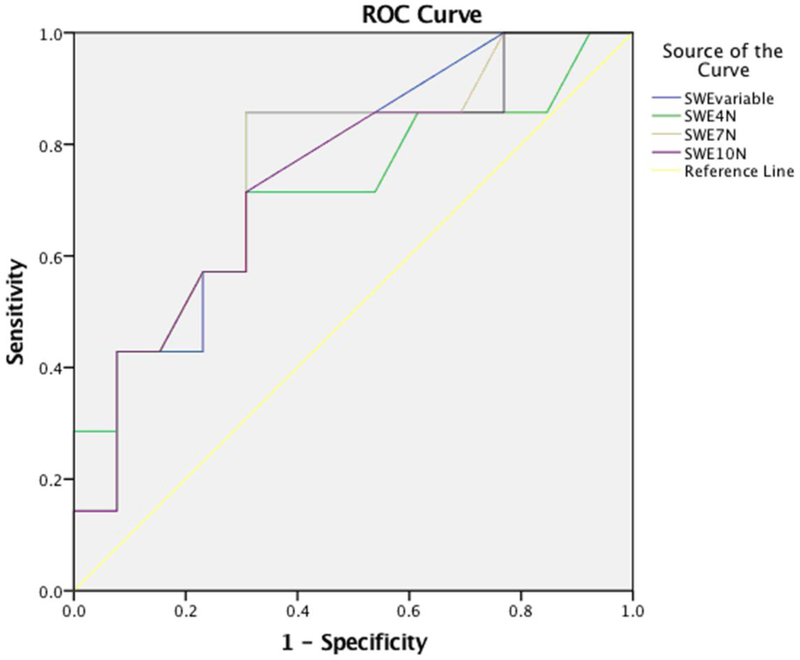
AUROC for the predictive value of 2D-SWE performed with different preload forces for the presence of significant fibrosis (F≥2 METAVIR): 2D-SWE were all obtained at a depth of 5 cm from the skin and along the central axis of the transducer, SWEvariable, SWE4N, SWE7N and SWE10N were measurements made with variable, 4 N, 7 N and 10 N preload force, respectively.
Distance from the central axis of the transducer
The one-way ANOVA test did not detect a significant difference of ARFI SWS value between different distances from the central axis (P=0.442). ARFI measurements at 0 cm and 2 cm from the central axis of the transducer showed significant correlation with fibrosis stages (r=0.54 and r=0.65, P<0.05), but no correlation was found when ARFI was measured at 4 cm from the central axis (r=0.38, P=0.100). The AUROCs of ARFI measurements at 0 cm, 2 cm and 4 cm off-axis for distinguishing significant fibrosis (F≥2) were 0.85, 0.80 and 0.66, respectively, and no significant differences were detected between them (P=0.708 for 0 cm vs. 2 cm, P=0.145 for 0 cm vs. 4 cm and P=0.054 for 2 cm vs. 4cm) (Table 7, Figure 8).
Table 7.
Results for ARFI and 2D-SWE at different distance from the central axis
| Test result variable |
AUROC | Spearman’s | ANOVA | |||||||
|---|---|---|---|---|---|---|---|---|---|---|
| Cut-off (m/s) | Sensitivity | Specificity | Area (95%CI) | SE | Asymptotic Sig. | r | p | p | ||
| ARFI | 0cm | 1.50 | 0.71 | 0.92 | 0.85(0.67–1.00) | 0.090 | 0.013* | 0.54 | 0.014* | 0.442 |
| 2cm | 1.42 | 0.71 | 0.92 | 0.80(0.56–1.00) | 0.126 | 0.029* | 0.55 | 0.012* | ||
| 4cm | 1.67 | 0.71 | 0.69 | 0.66(0.38–0.94) | 0.142 | 0.251 | 0.38 | 0.100 | ||
| 2D-SWE | 0cm | 1.68 | 0.86 | 0.69 | 0.76(0.557–0.98) | 0.111 | 0.057 | 0.31 | 0.182 | 0.850 |
| 2cm | 2..48 | 0.57 | 0.85 | 0.73(0.48–0.97) | 0.125 | 0.104 | 0.37 | 0.104 | ||
| 4cm | 1.88 | 1.00 | 0.46 | 0.76(0.53–0.99) | 0.119 | 0.063 | 0.34 | 0.148 | ||
AUROC is area under the receiver operating characteristic curve for predictive values for significant fibrosis (F≥2 METAVIR)
SE: standard error
Asymptotic Sig: asymptotic significant
ARFI: acoustic radiation force impulse
2D-SWE: two-dimensional shear-wave elastography
Fig.8.

AUROC for the predictive value of ARFI performed at different distances from the central axis of the transducer for the presence of significant fibrosis (F≥2 METAVIR): ARFI were all obtained at a depth of 5 cm from the skin and with variable preload force, ARFIcen0cm, ARFIcen2cm, ARFIcen4cm were measurements made at 0 cm, 2 cm and 4 cm from the central axis of the transducer, respectively.
The one-way ANOVA test did not detect a significant difference between 2D-SWE SWS value measured at different distances to the central axis (P=0.850). 2D-SWE measurements at 0 cm, 2 cm and 4 cm from the central axis showed no significant correlation with fibrosis stage (r=0.31, r=0.37, and r=0.34) (P >0.05). The AUROCs for distinguishing F≥2 fibrosis at 0 cm, 2 cm and 4 cm off-axis were 0.76, 0.73 and 0.76, and no significant differences were detected between them (P=0.675 for 0 cm vs. 2 cm, P=0.952 for 0 cm vs. 4 cm and P=0.702 for 2 cm vs. 4 cm) (Table 7, Fig. 9).
Fig.9.

AUROC for the predictive value of 2D-SWE performed at different distances from the central axis of the transducer for the presence of significant fibrosis (F≥2 METAVIR): 2D-SWE were all made at depth of 5 cm from the skin and with variable preload force, SWEcen0cm, SWEcen2cm and SWEcen4cm were measurements made at 0 cm, 2 cm and 4 cm from the central axis of the transducer, respectively.
The AUROCs of TE, ARFI, and 2D-SWE to distinguish F≥2, which were all measured at the depth of 7 cm and with 0 cm off-axis, were compared and no significant difference was detected between them (P=0.575 for TE vs. ARFI, P=0.570 for TE vs. 2D-SWE, and P=0.376 for ARFI vs. 2D-SWE). The relation between ARFI (at depth of 7cm from skin), 2D-SWE (at depth of 7cm from skin) and TE value and fibrosis stage are depicted in Fig. 10.
Fig. 10.

Relation between ARFI (at depth of 7cm form skin), 2D-SWE (at depth of 7cm form skin) and TE value and fibrosis stage: ARFI and 2D-SWE were measurements made at 7cm form skin.
DISCUSSION
UE has shown high diagnostic accuracy for cirrhosis (F=4) and intermediate accuracy for significant fibrosis (F≥2) (Feng et al. 2016; Friedrich-Rust et al. 2012). However, variations across manufacturers and techniques limit its utility in clinical practice. In this study, we assessed the diagnostic accuracy of SWE for discrimination of significant fibrosis under varying acquisition conditions (ROI depth, pre-load force, and ROI distance from the central transducer axis) using different systems (Fibroscan, Siemens, SuperSonic Imagine).
Existing literature (D’Onofrio et al. 2010; Kaminuma et al. 2011)(Sporea et al. 2010) has shown that SWE assessment of liver stiffness using ARFI varies as a function of depth. One study (Sporea et al. 2011) showed that ARFI measurements made at 1–2 cm and 2–3 cm under the liver capsule had better diagnostic performance than that at 0–1cm under the liver capsule. In our study, the ARFI SWS value showed significant differences among different measurement depths. The difference between ARFI SWS values obtained at 3 cm from skin and those obtained 5 and 7 cm deep to the skin is likely due to measurement close to the liver capsule. ARFI measurements at 5 cm and 7 cm depths from the skin significantly correlated with fibrosis stages. No significant difference was detected in 2D-SWE SWS value with depth by ANOVA test. However, the correlation coefficient of fibrosis stages with 2D-SWE SWS was higher at 7 cm compared to that at 3 cm and 5 cm. The difference in correlation may imply that the measurements at different depths are likely different, but not different sufficiently to be shown by ANOVA. Regarding the diagnostic performance for distinguishing significant fibrosis, no significant difference of AUROCs were found amongst different depth though AUROCs of both ARFI and 2D-SWE at a depth of 7 cm from the skin were slightly higher than those at depth of 3 cm and 5 cm. The Society of Radiologists in Ultrasound (Barr et al. 2015) recommended 4–5 cm depth from the skin for ARFI measurement. We did not detect a difference for both ARFI and 2D-SWE AUROC values at 7cm depth from skin compared with those observed at 5 cm depth from skin. These are interesting results, since there is little data on SWE conducted at a depth of 7 cm or deeper. 45% (9/20) of our population were F=1, and 65% were F<2. Diagnostic accuracy at deeper depth in F<2 patients may be better than in others. Recent technical advances in SWE may have resulted in improvement of US measurement at greater depths. It is possible that the failure to detect any difference in accuracy at greater depth is related to the predominance of early fibrosis stages in our sample. Alternatively, small sample size may play a role. Larger validation studies with more subjects with advanced fibrosis are needed before any firm conclusions can be drawn.
Pre-load force during elastography measurement is known to induce tissue deformation, resulting in alteration in tissue stiffness estimates. This potential confounding factor has been reported in several studies of superficial soft tissue, including phantoms (Imaizumi et al. 2014), salivary glands (Mantsopoulos et al. 2015), and breast (Barr and Zhang 2012). To date, standardized techniques for controlling pre-load force have not been implemented on commercially available SWE equipment, and there is little data concerning the effect of pre-load on liver SWE measurements when using conventional technique. In this study, we performed ARFI and 2D-SWE measurements in the liver with unmonitored conventional technique, and 4 N, 7 N and 10 N applied pre-load forces using a custom-developed preload measurement device (Gilbertson 2014; Gilbertson and Anthony 2013). Our results showed that pre-load force variation made no significant difference in SWE estimates when performing SWE via an intercostal approach. This is likely because the ribs protect the liver from the overlying pre-load force.
To the best of our knowledge, there is no study investigating SWE measurement variation caused by the distance off the transducer axis. Our results show ARFI measurement at 0 cm and 2 cm off-axis had better correlation with fibrosis stage than that at 4 cm off-axis. However, this difference did not result in a detectable difference in the AUROCs for distinguishing significant fibrosis (F≥2) at different distances from the central axis of the transducer. ARFI-induced shear waves are launched in both directions but only observed and measured in one direction, and shear wave travel time is estimated via the imaging beam. In the World Federation for Ultrasound in Medicine and Biology (WFUMB) Guideline, the ROI of point shear wave is suggested to be placed perpendicularly to the center of the ultrasound beam, as the angle of insonation may influence the result to some extent (Ferraioli et al. 2015). According to our results, off-axis distance may influence ARFI measurements, but we did not detect a significant difference in diagnostic performance. Our findings suggest placement of the ROI along the axis of the transducer is ideal, but minor variation of < 2 cm is likely also acceptable. The ROI of ARFI is a square of 1×0.5cm, and it is a circle of 1cm in diameter for 2D-SWE, and the differences of ROIs may be a variation recourse of the off-axis SWE measurements in the two systems.
A number of studies have compared the diagnostic performance of several SWE techniques on liver fibrosis staging and found varying results. To diagnose ≥F2 fibrosis, some studies found similar accuracy for ARFI and 2D-SWE (Sporea et al. 2013), others suggested 2D-SWE was superior to ARFI (Belei et al. 2016), and TE was found to be comparable to ARFI (Chung et al. 2013). Our study compared AUROCs of several techniques (TE, ARFI, 2D-SWE) in diagnosing fibrosis ≥F2 under the same acquisition parameters (depth at 7 cm, variable preload force, along axis of transducer), and demonstrated similar diagnostic performance under varying acquisition parameters. This finding was consistent with Sporea et al. (2013) and Chung et al. (2013)’s result, but not with Belei et al. (2016).
There are several limitations in this pilot study: (1) Small sample size limited our ability to detect differences. Further evidence is required prior to recommending a deeper measurement location than is presently standard practice. (2) Variable CLD etiology. It has been reported that optimal cut-off values for diagnosis of liver fibrosis ≥F2 is not only system dependent but also disease etiology dependent (Ferraioli et al. 2015). We did not control for disease etiology when evaluating the effect of different potential measurement accuracy confounders. (3) The depth of 3cm from skin may be not optimal for SWE measurement, since the skin-capsule depths in this group are all less than 2cm. (4) A single pathologist reviewed the biopsy specimens for this study to mitigate interobserver variability. Known variability between pathologists could therefore limit generalizability of the conclusions of this study. However, the pathology reader was highly experienced and a member of multi-pathologist review panels for large hepatitis drug therapy trials, mitigating this potential source of error.
CONCLUSION
In this study, three potential contributing factors to SWE measurement variation were investigated. The study did not detect a significant effect for pre-load force variation and distance from the central axis of the transducer on diagnostic accuracy. Measurement depth was identified as a potential influencing factor for ARFI, but not for 2D-SWE. Both ARFI and 2D-SWE at a 7cm depth along the central axis had good diagnostic performance for diagnosing significant fibrosis (F≥2). This finding is unexpected and may be the spurious result of small sample size or represent a true finding of presently unknown etiology. Further investigation of this finding will likely be of interest.
Table 2.
Mean SWS of the median value of 10 measurements of each patient with different pre-load transducer force for each stages of fibrosis
| Fibrosis | Cases | Pre-load forces (depth of 5cm) |
|||||||
|---|---|---|---|---|---|---|---|---|---|
| ARFI (m/s) | 2D-SWE (m/s) | ||||||||
| Variable (mean±SD) |
4N (mean±SD) |
7N (mean±SD) |
10N (mean±SD) |
Variable (mean±SD) |
4N (mean±SD) |
7N (mean±SD) |
10N (mean±SD) |
||
| 0 | 4 | 1.57±1.09 | 2.49±0.85 | 2.20±0.99 | 1.35±0.47 | 2.33±1.09 | 2.45±0.85 | 2.48±1.61 | 2.93±2.18 |
| 1 | 9 | 1.13±0.18 | 1.58±0.87 | 1.16±0.23 | 1.13±0.20 | 1.67±0.35 | 1.77±0.31 | 1.66±0.29 | 1.71±0.30 |
| 2 | 3 | 1.27±0.18 | 2.08±0.76 | 1.28±0.19 | 1.22±0.28 | 2.92±1.86 | 2.40±1.21 | 2.92±1.97 | 3.22±2.36 |
| 3 | 2 | 1.83±0.25 | 2.60±0.92 | 2.52±1.02 | 2.49±1.01 | 2.73±0.83 | 2.65±0.65 | 2.78±0.88 | 3.08±1.08 |
| 4 | 2 | 3.09±0.45 | 3.00±0.33 | 3.05±0.72 | 2.83±0.63 | 2.88±0.58 | 2.95±0.55 | 3.25±1.00 | 3.03±0.73 |
SD: standard deviation
variable: unmonitored, “conventional” technique
N: newton
ARFI: acoustic radiation force impulse
2D-SWE: two-dimensional shear-wave elastography
Acknowledgements
This work was supported by the NIBIB of the National Institutes of Health under award numbers HHSN268201300071 C and K23 EB020710. The authors are solely responsible for the content and the work does not represent the official views of the National Institutes of Health. The authors wish to acknowledge Xu Huang for statistics analyzing.
Footnotes
Publisher's Disclaimer: This is a PDF file of an unedited manuscript that has been accepted for publication. As a service to our customers we are providing this early version of the manuscript. The manuscript will undergo copyediting, typesetting, and review of the resulting proof before it is published in its final citable form. Please note that during the production process errors may be discovered which could affect the content, and all legal disclaimers that apply to the journal pertain.
References
- Actis GC, Olivero A, Lagget M, Pellicano R, Smedile A, Rizzetto M. The practice of percutaneous liver biopsy in a gastrohepatology day hospital: a retrospective study on 835 biopsies. Dig Dis Sci 2007; 52:2576–9. [DOI] [PubMed] [Google Scholar]
- Barr RG, Ferraioli G, Palmeri ML, Goodman ZD, Garcia-Tsao G, Rubin J, Garra B, Myers RP, Wilson SR, Rubens D, Levine D. Elastography Assessment of Liver Fibrosis: Society of Radiologists in Ultrasound Consensus Conference Statement. Radiology 2015; 276:845–61. [DOI] [PubMed] [Google Scholar]
- Barr RG, Zhang Z. Effects of precompression on elasticity imaging of the breast: development of a clinically useful semiquantitative method of precompression assessment. J Ultrasound Med 2012; 31:895–902. [DOI] [PubMed] [Google Scholar]
- Bedossa P, Poynard T. An algorithm for the grading of activity in chronic hepatitis C. The METAVIR Cooperative Study Group. Hepatology 1996; 24:289–93. [DOI] [PubMed] [Google Scholar]
- Brunt EM. Nonalcoholic Fatty Liver Disease: Pros and Cons of Histologic Systems of Evaluation. Int J Mol Sci 2016; 17. [DOI] [PMC free article] [PubMed] [Google Scholar]
- Burt AD, Lackner C, Tiniakos DG. Diagnosis and Assessment of NAFLD: Definitions and Histopathological Classification. Semin Liver Dis 2015; 35:207–20. [DOI] [PubMed] [Google Scholar]
- Chin JL, Pavlides M, Moolla A, Ryan JD. Non-invasive Markers of Liver Fibrosis: Adjuncts or Alternatives to Liver Biopsy? Front Pharmacol 2016; 7:159. [DOI] [PMC free article] [PubMed] [Google Scholar]
- Chung JH, Ahn HS, Kim SG, Lee YN, Kim YS, Jeong SW, Jang JY, Lee SH, Kim HS, Kim BS. The usefulness of transient elastography, acoustic-radiation-force impulse elastography, and real-time elastography for the evaluation of liver fibrosis. Clin Mol Hepatol 2013; 19:156–64. [DOI] [PMC free article] [PubMed] [Google Scholar]
- Crespo G, Fernandez-Varo G, Marino Z, Casals G, Miquel R, Martinez SM, Gilabert R, Forns X, Jimenez W, Navasa M. ARFI, FibroScan, ELF, and their combinations in the assessment of liver fibrosis: a prospective study. J Hepatol 2012; 57:281–7. [DOI] [PubMed] [Google Scholar]
- D’Onofrio M, Gallotti A, Mucelli RP. Tissue quantification with acoustic radiation force impulse imaging: Measurement repeatability and normal values in the healthy liver. AJR Am J Roentgenol 2010; 195:132–6. [DOI] [PubMed] [Google Scholar]
- DeLong ER, DeLong DM, Clarke-Pearson DL. Comparing the areas under two or more correlated receiver operating characteristic curves: a nonparametric approach. Biometrics 1988; 44:837–45. [PubMed] [Google Scholar]
- Dhyani M, Anvari A, Samir AE. Ultrasound elastography: liver. Abdom Imaging 2015; 40:698–708. [DOI] [PMC free article] [PubMed] [Google Scholar]
- Dhyani M, Grajo JR, Bhan AK, Corey K, Chung R, Samir AE. Validation of Shear Wave Elastography Cutoff Values on the Supersonic Aixplorer for Practical Clinical Use in Liver Fibrosis Staging. Ultrasound Med Biol 2017; 43:1125–33. [DOI] [PMC free article] [PubMed] [Google Scholar]
- Dulai PS, Sirlin CB, Loomba R. MRI and MRE for non-invasive quantitative assessment of hepatic steatosis and fibrosis in NAFLD and NASH: Clinical trials to clinical practice. J Hepatol 2016; 65:1006–16. [DOI] [PMC free article] [PubMed] [Google Scholar]
- Feng JC, Li J, Wu XW, Peng XY. Diagnostic Accuracy of SuperSonic Shear Imaging for Staging of Liver Fibrosis: A Meta-analysis. J Ultrasound Med 2016; 35:329–39. [DOI] [PubMed] [Google Scholar]
- Ferraioli G, Filice C, Castera L, Choi BI, Sporea I, Wilson SR, Cosgrove D, Dietrich CF, Amy D, Bamber JC, Barr R, Chou YH, Ding H, Farrokh A, Friedrich-Rust M, Hall TJ, Nakashima K, Nightingale KR, Palmeri ML, Schafer F, Shiina T, Suzuki S, Kudo M. WFUMB guidelines and recommendations for clinical use of ultrasound elastography: Part 3: liver. Ultrasound Med Biol 2015; 41:1161–79. [DOI] [PubMed] [Google Scholar]
- Ferraioli G, Tinelli C, Dal Bello B, Zicchetti M, Filice G, Filice C, Liver Fibrosis Study G. Accuracy of real-time shear wave elastography for assessing liver fibrosis in chronic hepatitis C: a pilot study. Hepatology 2012; 56:2125–33. [DOI] [PubMed] [Google Scholar]
- Friedman SL, Bansal MB. Reversal of hepatic fibrosis -- fact or fantasy? Hepatology 2006; 43:S82–8. [DOI] [PubMed] [Google Scholar]
- Friedrich-Rust M, Nierhoff J, Lupsor M, Sporea I, Fierbinteanu-Braticevici C, Strobel D, Takahashi H, Yoneda M, Suda T, Zeuzem S, Herrmann E. Performance of Acoustic Radiation Force Impulse imaging for the staging of liver fibrosis: a pooled meta-analysis. J Viral Hepat 2012; 19:e212–9. [DOI] [PubMed] [Google Scholar]
- Gilbertson MW. 2014. Electromechanical systems to enhance the usability and diagnostic capabilities of ultrasound imaging. Department of Mechanical Engineering: Massachusetts Institute of Technology, 1–293. [Google Scholar]
- Gilbertson MW, Anthony BW. 2013. An ergonomic, instrumented ultrasound probe for 6-axis force/torque measurement. 5th Annual International Conference of the IEEE Engineering in Medicine and Biology Society (EMBC). Osaka, Japan, 140–3. [DOI] [PubMed] [Google Scholar]
- Imaizumi A, Sasaki Y, Sakamoto J, Kamio T, Nishikawa K, Otonari-Yamamoto M, Wako M. Effects of compression force on elasticity index and elasticity ratio in ultrasound elastography. Dentomaxillofac Radiol 2014; 43:20130392. [DOI] [PMC free article] [PubMed] [Google Scholar]
- Kaminuma C, Tsushima Y, Matsumoto N, Kurabayashi T, Taketomi-Takahashi A, Endo K. Reliable measurement procedure of virtual touch tissue quantification with acoustic radiation force impulse imaging. J Ultrasound Med 2011; 30:745–51. [DOI] [PubMed] [Google Scholar]
- Kaswala DH, Lai M, Afdhal NH. Fibrosis Assessment in Nonalcoholic Fatty Liver Disease (NAFLD) in 2016. Dig Dis Sci 2016; 61:1356–64. [DOI] [PubMed] [Google Scholar]
- Li C, Zhang C, Li J, Huo H, Song D. Diagnostic Accuracy of Real-Time Shear Wave Elastography for Staging of Liver Fibrosis: A Meta-Analysis. Medical Science Monitor 2016; 22:1349–59. [DOI] [PMC free article] [PubMed] [Google Scholar]
- Mantsopoulos K, Klintworth N, Iro H, Bozzato A. Applicability of shear wave elastography of the major salivary glands: values in healthy patients and effects of gender, smoking and pre-compression. Ultrasound Med Biol 2015; 41:2310–8. [DOI] [PubMed] [Google Scholar]
- Mokdad AA, Lopez AD, Shahraz S, Lozano R, Mokdad AH, Stanaway J, Murray CJ, Naghavi M. Liver cirrhosis mortality in 187 countries between 1980 and 2010: a systematic analysis. BMC Med 2014; 12:145. [DOI] [PMC free article] [PubMed] [Google Scholar]
- Murray CJ, Atkinson C, Bhalla K, Birbeck G, Burstein R, Chou D, Dellavalle R, Danaei G, Ezzati M, Fahimi A, Flaxman D, Foreman, Gabriel S, Gakidou E, Kassebaum N, Khatibzadeh S, Lim S, Lipshultz SE, London S, Lopez, MacIntyre MF, Mokdad AH, Moran A, Moran AE, Mozaffarian D, Murphy T, Naghavi M, Pope C, Roberts T, Salomon J, Schwebel DC, Shahraz S, Sleet DA, Murray, Abraham J, Ali MK, Atkinson C, Bartels DH, Bhalla K, Birbeck G, Burstein R, Chen H, Criqui MH, Dahodwala, Jarlais, Ding EL, Dorsey ER, Ebel BE, Ezzati M, Fahami, Flaxman S, Flaxman AD, Gonzalez-Medina D, Grant B, Hagan H, Hoffman H, Kassebaum N, Khatibzadeh S, Leasher JL, Lin J, Lipshultz SE, Lozano R, Lu Y, Mallinger L, McDermott MM, Micha R, Miller TR, Mokdad AA, Mokdad AH, Mozaffarian D, Naghavi M, Narayan KM, Omer SB, Pelizzari PM, Phillips D, Ranganathan D, Rivara FP, Roberts T, Sampson U, Sanman E, Sapkota A, Schwebel DC, Sharaz S, Shivakoti R, Singh GM, Singh D, Tavakkoli M, Towbin JA, Wilkinson JD, Zabetian A, Murray, Abraham J, Ali MK, Alvardo M, Atkinson C, Baddour LM, Benjamin EJ, Bhalla K, Birbeck G, Bolliger I, Burstein R, Carnahan E, Chou D, Chugh SS, Cohen A, Colson KE, Cooper LT, Couser W, Criqui MH, Dabhadkar KC, Dellavalle RP, Jarlais, Dicker D, Dorsey ER, Duber H, Ebel BE, Engell RE, Ezzati M, Felson DT, Finucane MM, Flaxman S, Flaxman AD, Fleming T, Foreman, Forouzanfar MH, Freedman G, Freeman MK, Gakidou E, Gillum RF, Gonzalez-Medina D, Gosselin R, Gutierrez HR, Hagan H, Havmoeller R, Hoffman H, Jacobsen KH, James SL, Jasrasaria R, Jayarman S, Johns N, Kassebaum N, Khatibzadeh S, Lan Q, Leasher JL, Lim S, Lipshultz SE, London S, Lopez, Lozano R, Lu Y, Mallinger L, Meltzer M, Mensah GA, Michaud C, Miller TR, Mock C, Moffitt TE, Mokdad AA, Mokdad AH, Moran A, Naghavi M, Narayan KM, Nelson RG, Olives C, Omer SB, Ortblad K, Ostro B, Pelizzari PM, Phillips D, Raju M, Razavi H, Ritz B, Roberts T, Sacco RL, Salomon J, Sampson U, Schwebel DC, Shahraz S, Shibuya K, Silberberg D, Singh JA, Steenland K, Taylor JA, Thurston GD, Vavilala MS, Vos T, Wagner GR, Weinstock MA, Weisskopf MG, Wulf S, Murray, Collaborators USBoD. The state of US health, 1990–2010: burden of diseases, injuries, and risk factors. JAMA 2013; 310:591–608. [DOI] [PMC free article] [PubMed] [Google Scholar]
- Parikh P, Ryan JD, Tsochatzis EA. Fibrosis assessment in patients with chronic hepatitis B virus (HBV) infection. Ann Transl Med 2017; 5:40. [DOI] [PMC free article] [PubMed] [Google Scholar]
- Pellicoro A, Ramachandran P, Iredale JP, Fallowfield JA. Liver fibrosis and repair: immune regulation of wound healing in a solid organ. Nat Rev Immunol 2014; 14:181–94. [DOI] [PubMed] [Google Scholar]
- Petitclerc L, Sebastiani G, Gilbert G, Cloutier G, Tang A. Liver fibrosis: Review of current imaging and MRI quantification techniques. J Magn Reson Imaging 2017; 45:1276–95. [DOI] [PubMed] [Google Scholar]
- Ravindran S, Hancox SH, Howlett DC. Liver biopsy: past, present and future. Br J Hosp Med (Lond) 2016; 77:90–5. [DOI] [PubMed] [Google Scholar]
- Rosenberg WMC, Voelker M, Thiel R, Becka M, Burt A, Schuppan D, Hubscher S, Roskams T, Pinzani M, Arthur MJP.Serum markers detect the presence of liver fibrosis: A cohort study. Gastroenterology 2004; 127:1704–13. [DOI] [PubMed] [Google Scholar]
- Samir AE, Dhyani M, Vij A, Bhan AK, Halpern EF, Mendez-Navarro J, Corey KE, Chung RT. Shear-wave elastography for the estimation of liver fibrosis in chronic liver disease: determining accuracy and ideal site for measurement. Radiology 2015; 274:888–96. [DOI] [PMC free article] [PubMed] [Google Scholar]
- Shiha G, Ibrahim A, Helmy A, Sarin SK, Omata M, Kumar A, Bernstien D, Maruyama H, Saraswat V, Chawla Y, Hamid S, Abbas Z, Bedossa P, Sakhuja P, Elmahatab M, Lim SG, Lesmana L, Sollano J, Jia JD, Abbas B, Omar A, Sharma B, Payawal D, Abdallah A, Serwah A, Hamed A, Elsayed A, AbdelMaqsod A, Hassanein T, Ihab A, H GH, Zein N, Kumar M. Asian-Pacific Association for the Study of the Liver (APASL) consensus guidelines on invasive and non-invasive assessment of hepatic fibrosis: a 2016 update. Hepatol Int 2017; 11:1–30. [DOI] [PubMed] [Google Scholar]
- Sigrist RMS, Liau J, Kaffas AE, Chammas MC, Willmann JK. Ultrasound Elastography: Review of Techniques and Clinical Applications. Theranostics 2017; 7:1303–29. [DOI] [PMC free article] [PubMed] [Google Scholar]
- Sporea I, Bota S, Jurchis A, Sirli R, Gradinaru-Tascau O, Popescu A, Ratiu I, Szilaski M. Acoustic radiation force impulse and supersonic shear imaging versus transient elastography for liver fibrosis assessment. Ultrasound Med Biol 2013; 39:1933–41. [DOI] [PubMed] [Google Scholar]
- Sporea I, Sirli RL, Deleanu A, Popescu A, Focsa M, Danila M, Tudora A. Acoustic radiation force impulse elastography as compared to transient elastography and liver biopsy in patients with chronic hepatopathies. Ultraschall Med 2011; 32 Suppl 1:S46–52. [DOI] [PubMed] [Google Scholar]
- Younossi ZM, Stepanova M, Afendy M, Fang Y, Younossi Y, Mir H, Srishord M. Changes in the prevalence of the most common causes of chronic liver diseases in the United States from 1988 to 2008. Clin Gastroenterol Hepatol 2011; 9:524–30 e1; quiz e60. [DOI] [PubMed] [Google Scholar]
- Yun MH, Seo YS, Kang HS, Lee KG, Kim JH, An H, Yim HJ, Keum B, Jeen YT, Lee HS, Chun HJ, Um SH, Kim CD, Ryu HS. The effect of the respiratory cycle on liver stiffness values as measured by transient elastography. J Viral Hepat 2011; 18:631–6. [DOI] [PubMed] [Google Scholar]