

Abstract
Currently there is critical need for the identification of reliable biomarkers to help guide clinical management of multiple sclerosis (MS) patients. We investigated the combined roles of Response Gene to Complement 32 (RGC-32), FasL, CDC2, AKT, and IL-21 as possible biomarkers of relapse and response to glatiramer acetate (GA) treatment in relapsing-remitting MS (RRMS) patients. Over the course of 2 years, a cohort of 15 GA-treated RRMS patients was clinically monitored and peripheral blood mononuclear cells (PBMCs) were collected at 0, 3, 6, and 12 months. Target gene mRNA expression was measured in patients’ isolated PBMCs by real-time qRT-PCR. Compared to stable MS patients, those with acute relapses exhibited decreased expression of RGC-32 (p<0.0001) and FasL (p<0.0001), increased expression of IL-21 (p=0.04), but no change in CDC2 or AKT. Compared to non-responders, responders to GA treatment showed increased expression of RGC-32 (p<0.0001) and FasL (p<0.0001), and decreased expression of IL-21 (p=0.02). Receiver operating characteristic (ROC) analysis was used to assess the predictive accuracy of each putative biomarker. The probability of accurately detecting relapse was 90% for RGC-32, 88% for FasL, and 75% for IL-21. The probability of accurately detecting response to GA was 85% for RGC-32, 90% for FasL, and 85% for IL-21. Our data suggest that RGC-32, FasL, and IL-21 could serve as potential biomarkers for the detection of MS relapse and response to GA therapy.
Keywords: RGC-32, Multiple Sclerosis, Glatiramer Acetate, Biomarker, FasL, IL-21
INTRODUCTION
Multiple sclerosis (MS) is an inflammatory-mediated demyelinating disease of the human central nervous system (CNS). The clinical disease course is variable, usually starting with reversible episodes of neurological disability followed by continuous and irreversible neurological decline (Trapp and Nave, 2008). A diverse interplay of immunological factors contributes to a characteristically variable pathology, phenotypic presentation, disease course, and prognosis (McFarland and Martin, 2007). Glatiramer acetate (GA) is one of the most common immunomodulatory therapies used to treat relapsing-remitting multiple sclerosis (RRMS) patients. Results from clinical trials have shown a reduction in the annualized relapse rate of about 29% with this agent (Johnson et al., 1995; Johnson et al., 1998). Unfortunately not all patients respond to treatment, and treatment failure may only be recognized after months or years of therapy. It would be of great value to determine patient responsiveness prior to the selection of a particular MS therapy, including GA. However, with the possible exception of magnetic resonance imaging (MRI), currently there are no markers reliably validated for widespread clinical use in predicting response to MS therapy despite the presence of numerous candidate markers in the serum and cerebrospinal fluid (Furby et al., 2010; Graber and Dhib-Jalbut, 2011; Housley et al. 2015). Thus identification of effective, accessible biomarkers of disease activity and response to treatment would have significant benefits in the clinical management of patients with MS and help prevent further disease progression.
We have identified RGC-32, a novel gene product induced by complement activation, and have demonstrated its activity primarily as a cell cycle regulator (Badea et al., 2002; Badea et al., 1998; Fosbrink et al., 2009). RGC-32 protein forms complexes with CDC2/cyclinB1 and enhances CDC2 kinase activity (Badea et al., 2002; Vlaicu et al., 2008). In addition RGC-32 binds to and modulates the activity of AKT (Fosbrink et al., 2009), and regulates the expression of FasL and interleukin-21 (IL-21) (Tegla et al., 2013). Thus, RGC-32 appears to be a regulator of critical kinases involved in cell cycle regulation and apoptosis. RGC-32 is expressed by CD3+ as well as CD4+ T-cells in peripheral blood mononuclear cells (PBMCs) and in brain tissue from relapsing-remitting MS patients (Tegla et al., 2013). Previous studies have shown significantly decreased RGC-32 and FasL mRNA expression as well as increased expression of IL-21 mRNA within the PBMCs of RRMS patients during acute relapse compared to remission (Tegla et al., 2013; Lopatinskaya et al., 2003). Thus, in this study we longitudinally investigated the expression of RGC-32, FasL, CDC2, AKT, and IL-21 mRNA in the PBMCs of RRMS patients over time in order to determine whether an association exists between the expression of these genes, clinical activity, and the response to treatment with glatiramer acetate (GA). Our data indicate that RGC-32, FasL, and IL-21, but not CDC2 or AKT, serum PBMC expression levels could serve as potential biomarker candidates in the detection of MS patient relapse and response to GA treatment.
MATERIALS AND METHODS
Patients and controls
We enrolled a total of 15 patients with RRMS. The patients were recruited from the University of Maryland Multiple Sclerosis Center. The mean age was 40 (range, 22–60), and consisted of 60% females (n=9) and 40% males (n=6). The criteria for inclusion of MS patients in the study were: (i) age 18 to 65 years; (ii) fulfillment of the McDonald criteria for definite MS (McDonald et al., 2001; Polman et al., 2005); (iii) relapsing-remitting course; (iv) having newly diagnosed MS, or MS not treated with currently used immunomodulatory drugs (interferon-β or glatiramer acetate) for 3 months prior to study entry; (v) no exacerbations in the 4 weeks before the study; (vi) no i.v. or p.o. steroids for 4 weeks prior to study enrollment; (vii) no treatment with Tysabri, Gilenya, mitoxantrone, cyclophosphamide, or any investigational drug during the past year; and (viii) a disability score of 0–5.5, as defined by the expanded disability status scale (EDSS) (Kurtzke, 1983). Exclusion criteria for MS patients were: (i) a history of autoimmune disorders, vascular disease, or active acute or chronic infections; (ii) use of antibiotics in the last 30 days; (iii) a history of intracranial or intraspinal tumor or metabolic myelopathy; or (iv) a history of alcohol or drug abuse.
All MS patients received 20 mg of glatiramer acetate (GA) injected subcutaneously every day for 2 years. During this period of 2 years, patients were clinically evaluated and peripheral blood samples were collected at 0, 3, 6, and 12 months at the time of their outpatient visits. Patients with symptoms suggestive of a clinical relapse called the University of Maryland Multiple Sclerosis Center. Clinical relapse was defined as substantial worsening of pre-existing symptoms or appearance of new neurological deficits in the absence of fever or infections lasting more than 24 h. An EDSS evaluation was completed at each visit. Clinical records, consultation reports, and inpatient records were reviewed by a neurologist (H.R., C.B. or W.R.) to ensure that the data obtained were complete. In the case of patients with relapse, the administration of 1g of Solu-Medrol i.v. for 3 days was used to treat the disease exacerbation. A prednisone taper was also used after i.v. Solu-Medrol in certain cases. In such cases, blood samples were obtained prior to Solu-Medrol treatment. Responders to GA treatment were defined as patients who exhibited 0 or no more than 1 relapse event during the 2 year span following the initiation of GA. Non-responders were defined as patients who exhibited 2 or more relapse events during the 2 year span following the initiation of GA. According to these criteria, the present cohort consisted of 11 responders (mean age 43, range 27–60; 55% female) and 4 non-responders (mean age 31, range 22–36; 75% female).
Collection of PBMCs, total RNA purification, and cDNA synthesis
PBMCs were collected using BD Vacutainer CPT tubes (Becton Dickinson, Franklin Lakes, NJ). The mononuclear cells were isolated from fresh blood as previously described (Tegla et al., 2013). RNA isolation was performed the same day, as previously described (Niculescu et al., 1997). Total RNA was purified using an RNeasy Mini Kit (Qiagen, Santa Clarita, CA) according to the manufacturer’s instructions. RNA (0.5 μg per sample) was mixed with RT buffer, dNTP, and oligo-dT random primers (Invitrogen). RNA was denatured by incubation at 65°C for 5 min. The reverse transcriptase (Promega) and RNase inhibitor (Invitrogen) were then added, and the reaction mixture was incubated at 37°C for 1 h to synthesize cDNA. The reaction was terminated by incubating the mixture at 95°C for 5 min.
Real-time quantitative PCR
Real-time PCR was performed using a StepOne real-time PCR system (Applied Biosystems, Foster City, CA). The primers for the genes investigated were designed and synthesized by IDT (Coralville, IA) (Table 1) and used in conjunction with LightCycler FastStart DNA Master SYBR Green I (Roche) along with sample cDNA according to the manufacturer’s protocol. As a negative control for each real-time PCR assay, the same reaction was performed in the absence of cDNA. For each gene, the cycle threshold (CT) values were determined in the exponential phase of the amplification plot and normalized to the mRNA expression of L13 ribosomal protein, a housekeeping gene. A standard curve was generated using serial dilutions of qPCR Human Reference Total cDNA (Clontech, Mountain View, CA), and the normalized mRNA value (NRV) was calculated according to the following formula for relative expression of target mRNA: NRV = (TarS/L13), where TarS represents the level of mRNA expression of the target gene, and L13 corresponds to that of the amplified L13 mRNA (Tegla et al., 2013).
Table 1.
Primers used for quantitative real-time PCR
| Gene symbol | Primers sequence | Product (bp) |
|---|---|---|
| RGC-32 | For: 5’-AGGAACAGCTTCAGCTTCAG-3’ | 152 |
| Rev: 5’-GCTAAAGTTTTGTCAAGATCAGCA-3’ | ||
| FasL | For: 5’-GCCCATTTAACAGGCAAGTC-3’ | 110 |
| Rev: 5’-ATCACAAGGCCACCCTTCTT-3’ | ||
| CDC2 | For: 5’-TTTTCAGAGCTTTGGGCACT-3’ | 100 |
| Rev: 5’-AGGCTTCCTGGTTTCCATTT-3’ | ||
| AKT1 | For: 5′‐ACGCCAAGGAGATCATGC-3′ | 185 |
| Rev: 5′‐CTCCATGCTGTCATCTTGGTC‐3′ | ||
| L13 | For: 5’-CGTGCGTCTGAAGCCTACA-3’ | 227 |
| Rev: 5’-GGAGTCCGTGGGTCTTGAG-3’ | ||
For, forward primer; Rev, reverse primer; Bp, base pairs; RGC-32, Response gene to complement 32; FasL, Fas ligand; CDC2, cell division control protein 2, L13, ribosomal protein L13. IL-21 primers were purchased from SABiosciences, cat# PPH01684A
Statistical analysis
Comparisons between groups were performed using a two-tailed t-test assuming unequal variances. P values <0.05 were considered significant. Pearson correlation analysis was conducted to examine the association between variables. Statistical analysis was performed using IBM SPSS Statistics software version 22 and GraphPad Prism software version 6. All values are shown as mean ± SEM and are representative of three experiments unless otherwise noted. Receiver operating characteristic (ROC) curve analysis was used to assess the predictive accuracy of each potential biomarker. The predictive probability of binary outcomes regarding clinical state and response to GA treatment was reported as a C-statistic or Area Under the Curve (AUC, represented as a percentage, with a perfect score being 100% predictability).
RESULTS
Expression of RGC-32, FasL, CDC2, AKT, and IL-21 mRNA in acute MS relapse
We first examined the expression of RGC-32 mRNA in unstimulated PBMCs in relation to disease activity. FasL and CDC2 mRNA expression were also investigated because RGC-32 is known to bind to and regulate CDC2, which in turn has a regulatory effect on FasL expression (Badea et al., 2002; Fosbrink et al., 2009; Torgler et al., 2004). In addition, IL-21 and AKT mRNA expression were investigated as previously described (Tegla et al., 2013). MS patient PBMC samples were categorized into those from stable periods in which no clinical activity was present and those from periods of relapse, in which clinical activity was present and had been detected by a neurologist. Target gene mRNA expression was measured in patients’ PBMCs using real-time qRT-PCR and expressed as a ratio to L13. Statistically significant lower levels of RGC-32 mRNA were found in MS patients with relapses compared to those who were clinically stable (p<0.0001) (Figure 1A). Patients with relapses also exhibited significantly lower levels of FasL mRNA compared to stable MS patients (p<0.0001) (Figure 1B). Levels of CDC2 and AKT mRNA in MS patients with relapses were similar to those in stable patients (Figure 1C, D). On the other hand, IL-21 mRNA expression was significantly higher in MS patients with relapses compared to stable MS patients (p=0.04) (Figure 1E). As shown in Figure 1F, RGC-32 and FasL mRNA expression levels were positively correlated within MS patients during relapses (r=0.90, p<0.0001). Furthermore, the mean EDSS score was significantly higher in patients with relapses compared to stable patients (p=0.002) (Figure 2A). However, the mean EDSS score was not significantly different between GA responders and non-responders overall (p=0.35) (Figure 2B).
Figure 1. Expression of RGC-32, FasL, CDC2, AKT, and IL-21 mRNA in stable MS patients and patients with acute relapses.
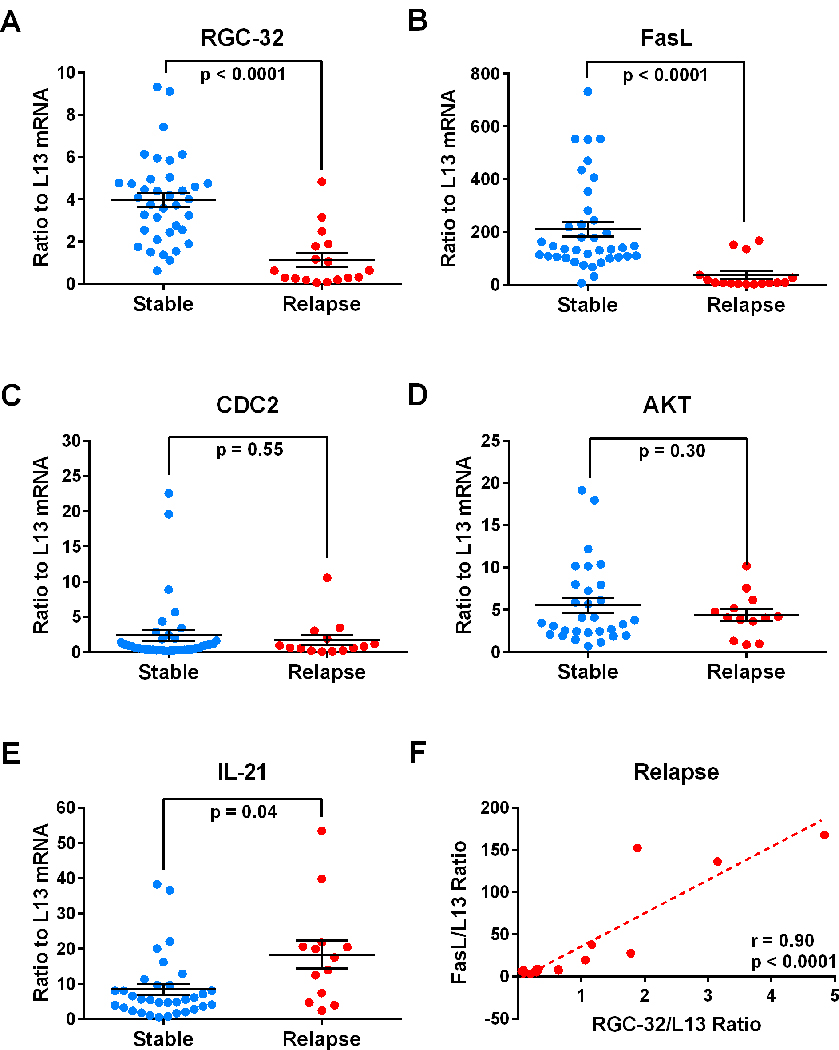
Target gene mRNA expression was measured in patients’ PBMCs using real-time qRT-PCR and expressed as a ratio to L13. A. Significantly lower levels of RGC-32 mRNA were found in patients with relapses compared to clinically stable patients (p<0.0001). B. Significantly lower levels of FasL mRNA were found in patients with relapses compared to clinically stable patients (p<0.0001). C and D. No statistically significant changes were observed in CDC2 or AKT mRNA. E. Significantly higher levels of IL-21 mRNA were found in patients with relapses compared to clinically stable patients (p=0.04). F. RGC-32 mRNA expression levels were correlated with those of FasL in patients during relapses (r=0.90, p<0.0001).
Figure 2. EDSS of MS patients by clinical state and response to GA.

EDSS was determined as described in Materials and Methods (Kurtzke, 1983). A. EDSS was significantly higher in patients with relapses compared to clinically stable patients (p=0.002). B. EDSS was not significantly changed in responders vs. non-responders to GA treatment over two years.
Expression of RGC-32, FasL, CDC2, AKT, and IL-21 mRNA in responders vs. non-responders to GA treatment
Since GA is an effective treatment for RRMS we investigated the relationship between RGC-32, FasL, CDC2, AKT, and IL-21 mRNA expression and responsiveness to treatment over time. Responders to GA treatment were defined as patients who exhibited 0 or no more than 1 relapse event during the 2 year span following the initiation of GA whereas non-responders exhibited 2 or more relapse events. Overall, responders to GA treatment showed significantly higher levels of RGC-32 (p<0.0001) and FasL (p<0.0001) (Figure 3A, B). No significant change was observed in CDC2 or AKT expression between responders and non-responders (Figure 3C, D). IL-21 mRNA levels were lower in responders to GA treatment compared to non-responders (p=0.02) (Figure 3E).
Figure 3. Expression of RGC-32, FasL, CDC2, AKT, and IL-21 mRNA in responders and non-responders to GA treatment.
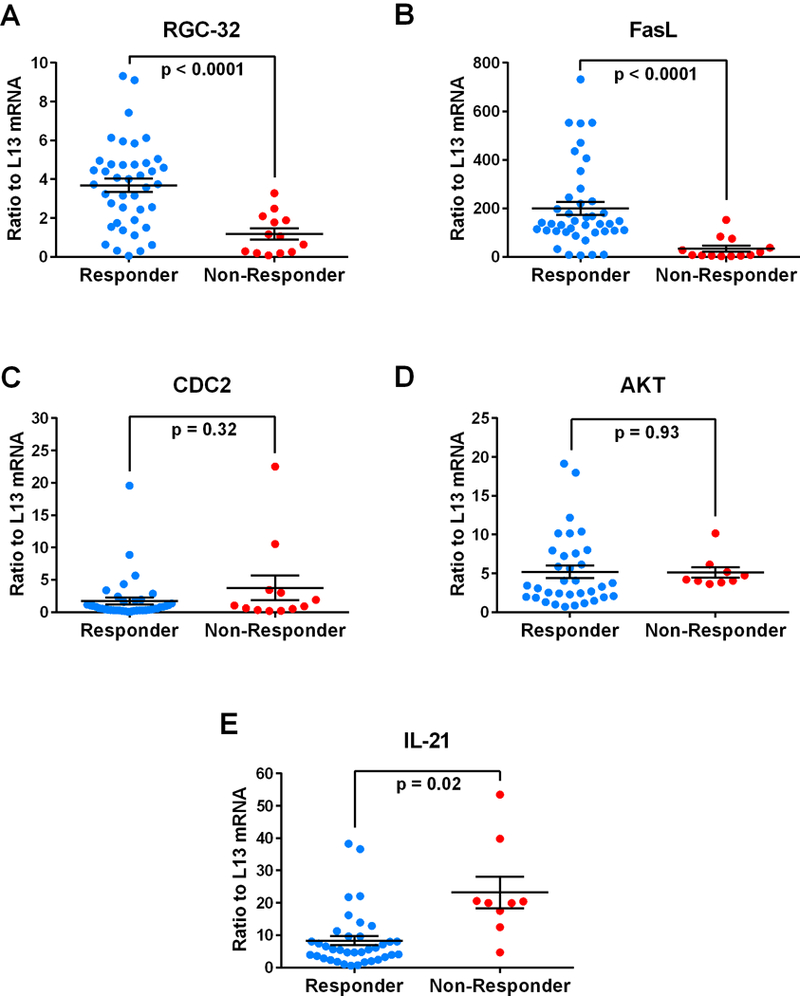
Target gene mRNA expression was measured in patients’ PBMCs using real-time qRT-PCR and expressed as a ratio to L13. A. Significantly higher levels of RGC-32 mRNA were found in responders to GA compared to non-responders (p<0.0001). B. Significantly higher levels of FasL mRNA were found in responders to GA compared to non-responders (p<0.0001). C and D. Levels of CDC2 and AKT mRNA were not significantly different between responders to GA and non-responders. E. Significantly decreased levels of IL-21 mRNA were found in responders to GA compared to non-responders (p=0.02).
Over time, responders to GA showed persistently higher levels of RGC-32, whereas non-responders showed persistently lower levels (Figure 4A). A similar pattern was observed for FasL (Figure 4B), with higher levels of mRNA expression seen in responders and lower levels seen in non-responders over time. Conversely, over time responders to GA showed persistently lower levels of IL-21, whereas non-responders showed persistently higher levels (Figure 4C). CDC2 and AKT mRNA expression did not exhibit a pattern that differed between responders and non-responders over time (data not shown).
Figure 4. Time course of RGC-32, FasL, and IL-21 mRNA expression in GA-treated MS patients.
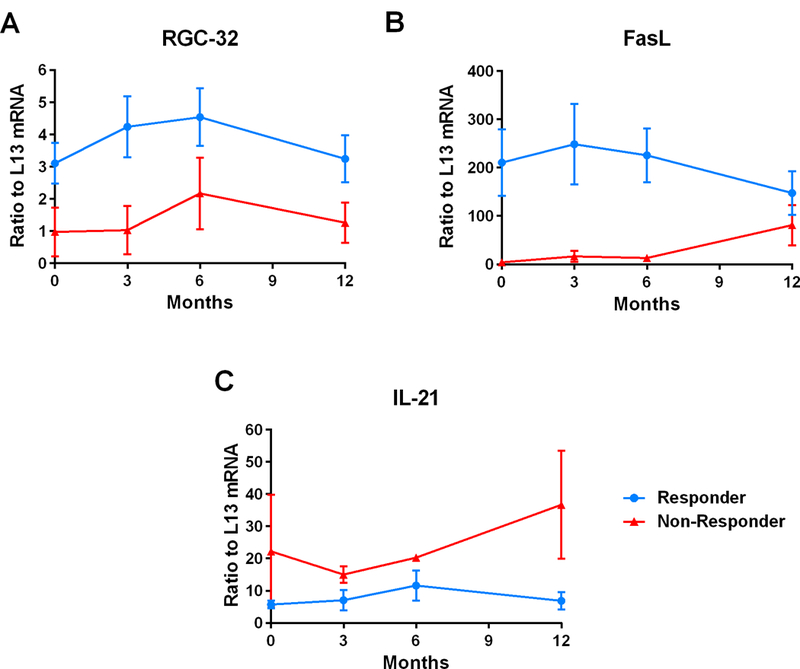
PBMCs were obtained from patients with RRMS at 0, 3, 6, and 12 months following the initiation of GA treatment. Target gene mRNA expression was measured in patients’ PBMCs using real-time qRT-PCR and expressed as a ratio to L13. A. Responders to GA showed persistently higher levels of RGC-32 compared to non-responders over time. B. A similar pattern was observed for FasL mRNA expression, with higher levels of mRNA expression seen in responders and lower levels in non-responders over time. C. Responders to GA showed persistently lower levels of IL-21 compared to non-responders over time.
Furthermore, RGC-32 and FasL mRNA levels were positively correlated within responders during periods of both remission and relapse, as well as non-responders during relapse (Figure 5A, B). Pearson correlation coefficients were r=0.53 (p=0.0003) for responders and r= 0.74 (p=0.01) for non-responders during relapse. No statistically significant correlations were found between EDSS scores and any of the target genes examined (data not shown).
Figure 5. Correlation of RGC-32 and FasL mRNA in GA-treated MS patients.
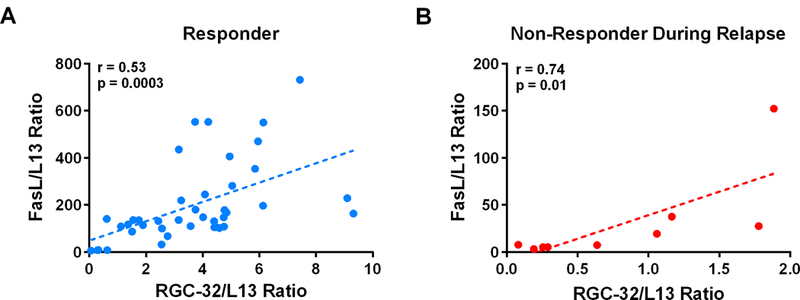
RGC-32 mRNA levels were correlated with those of FasL in both responders (A) and non-responders during relapses (B). The Pearson correlation coefficient for responders was r=0.53 (p=0.0003), and r= 0.74 (p=0.01) for non-responders.
ROC Analysis
ROC analysis was used to assess the predictive accuracy of using mRNA levels of each putative biomarker to detect patient relapse. The probability (C-statistic, or AUC) of accurately detecting relapse was 90% using RGC-32 (95% CI 80–99%, p<0.0001), 88% using FasL (95% CI 77–99%, p<0.0001), and 75% using IL-21 (95% CI 58–91%, p=0.01) (Figure 6). In the present cohort, a RGC-32/L13 ratio < 1.27 detected patient relapse with a sensitivity of 71% (95% CI 44–90%) and a specificity of 95% (95% CI 82–99%) (Figure 6A). A FasL/L13 ratio < 52.6 detected patient relapse with a sensitivity of 81% (95% CI 54–96%) and a specificity of 95% (95% CI 82–99%) (Figure 6B). An IL-21/L13 ratio > 16.9 detected patient relapse with a sensitivity of 54% (95% CI 25–81%) and a specificity of 88% (95% CI 72–97) (Figure 6C).
Figure 6. ROC curve analysis to assess the predictive accuracy of RGC-32, FasL, and IL-21 in detecting MS patient relapse.
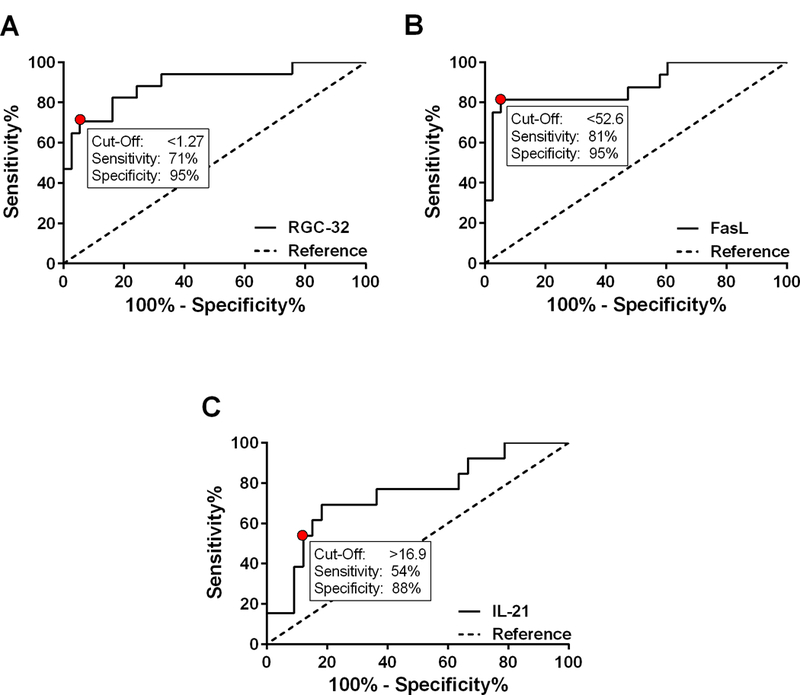
The probability (C-statistic, or AUC) of accurately detecting relapse was 90% using RGC-32 (p<0.0001), 88% using FasL (p<0.0001), and 75% using IL-21 (p=0.01). A. In the present cohort, a RGC-32/L13 ratio < 1.27 detected patient relapse with a sensitivity of 71% and a specificity of 95%. B. A FasL/L13 ratio < 52.6 detected patient relapse with a sensitivity of 81% and a specificity of 95%. C. An IL-21/L13 ratio > 16.9 detected patient relapse with a sensitivity of 54% and a specificity of 88%.
Since persistently higher levels of RGC-32 and FasL as well as lower levels of IL-21 mRNA were associated with a good response to GA treatment over time, ROC analysis was also used to assess the predictive accuracy of RGC-32, FasL, and IL-21 in detecting response to GA. The probability (C-statistic, or AUC) of accurately detecting response to GA treatment over 2 years was 85% using RGC-32 (95% CI 74–95%, p=0.0002), 90% using FasL (95% CI 81–100%, p<0.0001), and 85% using IL-21 (95% CI 71–99%, p=0.001) (Figure 7). In the present cohort, a RGC-32/L13 ratio > 2.52 correctly detected patient response to GA with a sensitivity of 71% (95% CI 54–84%) and a specificity of 92% (95% CI 64–100%). A FasL/L13 ratio > 85.4 correctly detected patient response to GA with a sensitivity of 85% (95% CI 71–94%) and a specificity of 92% (95% CI 64–100%). An IL-21/L13 ratio < 11.9 correctly detected patient response to GA with a sensitivity of 81% (95% CI 65–92%) and a specificity of 89% (95% CI 52–100%).
Figure 7. ROC curve analysis to assess the predictive accuracy of RGC-32, FasL, and IL-21 in detecting MS patient response to GA.
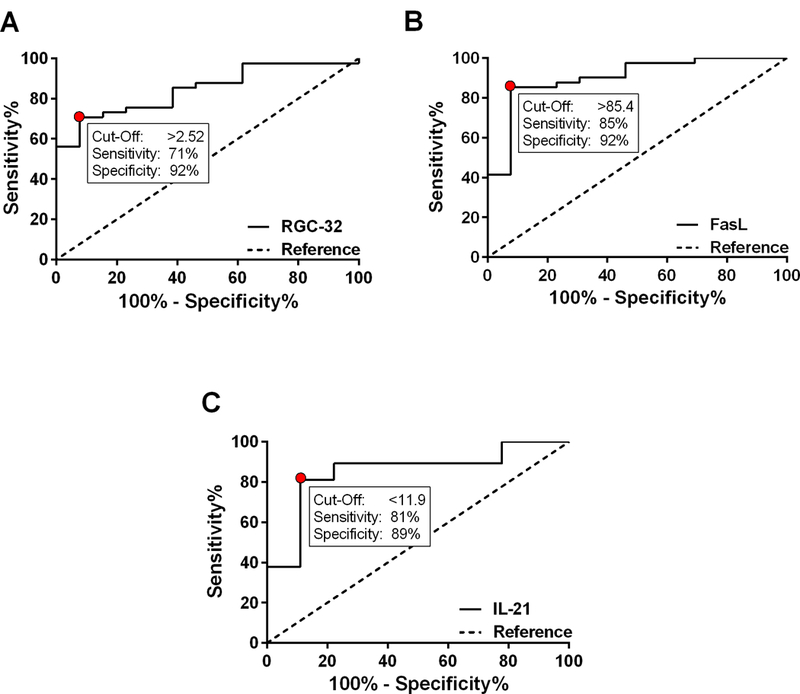
The probability (C-statistic, or AUC) of accurately detecting response to GA treatment over 2 years was 85% using RGC-32 (p=0.0002), 90% using FasL (p<0.0001), and 85% using IL-21 (p=0.001). A. In the present cohort, a RGC-32/L13 ratio > 2.52 detected RRMS patient response to GA with a sensitivity of 71% and a specificity of 92%. B. A FasL/L13 ratio > 85.4 detected RRMS patient response to GA with a sensitivity of 85% and a specificity of 92%. C. An IL-21/L13 ratio < 11.9 detected RRMS patient response to GA with a sensitivity of 81% and a specificity of 89%.
Additionally, ROC curve analysis was performed using only baseline mRNA levels from samples collected prior to GA administration (i.e. at month 0) to assess the predictive accuracy of initial RGC-32, FasL, and IL-21 levels in predicting future response to GA. The probability (C-statistic, or AUC) of accurately predicting response to GA was 82% using RGC-32 (95% CI 58–100%, p=0.10), 100% using FasL (95% CI 100–100%, p=0.03), and 75% using IL-21 (95% CI 35–100%, p=0.28) (data not shown).
DISCUSSION
The primary aim of this study was to evaluate RGC-32 as a potential biomarker of relapse and response to GA treatment in a cohort of MS patients over time. The secondary aims were to similarly evaluate FasL, CDC2, AKT, and IL-21 as potential biomarkers, given that they interact with or are regulated by RGC-32 at the molecular level. This analysis was performed in unstimulated PBMCs in order to mimic the in vivo situation as closely as possible, so that alterations in mRNA expression would have greater predictive value with respect to clinical exacerbations (Lopatinskaya et al., 2003).
We have previously shown that RGC-32 and FasL mRNA levels are significantly decreased and that IL-21 levels are increased in the PBMCs of MS patients during clinical relapse compared to remission (Tegla et al., 2013). The present data extend and confirm these prior results in a greater number of patients. Furthermore, ROC analysis of this cohort showed that RGC-32, FasL, and IL-21 mRNA levels accurately detected patient relapse (Figure 6). Together, these findings support the use of RGC-32, FasL, and IL-21 as potential serum biomarkers of disease activity in multiple sclerosis.
Overall, RGC-32 and FasL mRNA levels were significantly increased and IL-21 levels were decreased in the PBMCs of MS patients defined as responders compared to non-responders to GA. Over time, RGC-32 and FasL levels were persistently higher and IL-21 levels were persistently lower in responders versus non-responders as well. Furthermore, ROC analysis of this cohort showed that RGC-32, FasL, and IL-21 mRNA levels accurately detected patient response to GA (Figure 7). Together, these findings show for the first time that RGC-32, FasL, and IL-21 are potential serum biomarkers of response to GA in multiple sclerosis. However, due to the smaller sample size of this clinical trial, it is necessary to increase the patient sample size before being able to definitively establish the effectiveness of these markers. While these data support the use of RGC-32, FasL, and IL-21 mRNA levels within PBMCs to aid in the detection of response while using GA, it remains unclear whether these values can be used to predict future response solely according to the baseline levels of RGC-32, FasL, and IL-21 recorded prior to GA initiation. A larger sample size would likely address this question more definitively.
Although RGC-32 has been shown to bind with and modulate the activities of both CDC2 and AKT within the cell cycle (Badea et al., 2002; Fosbrink et al., 2009), it appears as though changes in RGC-32 mRNA expression do not correlate with those of CDC2 and AKT during MS relapse or with respect to GA response. However, it is possible that differences exist at the levels of protein expression and function, and this should be investigated further in the context of disease activity and response to treatment.
The synchronized changes observed in RGC-32 and FasL mRNA expression within PBMCs either during relapses or with respect to GA therapy response may be explained by the known role of RGC-32 in the regulation of FasL expression (Tegla et al., 2013). Since RGC-32 binds to and up-regulates CDC2/cyclin B1 kinase activity (Badea et al., 2002; Fosbrink et al., 2009), FasL expression in T-cells is regulated in part by the CDC2/cyclin B1 complex (Torgler et al., 2004), and RGC-32 silencing significantly decreases FasL mRNA expression (Tegla et al., 2013), it is possible that RGC-32 regulates FasL expression by modulating the activity of the CDC2/cyclin B1 complex. These data also suggest that RGC-32 is involved in regulating T-cell apoptosis by modulating the expression of FasL (Tegla et al., 2013). In MS, myelin and myelin-producing oligodendrocytes in the CNS are targeted for autoimmune attack via antigen-specific CD4+ T cells (Rus et al., 2006). T-cell apoptosis in MS is regulated in part by the Fas-FasL system (Aktas et al., 2006), and ex-vivo studies have demonstrated an increased resistance of T-cells to Fas-mediated apoptosis during MS relapses (Okuda et al., 2006). Thus, in this case a decrease in RGC-32 and an associated decrease in FasL expression may result in a decrease in FasL-mediated T-cell apoptosis, promote the survival of myelin-targeted T-cells, and result in the onset of clinical relapse and a suboptimal response to GA treatment.
It is less clear if and how IL-21 expression is regulated by RGC-32, although IL-21 is involved with T-cell proliferation and cell cycle activation. Preliminary experiments using CD4+ T-cells from RGC-32 knockout mice (Tegla et al., 2015) showed increased expression of IL-21 mRNA in the absence of RGC-32 in CD4+ T-cells stimulated with anti-CD3/CD28 (Supplementary Figure 1). These data suggest an inhibitory effect of RGC-32 on IL-21 transcription, which could potentially explain the inverse relationship between RGC-32 and IL-21 mRNA levels as observed in this study. However, further work is needed to confirm these preliminary results.
Overall, the data suggest that RGC-32, FasL and IL-21 could potentially serve as serum biomarkers for the detection of MS patient relapse and response to GA therapy. Such information could potentially help guide treatment decisions, delay disease progression, and improve outcomes for MS patients. Furthermore, RGC-32 may represent a useful new target for therapeutic intervention in MS.
Supplementary Material
Purified CD4+ T cells from wild-type (WT) or RGC-32−/− knockout (KO) mice were stimulated with anti-CD3 (5 μg/mL) and soluble anti-CD28 (2.5 μg/mL) for the indicated periods of time. IL-21 mRNA expression was significantly increased after 3, 6 and 24 h of stimulation (p<0.001) in RGC-32−/− mice. Results of three separate experiments are expressed as mean ± SEM.
ACKNOWLEDGMENTS
We thank Dr. Deborah McClellan for editing this manuscript. This work was supported in part by a Teva Neuroscience grant (to H.R.) and a Veterans Administration Merit Award BX001458 (to H.R.). Adam M. Kruszewski was supported in part by a medical student research grant from the Foundation of the Consortium of Multiple Sclerosis Centers’ MS Workforce of the Future program, the University of Maryland School of Medicine Office of Student Research and the Leslie B. Barnett Memorial Student Fellowship. Daniel Hewes was supported in part by the University of Maryland School of Medicine Office of Student Research.
ABBREVIATIONS
- AKT
AKT8 virus oncogene cellular homolog
- AUC
area under the curve
- CDC2
cell division cycle protein 2 homolog
- CNS
central nervous system
- CPT
cell preparation tubes
- EDSS
expanded disability status scale
- FasL
fas ligand
- GA
glatiramer acetate
- IL
interleukin
- MRI
magnetic resonance imaging
- MS
multiple sclerosis
- NRV
normalized mRNA value
- PBMCs
peripheral blood mononuclear cells
- RGC
response gene to complement
- ROC
receiver operating characteristic
- RRMS
relapsing-remitting multiple sclerosis
- WT
wild type
REFERENCES
- Aktas O. et al. , 2006. Death ligands and autoimmune demyelination. Neuroscientist. 12,305–16. [DOI] [PubMed] [Google Scholar]
- Badea T, et al. , 2002. RGC-32 increases p34CDC2 kinase activity and entry of aortic smooth muscle cells into S-phase. J Biol Chem. 277, 502–8. [DOI] [PubMed] [Google Scholar]
- Badea TC, et al. , 1998. Molecular cloning and characterization of RGC-32, a novel gene induced by complement activation in oligodendrocytes. J Biol Chem. 273, 26977–81. [DOI] [PubMed] [Google Scholar]
- Fosbrink M, et al. , 2009. Response gene to complement 32 is required for C5b-9 induced cell cycle activation in endothelial cells. Exp Mol Pathol. 86, 87–94. [DOI] [PMC free article] [PubMed] [Google Scholar]
- Furby J, et al. , 2010. A longitudinal study of MRI-detected atrophy in secondary progressive multiple sclerosis. J Neurol. 257, 1508–16. [DOI] [PubMed] [Google Scholar]
- Graber JJ, Dhib-Jalbut S, 2011. Biomarkers of disease activity in multiple sclerosis. J Neurol Sci. 305, 1–10. [DOI] [PubMed] [Google Scholar]
- Housley WJ, et al. , 2015. Biomarkers in multiple sclerosis. Clin Immunol. doi: 10.1016/j.clim.2015.06.015. [Epub ahead of print] [DOI] [PubMed] [Google Scholar]
- Johnson KP, et al. , 1995. Copolymer 1 reduces relapse rate and improves disability in relapsing-remitting multiple sclerosis: Results of a phase III multicenter, double-blind, placebo-controlled trial. Neurology. 45, 1268–76. [DOI] [PubMed] [Google Scholar]
- Johnson KP, et al. , 1998. Extended use of glatiramer acetate (Copaxone) is well tolerated and maintains its clinical effect on multiple sclerosis relapse rate and degree of disability. Neurology. 50, 701–8. [DOI] [PubMed] [Google Scholar]
- Kurtzke JF, 1983. Rating neurologic impairment in multiple sclerosis: an expanded disability status scale (EDSS). Neurology. 33, 1444–52. [DOI] [PubMed] [Google Scholar]
- Lopatinskaya L, et al. , 2003. The development of clinical activity in relapsing-remitting MS is associated with a decrease of FasL mRNA and an increase of Fas mRNA in peripheral blood. J Neuroimmunol. 138, 123–31. [DOI] [PubMed] [Google Scholar]
- McDonald WI, et al. , 2001. Recommended diagnostic criteria for multiple sclerosis: guidelines from the International Panel on the diagnosis of multiple sclerosis. Ann Neurol. 50, 121–7. [DOI] [PubMed] [Google Scholar]
- McFarland HF, Martin R, 2007. Multiple sclerosis: a complicated picture of autoimmunity. Nat Immunol. 8, 913–19. [DOI] [PubMed] [Google Scholar]
- Niculescu F, et al. , 1997. Activation of Ras and mitogen-activated protein kinase pathway by terminal complement complexes is G protein dependent. J Immunol. 158, 4405–12. [PubMed] [Google Scholar]
- Okuda Y, et al. , 2006. Apoptosis of T cells in peripheral blood and cerebrospinal fluid is associated with disease activity of multiple sclerosis. J Neuroimmunol 171, 163–70. [DOI] [PubMed] [Google Scholar]
- Polman CH, et al. , 2005. Diagnostic criteria for multiple sclerosis: 2005 revisions to the “McDonald Criteria”. Ann Neurol. 58, 840–46. [DOI] [PubMed] [Google Scholar]
- Rus H, et al. , 2006. C5b-9 complement complex in autoimmune demyelination. Dual role in neuroinflammation and neuroprotection. Current Topics in Complement (Lambris J ed), Adv. Exp. Med. Biol. 586: 139–51, Springer Verlag, NY: [DOI] [PubMed] [Google Scholar]
- Tegla CA, et al. , 2013. Dual role of Response gene to complement-32 in multiple sclerosis. Exp Mol Pathol. 94, 17–28. [DOI] [PubMed] [Google Scholar]
- Tegla CA, et al. , 2015. RGC-32 is a novel regulator of the T-lymphocyte cell cycle. Exp Mol Pathol. 98, 328–37. [DOI] [PMC free article] [PubMed] [Google Scholar]
- Torgler R, et al. , 2004. Regulation of activation-induced Fas (CD95/Apo-1) ligand expression in T cells by the cyclin B1/Cdk1 complex. J Biol Chem. 279, 37334–42. [DOI] [PubMed] [Google Scholar]
- Trapp BD, Nave K-A, 2008. Multiple Sclerosis: An Immune or Neurodegenerative Disorder? Ann Rev Neurosci. 31, 247–69. [DOI] [PubMed] [Google Scholar]
- Vlaicu SI, et al. , 2008. Role of response gene to complement 32 in diseases. Arch Immunol Ther Exp (Warsz). 56, 115–22. [DOI] [PMC free article] [PubMed] [Google Scholar]
Associated Data
This section collects any data citations, data availability statements, or supplementary materials included in this article.
Supplementary Materials
Purified CD4+ T cells from wild-type (WT) or RGC-32−/− knockout (KO) mice were stimulated with anti-CD3 (5 μg/mL) and soluble anti-CD28 (2.5 μg/mL) for the indicated periods of time. IL-21 mRNA expression was significantly increased after 3, 6 and 24 h of stimulation (p<0.001) in RGC-32−/− mice. Results of three separate experiments are expressed as mean ± SEM.