

SUMMARY
Unresectable glioblastoma (GBM) cells in the invading tumor edge can act as seeds for recurrence. The molecular and phenotypic properties of these cells remain elusive. Here, we report that the invading edge and tumor core have two distinct types of glioma stem-like cells (GSCs) that resemble proneural (PN) and mesenchymal (MES) subtypes, respectively. Upon exposure to ionizing radiation (IR), GSCs, initially enriched for a CD133+ PN signature, transition to a CD109+ MES subtype in a C/EBP-β-dependent manner. Our gene expression analysis of paired cohorts of patients with primary and recurrent GBMs identified a CD133-to-CD109 shift in tumors with an MES recurrence. Patient-derived CD133−/CD109+ cells are highly enriched with clonogenic, tumor-initiating, and radiation-resistant properties, and silencing CD109 significantly inhibits these phenotypes. We also report a conserved regulation of YAP/TAZ pathways by CD109 that could be a therapeutic target in GBM.
Graphical Abstract

In Brief
Minata et al., in response to the proinflammatory environment induced by radiation, find that the tumor cells at the invasive edge acquire the expression of the CD109 protein concomitantly losing CD133. CD109 drives oncogenic signaling through the YAP/TAZ pathway, confers radioresistance to the cells, and represents a new potential therapeutic target for glioblastoma.
INTRODUCTION
Glioblastoma (GBM) is a devastating disease that afflicts ~15,000 Americans every year (Ostrom et al., 2017). The outcome of GBM patients remains extremely poor, despite aggressive surgery, chemotherapy, and radiation therapy. These tumors exhibit diffuse invasion into neighboring brain tissue and are not completely resectable without interfering with normal brain functions (Claes et al., 2007; Ghinda et al., 2016). The majority of GBMs recur locally within or adjacent to the radiated field (Alexander et al., 2013; Stupp et al., 2007). These residual cells develop alternative evolutionary paths that drive the growth of recurrent tumors and contribute to treatment failure (Kim et al., 2015; Wang et al., 2016). In fact, multiple studies have shown that a greater extent of resection is associated with improved survival in GBM (Brown et al., 2016; Kuhnt et al., 2011; Lacroix et al., 2001; Stummer et al., 2008).
Cancer stem cells contribute to recurrence in multiple cancer types, including GBM, but the exact mechanisms underlying such recurrence are unclear (Brooks et al., 2015; Clevers, 2011; Shah, 2016). Recently, we identified 2 distinct and mutually exclusive subtypes of patient-derived glioma stem-like cells (GSCs) that recapitulate either the proneural (PN) or the mesenchymal (MES) subtypes of GBM (Bhat et al., 2013; Mao et al., 2013), suggesting that GSCs are heterogeneous. We and others have found subtype plasticity in both patient tumors and preclinical models (Bao et al., 2006; Bhat et al., 2013; Kim et al., 2016; Mao et al., 2013), but what triggers this switch and how newly formed GSCs contribute to recurrence are unknown. Identifying the mechanisms of cancer stem cell plasticity in GBMs is crucial to understanding the cellular heterogeneity and molecular mechanisms that initiate recurrence (Hambardzumyan et al., 2006; Meacham and Morrison, 2013).
Most primary GBMs are believed to have a PN origin, and single-cell sequencing studies (Patel et al., 2014) have shown that patients with a higher proportion of tumor cells with a PN signature have longer survival times than patients with mixed heterogeneous subtypes (Ozawa et al., 2014; Patel et al., 2014). Recent findings have reinforced the notion of plasticity among molecular subtypes of GBM upon recurrence, and the conversion to the MES subtype is associated with worse overall survival (Wang et al., 2016, 2017). From these findings, we infer that the imminent conversion of PN GBMs to other subtypes, particularly MES, may provide a survival advantage to tumor cells. CD133, CD15, and other tumor initiation markers for GSCs (Lathia et al., 2015) are not expressed in all tumors, such as MES GBMs (Bhat et al., 2013; Mao et al., 2013), and markers for these GSCs have remained elusive. Furthermore, intratumoral heterogeneity and molecular subtype differences between GBM cells at the invading tumor edge and in the tumor core remain largely unexplored, and the molecular mechanisms that cause invading-edge cells to expand during recurrence are unknown.
CD109 is a glycosylphosphatidylinositol-anchored glycoprotein and is a member of the α2 macroglobulin/C3, C4, C5 family (Sutherland et al., 1991). Although CD109 is normally expressed on the surfaces of activated T cells, platelets, endothelial cells, and hematopoietic stem cells, its exact physiological roles are unknown (Haregewoin et al., 1994). CD109 functions by binding to both transforming growth factor β1 (TGF-β1) and TGF-β receptor 1 (TGFBR1), thereby forming a macromolecular complex sequestered in caveolae and lipid raft compartments and eventually degrading the receptor complex and inhibiting SMAD signaling (Bizet et al., 2012). High levels of CD109 have been reported in multiple cancers, including GBM (Chuang et al., 2017; Hashimoto et al., 2004; Shiraki et al., 2017; Tao et al., 2014; Zhang et al., 2005, 2015); notably, CD109+ circulating endothelial cells in recurrent GBM have been reported to be prognostic (Mancuso et al., 2014). However, the nature of the activation of CD109 in response to extrinsic signals and the modes by which it promotes tumorigenesis in GBM remain unknown. In a recent study using unbiased genomic approaches, CD109 was identified as a pro-metastatic gene in lung cancer (Chuang et al., 2017). Rescue experiments, however, demonstrated that signal transducer and activator of transcription 3 (STAT3) activation, but not SMAD signaling, was required for metastasis. Thus, the differential regulation of TGF-β or STAT3 by CD109 appears to be context and tissue specific.
There is a gap in knowledge regarding (1) the mechanisms involved in the evolution of de novo or recurrent MES tumors from a PN precursor, and (2) the markers that can identify the cells responsible for recurrence in GBM. Understanding the mechanisms involved in PN-to-MES transition is crucial for designing therapeutic strategies for recurrent GBM. In this study, we defined the molecular features of tumor cells at the invading edge and in the core region, an objective complemented by the molecular profiling of longitudinal clinical specimens and functional characterization of these cells using clinically relevant models. Our results show that CD109 is an oncogenic driver of tumor initiation and radioresistance in GBM and identify an important molecular link between CD109, MES transition, and oncogenic yes-associated protein and transcriptional coactivator with a PDZ-binding domain (YAP/TAZ) signaling.
RESULTS
Discovery of Mutually Exclusive Populations of Tumor-Initiating Cells in GBM
To compare the cellular and molecular signatures of tumor cells at the invading edge with those of cells in the tumor core, we used gene expression profile data from anatomically distinct regions of the tumor, available from the Ivy Glioblastoma Atlas Project (http://glioblastoma.alleninstitute.org/). Supervised clustering of transcripts representing either the PN, classical (CL), or MES subtype (Table S1; Verhaak et al., 2010) across tumor regions showed a clear trend of accumulation of the MES signature in the perinecrotic and pseudopalisading tumor regions (central core) and a predominant PN signature at the invading edge (leading edge; Figure 1A). CL signatures were distributed between the 2 regions (Figure S1A).
Figure 1. Discovery of Mutually Exclusive Populations of Tumor-Initiating Cells in GBM.

(A) Heatmap depicting PN (top) and MES (bottom) gene expression in different GBM regions. See also Figure S1A.
(B) Magnetic resonance imaging of the macroscopic tumor (left) and H&E staining (right; scale bar, 120 μm) of GBM tissue. The tumor contains 3 areas: a central core (1), an enhancing periphery (2), and an invading edge (3).
(C) qPCR analysis for genes in the central core (blue) or edge (orange).
(D) IHC for CD109 (brown) and OLIG2 (red). Scale bars, 60 μm (top) and 20 μm (bottom).
(E) Flow cytometry staining of CD109 in freshly dissociated tumor cells (left). qPCR analysis for genes in sorted CD109− cells (blue) and CD109+ cells (red; right). **p < 0.01, ***p < 0.001, and ****p < 0.0001.
(F) qPCR analysis of CD133 expression in a freshly dissociated xenograft derived from a patient sample (GBM1066). ****p < 0.0001.
(G) Lineage hierarchy in sorting of CD109+ and CD109−/low populations from MES GSC83 cells.
(H) Western blot analysis of CD109 and ALDH1A3 in CD109+ and CD109−/low cells.
(I) Table showing number of mice bearing tumors injected with either CD109+ or CD109−/low sorted cells using freshly dissociated cells from patients GBM1020 or GBM1010 or from MES GSC83.
(J) H&E staining of xenograft tumors derived from CD109+ (left) and CD109−/low (right) cells at 2 different magnifications.
Given the preferential expression of PN signatures in the invading edge, we performed a localized biopsy using a magnetic resonance imaging-guided neuronavigation system to collect tumor core tissue (within the enhancing portion of the mass on T1-gadolinium images) and tumor edge tissue (outside the enhancing portion of the mass but within the fluid-attenuated inversion recovery [FLAIR] change on T1-gadolinium images), followed by histopathological evaluation (Figure 1B). A shortterm incubation of the collected tumor cells showed that CD133, a marker enriched in PN GSCs (Bhat et al., 2013; Mao et al., 2013), was preferentially expressed in the tumor edge compared with the tumor core (Figure 1C). In contrast to CD133, CD109—and less apparently CD44—were among the most upregulated genes in GSCs with an MES signature (Figure S1B). Both CD109 and CD44 were preferentially expressed in the tumor core compared with the tumor edge (Figure 1C). Immunohistochemistry (IHC) using human GBM tissues revealed mutually exclusive patterns of CD109 and CD44 expression in the tumor core, as well as the expression of OLIG2, a surrogate marker of PN/CD133+ cells (Mao et al., 2013; Segerman et al., 2016), in the tumor edge (Figures 1D and S1C). Analyses of an independent, freshly dissociated patient biopsy sample and a sample of patient-derived xenograft tissue from a mouse confirmed the mutually exclusive expression pattern of CD133 and CD109 (Figures 1E and 1F). These data imply that CD133 and CD109 represent a mutually exclusive expression profile of PN and MES tumor cells localized in the tumor edge and core.
In vitro clonal neurosphere assays showed that CD109+ cells are more clonogenic and give rise to both CD109+ and CD109−/low populations, whereas CD109−/low cells had no or low CD109 expression, confirming that CD109+ cells are at the apex of stem cell hierarchy (Figures 1G and S1D). ALDH1A3, whose activity is a hallmark of cancer stem cells (Luo et al., 2012; Mao et al., 2013; Marcato et al., 2011), was present almost exclusively in CD109+ cells but not in CD109−/low cells (Figures 1H and S1E). In contrast, CD44, a pan-MES GBM marker, was detected in both cell populations (Figure S1E). In vivo tumorigenicity assays showed that in both freshly dissociated tumor cells and established GSCs CD109+ cells had greater tumor initiation capacity than CD109−/low cells did (Figure 1I). These tumors had the histopathological characteristics of high-grade glioma (Figure 1J). These findings suggest that CD109 is preferentially expressed in the core GBM region distinct from CD133+ populations and retains stem cell and tumor-initiation properties.
CD109 Enrichment Is Associated with the MES Subtype and Worse Prognosis
Using The Cancer Genome Atlas (TCGA) dataset, we found an overall higher expression of CD109 in high-grade gliomas compared with low-grade gliomas and normal brains (Figure 2A). CD109 expression was higher in the MES subtype than in the PN or CL subtypes in the TCGA Agilent gene expression dataset (Figure 2B). We analyzed the relation between CD133/CD109 expression and tumor subtypes using 46 longitudinal GBM samples. In this dataset, CD109 expression was highly associated with the MES subtype, and CD133 downregulation or CD109 upregulation was significantly associated with a recurrence as an MES but not PN or CL subtype (Figures 2C, 2D, S2A, and S2B). In both the Rembrandt and TCGA datasets, patients with the CD109high/CD133high subtype had significantly shorter survival times (Figures 2E and S2C). These data were confirmed by IHC for CD109, demonstrating poorer prognosis in the CD109high expression group (Figures 2F).
Figure 2. CD109 Enrichment Is Associated with the MES Subtype and Worse Prognosis.

(A) CD109 expression for normal brain, low-grade glioma (LGG), primary GBM, and recurrent GBM (rGBM) from TCGA datasets is shown. Left: normal versus LGG, p = 0.03572; normal versus GBM, p = 3.925e–05; LGG versus GBM, p = 8.529e–10. Center: normal versus LGG, p = 0.03572; normal versus GBM, p = 5.605e–05; normal versus rGBM, p = 0.0004907; LGG versus GBM, p = 2.992e–08; LGG versus rGBM, p = 0.002994; GBM versus rGBM, p = 0.08103. Right: normal versus LGG, p = 0.03002; normal versus rLGG, p = 0.577; normal versus GBM, p = 5.605e–05; normal versus rGBM, p = 0.0004907; LGG versus GBM, p = 7.54e–08; rLGG versus GBM, p = 0.0003432; LGG versus rGBM, p = 0.003294; rLGG versus rGBM, p = 0.0003273; GBM versus rGBM, p = 0.08103.
(B) CD109 expression in TCGA datasets grouped by GBM subtype. CL versus MES, p < 2.2e–16; CL versus PN, p = 1.239e–05; MES versus PN, p < 2.2e–16.
(C) A total of 46 longitudinal samples categorized into groups based on alterations in CD133 and CD109 expression. The subtype of each recurrent tumor is shown in the box.
(D) A total of 46 paired samples classified into 3 groups according tothe recurrent tumor’s subtype (MES, CL, or PN). Each dot represents a patient; primary and recurrent samples are connected by a line. MES, p = 0.014; CL and PN, p = NS.
(E) Kaplan-Meier survival curves for patients with differential CD133 and CD109 expression (top) and with differential CD109 expression only (bottom) from the Rembrandt dataset.
(F) Overall survival of 46 high-grade glioma (HGG) patients grouped according to low (blue), mild (green), and high (red) CD109 expression by immunostaining. Scale bars, 200 –m. p < 0.0001. See also Figures S2F and S2G.
IR Induces and Enriches CD109+ Cells
We used microarray analysis to assess the molecular alterations in CD133high/PN GSCs (n = 2) at various time points after exposure to ionizing radiation (IR) (Mao et al., 2013). Irradiated CD133high/PN GSCs clustered closely with CD109high/MES GSCs as early as 24 h after exposure to IR, whereas their untreated counterparts clustered as a distinctly separate group (Figures 3A and S3A). The most differentially expressed genes from this dataset clearly separated TCGA tumors into PN or MES subtypes (Figure 3B), indicating that these gene clusters reflect the 2 major GBM subtypes. CD109 was highly induced (by orders of magnitude) in PN GSCs in response to IR, whereas CD133 was the marker with the lowest expression in these cells (Figure 3C; Table S2). Western blotting revealed the absence of CD109 expression in CD133high/PN GSCs, confirming the mutually exclusive expression of the 2 markers and the prevalence of CD109 in MES GSCs (Figure 3D). Validating these results using qPCR analysis showed the rapid switch of CD133 to CD109 expression following IR of CD133high/PN GSCs (Figure 3E). This change in expression was accompanied by a reduction of OLIG2 and a concomitant induction of a panel of MES markers, including CD44, as detected by qPCR and immunofluorescence analyses in both in vitro and in vivo systems (Figures S3B-S3D).
Figure 3. IR Induces and Enriches CD109+ Cells.

(A) Principal-component analysis of gene expression profiles stratifies PN and MES GSCs. PN GSCs from the same patient are indicated by the same color and shape. There are 2 distinct clusters: one consists of untreated PN GSCs, and the other consists of MES GSCs and the corresponding irradiated PN GSCs. See also Figure S2A.
(B) Heatmap showing the 2,838 most differentially expressed genes between PN and MES GSCs and their ability to segregate TCGA PN or MES subtypes.
(C) Dot plot showing the log ratio of CD gene expression in untreated GSC157 (PN) versus irradiated GSC157 (IR-PN) cells. On the x axis, genes farther to the left have a higher expression in irradiated PN GSCs, whereas genes farther to the right have a higher expression in untreated PN GSCs.
(D) Western blotting showing CD109 expression in PN and MES GSCs.
(E) qPCR analysis for CD133 and CD109 expression in untreated GSC157 (PN) and irradiated GSC157 (IR-PN) cells at 24, 48, and 120 h. ****p < 0.0001.
(F) Fluorescence images of CD133− (left) and CD133+ (right) GSC157 cells transfected with CD109 molecular beacons (red: CY5) 24 h after radiation (n = 5.0 × 10⁵). Top scale bar, 500 μM; bottom scale bar, 100 μM.
(G) Fluorescence images of GSC84 cells after transfection with CD133 (green: FAM) and CD109 (red) molecular beacons at the indicated times. Scale bars, 10 μM.
(H) Scatterplots showing staining of CD109 in various GSCs.
(I) Extreme limiting dilution analysis revealed the sphere formation frequencies of untreated GSC157 and GSC157/R cells. ***p < 0.001.
(J) Single-cell motility of untreated GSC157 cells and GSC157/R cells 3 months after IR. p < 0.001. See also Figure S3F.
(K) H&E staining (top; scale bars, 500 μm [left], 100 μm [right]) and immunofluorescence staining for CD44 or human-specific nuclear antigen ([HSNA] bottom; scale bars, 100 μm [right]) in mouse brains harboring tumors implanted with untreated GSC157 cells (left) or GSC157/R cells 3 months after IR (right; n = 5 per group). HSNA staining demonstrates the hypercellularity of GSC157/R xenografts. Scale bars, 200 μm and 50 μm for top and bottom CD109, respectively.
(L) Table showing number of mice bearing tumors injected with either CD109+ or CD109−/low, using GSC157/R cells 3 months post IR.
To determine whether the IR-induced changes in CD133 and CD109 expression could be a secondary enrichment of CD109+/CD133− cells or the result of a direct reprogramming of CD133+/CD109− GSCs into CD133−/CD109+ GSCs, we conducted in situ hybridization experiments using molecular beacon probes. Live monitoring of CD133 and CD109 at the single-cell level revealed the emergence of CD109 expression in CD133+ but not CD133− cells after exposure to IR (Figure 3F). The induction of CD109 expression in CD133+ but not CD133− cells was directly captured by clonal tracking of irradiated GSCs (Figures 3G and S3E; Videos S1 and S2). The lack of CD109 induction in CD133− cells was not due to cell death, as more than half of both populations were viable after sorting and IR (Figure S3F). Notably, a small set of the populations retained CD109 expression at levels similar to those of MES GSCs even 3 months after IR (Figures 3H and S3C). Thus, the IR-induced transition of GSC subtypes can be tracked by the cell surface markers CD133 and CD109.
In vitro analysis of GSCs that had transformed to a CD109high/MES subtype in response to IR (GSC157/R and GSC84/R) had higher clonogenicity (Figure 3I), higher motility (Figures 3J and S3G), and higher levels of the MES marker CD44 (Figure 3K). In secondary xenograft assays using GSC157/R, only the CD109+ fraction could form tumors in a subset of the mice, suggesting that CD109 is a marker of tumor initiation in GSCs that escape IR (Figure 3L). In concordance with the radioresistant phenotypes associated with CD133low/CD109high tumors, Kyoto Encyclopedia of Genes and Genomes (KEGG) pathway analyses of recurrent tumors revealed the activation of DNA repair-related signatures, including mismatch repair, homologous recombination, nucleotide excision repair, and base excision repair in these tumors (Figure S4).
CD109 Is Regulated by C/EBP-β in Response to IR in CD133high/PN GSCs
We next examined the mechanisms by which IR induces CD109 expression in GSCs. One of the earliest responses to IR-mediated DNA damage is ataxia telangiectasia mutated (ATM) activation (Bhatti et al., 2011), which can activate nuclear factor κB (NF-κB) via phosphorylation of the NF-κB essential modulator (Huang et al., 2003; Wu et al., 2006). Also, we and others have demonstrated that GSCs undergo MES differentiation, with the associated acquisition of radioresistance, in a tumor necrosis factor α (TNF-α)/NF-κB-dependent manner (Bhat et al., 2013; Moreno et al., 2017). Activation of NF-κB by both IR and TNF-α caused upregulation of CD109 expression in an NF-κB-dependent manner (Figure 4A). Using bioinformatic approaches (Broos et al., 2011; Lee and Huang, 2014; Thomas-Chollier et al., 2011), we found no predicted binding sites for the NF-κB subunits p65 or p50. Instead, we found 1 binding site each for STAT3 and CCAAT/enhancer binding protein β (C/EBP-β), the master regulators of the MES signature that act downstream of NF-κB (Figure 4B) (Bhat et al., 2011; Carro et al., 2010). STAT3 and CEBPB expression was induced in GSCs as early as 6 h after IR (Figure 4C), whereas CD109 expression increased 24 h after IR, which suggests that STAT3 and/or C/EBP-β can be upstream regulators of CD109. Pretreatment with small interfering RNA (siRNA) against STAT3 or CEBPB followed by IR showed that CEBPB but not STAT3 is responsible for the IR-mediated induction of CD109 (Figure 4D). The chromatin immunoprecipitation assay using a specific antibody confirmed the recruitment of C/EBP-β to the CD109 promoter in PN GSCs upon treatment with TNF-α or IR, as well as at baseline in MES GSCs (Figure 4E). These results indicate that C/EBP-β is a direct transcriptional regulator of CD109 in response to NF-κB activation by IR or TNF-α. Gene Ontology analysis identified a marked elevation of the wound repair pathways and upregulation of pro-inflammatory factors, including CEBPB, in irradiated CD133high/PN GSCs (Figures 4F and 4G).
Figure 4. CD109 Is Regulated by C/EBP-β in Response to IR in CD133high/PN GSCs.

(A) CD109 expression in GSC11 (left) and GSC23 (right) cells upon IR(12 Gy) and TNF-α treatment (10 μM). The bars represent the means ± SDs of 3 independent experiments. **p < 0.005 and ***p < 0.0005.
(B) Predicted binding sites for STAT3 and C/EBP-β at −200 and −75 bp, respectively, from the CD109 transcription start site.
(C) STAT3 (white bar) and CEBPB (black bar) mRNA expression 0,6, and 24 h after IR(12 Gy) in GSC11 (left) and GSC23 (right) cells. The bars indicate the means of 3 independent experiments. *p < 0.05 and **p < 0.005.
(D) CD109 transcript expression in GSC11 (left) and GSC23 (right) cells transfected with control siRNA or with siRNA against CEBPB or STAT3 (right) before and after IR (12 Gy). The graph shows the results of 3 independent experiments. **p < 0.005.
(E) Chromatin immunoprecipitation assay reveals the fold enrichment of C/EBP-β binding on the CD109 promoter relative to immunoglobulin G (IgG) in GSC11 cells; GSC11 cells 24 h after IR (12 Gy) or TNF-α treatment (10 μM); and GSC20 cells. The bar indicates the mean of 2 independent experiments in which the samples were run in triplicate. ***p < 0.0005.
(F) Gene Ontology analysis of gene expression profiles reveals the top 4 enrichment categories for irradiated cells.
(G) CEBPB expression in untreated GSC157 cells and GSC157/R cells 3 months after exposure to IR.
CD109 Plays an Essential Role in Clonogenicity, Tumor Initiation, and Radioresistance in GBM
Because CD109+ cells showed tumor-initiating potential, we postulated that these cells depend on CD109 for their self-renewal and growth. CD109 silencing in CD109high/MES GSCs was achieved with lentiviral infection using 2 independent small hairpin RNA (shRNA) constructs (Figure 5A). Neurosphere assays demonstrated that CD109 silencing diminishes the number of clonogenic sphere-forming cells (1/143 in shCD109-2-infected cells versus 1/22.5 in non-targeting shRNA [shNT]-infected cells) in a dosage-dependent manner (Figure 5B). These results were reproduced in 2 additional independent CD109high/MES GSCs (Figure S5A).
Figure 5. CD109 Plays an Essential Role in Clonogenicity, Tumor Initiation, and Radioresistance in GBM.
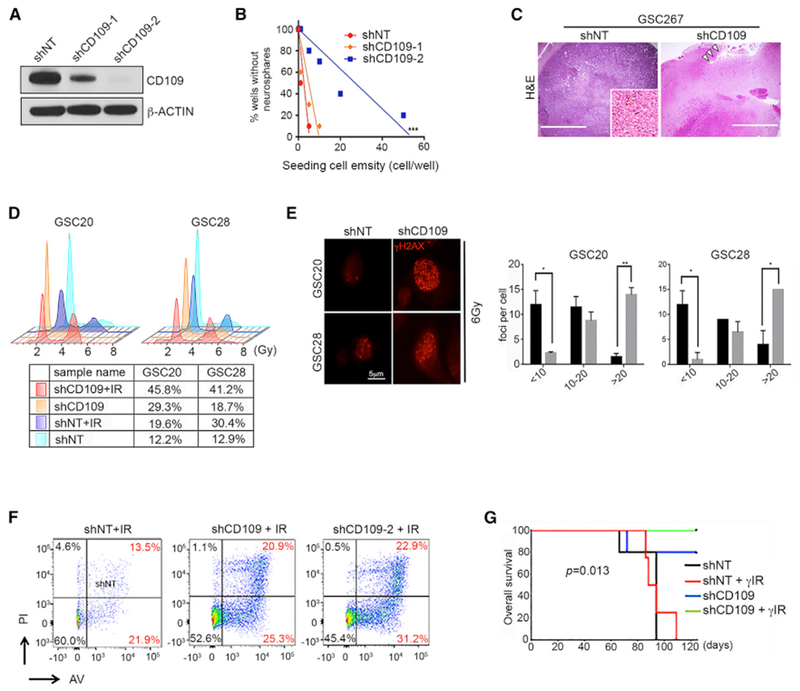
(A) Western blotting of CD109 in GSC267 cells infected with shNT or with shCD109–1 and shCD109–2.
(B) Neurosphere formation efficiency in GSC185A clones. ***p < 0.001. See also Figure S5A.
(C) Representative H&E staining of xenograft tumor derived from GSC267 cells stably transduced with shNT or shCD109. Arrows (right) show the injection site. The inset image (left) shows the core tumor area.
(D) Cell-cycle analysis of irradiated GSCs (6 Gy). The percentage of cells in the G2/M phase is indicated within each cell-cycle plot.
(E) Immunofluorescence images of γ-H2AX foci in shNT and shCD109 cells (left). Bars indicate the number of foci 24 h after IR. Black bars represent shNT; gray bars represent shCD109. Error bars indicate SEMs. *p < 0.05 and **p < 0.005.
(F) Annexin V and propidium iodide staining in GSC267 clones. The results are representative of 3 independent experiments.
(G) Kaplan-Meier survival curves for mice implanted with GSC20 cells with or without fractioned intracranial radiation (2.5 Gy, Å ~4).
Radiation caused no significant differences in the neurosphere formation rates of the control cells, whereas shCD109 significantly reduced neurosphere formation after radiation (Figure S5B). Because they lack functional p53, most GSCs preferentially exhibit the activation of the G2/M but not the G1/S checkpoint (Bhat et al., 2013; Hirose et al., 2001). After irradiation, the G2/M population consistently was modestly increased in shNT-infected cells but strongly induced in shCD109-infected cells (Figure 5D). We further examined H2AX phosphorylation (Ser 139), a marker of double-strand breaks, whose reduction reflects DNA damage repair (Furuta et al., 2003). Silencing CD109 dramatically increased γ-H2AX in cells with reduced CD109 in response to IR, suggesting a defective DNA damage repair capacity in cells lacking CD109 (Figure 5E). CD109 silencing substantially increased the proportions of annexin V+ and phosphatidylinositol-positive (PI+) cells in CD109high/MES GSCs and in GSC157/R, suggesting that CD109 protects GSCs from radiation-induced apoptosis (Figures 5F and S5C). In vivo, silencing CD109 reduced tumor formation latency (Figures 5G and S5D), which was further reduced upon IR (Figure 5G), confirming the importance of CD109 for the tumor-initiating properties of CD109high/MES GSCs. We note that the specific influence of sex of the mice on outcomes was not analyzed, but mice of both sexes were randomized into experimental groups.
Evolutionarily Conserved Regulation of YAP/TAZ Activity by CD109 in Gliomagenesis
To delineate the molecular mechanisms by which CD109 regulates tumor propagation in GSCs, we performed gene expression profiling on shCD109-infected GSCs. We examined several conserved pathways that play essential roles in gliomagenesis. We have previously shown that the Hippo signaling transcriptional co-activator TAZ promotes MES transition in GSCs (Bhat et al., 2011). In addition, CD109 and YAP/TAZ regulate some overlapping biological pathways in cancer (Hashimoto et al., 2004; Lian et al., 2010; Piccolo et al., 2014). Therefore, we examined the expression of YAP/TAZ targets in shCD109- and shNT-infected CD109high/MESGSCs. Several of the YAP/TAZ-associated genes were downregulated in the shCD109-infected cells compared with the shNT-infected cells (Figure 6A). Furthermore, gene set enrichment analysis showed positive enrichment of YAP/TAZ signaling in shNT-infected cells compared to shCD109 cells (Figure 6B). Reduction of the YAP/TAZ transcriptional activity was confirmed by the suppressed luciferase activity of the synthetic TEAD reporter (8xGTIIC-Luc) (Dupont et al., 2011) in shCD109-infected GSCs (Figure 6C). YAP/TAZ targets CTGF, CYR61, and ANKRD1 showed dramatically reduced expression, with a concomitant reduction of CD44, in shCD109-infected cells compared with control groups (Figure 6D), suggesting that CD109 regulates YAP/TAZ transcriptional activity. Western blotting showed a reduction of total and nuclear TAZ in shCD109-infected cells (Figures 6E and 6F). Silencing CD109 also reduced the total levels of YAP (Figure S6A), which was modest compared to the reduction of S127 phosphorylation, suggesting that CD109 can regulate YAP/TAZ independently of the Hippo signaling pathway (Figure S6A). Reduced TAZ and YAP expression was also observed in long-term cultured GSC157/R upon silencing CD109 (Figure S6B). Cycloheximide chase experiments showed that silencing CD109 destabilized TAZ (Figure S6C). These experiments demonstrate that CD109 acts upstream of the YAP/TAZ signaling pathway, which could contribute to the stem cell and tumor-promoting properties of CD109+ tumor cells. Of note, in contrast to a previous report (Chuang et al., 2017), CD109 silencing in GSCs did not reduce STAT3 expression (Figure S6D).
Figure 6. Evolutionarily Conserved Regulation of TAP/TAZ Activity by CD109 in Gliomagenesis.

(A) Scatterplot showing differential gene expression between GSCs infected with shNT or shCD109. Values indicate RNA-normalized intensities. Upregulated (red) and downregulated (blue) genes are included. The top genes related to the YAP/TAZ signature are labeled.
(B) Gene set enrichment analysis (GSEA) reveals a significant correlation of CD109 with YAP/TAZ pathway signatures.
(C) Relative luciferase activity in shNT- or shCD109-transduced GSC20 cells transfected with 8xGTIIC-Luc reporter. Data are the means ± SDs of 3 independent experiments. **p < 0.005.
(D) qPCR analysis of genes in GSC20 and GSC28 cells infected with shNT or shCD109. *p < 0.05, **p < 0.005. NS, not significant.
(E) Western blotting of total TAZ in GSC20 and GSC28 cells infected with shNT or shCD109. Actin was used as the loading control.
(F) Western blotting of nuclear TAZ in GSC20 cells infected with shNT or shCD109 (right). Lamin B was used as the loading control.
(G) Correlation of CD109 expression with YAP (left; adjusted R2, 0.3172; p < 2.2e–16) and TAZ (right; adjusted R2, 0.3135; p < 2.2e–16) in TCGA Agilent gene expression datasets for glioma.
(H) Yki expression (red, gray) in the larval CNS of the indicated genotypes. Glial cells are marked by GFP (green). Panels show comparison of DIAP1 expression in wild-type (repo > GFP), repo > GFP, PtenRNAi, RasV12, repo > GFP, PtenRNAi, RasV12, Tep1RNAi and repo > GFP, and Tep1RNAi larval brains.
Although the re-expression of TAZ in shCD109-infected clones was not successful in long-term culture, rescue by the overexpression of a constitutively active form of TAZ, 4SA, in these clones was able to reduce the increased number of γ-H2AX foci seen in shCD109-infected cells in response to IR (Figure S6E). This was abolished upon the overexpression of a 4SA mutant (4SA-S51A) that impedes TAZ entry into the nucleus (Bhat et al., 2011), indicating that at least the effect of CD109 on DNA damage repair capacity depends on nuclear TAZ. This is even more important, given the tight clinical correlation of CD109 with both YAP and TAZ in human GBMs (Figure 6G).
Finally, to assess the importance of CD109-driven YAP-TAZ signaling in vivo, we used a previously characterized Drosophila glioma initiation model and manipulated endogenous PI 3-kinase (PI3K) (UASPtenRNA) and exogenous oncogenic Ras (UASRasV12) in the larval brain (Cheng et al., 2016; Read, 2011). This tumor-initiation model enabled us to directly introduce mutations of the Tep1 gene (the Drosophila CD109 ortholog) into Drosophila glial neoplasms and test their effects on Yki (the Drosophila YAP/TAZ ortholog) (Bou Aoun et al., 2011; Fulford et al., 2018). Compared with wild-type larval brains, larval brains with Tep1 mutations had upregulated Yki expression during gliomagenesis (repo > GFP, PtenRNAi, RasV12) (Figures 6H and S6F). Genetic manipulation of Tep1 by RNA interference in normal glial cells (repo > Tep1RNAi) showed only a mild decrease in Yki levels (Figure 6H). In contrast, Tep1 elimination in glioma cells (repo > GFP, PtenRNAi, RasV12, Tep1RNAi) substantially reduced Yki and attenuated gliomagenesis in vivo (Figure 6H). Next, we tested whether Tep1 downregulation affects Yki activity by examining the expression levels of a transcriptional target of YKi, the Drosophila inhibitor of apoptosis protein 1 (Diap1) (Figure 6H) (Kango-Singh and Singh, 2009; Meng et al., 2016). Compared with wild-type larval brains, larval brains with Tep1 mutations had strongly induced Diap1 levels in glial neoplasms (Figure 6H), whereas Tep1 downregulation resulted in Diap1 downregulation. These data suggest that Tep1 (CD109 in human) affects Yki (YAP/TAZ in human) levels and activity and that the genetic targeting of Tep1 reduces gliomagenesis in vivo, possibly owing to the reduced Yki levels and activity (Figures 6H and S6G). Furthermore, the redundancy of Tep1-Yki interactions in Drosophila and CD109-YAP/TAZ interactions in human reflects an evolutionarily conserved signaling axis in glioma initiation (Figure S6H).
DISCUSSION
In this study, we report 4 major findings: (1) the existence of mutually exclusive GSCs with tumor initiating properties in the tumor core versus the edge; (2) gain of CD109 in tumor cells at the edge in response to IR; (3) IR induced pro-inflammatory response transcriptionally regulates CD109 via C/EBP-β; and (4) CD109 drives oncogenic signaling through the YAP/TAZ pathway.
We and others have described the concept of PN-to-MES transition in GBM both under the influence of the microenvironment and IR (Bhat et al., 2013; Halliday et al., 2014; Lau et al., 2015; Mao et al., 2013). The cells that escape stress induced by radiation, in particular, represent a phenotypically robust sub-population that could be targeted. Here, we demonstrate that these cells can be identified using CD109, which is expressed in both de novo MES and cells in GSCs that undergo IR-mediated MES transition. We further extend these observations to patient populations and show that an MES recurrence is associated with an increase in CD109 expression. In support of our findings, CD109 has been shown to be associated with MES-like GBM (Tso et al., 2006), and a recent study proposed CD109 as a cancer stem cell marker with a preferential enrichment of CD109+ tumor cells in the perivascular niche in high-grade gliomas (Shiraki et al., 2017).
During surgical resection of GBMs, most of the T1 gadoliniumenhancing portion of the lesion is removed, whereas the non-enhancing tumor edge tissue within the T2/FLAIR abnormality is largely, if not completely, left behind. These unresectable residual cells at the invading edge have long been hypothesized to contain the seeds of recurrence. A recent study showed molecular differences between the enhancing lesion, the necrotic core, and the enhancing margin in post-surgical tissues and the existence of PN and MES GSCs in a spatially restricted manner (Jin et al., 2017). Nonetheless, these 3 portions of the tumor are largely resectable. In this study, we demonstrate that properties of the non-enhancing FLAIR regions (outside the enhancing region) may contain functional, eloquent brain areas that surround infiltrating, recurrence-initiating tumor cells. Our findings show that these regions of the brain are enriched with CD133+ PN tumor cells that exhibit a rapid and substantial gain of CD109 immediately after IR. Both IR-induced and treatment-naive CD109+ cells are highly tumorigenic, recapitulating high-grade glioma features in mouse brain xenografts. Moreover, we found that CD109+ GSCs are radioresistant and that functional characterization of these cells could lead to the identification of therapeutic targets for overcoming radioresistance in GBM. Despite endogenous induction of CD109 in cells undergoing MES transition, it is noteworthy that the ectopic expression of CD109 in PN GSCs induced cell death (not shown). Although we are unable to pinpoint the exact reason for this observation, previous studies have demonstrated that the abrupt activation of MES regulators in epithelial cells has deleterious effects (Mani et al., 2007).
Another important facet of the present study is the molecular characterization of the mechanisms by which CD109 is transcriptionally controlled and the downstream oncogenic pathways that are regulated by this protein. We found that IR promotes the activation of NF-κB and induction of C/EBP-β, which in turn directly binds to the CD109 promoter to activate its transcription. Although CD109 appears to be regulated by proinflammatory mechanisms in GBM, studies with CD109 transgenic mice have revealed an anti-inflammatory role for CD109 (Vorstenbosch et al., 2013), which suggests that CD109 alters pathways in a tissue- and context-specific manner. Furthermore, our expression profiling analyses revealed that silencing CD109 did not affect the TGF-β or STAT3 signaling pathways (not shown). To the contrary, we found that CD109 acts upstream of YAP/TAZ and that silencing CD109 dramatically alters YAP/TAZ signaling. How CD109 affects YAP/TAZ functions and whether YAP/TAZ downregulation is required for CD109 oncogenic signaling remain to be determined. Given that recent studies have shown a requirement of GP130 in CD109-mediated lung metastases (Chuang et al., 2017) and that the GP130-Src-YAP axis is operational in inflammation (Taniguchi et al., 2015), we speculate that CD109 may regulate YAP/TAZ by binding to GP130. Nevertheless, our finding that altering CD109/Tep affects YAP/TAZ/Yki expression and activity and glioma growth in human and Drosophila glioma models suggests an evolutionarily conserved mechanism.
Given that radiation- and CD109 expression-induced gene signatures are associated with poor clinical outcomes and that CD109 drives oncogenesis via YAP/TAZ, for which pharmacological targets are emerging (Zanconato et al., 2016), our findings may inform the development of individualized subtype-specific therapeutics for patients with MES GBM and other MES cancers in the near future.
STAR*METHODS
CONTACT FOR REAGENT AND RESOURCE SHARING
Further information and requests for resources and reagents should be directed to and will be fulfilled by the Lead Contact, Dr. Krishna Bhat (kbhat@mdanderson.org).
EXPERIMENTAL MODEL AND SUBJECT DETAILS
In vivo animal studies
One week after guide screw implantation, 5 × 10⁵ or fewer (as indicated) GSCs were randomly distributed among and injected intracranially into groups of 4- to 5-week old Foxn1numice. Littermates of the same sex (all females) were randomly assigned to experimental groups of 5 mice each. Mice were subjected to fractionated radiation at the intensity of 2.5 Gy for 4 consecutive days (Nakano et al., 2011). All animal experiments were performed at The Ohio State University and MD Anderson Cancer Center under Institutional Animal Care and Use Committee –approved protocols according to NIH guidelines.
Human studies
Experiments involving human tissues were approved by The Ohio State University, MD Anderson Cancer Center, and University of Alabama at Birmingham Institutional Review Boards (approval #2005C0075, #LAB04-0001, #N151013001, and #N151014002). All studies involving human subjects were conducted after obtaining informed consent from the patients. Patient-derived specimens were provided to the corresponding scientists after de-identification of the original tumors. Because of the de-identification process, the information of the gender was not available. For the data downloaded from TCGA and IVY glioblastoma projects, data on gender of the patients is available online (https://portal.gdc.cancer.gov/;http://glioblastoma.alleninstitute.org/rnaseq/search/index.html).
Cell lines
Glioma spheres were established from 14 GBM patient samples (sample ID: GSC157, GSC84, GSC185A, GSC83, GSC267, GSC11, GSC20, GSC28, GSC23, GSC11, GSC1010, GSC1020, GSC1051, GSC1079) (Nakano et al., 2008; Dougherty et al., 2005; Gu et al., 2013; Mao et al., 2013; Bhat et al., 2013).
In brief, GSCs were isolated from patients undergoing surgery at Ohio State University (OSU), M.D. Anderson Cancer Center (MDACC) and University of Alabama at Birmingham (UAB) after de-identification. Because of the de-identification, the gender of the patients was unavailable. These cells were grown in neural basal medium (Dulbecco’s Modified Eagle Medium [DMEM]/F12 50/50; Cellgro or GIBCO) supplemented with B27 (Invitrogen or Militenyi), 20 ng/mL EGF (Chemicon or PeproTech), and 20 ng/mL FGF (Akron-Biotech or PeproTech). Phenotypic characterization of these GBM-derived neurosphere cultures has been previously established (Bhat et al., 2013; Miyazaki et al., 2012; Jijiwa et al., 2011; Mao et al., 2013). 293FT cell line was obtained from ATCC.
DROSOPHILA STOCKS
Transgenic Drosophila flies of the following genotypes (described in Flybase) were used: repoGAL4 UAS-GFP/TM3, Sb (Waghmare et al., 2014), UAS-ptenRNAi (BL# 8548), UAS-RasV12 (Karim and Rubin, 1999), UAS-Tep1RNAi(BL#32856), Tep1MI04262 (BL# 37420), UAS-Tep3RNAi (BL# 56020), and Tep2MI01299-GFSTF.2 (BL#59402). All Drosophila stocks and crosses were maintained at 25°C. Mutant and Transgenic Drosophila melanogaster stocks were maintained on standard cornmeal, molasses and agar medium. The genetic crossing scheme resulted in the induction of brain neoplasms (glioma) in both male and female larvae that showed no significant differences in glioma size, frequency or effects of Tep downregulation.
METHOD DETAILS
Viral infection
293FT cells were co-transfected with the pLKO.1 vector encoding the shRNA and the helper plasmids for virus production (psPAX2 and pMGD2) using calcium phosphate. Lentivirus was harvested 72 h after transfection, concentrated 100-fold using a Lenti-X concentrator, and stored at −80°C until infection. Lentivirus infection was performed with polybrene according to the manufacturer’s protocol. GSCs were infected with adenovirus expressing RFP and IκB-SR (Vector Biolabs) 48 h before irradiation or treatment with 10 μM TNFα. For the rescue experiment, shCD109-infected GSC20 cells were transduced with retroviral particles containing the pBABE vector expressing wild-type TAZ, 4SA, or 4SA-S51A. Forty-eight hours after infection, the cells were washed and selected in medium containing puromycin (4 μg/ml).
siRNA transfection
The transient knockdown of genes was performed using siRNA constructs targeting STAT3, C/EBP-β, or a non-targeting scrambled sequence. Cells were transfected with siRNAs using Lipofectamine 2000 according to manufacturer’s recommendations. The final siRNA concentration was 60 nM. Cells were irradiated 48 h after siRNA transfection, collected, and analyzed 72 h later.
RT-PCR
Total RNA was extracted and purified using the QIAGEN RNeasy Mini Kit according to the manufacturer’s instructions. RNA quality and concentration were determined using a Nanodrop. Total RNA (0.5-1 μg) was reverse-transcribed in cDNA that was then amplified by oligonucleotide genes specific via Sybr Green method or through taqman assay. The fluorescent signal was measured using the Viia7 Real-Time PCR software program and the relative fold changes were calculated using the absolute δδCt method.
Western blot
Proteins were extracted from GSCs using 0.5% NP-40 lysis buffer containing 50 mM Tris-HCl (pH 7.5), 150 mM NaCl, and 50 mM NaF supplemented with protease inhibitors and phenylmethylsulfonyl fluoride just before use. Protein concentrations were determined using the Bradford method. For the nuclear fractionation the cell pellet was resuspended in 1 mL of RSB buffer (0.01 M Tris–HCl, 0.01 M NaCl, 1.5 mM MgCl2, pH 7.4) and placed on ice for 10 min. Swollen cells were then collected by centrifugation at 1500 rpm for 8 min, and resuspended in 1 mL of RSB buffer containing 0.5% NP-40. Cell membranes were then broken using a Dounce homogenizer (tight pestle) by 10 up and down strokes. Nuclei (pellet) were collected by centrifugation at 1500 rpm for 8 min and resuspended in NP-40 with proteinase and phosphatase inhibitor (1:100) (Bhat et al., 2004). Western blot analysis was performed using standard protocols.
Immunohistochemistry and Immunofluorescence
Paraffin-embedded human glioblastoma (GBM) specimens were obtained from the Institutional Tissue Bank at The Ohio State University and cut into 5-μm sections. Mouse brains were perfused with ice-cold phosphate-buffered saline (PBS) then fixed in 4% PFA for 24-48 h and transferred into 10% formalin. Paraffin-embedded tissues were cut into 10-μm sections and incubated with the primary antibodies overnight at 4°C. For immunohistochemistry, brain sections were incubated with a horseradish peroxidase–conjugated secondary antibody for 1 h at room temperature. Signals were detected using a DAB substrate kit, and nuclei were counterstained with hematoxylin. For immunofluorescence, brain sections were incubated with a fluorescent-conjugated secondary antibody for 1 h at room temperature. Nuclei were counterstained with Hoechst 33342.
γ-H2AX assay
Cells were placed in chamber slides and covered with laminin/poly-L-ornithine-coated coverslips 24 h prior to treatments. At the indicated times, the cells were fixed in 4% paraformaldehyde, permeabilized with 0.5% Triton-X/PBS, and stained with an anti-γ-H2AX antibody (1:500) according to standard protocols and anti-rabbit conjugated Alexa 594 secondary antibody was used to detect the foci. The foci in at least 25 nuclei for each group were counted.
Single cell motility assay
Single cell motility under guided migration conditions on microtextured polydimethylsiloxane (PDMS) surfaces was monitored for approximately 20 h (Gallego-Perez et al., 2012; Petrie et al., 2009). The PDMS surfaces were fabricated using a simple replica-molding process with a photolithographically fabricated Si master mold (Gallego-Perez et al., 2012). Briefly, a mixture of PDMS and curing agent at a 10:1 ratio was spin-coated onto a patterned Si wafer at 300-500 rpm for 1 min. The PDMS was allowed to cure at room temperature for > 48 h and then removed from the master mold. Circular, 12-mm-diameter specimens of patterned PDMS were cut out and affixed to the bottoms of 12-well plates prior to sterilization with 70% ethanol. The cells were then plated and allowed to adhere and spread for a few hours on the patterned PDMS surfaces in serum-containing, heparin-free medium. Cell motility was then traced using time-lapse microscopy with an Eclipse Ti-E microscope (Nikon) fitted with a stage cell culture chamber (Okolab). Images were collected every 10 min, and quantitative cell migration analysis was performed through image processing using the manual tracker plugin in Fiji.
Nanochannel-based electroporation-based transfection of molecular beacon probes
Three-dimensional nanochannel-based electroporation (NEP) chips were fabricated on silicon wafers using semiconductor cleanroom techniques that included KOH etching, which reduces the wafer thickness to 250 μm; ultraviolet photolithography (projection/contact photolithography), which generates an array of nanochannels (with diameters of 300-500 nm) with 25-μm spacing; and deep reactive ion-etch for high-aspect-ratio (> 40) nanochannel etching (Boukany et al., 2011; Chang et al., 2015; Zhao et al., 2015). Before the cell experiment, the NEP chips were sterilized with 70% ethanol and overnight exposure to ultraviolet light. Concentrations of CD133-MB (200 nM) and CD109-MB (100 nM), optimized for monitoring CD133 and CD109 mRNA levels via fluorescence imaging, were pre-mixed, and then approximately 100 μL of mixed MB solution was pipetted into the electroporation reagent reservoir. Irradiated single cells (~100,000 cells/ ml in suspension) were placed onto an engineered array of nanochannels that focused the porating electric field (electroporation voltage, 100 V; pulse duration, 10 ms; 2 pulses) to a corresponding area on the cell membrane, leading to the uniform and benign NEP-based transfection of irradiated cells with MBs. Cells were transferred from the incubator to an on-stage cell culture chamber (Okolab) 1 h after transfection. Time-lapse in vitro live cell imaging was then performed using an inverted microscope system (Eclipse Ti-E, Nikon) equipped with a motorized stage and electron multiplying charge-coupled device camera (Evolve, Photometrics).
Luciferase assay
For the luciferase assay, GSCs were transfected with 8x GTIIC-luciferase and pRL-TK Renilla as the luciferase control reporter vector using Lipofectamine 2000. Assays were performed 36 h after transfection, and the activities of firefly luciferase and Renilla luciferase were quantified using the dual reporter luciferase assay. The firefly luciferase signals were normalized to those of the internal Renilla luciferase control. Transfections were done in triplicate in 2 independent experiments.
Chromatin immunoprecipitation
A chromatin immunoprecipitation (ChIP) assay was performed after cross-linking cells using formaldehyde. DNA was sonicated using a GE130 ultrasonic processor (Sorvall) for 3 cycles of 15 pulses each at 50% power with a 1-min interval between cycles. The sonicated DNA was then centrifuged at 13,500 rpm at 4°C. The supernatant from 100,000 cells was used for each ChIP assay using the MAGnify ChIP system (Invitrogen). Two micrograms of the mouse IgG C/EBP-β was used per ChIP. Immunoprecipitated DNA was analyzed by Taqman PCR, and Ct values were used to calculate the percentage of input enrichment. Three set of primers for C/EBP-β and STAT-3 have been designed on the human CD109 promoter sequence browsed from pubmed, using Primer3Plus software program and following the guidelines reported in the MAGnify ChIP system.
Cell cycle analysis
GSCs were pelleted by centrifugation and dissociated with Accutase (Sigma) using a 1 mL sterile pipette. Cells were then washed with PBS to remove Accutase, resuspended in 1 mL of cold PBS, and fixed with 2 mL of 100% pre-cooled ethanol. After fixation overnight, cells were resuspended and washed with fluorescence-activated cell sorting (FACS) buffer (0.5% bovine serum albumin and 25 mM ethylenediaminetetraacetic acid in PBS). Cell pellets were then re-suspended in 800 μl of FACS buffer containing 20 μl of RNase A (10 mg/ml) and incubated at 37°C for 30 min. After incubation, the cells were treated with 50 μl of propidium iodide (500 g/ml); cell cycle analysis was performed using a FACS BD Accuri C6 plus flow cytometer (BD Biosciences), and propidium iodide incorporation was estimated using the BD Accuri C6 plus software program. For each measurement, at least 10,000 cells were acquired. Cell cycle analysis was performed using the Flowjo software program (Tree Star Inc.).
Data and software used
For the comparison of the gene expression signatures in the tumor core and invading regions, supervised clustering of RNA-seq data from the Ivy Glioblastoma Atlas Project (GEO: GSE107559). Tumors were classified as proneural (PN), mesenchymal (MES), or classic (CL) using gene signatures (Verhaak et al., 2010).
RNA-seq and Agilent microarray data were downloaded from the Genomic Data Commons for the GBM and low grade glioma datasets (https://portal.gdc.cancer.gov/). Data were processed using R and Bioconductor (Bhat et al., 2011). Normal tissue, and primary and recurrent tumor determination was derived from the TCGA sample code, and GBM subtype was determined using previously defined subtype signatures (Verhaak et al., 2010).
Heatmap and clustering were performed with Cluster 3.0 software using the Pearson correlation coefficient (http://bonsai.hgc.jp/~mdehoon/software/cluster/).The microarray data for sh-NT versus sh-CD109 have been deposited (GEO: GSE113149). GSEA was performed using web-based tools (http://software.broadinstitute.org/gsea/) to analyze the enrichment of signaling target genes. The DNA binding motif analyses was performed using publicly available software (LASAGNA, ConTra V2, and TRAP)(Broos et al., 2011; Lee and Huang, 2013; Thomas-Chollier et al., 2011).
Drosophila samples, immunofluorescence and imaging
All Drosophila stocks and crosses were maintained at 25°C.
Immunohistochemistry was done using a protocol described previously (Varelas et al., 2008). The primary antibodies were rabbit anti-Yki (1:400; a gift from K. Irvine), mouse anti-DIAP1 (1:100; a gift from B. Hay), rabbit anti-b-gal (1:100; Invitrogen), and rabbit anti-dMyc (1:100; Santa Cruz Biotechnology). The secondary antibodies were donkey anti-mouse or anti-rabbit IgG conjugated to Cy3 (1:200; Jackson ImmunoResearch). Samples were imaged using an Olympus Fluoview 1000 confocal microscope, and the images were edited using Adobe Photoshop CS6.0. Brain lobe size in pixels was measured using the histogram function of Adobe Photoshop CS6.0. Data are presented as the means and standard deviations calculated for each sample. A 2-tailed t test performed with Excel 2013 was used to determine whether the observed differences were significant (p < 0.05).
QUANTIFICATION AND STATISTICAL ANALYSIS
For most experiments, p values were calculated in Microsoft Excel using a two-tailed Student t test which can be found in the individual figures and figure legends. 1-way ANOVA was also used for multiple comparisons using SPSS 17.0 software (IBM). p values less than 0.05 were considered significant. In one case (Figure 6D), the difference in the expression of ANKRD1 did not meet statistical significance. Cell culture experiments were performed with an n > 3 and are indicated in the figure legends. In vivo studies with mouse model have been performed using n = 5 mice/condition as indicated in the figure legends. Error bars in graphs are defined in the figure legends and represent the mean ± SD (standard deviation). Log-rank analysis was used to assess differences in survival rates/durations. Although the influence of sex on outcomes were not specifically analyzed, mice of either sex were randomized into each experimental group.
The Kaplan-Meier method was used to analyze mouse and human survival data using the Graph Pad Prism software program. For the comparison of CD109 and CD133 expression in matched primary and recurrent GBMs, RNA-seq data from previously published datasets (Kim et al., 2015) were processed and analyzed. Among the 840 marker genes (Verhaak et al., 2010), 787 annotated genes were used to classify the GBM subtypes of 46 longitudinal samples. Delta values of these genes were calculated using CD133 and CD109 expression in longitudinal samples (delta value = rpkm in recurrent tumor-rpkm in primary tumor). For the gene set enrichment analysis (GSEA), a T score (adjusted from the t test) for each gene between primary and recurrent tumors was obtained and used to create an .rnk file to rank all genes based on their scores. The generated .rnk file was then used as an input for GSEA Preranked software. In addition, single-sample GSEA was applied to determine the enrichment score of the MES gene set (216 genes) of 46 longitudinal samples.
For the comparison of PN and MES signatures in GSCs and the comparison of these signatures with those of clinical GBM samples, Affymetrix Expression arrays were used for GSC signatures and compared with previously published GSE67089 datasets in the NCMI Gene Expression Omnibus (Mao et al., 2013). We selected the top 2,838 differentially expressed genes (1,347 upregulated and 1,419 downregulated genes with expression level changes of at least 3-fold in at least 5 of 9 total conditions) as features that represent GBM tumors from TCGA and performed hierarchical clustering analyses. For the comparison of parental and irradiated PN cells and the comparison of shNT- and shCD109-infected cells gene expression microarray data were preprocessed and normalized with Affymetrix Expression Console software (V1.2.1) using the RNA sketch method.
For the comparison of CD109 expression in human GBMs, RNA-seq and Agilent data for the GBM and low-grade glioma datasets were downloaded from the Genomic Data Commons (https://portal.gdc.cancer.gov/). Data were processed using R and Bioconductor (http://www.R-project.org). For microarray of GSCs, differentially expressed genes were identified using fold change (Mao et al., 2013, GSE67089). Double-clustering (independently clustering samples and genes) was performed on all 5,475 differentially expressed genes and 27 samples using hclust function of the R statistical software package, in which Euclidean distance and average linkage were used as similarity metrics for the clustering method. Differentially expressed genes were further compared to all pathways listed in KEGG, and an enrichment p-value for each pathway was calculated using the Fisher exact test. Pathways that had a p-value of less than 0.05 were considered significantly enriched.
Supplementary Material
KEY RESOURCES TABLE
| REAGENT or RESOURCE | SOURCE | IDENTIFIER |
|---|---|---|
| Antibodies | ||
| Human PE-conjugated anti-CD109 | R&D | FAB4385P; RRID: AB_10643402 |
| Human APC-conjugated anti-CD133 | Miltenyi Biotec | Cat# 130-090-826; RRID: AB_244340 |
| Mouse IgG1 Isotype control (clone 11711) | R&D | Cat# MAB002; RRID: AB_357344 |
| CD109 | Santa Cruz | Cat# Sc-271085; RRID: AB_10610041 |
| ALDH1A3 | Sigma | Cat# ABN427; RRID: AB_2783547 |
| CD44 | Cell Signaling | Cat# 3578; RRID: AB_2076463 |
| p21 | Santa Cruz | Cat# 56335; RRID: AB_785023 |
| TAZ | Cell Signaling | Cat# V386; RRID: AB_1904158 |
| YAP | Cell Signaling | Cat# D24E4; RRID: AB_10950494 |
| p-YAP127 | Cell Signaling | Cat# D9W21; RRID: AB_2650553 |
| C/EBP-β | Santa Cruz | Cat# sc-150; RRID: AB_2260363 |
| β-actin | Santa Cruz | Cat# 477758; RRID: AB_626632 |
| GAPDH | Abcam | Cat# ab9483; RRID: AB_307273 |
| N-cadherin | BD Biosciences | Cat# 610920; RRID: AB_2077527 |
| Vimentin | DAKO | Cat# M0725; RRID: AB_10015203 |
| OLIG2 | Millipore | Cat# AB9610; RRID: AB_570666 |
| Human specific nuclear antigen | Millipore | Cat# MAB1273; RRID: AB_94052 |
| rabbit anti-Yki | a gift from K. Irvine | N/A |
| mouse anti-DIAP1 | a gift from B. Hay | N/A |
| rabbit anti-β-gal | Invitrogen | Cat# A-5790; RRID: AB_2536194 |
| anti-Myc | Santa Cruz Biotechnology | Cat# SC-40; RRID: AB_627268 |
| donkey anti-mouse or anti-rabbit IgG conjugated to Cy3 | Jackson ImmunoResearch | Cat# 715-165-150; 711-165-152; RRID:2340813, RRID:2307443 |
| anti-γ-H2AX | R&D system | Cat# MAB3406; RRID: AB_2114988 |
| IgG C/EBP-γ | Abcam | Cat # ab15050; RRID: AB_301598 |
| Bacterial and virus strains | ||
| Adenovirus RFP | Vector Biolabs | Cat# 1660 |
| Adenovirus IκB-SR | Vector Biolabs | N/A |
| Chemicals, Peptides, and Recombinant Proteins | ||
| TNFα | Sigma Aldrich | Cat# SRP3177 |
| Hoechst 33342 | Sigma | Cat# 14533 |
| Propidium Iodide | Sigma | Cat# P4170 |
| Critical Commercial Assays | ||
| Proteinase inhibitor | Roche | Cat# P8340 |
| Lipofectamine 2000 | Invitrogen | Cat# 11668019 |
| RNeasy Mini kit | QIAGEN | Cat# 74104 |
| Syber Green master mix | Applied Biosystems | Cat# 4385612 |
| Accutase | Sigma | Cat# A6964 |
| 1 × Taqman Universal PCR Master Mix | Applied Biosystems | Cat# 4369016 |
| Lenti-X concentrator | Clontech | Cat# 631231 |
| Calcium phosphate transfection kit | Clontech | Cat# 631312 |
| iScript Reverse Transcription Supermix | Biorad | Cat# 17008840 |
| Dual reporter luciferase assay | Promega | Cat# E1910 |
| MAGnify ChIP system | Invitrogen | Cat# 492024 |
| Experimental Models: Cell Lines | ||
| GSC157 | Established from GBM patient samples | Bhat et al., 2013; Dougherty et al., 2005; Gu et al., 2013; Mao et al., 2013; Nakano et al., 2011 |
| GSC84 | Established from GBM patient samples | Bhat et al., 2013; Dougherty et al., 2005; Gu et al., 2013; Mao et al., 2013; Nakano et al., 2011 |
| GSC185A | Established from GBM patient samples | Bhat et al., 2013; Dougherty et al., 2005; Gu et al., 2013; Mao et al., 2013; Nakano et al., 2011 |
| GSC83 | Established from GBM patient samples | Bhat et al., 2013; Dougherty et al., 2005; Gu et al., 2013; Mao et al., 2013; Nakano et al., 2011 |
| GSC267 | Established from GBM patient samples | Bhat et al., 2013; Dougherty et al., 2005; Gu et al., 2013; Mao et al., 2013; Nakano et al., 2011 |
| GSC11 | Established from GBM patient samples | Bhat et al., 2013; Dougherty et al., 2005; Gu et al., 2013; Mao et al., 2013; Nakano et al., 2011 |
| GSC20 | Established from GBM patient samples | Bhat et al., 2013; Dougherty et al., 2005; Gu et al., 2013; Mao et al., 2013; Nakano et al., 2011 |
| GSC28 | Established from GBM patient samples | Bhat et al., 2013; Dougherty et al., 2005; Gu et al., 2013; Mao et al., 2013; Nakano et al., 2011 |
| GSC23 | Established from GBM patient samples | Bhat et al., 2013; Dougherty et al., 2005; Gu et al., 2013; Mao et al., 2013; Nakano et al., 2011 |
| GSC1010 | Established from GBM patient samples | Bhat et al., 2013; Dougherty et al., 2005; Gu et al., 2013; Mao et al., 2013; Nakano et al., 2011 |
| GSC1020 | Established from GBM patient samples | Bhat et al., 2013; Dougherty et al., 2005; Gu et al., 2013; Mao et al., 2013; Nakano et al., 2011 |
| GSC1071 | Established from GBM patient samples | Bhat et al., 2013; Dougherty et al., 2005; Gu et al., 2013; Mao et al., 2013; Nakano et al., 2011 |
| GSC1079 | Established from GBM patient samples | Bhat et al., 2013; Dougherty et al., 2005; Gu et al., 2013; Mao et al., 2013; Nakano et al., 2011 |
| 293FT | ATCC | CRL-1573 |
| Experimental Models: Organisms/Strains | ||
| Mouse: Foxn1nu | ERO | N/A |
| Drosophila: repoGAL4 UAS-GFP/TM3 | Flybase | N/A |
| Drosophila: Sb | Flybase | Waghmare et al., 2014 |
| Drosophila: UAS-ptenRNAi | Flybase | BL# 8548 |
| Drosophila: UAS-RasV12 | Flybase | Karim and Rubin, 1999 |
| Drosophila: UAS-Tep1RNAi | Flybase | BL#32856 |
| Drosophila: Tep1MI04262 | Flybase | BL# 37420 |
| Drosophila: UAS-Tep3RNAi | Flybase | BL# 56020 |
| Drosophila: Tep2MI01299-GFSTF.2 | Flybase | BL#59402 |
| Oligonucleotides | ||
| Refer to Table S3 for RT-PCR primers | This paper | N/A |
| Refer to Table S4 for Chip primers | This paper | N/A |
| siRNA targeting sequences against STAT3 and C/EBP-β | Dharmacon | Cat # E-003544-00-0005; E-006423-00-0005 |
| CD109 (CD109 – MB): 5′-Cy5-CGCGATC-[+A]TA[+T]AG[+G]CT[+G]TA[+A]GT[+G]TT[+A]CT[+G]GA-GATCGCG-BHQ3-3′ | Sigma-Aldrich | N/A |
| (CD133 – MB): 5′-FAM-CGCGATC-[+T]CA[+T]CC[+T]TG[+A]AT[+A]GT[+G]AT[+G]GAC-GATCGCG-BHQ1-3′ | Sigma-Aldrich | N/A |
| (scramble MBs) targeting cel-miR-39: 5′-Cy5-CGCGATC[+C]AA[+G]CU[+G]AU[+U]UA[+C]AC[+C]CG[+G]UGA-GATCGCG-BHQ3-3′; | Sigma-Aldrich | N/A |
| (scramble MBs) targeting cel-miR-39: 5′-FAM-CGCGATC[+C]AA[+G]CU[+G]AU[+U]UA[+C]AC[+C]CG[+G]UGA-GATCGCG-BHQ1-3′ | Sigma-Aldrich | N/A |
| Recombinant DNA | ||
| 8xGTIIC-luciferase | Dupont et al., 2011 | Cat# 34615 |
| pRL-TK Renilla | This paper | |
| pLKO.1 shCD109 | Sigma | Cat# SHCLND-NM_133493 |
| pLKO.1 shscramble | Sigma | Cat# SHC007 |
| pBABE vector | Bhat et al., 2011 | Donated by Dr Kun-Lian Guan |
| pBABE TAZ | Bhat et al., 2011 | Donated by Dr Kun-Lian Guan |
| pBABE 4SA | Bhat et al., 2011 | Donated by Dr Kun-Lian Guan |
| pBABE 4SA-S51A | Bhat et al., 2011 | Donated by Dr Kun-Lian Guan |
| Software and Algorithms | ||
| ELDA | web | http://bioinf.wehi.edu.au/software/elda/ |
| SPSS 17.0 software | IBM | https://www.ibm.com/analytics/spss-statistics-software |
| Viia7 Real-Time PCR | Applied Biosystem | https://www.thermofisher.com/us/en/home/life-science/pcr/real-time-pcr/real-time-pcr-instruments/viia-7-real-time-pcr-system.html |
| BD Accuri C6 plus | BD Biosciences | http://www.bdbiosciences.com/us/instruments/research/cell-analyzers/bd-accuri/m/1294932/overview |
| Flowjo software program | Tree Star | https://www.flowjo.com/ |
| Other | ||
| Nanodrop 2000 UV-Vis Spectrophotometer | Thermo Scientific | https://www.thermofisher.com/order/catalog/product/ND-2000 |
| Primer3Plus | web | https://primer3plus.com/cgi-bin/dev/primer3plus.cgi |
| LASAGNA | web | https://academic.oup.com/bioinformatics/article/30/13/1923/2422166 |
| TRAP | web | http://trap.molgen.mpg.de/ |
| Con Tra V2 | web | http://bioit2.irc.ugent.be/contra/v3/#/step/1 |
| Affymetrix Expression Console software (V1.2.1) | ThermoFisher Scientific | https://www.thermofisher.com/us/en/home/life-science/microarray-analysis/microarray-analysis-instruments-software-services/microarray-analysis-software/affymetrix-transcriptome-analysis-console-software.html |
| Cluster 3.0 | web | https://www.geo.vu.nl/~huik/cluster.htm |
Highlights.
Distinct types of GSCs exist in the GBM core versus the invasive edge
Gain of CD109 in tumor cells occurs at the invasive edge in response to IR
IR induced pro-inflammatory response transcriptionally regulates CD109 via C/EBP-β
CD109 drives oncogenic signaling through the YAP/TAZ pathway
ACKNOWLEDGMENTS
We thank the members of the Nakano and Bhat laboratories for their helpful suggestions. This work was supported by NIH/National Cancer Institute (NCI) grants P01 CA163205 and R21 CA175875 and NIH/National Institute of Neurological Disorders and Stroke (NINDS) grants R01 NS083767 and R01 NS087913, to I.N.; MD Anderson Institutional startup funds, the Sister Institution Network Fund from the Global Academic Programs, and an institutional research grant from the University Cancer Foundation, M.D. Anderson Cancer Centerto K.P.B.; NIH CA158911,NS093843, NS095634, and R00LM011673, to S.L.; and Russian Foundation for Basic Research grants 17-29-06056 and 18-29-01027, to M.S.P. We would like to acknowledge the Department of Scientific Publications, University of Texas (UT) MD Anderson Cancer Center for proofreading the manuscript.
Footnotes
DECLARATION OF INTERESTS
The authors declare no competing interests.
SUPPLEMENTAL INFORMATION
Supplemental Information includes six figures, four tables, and two videos and can be found with this article online at https://doi.org/10.1016/j.celrep.2019.01.076.
REFERENCES
- Alexander BM, Ligon KL, and Wen PY (2013). Enhancing radiation therapy for patients with glioblastoma. Expert Rev. Anticancer Ther 13, 569–581. [DOI] [PubMed] [Google Scholar]
- Bao S, Wu Q, McLendon RE, Hao Y, Shi Q, Hjelmeland AB, Dewhirst MW, Bigner DD, and Rich JN (2006). Glioma stem cells promote radioresistance by preferential activation of the DNA damage response. Nature 444, 756–760. [DOI] [PubMed] [Google Scholar]
- Bhat KP, Itahana K, Jin A, and Zhang Y (2004). Essential role of ribosomal protein L11 in mediating growth inhibition-induced p53 activation. EMBO J. 23, 2402–2412. [DOI] [PMC free article] [PubMed] [Google Scholar]
- Bhat KP, Salazar KL, Balasubramaniyan V, Wani K, Heathcock L, Hollingsworth F, James JD, Gumin J, Diefes KL, Kim SH, et al. (2011). The transcriptional coactivator TAZ regulates mesenchymal differentiation in malignant glioma. Genes Dev. 25, 2594–2609. [DOI] [PMC free article] [PubMed] [Google Scholar]
- Bhat KPL, Balasubramaniyan V, Vaillant B, Ezhilarasan R, Hummelink K, Hollingsworth F, Wani K, Heathcock L, James JD, Goodman LD, et al. (2013). Mesenchymal differentiation mediated by NF-κB promotes radiation resistance in glioblastoma. Cancer Cell 24, 331–346. [DOI] [PMC free article] [PubMed] [Google Scholar]
- Bhatti S, Kozlov S, Farooqi AA, Naqi A, Lavin M, and Khanna KK (2011). ATM protein kinase: the linchpin of cellular defenses to stress. Cell. Mol. Life Sci 68, 2977–3006. [DOI] [PMC free article] [PubMed] [Google Scholar]
- Bizet AA, Tran-Khanh N, Saksena A, Liu K, Buschmann MD, and Philip A(2012). CD109-mediated degradation of TGF-p receptors and inhibition of TGF-p responses involve regulation of SMAD7 and Smurf2 localization and function. J. Cell. Biochem 113, 238–246. [DOI] [PubMed] [Google Scholar]
- Bou Aoun R, Hetru C, Troxler L, Doucet D, Ferrandon D, and Matt N (2011). Analysis of thioester-containing proteins during the innate immune response of Drosophila melanogaster. J. Innate Immun 3, 52–64. [DOI] [PMC free article] [PubMed] [Google Scholar]
- Boukany PE, Morss A, Liao WC, Henslee B, Jung H, Zhang X, Yu B, Wang X, Wu Y, Li L, et al. (2011). Nanochannel electroporation delivers precise amounts of biomolecules into living cells. Nat. Nanotechnol 6, 747–754. [DOI] [PubMed] [Google Scholar]
- Brooks MD, Burness ML, and Wicha MS (2015). Therapeutic Implications of Cellular Heterogeneity and Plasticity in Breast Cancer. Cell Stem Cell 17, 260–271. [DOI] [PMC free article] [PubMed] [Google Scholar]
- Broos S, Hulpiau P, Galle J, Hooghe B, Van Roy F, and De Bleser P (2011). ConTra v2: a tool to identify transcription factor binding sites across species, update 2011. Nucleic Acids Res. 39, W74–W78. [DOI] [PMC free article] [PubMed] [Google Scholar]
- Brown TJ, Brennan MC, Li M, Church EW, Brandmeir NJ, Rakszawski KL, Patel AS, Rizk EB, Suki D, Sawaya R, and Glantz M (2016). Association of the Extent of Resection With Survival in Glioblastoma: A Systematic Review and Meta-analysis. JAMA Oncol. 2, 1460–1469. [DOI] [PMC free article] [PubMed] [Google Scholar]
- Carro MS, Lim WK, Alvarez MJ, Bollo RJ, Zhao X, Snyder EY, Sulman EP, Anne SL, Doetsch F, Colman H, et al. (2010).Thetranscriptional network for mesenchymal transformation of brain tumours. Nature 463, 318–325. [DOI] [PMC free article] [PubMed] [Google Scholar]
- Chang L, Gallego-Perez D, Zhao X, Bertani P, Yang Z, Chiang CL, Malkoc V, Shi J, Sen CK, Odonnell L, et al. (2015). Dielectrophoresis-assisted 3D nanoelectroporation for non-viral cell transfection in adoptive immunotherapy. Lab Chip 15, 3147–3153. [DOI] [PubMed] [Google Scholar]
- Cheng P, Wang J, Waghmare I, Sartini S, Coviello V, Zhang Z, Kim SH, Mohyeldin A, Pavlyukov MS, Minata M, et al. (2016). FOXD1-ALDH1A3 Signaling Isa Determinant for the Self-Renewal and Tumorigenicity of Mesenchymal Glioma Stem Cells. Cancer Res. 76, 7219–7230. [DOI] [PMC free article] [PubMed] [Google Scholar]
- Chuang CH, Greenside PG, Rogers ZN, Brady JJ, Yang D, Ma RK, Caswell DR, Chiou SH, Winters AF, Gruner BM, et al. (2017). Molecular definition of a metastatic lung cancer state reveals a targetable CD109-Janus kinase-Stat axis. Nat. Med 23, 291–300. [DOI] [PMC free article] [PubMed] [Google Scholar]
- Claes A, Idema AJ, and Wesseling P (2007). Diffuse glioma growth: a guerilla war. Acta Neuropathol. 114, 443–458. [DOI] [PMC free article] [PubMed] [Google Scholar]
- Clevers H (2011). The cancer stem cell: premises, promises and challenges. Nat. Med 17, 313–319. [DOI] [PubMed] [Google Scholar]
- Dougherty JD, Garcia AD, Nakano I, Livingstone M, Norris B, Polakiewicz R, Wexler EM, Sofroniew MV, Kornblum HI, and Geschwind DH (2005). PBK/TOPK, a proliferating neural progenitor-specific mitogen-activated protein kinase kinase. J. Neurosci 25, 10773–10785. [DOI] [PMC free article] [PubMed] [Google Scholar]
- Dupont S, Morsut L, Aragona M, Enzo E, Giulitti S, Cordenonsi M, Zanconato F, Le Digabel J, Forcato M, Bicciato S, et al. (2011). Role of YAP/TAZ in mechanotransduction. Nature 474, 179–183. [DOI] [PubMed] [Google Scholar]
- Fulford A, Tapon N, and Ribeiro PS (2018). Upstairs, downstairs: spatial regulation of Hippo signalling. Curr. Opin. Cell Biol 51, 22–32. [DOI] [PubMed] [Google Scholar]
- Furuta T, Takemura H, Liao ZY, Aune GJ, Redon C, Sedelnikova OA, Pilch DR, Rogakou EP, Celeste A, Chen HT, et al. (2003). Phosphorylation of histone H2AX and activation of Mre11, Rad50, and Nbs1 in response to replication-dependent DNA double-strand breaks induced by mammalian DNA topoisomerase I cleavage complexes. J. Biol. Chem 278, 20303–20312. [DOI] [PubMed] [Google Scholar]
- Gallego-Perez D, Higuita-Castro N, Denning L, DeJesus J, Dahl K, Sarkar A, and Hansford DJ (2012). Microfabricated mimics of in vivo structural cues for the study of guided tumor cell migration. Lab Chip 12, 4424–4432. [DOI] [PubMed] [Google Scholar]
- Ghinda D, Zhang N, Lu J, Yao CJ, Yuan S, and Wu JS (2016). Contribution of combined intraoperative electrophysiological investigation with 3-T intraoperative MRI for awake cerebral glioma surgery: comprehensive review of the clinical implications and radiological outcomes. Neurosurg. Focus 40, E14. [DOI] [PubMed] [Google Scholar]
- Gu C, Banasavadi-Siddegowda YK, Joshi K, Nakamura Y, Kurt H, Gupta S, and Nakano I (2013). Tumor-specific activation of the C-JUN/MELK pathway regulates glioma stem cell growth in a p53-dependent manner. Stem Cells 31, 870–881. [DOI] [PMC free article] [PubMed] [Google Scholar]
- Halliday J, Helmy K, Pattwell SS, Pitter KL LaPlant Q, Ozawa T, and Holland EC (2014). In vivo radiation response of proneural glioma characterized by protective p53 transcriptional program and proneural-mesenchymal shift. Proc. Natl. Acad. Sci. USA 111, 5248–5253. [DOI] [PMC free article] [PubMed] [Google Scholar]
- Hambardzumyan D, Squatrito M, and Holland EC (2006). Radiation resistance and stem-like cells in brain tumors. Cancer Cell 10, 454–456. [DOI] [PubMed] [Google Scholar]
- Haregewoin A, Solomon K, Hom RC, Soman G, Bergelson JM, Bhan AK, and Finberg RW (1994). Cellular expression ofa GPI-linked T cell activation protein. Cell. Immunol 156, 357–370. [DOI] [PubMed] [Google Scholar]
- Hashimoto M, Ichihara M, Watanabe T, Kawai K, Koshikawa K, Yuasa N, Takahashi T, Yatabe Y, Murakumo Y, Zhang JM, et al. (2004). Expression of CD109 in human cancer. Oncogene 23, 3716–3720. [DOI] [PubMed] [Google Scholar]
- Hirose Y, Berger MS, and Pieper RO (2001). p53 effects both the duration of G2/M arrest and the fate of temozolomide-treated human glioblastoma cells. Cancer Res. 61, 1957–1963. [PubMed] [Google Scholar]
- Huang TT, Wuerzberger-Davis SM, Wu ZH, and Miyamoto S (2003). Sequential modification ofNEMO/IKKgamma bySUMO-1 and ubiquitin mediates NF-kappaB activation by genotoxic stress. Cell 115, 565–576. [DOI] [PubMed] [Google Scholar]
- Jijiwa M, Demir H, Gupta S, Leung C, Joshi K, Orozco N, Huang T, Yildiz VO, Shibahara I, de Jesus JA, et al. (2011). CD44v6 regulates growth of brain tumor stem cells partially through the AKT-mediated pathway. PLoS One 6, e24217. [DOI] [PMC free article] [PubMed] [Google Scholar]
- Jin X, Kim LJY, Wu Q, Wallace LC, Prager BC, Sanvoranart T, Gimple RC, Wang X, Mack SC, Miller TE, et al. (2017). Targeting glioma stem cells through combined BMI1 and EZH2 inhibition. Nat. Med 23, 1352–1361. [DOI] [PMC free article] [PubMed] [Google Scholar]
- Kango-Singh M, and Singh A (2009). Regulation oforgan size: insights from the Drosophila Hippo signaling pathway. Dev. Dyn 238, 1627–1637. [DOI] [PubMed] [Google Scholar]
- Karim FD, and Rubin GM (1999). PTP-ER, a novel tyrosine phosphatase, functionsdownstream ofRas1 todownregulate MAP kinaseduring Drosophila eye development. Mol. Cell 3, 741–750. [DOI] [PubMed] [Google Scholar]
- Kim J, Lee IH, Cho HJ, Park CK, Jung YS, Kim Y, Nam SH, Kim AS, Johnson MD, Kong DS, et al. (2015). Spatiotemporal Evolution of the Primary Glioblastoma Genome. Cancer Cell 28, 318–328. [DOI] [PubMed] [Google Scholar]
- Kim SH, Ezhilarasan R, Phillips E, Gallego-Perez D, Sparks A, Taylor D, Ladner K, Furuta T, Sabit H, Chhipa R, et al. (2016). Serine/Threonine Kinase MLK4 Determines Mesenchymal Identity in Glioma Stem Cells in an NF-κB-dependent Manner. Cancer Cell 29, 201–213. [DOI] [PMC free article] [PubMed] [Google Scholar]
- Kuhnt D, Becker A, Ganslandt O, Bauer M, Buchfelder M, and Nimsky C(2011). Correlation of the extent of tumor volume resection and patient survival in surgery of glioblastoma multiforme with high-field intraoperative MRI guidance. Neuro Oncol. 13, 1339–1348. [DOI] [PMC free article] [PubMed] [Google Scholar]
- Lacroix M, Abi-Said D, Fourney DR, Gokaslan ZL, Shi W, DeMonte F, Lang FF, McCutcheon IE, Hassenbusch SJ, Holland E, et al. (2001). A multivariate analysis of 416 patients with glioblastoma multiforme: prognosis, extent of resection, and survival. J. Neurosurg 95, 190–198. [DOI] [PubMed] [Google Scholar]
- Lathia JD, Mack SC, Mulkearns-Hubert EE, Valentim CL, and Rich JN (2015). Cancer stem cells in glioblastoma. Genes Dev. 29, 1203–1217. [DOI] [PMC free article] [PubMed] [Google Scholar]
- Lau J, Ilkhanizadeh S, Wang S, Miroshnikova YA, Salvatierra NA, Wong RA, Schmidt C, Weaver VM, Weiss WA, and Persson AI (2015). STAT3 Blockade Inhibits Radiation-Induced Malignant Progression in Glioma. Cancer Res. 75, 4302–4311. [DOI] [PMC free article] [PubMed] [Google Scholar]
- Lee C, and Huang CH (2013). LASAGNA-Search: an integrated web tool for transcription factor binding site search and visualization. Biotechniques 54, 141–153. [DOI] [PubMed] [Google Scholar]
- Lee C, and Huang CH (2014). LASAGNA-Search 2.0: integrated transcription factor binding site search and visualization in a browser. Bioinformatics 30, 1923–1925. [DOI] [PubMed] [Google Scholar]
- Lian I, Kim J, Okazawa H, Zhao J, Zhao B, Yu J, Chinnaiyan A, Israel MA, Goldstein LS, Abujarour R, et al. (2010). The role ofYAP transcription coactivator in regulating stem cell self-renewal and differentiation. Genes Dev. 24, 1106–1118. [DOI] [PMC free article] [PubMed] [Google Scholar]
- Luo Y, Dallaglio K, Chen Y, Robinson WA, Robinson SE, McCarter MD, Wang J, Gonzalez R, Thompson DC, Norris DA, et al. (2012). ALDH1A isozymes are markers of human melanoma stem cells and potential therapeutic targets. Stem Cells 30, 2100–2113. [DOI] [PMC free article] [PubMed] [Google Scholar]
- Mancuso P, Calleri A, Gregato G, Labanca V, Quarna J, Antoniotti P, Cuppini L, Finocchiaro G, Eoli M, Rosti V, and Bertolini F (2014). Asubpopulation ofcirculating endothelial cellsexpressCD109and isenriched inthe blood of cancer patients. PLoS One 9, e114713. [DOI] [PMC free article] [PubMed] [Google Scholar]
- Mani SA, Yang J, Brooks M, Schwaninger G, Zhou A, Miura N, Kutok JL, Hartwell K, Richardson AL, and Weinberg RA (2007). Mesenchyme Forkhead 1 (FOXC2) plays a key role in metastasis and is associated with aggressive basal-like breast cancers. Proc. Natl. Acad. Sci. USA 104, 10069–10074. [DOI] [PMC free article] [PubMed] [Google Scholar]
- Mao P, Joshi K, Li J, Kim SH, Li P, Santana-Santos L, Luthra S, Chandran UR, Benos PV, Smith L, et al. (2013). Mesenchymal glioma stem cells are maintained by activated glycolytic metabolism involving aldehyde dehydrogenase 1A3. Proc. Natl. Acad. Sci. USA 110, 8644–8649. [DOI] [PMC free article] [PubMed] [Google Scholar]
- Marcato P, Dean CA, Pan D, Araslanova R, Gillis M, Joshi M, Helyer L, Pan L, Leidal A, Gujar S, et al. (2011). Aldehyde dehydrogenase activity of breast cancer stem cells is primarily due to isoform ALDH1A3 and its expression is predictive of metastasis. Stem Cells 29, 32–45. [DOI] [PubMed] [Google Scholar]
- Meacham CE, and Morrison SJ (2013). Tumour heterogeneity and cancer cell plasticity. Nature 501, 328–337. [DOI] [PMC free article] [PubMed] [Google Scholar]
- Meng Z, Moroishi T, and Guan KL (2016). Mechanisms of Hippo pathway regulation. Genes Dev. 30, 1–17. [DOI] [PMC free article] [PubMed] [Google Scholar]
- Miyazaki T, Pan Y, Joshi K, Purohit D, Hu B, Demir H, Mazumder S, Okabe S, Yamori T, Viapiano M, et al. (2012). Telomestatin impairs glioma stem cell survival and growth through the disruption oftelomeric G-quadruplex and inhibition of the proto-oncogene, c-Myb. Clin. Cancer Res 18, 1268–1280. [DOI] [PMC free article] [PubMed] [Google Scholar]
- Moreno M, Pedrosa L, Pare L, Pineda E, Bejarano L, Martinez J, Balasubramaniyan V, Ezhilarasan R, Kallarackal N, Kim SH, et al. (2017). GPR56/ADGRG1 Inhibits Mesenchymal Differentiation and Radioresistance in Glioblastoma. Cell Rep. 21, 2183–2197. [DOI] [PubMed] [Google Scholar]
- Nakano I, Masterman-Smith M, Saigusa K, Paucar AA, Horvath S, Shoemaker L, Watanabe M, Negro A, Bajpai R, Howes A, et al. (2008). Maternal embryonic leucine zipper kinase is a key regulatorofthe proliferation of malignant brain tumors, including brain tumor stem cells. J. Neurosci. Res 86, 48–60. [DOI] [PubMed] [Google Scholar]
- Nakano I, Joshi K, Visnyei K, Hu B, Watanabe M, Lam D, Wexler E, Saigusa K, Nakamura Y, Laks DR, et al. (2011). Siomycin A targets brain tumor stem cells partially through a MELK-mediated pathway. Neuro Oncol. 13, 622–634. [DOI] [PMC free article] [PubMed] [Google Scholar]
- Ostrom QT, Gittleman H, Liao P, Vecchione-Koval T, Wolinsky Y, Kruchko C, and Barnholtz-Sloan JS (2017). CBTRUS Statistical Report: primary brain and other central nervous system tumors diagnosed in the United States in 2010-2014. Neuro Oncol 19 (Suppl_5), v1–v88. [DOI] [PMC free article] [PubMed] [Google Scholar]
- Ozawa T, Riester M, Cheng YK, Huse JT, Squatrito M, Helmy K, Charles N, Michor F, and Holland EC (2014). Most human non-GCIMP glioblastoma subtypes evolve from a common proneural-like precursor glioma. Cancer Cell 26, 288–300. [DOI] [PMC free article] [PubMed] [Google Scholar]
- Patel AP, Tirosh I, Trombetta JJ, Shalek AK, Gillespie SM, Wakimoto H, Cahill DP, Nahed BV, Curry WT, Martuza RL, et al. (2014). Singlecell RNA-seq highlights intratumoral heterogeneity in primary glioblastoma. Science 344, 1396–1401. [DOI] [PMC free article] [PubMed] [Google Scholar]
- Petrie RJ, Doyle AD, and Yamada KM (2009). Random versus directionally persistent cell migration. Nat. Rev. Mol. Cell Biol 10, 538–549. [DOI] [PMC free article] [PubMed] [Google Scholar]
- Piccolo S, Dupont S, and Cordenonsi M (2014). The biology of YAP/TAZ: hippo signaling and beyond. Physiol. Rev 94, 1287–1312. [DOI] [PubMed] [Google Scholar]
- Read RD (2011). Drosophila melanogaster as a model system for human brain cancers. Glia 59, 1364–1376. [DOI] [PMC free article] [PubMed] [Google Scholar]
- Segerman A, Niklasson M, Haglund C, Bergstrom T, Jarvius M, Xie Y, Westermark A, Sonmez D, Hermansson A, Kastemar M, et al. (2016). Clonal Variation in Drug and Radiation Response among Glioma-Initiating Cells Is Linked to Proneural-Mesenchymal Transition. Cell Rep. 17, 2994–3009. [DOI] [PubMed] [Google Scholar]
- Shah K (2016). Stem cell-based therapiesfortumors in the brain: arewethere yet? Neuro Oncol. 18, 1066–1078. [DOI] [PMC free article] [PubMed] [Google Scholar]
- Shiraki Y, Mii S, Enomoto A, Momota H, Han YP, Kato T, Ushida K, Kato A, Asai N, Murakumo Y, et al. (2017). Significance of perivascular tumour cells defined by CD109 expression in progression of glioma. J. Pathol 243, 468–480. [DOI] [PubMed] [Google Scholar]
- Stummer W, Reulen HJ, Meinel T, Pichlmeier U, Schumacher W, Tonn JC, Rohde V, Oppel F, Turowski B, Woiciechowsky C, et al. ; ALA-Glioma Study Group (2008). Extent of resection and survival in glioblastoma multiforme: identification of and adjustment for bias. Neurosurgery 62, 564–576. [DOI] [PubMed] [Google Scholar]
- Stupp R, Hegi ME, Gilbert MR, and Chakravarti A (2007). Chemoradiotherapy in malignant glioma: standard of care and future directions. J. Clin. Oncol 25, 4127–4136. [DOI] [PubMed] [Google Scholar]
- Sutherland DR, Yeo E, Ryan A, Mills GB, Bailey D, and Baker MA (1991). Identification ofacell-surface antigen associated with activated T lymphoblasts and activated platelets. Blood 77, 84–93. [PubMed] [Google Scholar]
- Taniguchi K, Wu LW, Grivennikov SI, de Jong PR, Lian I, Yu FX, Wang K, Ho SB, Boland BS, Chang JT, et al. (2015). A gp130-Src-YAP module links inflammation to epithelial regeneration. Nature 519, 57–62. [DOI] [PMC free article] [PubMed] [Google Scholar]
- Tao J, Li H, Li Q, and Yang Y (2014). CD109 is a potential target for triplenegative breast cancer. Tumour Biol. 35, 12083–12090. [DOI] [PubMed] [Google Scholar]
- Thomas-Chollier M, Hufton A, Heinig M, O’Keeffe S, Masri NE, Roider HG, Manke T, and Vingron M (2011). Transcription factor binding predictions using TRAP for the analysis of ChIP-seq data and regulatory SNPs. Nat. Protoc 6, 1860–1869. [DOI] [PubMed] [Google Scholar]
- Tso CL, Shintaku P, Chen J, Liu Q, Liu J, Chen Z, Yoshimoto K, Mischel PS, Cloughesy TF, Liau LM, and Nelson SF (2006). Primary glioblastomas express mesenchymal stem-like properties. Mol. Cancer Res 4, 607–619. [DOI] [PubMed] [Google Scholar]
- Varelas X, Sakuma R, Samavarchi-Tehrani P, Peerani R, Rao BM, Dembowy J, Yaffe MB, Zandstra PW, and Wrana JL (2008). TAZ controls Smad nucleocytoplasmic shuttling and regulates human embryonic stem-cell self-renewal. Nat. Cell Biol 10, 837–848. [DOI] [PubMed] [Google Scholar]
- Verhaak RG, Hoadley KA, Purdom E, Wang V, Qi Y, Wilkerson MD, Miller CR, Ding L, Golub T, Mesirov JP, et al. ; Cancer Genome Atlas Research Network (2010). Integrated genomic analysis identifies clinically relevant subtypes of glioblastoma characterized by abnormalities in PDGFRA, IDH1, EGFR, and NF1.Cancer Cell 17, 98–110. [DOI] [PMC free article] [PubMed] [Google Scholar]
- Vorstenbosch J, Gallant-Behm C, Trzeciak A, Roy S, Mustoe T, and Philip A (2013). Transgenic mice overexpressing CD109 in the epidermis display decreased inflammation and granulation tissue and improved collagen architecture during wound healing. Wound Repair Regen. 21, 235–246. [DOI] [PubMed] [Google Scholar]
- Waghmare I, Roebke A, Minata M, Kango-Singh M, and Nakano I (2014). Intercellular cooperation and competition in brain cancers: lessons from Drosophila and human studies. Stem Cells Transl. Med 3, 1262–1268. [DOI] [PMC free article] [PubMed] [Google Scholar]
- Wang J, Cazzato E, Ladewig E, Frattini V, Rosenbloom DI, Zairis S, Abate F, Liu Z, Elliott O, Shin YJ, et al. (2016). Clonal evolution ofglioblastoma under therapy. Nat. Genet 48, 768–776. [DOI] [PMC free article] [PubMed] [Google Scholar]
- Wang Q, Hu B, Hu X, Kim H, Squatrito M, Scarpace L, deCarvalho AC, Lyu S, Li P, Li Y, et al. (2017). Tumor Evolution of Glioma-Intrinsic Gene Expression Subtypes Associates with Immunological Changes in the Microenvironment. Cancer Cell 32, 42–56.e6. [DOI] [PMC free article] [PubMed] [Google Scholar]
- Wu ZH, Shi Y, Tibbetts RS, and Miyamoto S (2006). Molecular linkage between the kinase ATM and NF-kappaB signaling in response to genotoxic stimuli. Science 311, 1141–1146. [DOI] [PubMed] [Google Scholar]
- Zanconato F, Battilana G, Cordenonsi M, and Piccolo S (2016). YAP/TAZ as therapeutic targets in cancer. Curr. Opin. Pharmacol 29, 26–33. [DOI] [PMC free article] [PubMed] [Google Scholar]
- Zhang JM, Hashimoto M, Kawai K, Murakumo Y, Sato T, Ichihara M, Nakamura S, and Takahashi M (2005). CD109 expression in squamous cell carcinoma of the uterine cervix. Pathol. Int 55, 165–169. [DOI] [PubMed] [Google Scholar]
- Zhang JM, Murakumo Y, Hagiwara S, Jiang P, Mii S, Kalyoncu E, Saito S, Suzuki C, Sakurai Y, Numata Y, et al. (2015). CD109 attenuates TGF-b1 signaling and enhances EGF signaling in SK-MG-1 human glioblastoma cells. Biochem. Biophys. Res. Commun 459, 252–258. [DOI] [PubMed] [Google Scholar]
- Zhao X, Huang X, Wang X, Wu Y, Eisfeld AK, Schwind S, Gallego-Perez D, Boukany PE, Marcucci GI, and Lee LJ (2015). Nanochannel Electroporation as a Platform for Living Cell Interrogation in Acute Myeloid Leukemia. Adv. Sci. (Weinh.) 2, 1500111. [DOI] [PMC free article] [PubMed] [Google Scholar]
Associated Data
This section collects any data citations, data availability statements, or supplementary materials included in this article.