Abstract
The stretched exponential function (SEF) was used to analyze and interpret saturation recovery (SR) electron paramagnetic resonance (EPR) data obtained from spin-labeled porcine eye-lens membranes. This function has two fitting parameters: the characteristic spin-lattice relaxation rate (T1str−1) and the stretching parameter (β), which ranges between zero and one. When β = 1, the function is a single exponential. It is assumed that the SEF arises from a distribution of single exponential functions, each described by a T1 value. Because T1−1s are determined primarily by the rotational diffusion of spin labels, they are a measure of membrane fluidity. Since β describes the distribution of T1−1s, it can be interpreted as a measure of membrane heterogeneity. The SEF was used to analyze SR data obtained from intact cortical and nuclear fiber cell plasma membranes extracted from the eye lenses of two-year old animals and spinlabeled with phospholipid- and cholesterol-analogs. The lipid environment sensed by these probe molecules was found to be less fluid and more heterogeneous in nuclear membranes than in cortical membranes. Parameters T1str−1 and β were also used for a multivariate K-means cluster analysis of stretched-exponential data. This analysis indicates that SEF data can be assigned accurately to clusters in nuclear or cortical membranes. In future work, the SEF will be applied to analyze data from human eye lenses of donors with differing health histories.
Keywords: stretched exponential, membrane fluidity, saturation recovery EPR, spin label, eye lens
1. Introduction
Saturation recovery (SR) electron paramagnetic resonance (EPR) spin-labeling approaches provide information about the organization and fluidity of the lipid bilayer portion of biological membranes [1,2]. In the absence of any other paramagnetic molecules, the spin lattice relaxation rate (T1−1) measured by SR EPR is determined primarily by the rotational diffusion of the nitroxide moiety of the spin label [3–7] and, thus, by the motion of the molecular fragment to which the nitroxide moiety is rigidly attached. In other words, in the absence of other paramagnetic molecules, T1−1 is a measure of membrane fluidity. Four types of lipid domains have been identified in the intact fiber cell membranes of animal and human eye lenses [8–13]. These domains are induced by the high cholesterol (Chol) content (bulk domain and cholesterol bilayer domain [CBD]) and by the presence of integral membrane proteins (boundary and trapped lipid domains). The SR approach allows discrimination and quantification of lipids (phospholipids [PLs] and Chol) in these domains [8,9].
Commonly, the SR EPR data from eye-lens fiber cell membranes were described as having two or three distinct fluidities that can be discriminated and quantitated by the two or three distinct T1−1 values of lipid spin labels [1,2]. We propose that an eye lens fiber cell membrane domain can be considered to have a continuum of fluidities that can be described by a continuous sum of exponential decays, i.e., the stretched exponential function (SEF) [14]. SEF, also known as the Kohlrausch-Williams-Watts function, has been used to analyze many natural distributions that can be described as a continuous sum of exponentials (for review, see [15,16]).
The SEF can adequately describe the fluidities of eye-lens fiber cell plasma membranes for two reasons. First, biological membranes are fluid phase membranes, which means that the lipids exhibit rotational motion and also lateral diffusion. These membranes contain different lipid domains induced by the presence of Chol and integral membrane proteins. The fluidities of lipids in these domains can differ significantly, but with continuous fluidity changes at interface regions between the domains. For example, continuous change was reported between the bulk and the boundary domains [17–19] and between the bulk domain and the CBD [20]. These continuous changes of membrane fluidity should be pronounced in eye lens fiber cell plasma membranes that are rich in Chol and sphingolipids and dense with integral membrane proteins [21–24].
Second, the eye lens is an onion-like organ composed of thousands of concentric layers of fiber cells [25]. The deeper layers are formed by older cells. Age-related changes in plasma membranes of human eye lens fiber cells are much greater than age-related changes in the membranes of other organs and tissues. The PL composition changes with age [26–29], with increase of sphingolipid content and depletion of phosphatidylcholine [24, 29–31]. The saturation levels of PL acyl chains also increase with age [22,29,31]. These changes are reflected in the differences in the PL composition between the lens cortex and lens nucleus [32,33]. Most characteristic is the increase of Chol content with age [22, 23, 34, 35]. Additionally, the protein content in human lens membranes is extremely high [21, 22, 36–38], increases with age [36–38], and is higher in the nucleus compared with the content in the cortex [21,22]. The integral membrane proteins aggregate, and arrays are formed in aged fiber cell membranes [37, 39–44]. These age-related variations should contribute to increased heterogeneity of the measured fluidity in samples containing cortical and nuclear fiber cell plasma membranes.
The eye lens traditionally is separated into two parts: the nucleus, which is the inner and the older portion of an eye lens, and the cortex, which is the outer and younger portion of an eye lens. Here, we measured the fluidities of the intact fiber cell plasma membranes from these two regions of the eye lens using SR EPR spin-labeling methods. To avoid making assumptions about the number of spin-lattice relaxation rates of spin labels, we used the SEF to characterize the fluidity of intact fiber cell plasma membranes. We applied the SEF to analyze the SR EPR data obtained from intact cortical and nuclear fiber cell plasma membranes isolated from two-year-old porcine eye lenses labeled with PL-(12-SASL) and Chol-analog (ASL) spin labels. These membranes were chosen because they were previously investigated in detail using both continuous wave (CW) and SR EPR approaches [8–10, 13]. The SEF fitting parameters T1str−1 and β were useful in describing the complex fluidity of the investigated samples. These parameters were used to determine the significance of experimental differences and to cluster the samples based on origin using a K-means clustering analysis that is useful in exploratory research [45]. In addition, the SEF allows the probability distribution function (PDF) to be computed, which makes it possible to analyze a distribution of T1−1s within a sample.
1.1. Outline of theory
The recovery of a spin system to equilibrium (SR signal) after the end of a high microwave pulse is exponential and is described by the equation
| (1) |
where I(t) and Io are, respectively, amplitudes of SR signals at time t and immediately after the end of the saturating microwave pulse. T1 is the spin-lattice relaxation time. In the presence of domains with different fluidities in the membrane, the SR signal can be fitted by a multi-exponential function:
| (2) |
When the SEF is used, the exponential-like SR signal is described as a continuous sum of exponential decays that fits the function:
| (3) |
where T1str is the characteristic relaxation time. The stretching parameter β ranges between zero and one. When β = 1, the function is a single exponential. This function can also be described as the integral over all exponentials with a probability distribution:
| (4) |
where s = T1−1/T1str−1. The probability density distribution is derived by inverse Laplace transformation in [14]:
| (5) |
The β value is related to the width of the relaxation rate distribution, and thus, is a direct measure for the local membrane heterogeneity. When β = 1, the function is a single exponential and the membrane is homogenous. The smaller the β, the more heterogeneous is the environment.
2. Materials and Methods
To illustrate the analysis of the SR signals using the SEF, we chose previously published SR data that were obtained from intact cortical and nuclear fiber cell plasma membranes isolated from porcine eye lenses of two-year-old animals and labeled with PL-(12-SASL) and Chol-analog (ASL) spin labels [8]. These data are from SR signals obtained at X-band on a spectrometer developed at the National Biomedical EPR Center (Milwaukee, WI), after the apparatus received two major hardware improvements. The first is that the pump arm was upgraded to deliver a 1 W pulse to the loop-gap resonator. This level of pump power is needed to detect the fast components present in multiexponential signals. Additionally, the receiver dead time after the pump pulse was reduced from 300 ns to 100 ns. This reduction is significant for analysis of signals containing fast components. In the subsequent sections, we briefly describe procedures for obtaining samples and recording SR signals, as well as the detailed procedures needed for application of the SEF to analysis recorded SR signals.
2.1. Materials
Spin-labeled PL analog (12-doxylstearic acid spin label [12-SASL]) and spin-labeled Chol analog (androstane spin label [ASL]) were purchased from Molecular Probes (Eugene, OR) (see the structures in Fig. 1 of Ref. [13]). Other chemicals, of at least reagent grade, were purchased from Sigma-Aldrich (St. Louis, MO).
Figure 1.
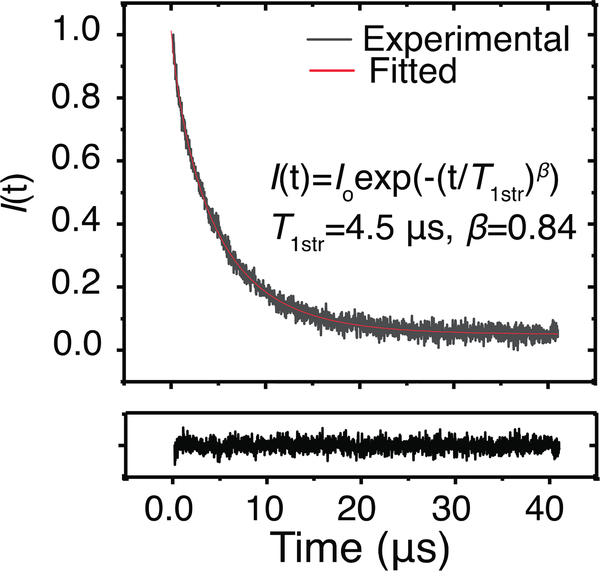
Standardized experimental relaxation curve of a 12-SASL labeled nuclear eye-lens membrane. The fitted curve was obtained using SEF as described in Outline of Theory and Materials and Methods sections. The fitted parameters are T1str = 4.5 μs, and β = 0.84. The black trace below the main graph shows the residual.
2.2. Isolation and spin labeling of intact membranes
These procedures were described previously [8]. Eight porcine eye lenses were isolated from two-year-old animals. The lens capsule was removed, and the cortical and nuclear portions of each eye lens were separated, and the intact fiber cell membranes were isolated. Then, the membranes were labeled either with PL analog 12-SASL or with the Chol analog ASL. In total, four populations were created: 12-SASL-nucleus, 12-SASL-cortex, ASL-nucleus, and ASL-cortex. Each population contained eight samples, except 12-SASL-cortex, which contained only seven samples. Both spin labels were readily incorporated into intact membranes without the use of damaging solvents [10].
2.3. SR EPR measurements
The SR EPR signal for each sample was recorded after a short (100 ns) saturating pulse for the central line. All measurements were carried out at 37°C for thoroughly deoxygenated samples, with 105–106 decays acquired with 2,048 data points on each signal (decay) and a sampling interval of 20 ns. For more details, see [8].
2.4. Data analysis
2.4.1. Analysis of SR signals using SEF
Each exponential-like SR signal was fitted to the SEF (Eq. 3) using the Levenberg-Marquard algorithm in the Origin 2017 (Northampton, MA) software package. The zero time was taken as the time directly after the pulse (100 ns delay before recording). Fitted parameters, T1str−1 and β, were obtained for each sample. Mean values and standard deviations were obtained for each population and the Welch’s t-test in Origin 2017 was used to determine the significance of experimental differences. P ≤ 0.05 was considered to be statistically significant.
2.4.2. K-means clusters
The K-means cluster analysis was performed in Origin 2017 using the fit parameters T1str−1 and β. The optimal number of clusters was determined in RStudio (Boston, MA) using the NbClust function with Euclidian distances [46].
2.4.3. Computation and analysis of the PDF adjusted for the specific T1str−1
The individual T1str−1 and β values obtained for each sample were used to compute the probability density function of s for a given β, P(s|β) in MATLAB (Natick, MA) using Eq. 5. To obtain the PDF adjusted for the specific T1str−1 (indicated as P(T1−1|T1str−1, β) and read as “the probability of T1−1 for the given T1str−1 and β”) the “x” axis (expressed as s) was rescaled to be expressed as T1−1 by the multiplying s values by constant T1str−1 value,
| (6) |
That way, the dimensionless values of “x” axis were rescaled to new values with the dimension of μs−1. To maintain the area under the probability density function, the dimensionless P(s|β) divided by the unitless scaling factor S which is equal to the numerical value of the given T1str−1 expressed in μs−1 (T1str−1 = Sμs−1). This is indicated in Eq. 7:
| (7) |
For each specific T1str−1 the cumulative distribution function p(T1o−1|T1str−1, β), as described in Eq. 8, was obtained by integrating the P(T1−1|T1str−1, β) curve with respect to T1−1 from 0 to T1o−1:
| (8) |
The rescaling procedure allowed a straightforward analysis of the data obtained for each membrane sample with characteristic relaxation times and stretching parameters.
3. Results
3.1. Application of SEF to fit SR signals (and obtain T1str−1 and β)
The cortical and nuclear intact membranes were labeled with 12-SASL and ASL, and the SR signals were analyzed using SEF to obtain information about the heterogeneity of the rotational motion of major components of the lipid bilayer portion of intact fiber cell membrane, namely PLs and Chol. Fitting parameters obtained from the application of SEF were the characteristic spin-lattice relaxation rate T1str−1 and the stretching parameter β.
3.1.1. PL analog spin label 12-SASL
A representative SR signal together with the fitted stretched exponential curve of 12-SASL in nuclear fiber cell plasma membranes is shown in Fig. 1. The flat residual shows the goodness of the fit. The fitting program allowed the characteristic spin-lattice relaxation rate of 12-SASL T1str−1 and the stretching parameter β to be obtained. A similar procedure was performed for each of the seven cortical and eight nuclear membrane samples from porcine eye lenses.
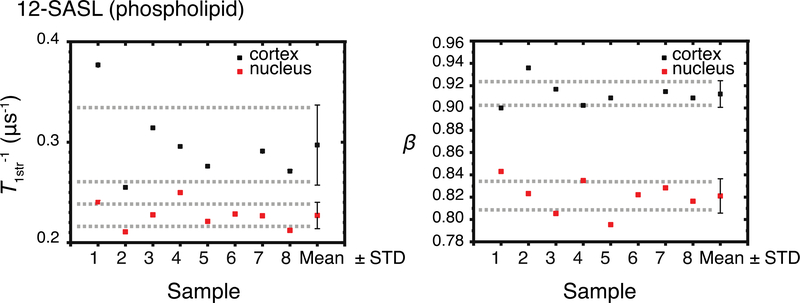
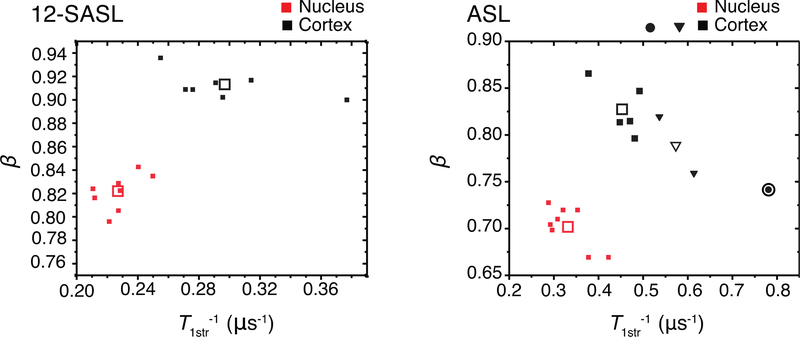
Cumulative data for T1str−1s and βs for all samples are presented in Fig. 2. Mean values and standard deviations were evaluated and are also indicated in Fig. 2. The mean value of T1str−1 s obtained from 12-SASL in nuclear membranes (0.23 ± 0.013 μs−1 ) is lower than that obtained from 12-SASL in cortical membranes (0.30 ± 0.040 μs−1) (t(7.1) = 4.4, p = 2.9×10⁻³). The mean β value from the 12-SASL nuclear membranes (0.82 ± 0.015) is lower than that obtained from 12-SASL in cortical membranes (0.91 ± 0.012) (t(13) = 13, p = 9.6×10⁻⁹). Welch’s t-test indicates that parameters for the populations, T1str−1s and βs, are statistically different (P ≤ 0.05).
Figure 2.
Cumulative data for stretched-exponential relaxation rates (T1str−1), and corresponding beta parameters (β) for 12-SASL (PL analog) in samples of intact cortical and nuclear fiber cell membrane obtained separately from eight porcine eye lenses (see Eq. 3). Mean values (Mean) and standard deviations (STD) obtained for each group are indicated. Dashed lines indicate the interval around the mean values that represents the 95% confidence level.
The mean T1str−1 values indicate that on average the 12-SASL probes in nuclear membranes are in more rigid environments than those in cortical membranes. The standard deviations associated with each population indicate that sample-to-sample variability in the cortical membrane population is more than three times greater than that in the nuclear membrane population. This difference is reflected in the degrees of freedom calculated by Welch’s t-test, which were 7.1 versus the 13 expected if these populations had equal variances. The t-value indicates that the difference between the population means is 4.4 times greater than the variability of the samples of both populations.
The mean β values for 12-SASL probes indicate a higher heterogeneity in nuclear membranes than in cortical membranes. The standard deviations within populations are similar, and the degrees of freedom in Welch’s t-test were not affected. The t-value indicates that the difference between the population means is 13 times greater than the variability of the samples of both populations.
Overall, PLs in nuclear membranes are more rigidly packed and have more heterogeneous fluidity than PLs in cortical membranes. Both parameters are effective in separating the populations accurately, with very low p-values. However, the β values provided a better separation between populations than the T1str−1 values.
3.1.2. Chol analog spin label ASL
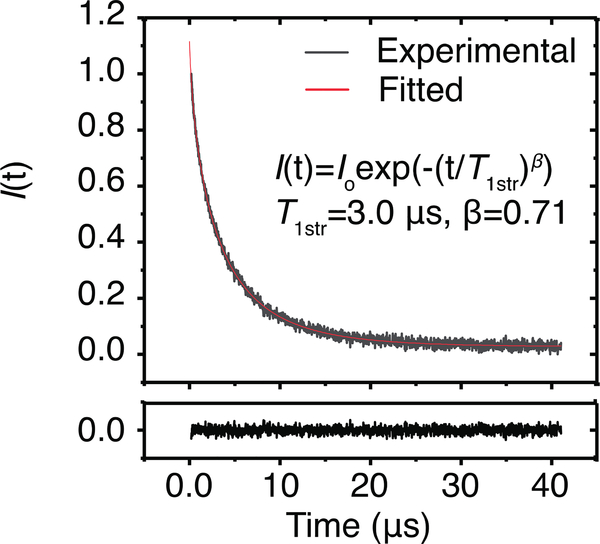
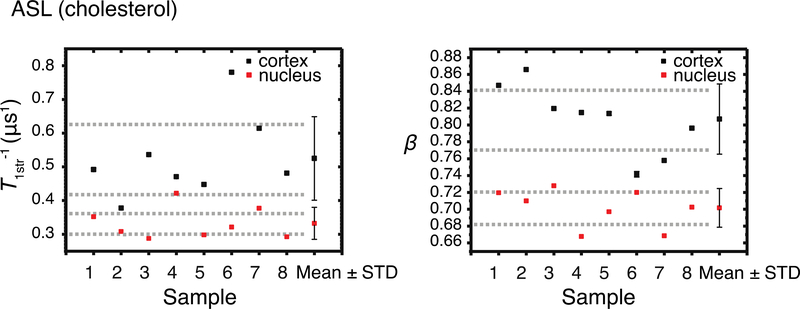
A representative SR signal together with the fitted stretched exponential curve of ASL in nuclear fiber cell plasma membranes is shown in Fig. 3. Cumulative data for T1str−1s and βs for all samples are presented in Fig. 4. Mean values and standard deviations were evaluated and are also indicated in Fig. 4. The mean T1str−1 value obtained from ASL in nuclear membranes (0.33 ± 0.048 μs−1) is lower than that obtained from ASL in cortical membranes (0.52 ± 0.12 μs−1) (t(9.0) = 4.1, p = 2.6×10⁻³). The mean β value obtained from ASL in nuclear membranes (0.70 ± 0.023) is lower than that obtained from ASL in cortical membranes (0.81 ± 0.042) (t(11) = 6.3, p = 6.3×10⁻⁵). Welch’s t-test indicates that parameters for the populations, T1str−1s and βs, are statistically different from each other at P ≤ 0.05.
Figure 3.
Standardized experimental relaxation curve of an ASL labeled nuclear eye-lens membrane. The fitted curve was obtained using SEF as described in Outline of Theory and Materials and Methods sections. The fitted parameters are T1str = 3.0 μs, and β = 0.71. The black trace below the main graph shows the residual.
Figure 4.
Cumulative data for stretched-exponential relaxation rates (T1str−1), and corresponding beta parameters (β) SL ( hol analog) in samples of intact cortical and nuclear fiber cell membrane obtained separately from eight porcine eye lenses (see Eq. 3). Mean values (Mean) and standard deviations (STD) obtained for each group are indicated. Dashed lines indicate the interval around the mean values that represents the 95% confidence level.
The mean T1str−1 values indicate that on average the ASL probes in the nuclear membranes indicate more rigid conditions. The standard deviation indicates that the sample-to-sample variability of the T1str−1 values of the cortical membrane population is two-and-one-half times higher than that of the nuclear membrane population. That difference is reflected in the degrees of freedom calculated by Welch’s t-test, which were 9.0 versus the 14 expected if these populations had equal variabilities. The t-value indicates that the difference between the population means is 4.1 times greater than the variability of the samples of both populations.
Based on the mean β values, the ASL probes indicate a higher heterogeneity in the nuclear membranes than in the cortical membranes. The variance of cortical membrane samples is almost two times that of the nuclear membranes. This variance decreased the degrees of freedom from the expected 14 (which would indicate equal variances) to 11. The t-value indicates that the difference between the population means is 6.3 times greater than the variability of the samples of both populations.
ASL probes indicate that environments are more rigid and heterogeneous in nuclear membranes than in cortical membranes. Apparently, Chol molecules in nuclear membranes are more rigidly and heterogeneously packed than Chol molecules in cortical membranes. However, sample-to-sample variability is higher in cortical membrane population. This analysis also indicates that both parameters, T1str−1 and β, provide about equal separation between populations and that the sample-to-sample variability in cortical membrane is higher than that in nuclear membrane for both parameters.
3.2. K-means cluster analysis
We tested T1str−1 and β parameters in a multivariate K-means cluster analysis. The NbClust algorithm in RStudio tests 30 different methods to determine a proper number of clusters for grouping the data. For the samples labeled with 12-SASL probes two clusters was determined to be the best number. When two clusters are specified in K-means cluster analysis, the two populations are clustered without misclassification (Fig. 5). Upon NbClust analysis, four clusters were found to be optimal for the analysis of the samples labeled with ASL probes. When four clusters are specified in K-means cluster analysis, the nuclear membrane data points were grouped in the same cluster, but the cortical membrane samples were separated into three separate clusters (Fig. 5).
Figure 5.
The T1str−1 and β parameters cross-plotted and clustered using k-means clustering algorithm in Origin 2017. The optimum number of clusters was determined by using NbClust function in RStudio. The solid points are the actual values. The open points are the cluster centroids. The 12-SASL samples were grouped into two separate groups that reflect their origins. The ASL samples were grouped into four separate groups by k-means clustering algorithm. The ASL labeled nuclear membranes were clustered together. The ASL samples of cortical membranes were grouped into three separate groups. It may reflect that ASL probes provide a greater sensitivity in cortical membrane. The accurate clustering of these parameters shows that they are suitable for k-means clustering analysis using samples from unknown origin.
3.3. Distribution of spin-lattice relaxation rates
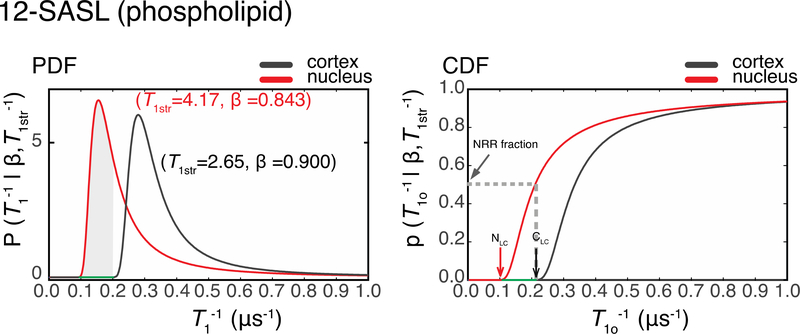
To assess T1−1distribuitions, P(T1−1|T1str−1, β) and p(T1o−1|T1str−1, β) were constructed for each sample, as described by Eqs. 7 and 8 (see Sect. 2.4.3). Representative P(T1−1|T1str−1, β) and p(T1o-1|T1str, β) functions for 12-SASL in cortical and nuclear fiber cell plasma membranes are shown in Fig. 6. Functions were computed for 12-SASL in seven cortical membrane samples and eight nuclear membranes samples. As can be seen, the P(T1−1|T1str−1, β) for the nuclear membranes shifted to lower relaxation rates relative those for the cortical membranes. This behavior was observed for all samples. Thus, the immediate conclusion is that PLs in the nuclear membranes are more rigid than those in the cortical membranes.
Figure 6.
PDF – probability distribution functions and CDF-cumulative distribution functions for the nuclear and cortical membranes of the same eye (Sample 1) labeled with 12-SASL probes. The red lines are generated using the nuclear membrane parameters T1str = 4.17 μs and β = 0.843, and the black lines are generated using the cortical membrane parameters T1str = 2.65 μs and β = 0.900. The CDFs are the integrals of PDFs. NLC refers to the nuclear low-cutoff T1−1 value, and CLC refers to cortical low-cutoff T1−1 value. The intensity of p(T1o−1|T1str−1, β) at these points are equal to or less than 0.01%. The range of T1−1s between these points is the nuclear rigid range (NRR) highlighted in green on the PDF and CDF plots. The gray dashed line on the CDF plot and the grayed area on the PDF plot indicate the fractional intensity of the NRR in the nuclear membrane of the Sample 1 that was labeled with 12-SASL. The same analysis was performed across all samples. The average NRR and the NRR fractional intensity are reported in the Results section.
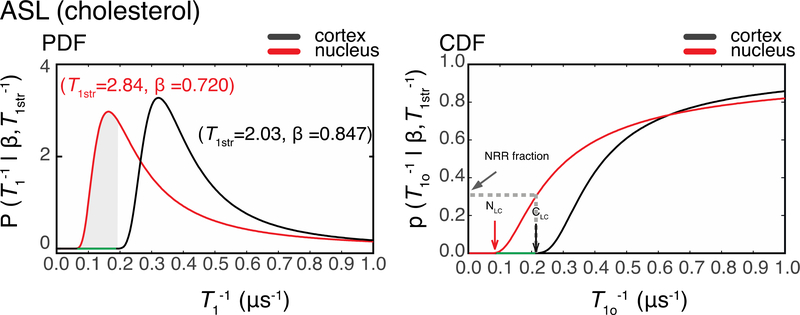
Representative P(T1−1|T1str−1, β) and p(T1o−1|T1str−1, β) functions for ASL in cortical and nuclear fiber cell plasma membranes are shown in Fig. 7. Also for ASL, the P(T1−1|T1str−1, β)] for nuclear membranes shifted to lower relaxation rates relative those for cortical membranes, and this behavior was observed for all samples. Thus, the immediate conclusion is that Chol molecules in nuclear membranes are more rigidly packed than in cortical membranes.
Figure 7.
PDF – probability distribution functions and CDF-cumulative distribution functions for the nuclear and cortical membranes of the same eye (Sample 1) labeled with ASL probes. The red lines are generated using the nuclear membrane parameters T1str = 2.84μs and β = 0.720 and the black lines are generated using the cortical membrane parameters T1str = 2.03 μs and β = 0.847. CDFs are the integrals of PDFs. NLC refers to the nuclear low-cutoff T1−1 value, and CLC refers to cortical low-cutoff T1−1 value. The p(T1o−1|T1str−1, β) at these point are equal to or less than 0.01%. The range of T1−1s between these points is the nuclear rigid range (NRR) highlighted in green on the PDF and CDF plots. The gray dashed line on the CDF plot and the grayed area on the PDF plot indicate the fractional intensity of the NRR in the nuclear membrane of the Sample 1 that was labeled with ASL. The same analysis was performed across all samples. The average NRR and the NRR fractional intensity are reported in the Results section.
The shift toward the lower T1−1s in the nuclear membrane compared with cortical membrane was evaluated as follows. We named the T1−1 value at which the intensity of p(T1o−1|T1str−1,β) ≤ 0.01% as the low cut-off T1−1s value. The range between the low cut-off T1−1 value for nuclear membranes and the low cut-off T1−1 value for cortical membranes of the same eye and the same spin label is termed the nuclear rigid range (NRR). The fractional signal intensity of NRR is the intensity of nuclear p(T1o−1|T1str−1,β) at the cortical low cut-off T1−1 value of the same eye and the same spin label.
The low cut-off T1−1 values for 12-SASL in cortical and nuclear membranes were evaluated for each sample as shown in Fig. 6, and the mean values and standard deviations were calculated. They were 0.18 ± 0.018 μs−1 and 0.080 ± 0.010 μs−1 for cortical and nuclear membranes, respectively. The NRRs were determined to lie between these mean values. Similarly, the low cut-off T1−1 values for ASL were evaluated for each sample, as shown in Fig. 7. The mean values and standard deviations for cortical and nuclear membranes were 0.18 ± 0.024 μs−1 and 0.055 ± 0.0090 μs−1, respectively. The NRR was determined to lie between these mean values. The NRR contributes to the 40 ± 8.1% and 26 ± 8.1% of the SR signals coming from membranes labeled with 12-SASL and ASL, respectively.
4. Discussion
Here, we applied the SEF to analyze exponential-like SR EPR signals coming from lipid spin labels in the lipid bilayer portion of intact eye lens fiber cell membranes. To the best of our knowledge, this is the first time SEF was used for the analysis of SR EPR signals of spin-labeled biological membranes. The SEF method provides different insight into this complex system than do the mono- or multi-exponential analyses of SR EPR signals we have performed previously. The SEF offers a flexible approach to describe biological membranes. This approach removes the requirement for a specific number of discrete exponentials, as well as the assumptions that domains are homogenous. The SEF provides two parameters, the characteristic relaxation time T1str and the stretching parameter β. The former relates to the membrane fluidity sensed by PL- or Chol-analog spin labels. The latter describes the heterogeneity of membrane fluidity sensed by PL-or Chol-analog spin labels. Keeping in mind the fact that the spin-lattice relaxation rate of spin labels (inverse of the spin-lattice relaxation time) is determined mainly by the rotational diffusion of spin labels, the SEF provides a direct measure of the heterogeneity of membrane fluidity.
The SEF yields a continuous distribution of spin-lattice relaxation rates of spin labels in complex membranous systems. The continuous relaxation rate distributions arise due to a range of membrane microenvironments in which spin labels are located, either from a variation in the number of adjacent membrane domains and/or from different organization (heterogeneous properties) of these domains. All of these predict that the stretched-exponential decay will better describe the observed SR signal. We would like to stress again that, when analyzing SR signals this new SEF approach yields a parameter of significant interest, namely stretching parameter β. The width of the relaxation rate distribution is a direct measure of the local heterogeneity of the membrane fluidity. The stretching parameter is important because it allows mechanisms to be studied that can regulate (broaden or narrow) the membrane fluidity distribution, and because it provides an additional means to compare biological membranes.
Two major conclusions from the application of SEF to analyze the SR signals of PL spin labels incorporated into eye lens fiber cell plasma membranes are: (1) The average membrane fluidity sensed by the PL analog (12-SASL, Fig. 2) and Chol analog (ASL, Fig. 4) in nuclear membranes is significantly lower than that sensed in cortical membranes. (2) The heterogeneity of membrane fluidity sensed by 12-SASL (Fig. 2) and by ASL (Fig. 4) in nuclear membranes is significantly greater than in cortical membranes. These conclusions strengthen the conclusions drawn from previous studies where the double exponential analysis of SR signals from analogous samples was performed [8]. In that study, two T1 values obtained by the double exponential fitting of SR signals from 12-SASL were 6.15 ± 0.30 μs and 2.44 ± 0.47 μs in nuclear membranes and 5.15 ± 0.62 μs and 3.0 ± 0.51 μs in cortical membrane (see Table 1 in [8]). The upper T1 values in nuclear membranes were greater than those in cortical membranes, which indicates greater rigidity of the PL component of the lipid bilayer portion of intact membranes. Also, the differences between the upper and the lower values were 3.71 μs and 2.15 μs for nuclear and cortical membranes, respectively, which indicates greater distribution of the motion of 12-SASL and thus greater heterogeneity in nuclear membranes. Similarly, the two T1 values obtained by the double exponential fitting of SR signals from ASL were 6.86 ± 0.20 μs and 2.25 ± 0.12 μs in nuclear membranes and 5.23 ± 0.38 μs and 2.20 ± 0.10 μs in cortical membrane (see Table 1 in [8]). The differences between the upper and the lower values were 4.61 μs and 3.03 μs for nuclear and cortical membranes, respectively.
In contrast with the double exponential approach, the analysis of SR signals using SEF assigns one quantitative value for membrane fluidity (T1str) and one for membrane heterogeneity (β). The t-test showed that for both parameters, the differences between nuclear and cortical membranes sensed by 12-SASL (see Sect. 3.1.1) and by ASL (see Sect. 3.1.2) are statistically significant. The β parameter provided a much better separation of the data. However, the T1str−1 parameter may be more sensitive to the subtle individual differences and thus has a larger scattering. These results may be used to our advantage in further exploratory research where we plan to use SEF to analyze SR data from the eye lens fiber cell membranes of human donors. The T1str−1 and β parameters from those data can be clustered into groups using the K-means cluster algorithm.
To ensure that the T1str−1 and β parameters are useful for clustering the data into groups, we performed a multivariable analysis of the values obtained with 12-SASL and ASL (Fig. 5) from four groups of samples. The K-means cluster algorithm separates data points in order to make the most cohesive clusters according to the specified number of clusters. The main challenge with this data treatment is to determine the number of clusters. Numerous methods exist to do that [45,46]. For the 12-SASL-labeled membranes, the optimum number of clusters was two, and for the ASL-labeled membranes, the optimum number of clusters was four. The cross-plotted data points for 12-SASL were separated into two clusters. This was expected because the t-values showed well separated populations. The four ASL clusters were formed in such a way that the all nuclear membrane data points were clustered together, but the cortical membrane data points were separated into three groups. This indicates that the greatest variabilities of Chol fluidities and heterogeneities were in the cortical membranes. The ability to separate data points into clusters will be useful in subsequent studies where membranes from different human populations will be obtained and compared based on health histories.
We also used T1str−1 and β to construct the P(T1−1|T1str−1, β) and p(T1o−1|T1str−1,β), which provided a distribution of T1−1s within each sample. This analysis confirmed the presence of a fraction of the lipids in nuclear membranes with a rigidity greater than the lipid rigidity in cortical membranes and allows evaluation of the range of T1−1s for this fraction. These data are consistent with those obtained by [13], where two-component CW EPR spectra of 12-SASL and ASL in nuclear and cortical membranes were separated by rigid and fluid components. The rigid, strongly immobilized component of the 12-SASL EPR spectrum in intact nuclear membranes was successfully simulated by the spectrum of 12-SASL in nuclear lens lipid membranes (made of the total lipid extract from intact nuclear membranes) at −58°C, while the same component in intact cortical membrane was successfully simulated by the spectrum of 12-SASL in cortical lens lipid membranes obtained at −13°C. These supporting data are reflected even more strongly in EPR spectra of ASL, which does not exhibit a strongly immobilized component in intact cortical membranes. However, this component is clear in EPR spectra coming from intact nuclear membranes. These observations are consistent with the distribution of T1−1s in the nuclear membrane compared with those in the cortical membrane obtained by SEF analysis. In other words, because the T1−1 is determined by the rotational motion of the probe [3–7], the more immobilized component in the CW EPR spectrum should be characterized by the smaller T1−1 value.
It is important to note that intensity of the cumulative distribution function at a particular T1−1 reflects the percentage of EPR signal intensity at the central line that comes from T1−1s ranging from 0 to the particular T1−1 value. That intensity should not be confused with the percentage of spin labels. In general, the slower relaxing spin labels (low T1−1) have a lower EPR signal intensity at the central line than the same amount of the faster relaxing spin labels (high T1−1). The probability distribution function is somewhat idealized and unimodal; that is, it might not exactly reflect the actual distribution of the spin labels. In future studies, we will use other methods that are available for the analysis of exponential-like decay [47–51].
The SEF contains two variables: the stretching parameter β and the T1str value. These variables are obtained numerically by SR EPR experiments. The distribution of T1 values, P(T1−1 | T1str−1, β), depends only on β and T1str. It rises to a peak value that is somewhat longer than the T1str values, has a half width at half height, has asymmetric rising and falling slopes on either side of the peak value, and can have varying amounts of overlap of distributions derived from alternative spin-labeled biomolecules. These various parameters provide insight into the heterogeneity of the spin label environment and can be used in various cluster analyses of data obtained from multiple samples.
Here, we demonstrated that the application of SEF for analyzing SR EPR spin-labeling data provides parameters that allow us to characterize complex intact biological membranes (eye lens fiber cell plasma membranes) without breaking them down into components such as membrane domains. The SEF derives from the more realistic SR model of continuous relaxation rate distributions in biological membranes, rather than from an arbitrary assumption of single or multiple discrete exponential components. Membrane fluidity and heterogeneity are assessed, and the quantitative parameters are assigned: T1str and β. The parameter β is important because it is related to the width of the relaxation rate distribution and is a direct measure for the local heterogeneity of the sample. It also makes possible the study of mechanisms that cause an increase or decrease of membrane heterogeneity. In the future we are planning to work with a variety of different biological and model membranes to provide more insight into these mechanisms. The SEF will also be applied in the exploratory analysis of samples from human eye lenses of donors with different health histories.
Acknowledgements
Research reported in this publication was supported by NIH grants R01 EY015526, P41 EB001980, and P30 EY001931. The content is solely the responsibility of the authors and does not necessarily represent the official views of the NIH.
We are grateful to Douglas Ward of the Department of Biophysics at Medical College of Wisconsin for the consultations and advice on statistics that include but are not limited to cross-plotting of variables and the proper form for axes labeling.
References
- 1.Subczynski WK, Raguz M, Widomska J, in Liposomes. Methods in Molecular Biology™ (Methods and Protocols), ed. By Weissig V (Humana Press, New York, Dordrecht, Heidelberg, London, 2010) p. 247 [Google Scholar]
- 2.Subczynski WK, Widomska J, Wisniewska A, Kusumi A, in Lipid Rafts. Methods in Molecular Biology, ed. By McIntosh TJ (Humana Press, Totowa, 2007), p. 143. [Google Scholar]
- 3.Mailer C, Nielsen RD, Robinson BH, J. Phys. Chem. A (2005) 10.1021/jp044671l [DOI] [PubMed] [Google Scholar]
- 4.Marsh D, J. Magn. Reson (2018) 10.1016/j.jmr.2018.02.020 [DOI] [Google Scholar]
- 5.Mainali L, Feix JB, Hyde JS, Subczynski WK J. Magn. Reson (2011) 10.1016/j.jmr.2011.07.022 [DOI] [PMC free article] [PubMed] [Google Scholar]
- 6.Mainali L, Hyde JS, Subczynski WK, J. Magn. Reson (2013) 10.1016/j.jmr.2012.11.001 [DOI] [PMC free article] [PubMed] [Google Scholar]
- 7.Robinson B, Haas D, Mailer C, Science (1994) 10.1126/science.8290958 [DOI] [PubMed] [Google Scholar]
- 8.Mainali L, Camenisch TG, Hyde JS, Subczynski WK, Appl. Magn. Reson (2017) 10.1007/s00723-017-0921-x [DOI] [PMC free article] [PubMed] [Google Scholar]
- 9.Mainali L, O’Brien WJ, Subczynski WK, Exp. Eye Res (2019) 10.1016/j.exer.2018.09.020 [DOI] [PMC free article] [PubMed] [Google Scholar]
- 10.Mainali L, Raguz M, O’Brien WJ, Subczynski WK, Exp. Eye Res (2012) 10.1016/j.exer.2012.01.012 [DOI] [PMC free article] [PubMed] [Google Scholar]
- 11.Raguz M, Mainali L, O’Brien WJ, Subczynski WK, Exp. Eye Res (2014) 10.1016/j.exer.2014.01.018 [DOI] [PMC free article] [PubMed] [Google Scholar]
- 12.Raguz M, Mainali L, O’Brien WJ, Subczynski WK, Exp. Eye Res (2015) 10.1016/j.exer.2015.01.018 [DOI] [PMC free article] [PubMed] [Google Scholar]
- 13.Raguz M, Mainali L, O’Brien WJ, Subczynski WK, Exp. Eye Res (2015) 10.1016/j.exer.2015.09.006 [DOI] [PMC free article] [PubMed] [Google Scholar]
- 14.Johnston DC, Phys. Rev. B (2006) 10.1103/physrevb.74.184430 [DOI] [Google Scholar]
- 15.Klafter J, Shlesinger MF, Proc. Natl. Acad. Sci. U.S.A (1986) 10.1073/pnas.83.4.848 [DOI] [Google Scholar]
- 16.Phillips JC, Rep. Prog. Phys (1996) 10.1088/0034-4885/59/9/003 [DOI] [Google Scholar]
- 17.East MJ, Melville D, Lee AG, Biochemistry (1985) 10.1021/bi00332a005 [DOI] [PubMed] [Google Scholar]
- 18.Jost PC, Griffith OH, Capaldi RA, Vanderkooi G, Proc. Natl. Acad. Sci. U.S.A (1973) 10.1073/pnas.70.2.480 [DOI] [PMC free article] [PubMed] [Google Scholar]
- 19.Ryba NJP, Horvath LI, Watts A, Marsh D, Biochemistry (1987) 10.1021/bi00385a045 [DOI] [PubMed] [Google Scholar]
- 20.Mainali L, Raguz M, O’Brien WJ, Subczynski WK, Curr. Eye Res (2016) 10.1080/02713683.2016.1231325 [DOI] [PMC free article] [PubMed] [Google Scholar]
- 21.Li LK, Roy D, Spector A, Curr. Eye, Res 5, 127(1986) [DOI] [PubMed] [Google Scholar]
- 22.Li LK, So L, Spector A, J. Lipid Res 26, 600(1985) [PubMed] [Google Scholar]
- 23.Li LK, So L, Spector A, Biochim. Biophys. Acta (1987) 10.1016/0005-2760(87)90291-8 [DOI] [PubMed] [Google Scholar]
- 24.Yappert MC, Borchman D, Chem. Phys. Lipids (2004) 10.1016/j.chemphyslip.2003.12.003 [DOI] [PubMed] [Google Scholar]
- 25.Beebe DC, in Adler’s Physiology of the Eye: Clinical Application, ed. Kaufman By P. L., & Alm A (Mosby, St. Louis, 2003), p.117 [Google Scholar]
- 26.Huang L, Grami V, Marrero Y, Tang D, Yappert MC, Rasi V, Borchman D, Investig. Ophthalmol. Vis. Sci (2005) 10.1167/iovs.04-1155 [DOI] [PubMed] [Google Scholar]
- 27.Paterson CA, Zeng J, Husseini Z, Borchman D, Delamere NA, Garland D, Jimenez-Asensio J, Curr. Eye Res (1997) 10.1076/ceyr.16.4.333.10689 [DOI] [PubMed] [Google Scholar]
- 28.Truscott RJ, Ophthalmic Res. (2000) 10.1159/000055612 [DOI] [Google Scholar]
- 29.Yappert MC, Rujoi M, Borchman D, Vorobyov I, Estrada R, Exp. Eye Res (2003) 10.1016/s0014-4835(03)00051-4 [DOI] [PubMed] [Google Scholar]
- 30..Borchman D, Byrdwell WC, Yappert MC, Investig. Ophthalmol. Vis. Sci 35 3938 (1994) [PubMed] [Google Scholar]
- 31.eeley JM,. W. Mitchell,. Wei, J. Korth, J. R. ealon, S. J. Blanksby, R. J. rusco, Biochim. Biophys. Acta (2008) 10.1016/j.bbalip.2008.04.002 [DOI] [PubMed] [Google Scholar]
- 32.Rujoi M, Estrada R, Yappert MC, Anal. Chem (2004) 10.1021/ac0349680 [DOI] [PubMed] [Google Scholar]
- 33.Raguz M, Widomska J, Dillon J, Gaillard ER, Subczynski WK, Biochim. Biophys. Acta (2009) 10.1016/j.bbamem.2009.09.005 [DOI] [PMC free article] [PubMed] [Google Scholar]
- 34.Rujoi M, Jin J, Borchman D, Tang D, Yappert MC, Investig. Ophthalmol. Vis. Sci (2003) 10.1167/iovs.02-0786 [DOI] [PubMed] [Google Scholar]
- 35.Zelenka PS, Curr. Eye Res 3, 1337(1984) [DOI] [PubMed] [Google Scholar]
- 36.Bassnett S, Shi Y, Vrensen GFJM, Philos. Trans. Royal Soc. B (2011) 10.1098/rstb.2010.0302 [DOI] [PMC free article] [PubMed] [Google Scholar]
- 37.Gonen T, Cheng Y, Kistler J, Walz T, J. Mol. Biol (2004) 10.1016/j.jmb.2004.07.076 [DOI] [PubMed] [Google Scholar]
- 38.Kistler J, Bullivant S, FEBS Lett (1980) 10.1016/j.jmb.2004.07.076 [DOI] [PubMed] [Google Scholar]
- 39.Buzhynskyy N, Hite RK, Walz T, Scheuring S, EMBO Rep.(2006) 10.1038/sj.embor.7400858 [DOI] [PMC free article] [PubMed] [Google Scholar]
- 40.Buzhynskyy N, Sens P, Behar-Cohen F, Scheuring S, New J. Phys (2011) 10.1088/1367-2630/13/8/085016 [DOI] [Google Scholar]
- 41.Costello MJ, McIntosh TJ, Robertson JD, Investig. Ophthalmol. Vis. Sci 30 975(1989) [PubMed] [Google Scholar]
- 42.Dunia I, Cibert C, Gong X, Xia C, Recouvreur M, Levy E, Kumar N, Bloemendal H, Benedetti EL, Eur. J. Cell Biol (2006) 10.1016/j.ejcb.2006.03.006 [DOI] [PubMed] [Google Scholar]
- 43.Kuszak JR, Zoltoski RK, Tiedemann CE, Int. J. Dev. Biol (2004) 10.1387/ijdb.041880jk [DOI] [PubMed] [Google Scholar]
- 44.Zampighi GA, Eskandari S, Hall JE, Zampighi L, Kreman M, Exp. Eye Res 75 505(2002) [DOI] [PubMed] [Google Scholar]
- 45.Jain AK, Pattern Recognit. Lett (2010) 10.1016/j.patrec.2009.09.011 [DOI] [Google Scholar]
- 46.Charrad M, Ghazzali N, Boiteau V, Niknafs A, J. Stat. Softw (2014) 10.18637/jss.v061.i06 [DOI] [Google Scholar]
- 47.Borgia G, Brown R, Fantazzini P, J. Magn. Reson (1998) 10.1006/jmre.1998.1387 [DOI] [PubMed] [Google Scholar]
- 48.Borgia G, Brown R, Fantazzini P, J. Magn. Reson (2000) 10.1006/jmre.2000.2197 [DOI] [Google Scholar]
- 49.Gardner DG, Gardner JC, Laush G, Meinke WW, J. Chem. Phys (1959) 10.1063/1.1730560 [DOI] [Google Scholar]
- 50.Jibia AU, Salami ME, Int. J. Comput. Theory Eng,(2012) 10.7763/ijcte.2012.v4.571 [DOI] [Google Scholar]
- 51.Yeramian E, Claverie P, Nature (1987) 10.1038/326169a0 [DOI] [Google Scholar]


