

Abstract
We suggest a novel kinetic approach to quantifying receptor–ligand interactions via the cellular transport and/or accumulation of the ligand. The system of cobalamin (Cbl, vitamin B12) transport was used as a model, because Cbl is an obligatory cofactor, taken up by animal cells with the help of a transport protein and a membrane receptor. Bovine transcobalamin (bTC) stimulated the cellular accumulation and transcytosis of radioactive [57Co]Cbl in polarized monolayers of Caco-2 cells. The bovine protein was much more efficient than human TC. The transport was inhibited in a dose-dependent manner by the unlabeled bTC-Cbl complex, the ligand-free bTC, and the receptor-associated protein (RAP). This inhibition pattern implied the presence of a megalin-like receptor. Quantitative assessment of kinetic records by the suggested method revealed the apparent concentration of receptors in vitro (≈15 nM), as well as the dissociation constants of bTC–Cbl (Kd = 13 nM) and RAP (Kd = 1.3 nM). The data were used to estimate the effective luminal concentrations of TC-specific receptors in kidneys (3.8 µM) and intestine (50 nM), the tissues resembling polarized Caco-2 cells.
INTRODUCTION
Characterization of membrane receptor binding activity is usually performed after isolation of the relevant membrane fraction, followed by solubilization and immobilization of the receptor in question. Disturbance of the natural environment, as well as various treatments, might change the affinity and create a false impression regarding receptor functionality under physiological conditions.
Among the eye-catching examples of a contradictory quantification of receptor–ligand interactions is the system of cobalamin (Cbl, vitamin B12) uptake in mammalian tissues. The uptake is mediated via interaction of the specific Cbl-transporting protein transcobalamin (TC) and the two known receptors of the TC–Cbl complex, CD320 and megalin. CD320 is assumed to be responsible for the ubiquitous cellular uptake of circulating TC–Cbl from blood (Quadros et al., 2009), whereas the multifunctional receptor megalin (also known as LRP2) is apparently responsible for the renal reabsorption of TC–Cbl (Birn et al., 2002). Previous examinations of membrane preparations, as well as solubilized or immobilized receptors, revealed a broad span of estimated dissociation constants with Kd = 0.02–6.7 nM for CD320 (Seligman and Allen, 1978; Nexo and Hollenberg, 1980; Quadros et al., 1994, 2005) and Kd = 12–1400 nM for megalin (Moestrup et al., 1996). This high dispersion apparently originates from 1) various techniques used to isolate the receptors and 2) disparate binding protocols used. A broad span of affinities adds some ambiguity concerning the receptor–TC interactions in vivo, because the concentration of TC–Cbl complex in blood and primary urine is low (typically below 0.2 nM). In addition, there are no estimates of the effective receptor concentrations in the luminal spaces of relevant tissues. The quantitative characterization of Cbl uptake is nevertheless important from several angles of view, as outlined below.
Cobalamins are water-soluble organometallic molecules with the same core structure of [Co3+]Cbl, but differing in the cobalt-coordinated exchangeable group X—for example, cyanide (in the synthetic form CNCbl), water (in HOCbl), 5′-deoxyadenosyl (in AdoCbl), and methyl (in MeCbl; Kräutler and Puffer, 2012). The uptake of Cbl by humans is via a complex route, involving a number of specific protein transporters and receptors, reviewed in Fedosov (2012), Nielsen et al. (2012), and Green et al. (2017). Intestinal absorption of Cbl is usually achieved through the concerted action of the Cbl-binding protein intrinsic factor (IF) and the IF–Cbl receptor cubam. The transport from blood to body cells requires TC and CD320. Internalized Cbl with any X-group is gradually converted to its two coenzyme forms (AdoCbl and MeCbl), which are light-sensitive and easily produce the third natural form (HOCbl; Kräutler and Puffer, 2012). Insufficiency of Cbl causes inhibition of the related enzymes and eventually leads to megaloblastic anemia and/or neural disorders, if not treated in time (Green et al., 2017).
Humans acquire Cbl from animal-derived products and vitamin supplements, which provide an ample amount of the vitamin (Watanabe, 2007; Fedosov, 2012) in comparison with the recommended daily dose of ≈2 nmol (≈2.7 µg; Green et al., 2017). Accordingly, there is a general positive correlation between the intake of animal foods and Cbl status (Miller et al, 1991; Watanabe, 2007). Bioavailability of vitamin B12 from dietary sources is essentially determined by the properties of various Cbl-binding proteins present in food (Carmel, 1995; Watanabe, 2007). They usually constrain Cbl, especially if the proteins have a high resistance to digestion. Yet possible interactions of the Cbl-binding proteins with intestinal receptors (different from cubam) might facilitate uptake.
Cow’s milk suggests an interesting potential alternative to the conventional transportation route, because approximately half of the endogenous Cbl in cow’s milk is bound to TC (Fedosov et al., 1996, 2018). The complex TC–Cbl might bypass the “normal” intestinal route if compatible receptors are present. Indeed, the ingestion of milk seems to be particularly beneficial in terms of B12 status, according to several population studies (Vogiatzoglou et al., 2009; Matte et al., 2012). Moreover, purified bovine TC (bTC) promoted accumulation of CNCbl by polarized Caco-2 monolayers (Hine et al., 2014), a widely used model of the human small intestine epithelium (Ramanujam et al., 1991; Bose et al., 1997, 2007; Pons et al., 2000; Hubatsch et al., 2007). Earlier qualitative and semiquantitative data showed a considerable enhancement of Cbl transport (apical to basolateral) across Caco-2 monolayers upon addition of human IF (Ramanujam et al., 1991; Pons et al., 2000), as well as some enhancement in the presence of human TC (Bose et al., 1997; Pons et al., 2000). In contrast, the binding of Cbl to HC (Ramanujam et al., 1991; Pons et al., 2000) or the addition of anti-TC antibodies in the TC-related experiments (Pons et al., 2000) suppressed the transcytosis.
The high importance of Cbl and the uncertain quantitative description of its receptor binding appeal to an approach that allows measurement of affinity and receptor content directly under the translocation of Cbl through a cell layer. We suggest for this purpose a computational kinetic method that relies on the measurement of accumulated/transported ligand. We demonstrate that the passage of radioactive HO[57Co]Cbl through the Caco-2 monolayer is much more efficient when the ligand is bound to bovine TC rather than human TC. This observation might imply the possibility of an unusual transportation route for Cbl in the small intestine. Quantitative characterization of the receptor(s) content and ligand affinity is done, and inferences concerning the physiologically relevant tissues are discussed.
RESULTS
General scheme of the transcellular transport of Cbl
Figure 1 depicts the mechanism of transcellular transport of Cbl used in our work. It was chosen based on the principle of minimal sufficiency and can be regarded as a plausible simplification of a more complex process. The scheme is briefly outlined in the current paragraph, and a more detailed description can be found in Materials and Methods, under Kinetics. The model considers three transitions, A → A* → B → C. The first transition, A → A* (with the rate v0), is confined to the upper (apical) compartment (with the volume VA = 1 ml) and describes transformation of the receptor-bound “substrate” (e.g., bTC–HO[57Co]Cbl) to its modified form A*, ready for cellular uptake. Equilibration of the receptor with its “substrate” and optional “inhibitors” affects the rate of A → A* transition. The second step, A* → B (with the rate constant k1), reflects the uptake of A* into the cellular compartment (Caco-2 monolayer, with the volume VB = 10 µl). The third transition, B → C (with the apparent rate constant k2), describes how the accumulated intermediate B is exported to the lower (basolateral) compartment (with the volume VC = 1 ml). A few possible minor routes of bTC–Cbl transportation were ignored, such as direct crossing of the monolayer by bTC–Cbl or reabsorption of bTC/hTC–Cbl from the basolateral compartment, followed by backward transport to the apical compartment (Pons et al., 2000; Hannibal et al., 2018). The time-dependent accumulation of C and the endpoint amount of B constituted the objects of our kinetic analysis.
FIGURE 1:

Scheme of TC–HO[57Co]Cbl transport across a monolayer of cells. The first transition, A → A* (solid arrow), goes with a velocity (v0) and describes transformation of the receptor–substrate complex (RS), containing the bound TC–HO[57Co]Cbl (S), to a complex R*S ready for cellular uptake. “A” denotes the total quantity of TC–HO[57Co]Cbl in the upper (apical) compartment (volume VA = 1 ml). “A*” denotes TC–HO[57Co]Cbl ready for cellular uptake. The presence of a competitive inhibitor (I), such as nonradioactive TC–Cbl, affects v0. The second transition, A* → B, has a rate constant k1 and describes the receptor–mediated cellular uptake of TC–HO[57Co]Cbl, where “B” stands for the total radioactivity within the cellular compartment (volume VB = 10 µl). The third transition, B → C, has an apparent rate constant k2 and describes the export of HO[57Co]Cbl to the lower (basolateral) compartment (volume VC = 1 ml). “C” denotes the total amount of radioactive tracer accumulated in VC. The export is mediated by a specific transporter (E), affected by the presence of a competitive inhibitor (I), such as nonradioactive Cbl. The parallel transport of I (e.g., Cbl) is depicted by dashed arrows.
Qualitative assessment of TC effects on HO[57Co]Cbl transport
Several qualitative experiments were done to test the ability of two TC types (bovine and human) to promote the cellular uptake and the transcellular transport of HO[57Co]Cbl by Caco-2 monolayers after 10 h of incubation. In the first setup, we compared the results for free HO[57Co]Cbl and its preformed complexes with those for bTC or hTC (see Materials and Methods). The three ligands HO[57Co]Cbl, hTC–HO[57Co]Cbl, and bTC–HO[57Co]Cbl were added to the apical compartment (pH 7.4), and accumulation and translocation were measured as percentages of total radioactivity, because the total concentration of added tracer varied from 10 to 16 nM due to technical details of different experiments (performed over several months). The intracellular and translocated counts after 10 h of incubation are shown in Figure 2, A and B. The intracellular counts (Figure 2B) were normalized to total protein content of cell lysates and expressed as percentages of the tracer per milligram of protein.
FIGURE 2:

Effect of TC on the cellular transport of HO[57Co]Cbl (10 h incubation) and examination of inhibitors. (A, B) Intracellular and transported radioactivity (in the respective panels) after addition of HO[57Co]Cbl to the apical compartment without additives or with hTC or bTC. The Y-axis presents the percentage of the total radioactivity shown in a logarithmic scale. Symbols indicate the individual measurements, while the horizontal line/box/whiskers correspond to mean/SEM/range, respectively. Probabilities of pairwise identity between the data sets are indicated by braces (p, Tukey–Kramer test for multiple comparisons). (C, D) Inhibition of the intracellular and basolateral accumulation of radioactivity, respectively, in the presence of bTC, bTC–HOCbl, chloroquine, or heparin in the apical compartment. The Y-axis presents the decrease of measured values in relation to bTC–HO[57Co]Cbl taken alone (baseline —). Other notation as in panels A and B. Probability of identity to the baseline is shown by an arrow (p, Dunnett test). For the details see the main text.
Intracellular accumulation of free apical HO[57Co]Cbl (Figure 2A) was low but increased by factors of ≈5 and ≈40 when its complexes with hTC and bTC were preformed. Transcellular passage of free HO[57Co]Cbl (Figure 2B) was low and did not change in the presence of hTC, at least within our time scale of 10 h (shorter than the 30 h employed by Pons et al., 2000). Substitution of a semipurified human seminal TC for the recombinant hTC made no difference (n = 2; the data were pooled with recombinant hTC). In contrast, the transport increased by a factor of 65 when the bTC–HO[57Co]Cbl complex was applied (Figure 2B, closed triangles). Some conjectures about the difference between hTC and bTC are presented in the Discussion.
A control experiment on permeability of the Caco-2 monolayer showed that its integrity was not affected by bTC. The apparent permeability coefficient Papp of D–[14C]–mannitol in the presence and absence of bTC–HOCbl (16 nM) remained unchanged (p = 0.49), with respective values of Papp = (1.81 ± 0.05) × 10–7 and (1.83 ± 0.03) × 10–7 cm/s. Both coefficients are well below Papp = 1 × 10⁻⁶ cm/s, associated with a “leaking” monolayer (Hubatsch et al., 2007).
Protein association patterns of transported basolateral Cbl
The translocated radioactivity was collected from the basolateral compartment between 6 and 10 h of incubation and corresponded to ≈280 pM of [57Co]Cbl. The ligand was retrieved mainly as the protein-free [57Co]Cbl (70%); see the gel filtration profile in Supplemental Figure S1A. The rest was bound to proteins with molecular weights of HC (14%) and TC (16%), whose origins were assessed further. The culture medium contained 1:10 thermoinactivated bovine serum, which provided the exceptionally heat-resistant bovine HC (Fedosov et al., 1996) at a concentration of ≈40 pM plus a small amount of bTC ≈ 4 pM; see Supplemental Figure S1B. These “exogenous” proteins captured free [57Co]Cbl and artificially increased the protein-bound radioactivity by ≈16%. Secretion of hTC by Caco-2 cells (≈3 pM/h to the apical chamber and ≈5 pM/h to the basolateral chamber; see Supplemental Figure S1C) further added ≈7% to the protein-bound pool. This material balance indicated that only a minor (≈7%) direct transfer of the original bTC–HO[57Co]Cbl through the monolayer took place under the conditions used (corroborating our assumption about the insignificance of this route). The translocated [57Co]Cbl remained unmodified, as judged from its ability to bind to the most specific carrier IF; see the elution profile in Supplemental Figure S1A.
Analysis of the [57Co]Cbl binding patterns in the basolateral compartment also confirmed that the backward basolateral → apical transport of TC–Cbl was of low impact. Thus, only 16% of [57Co]Cbl was bound to hTC/bTC in the basolateral compartment at a total concentration of [57Co]Cbl ≈ 280 pM. At low ligand concentrations, presence of the “inert” binder HC (≈40 pM in the medium) guaranteed capture of the translocated free [57Co]Cbl, preventing its binding to the gradually accumulating “active” transporter hTC.
Qualitative assessment of inhibitors
In a setup similar to that of the preceding section, we qualitatively examined the effects of several potential inhibitors on the cellular uptake and the transcellular transport of HO[57Co]Cbl. The apical medium contained the “substrate” (bTC–HO[57Co]Cbl ≈ 5–15 nM) and a fixed concentration of one or another inhibitor. The following compounds were used: 1) a fivefold molar excess of ligand-free bTC (unsaturated TC binds to the receptor megalin [Moestrup et al., 1996] but has a low affinity for CD320 [Quadros et al., 2005]); 2) a fivefold molar excess of bTC–HOCbl (TC–Cbl binds to both receptors); 3) 75 µM of chloroquine (which inhibits clathrin-mediated endocytosis); and 4) 50 µg/ml heparin (a known binder of hTC; Fedosov et al., 2005). The inhibiting effect (relative to the control with bTC–HO[57Co]Cbl taken alone) was very noticeable for all compounds (n = 4 in each case) and covered both the intracellular accumulation (Figure 2C) and the transcellular transport of [57Co]Cbl (Figure 2D). Earlier, the chloroquine-induced inhibition of TC–Cbl transcytosis was observed in Caco-2 monolayers by Pons et al. (2000) but not by Bose et al. (1997).
Kinetics of TC–HO[57Co]Cbl transport and inhibition by TC–HOCbl and RAP
Increasing amounts of unlabeled bTC–HOCbl or receptor-associated protein (RAP; an antagonist of megalin binding [Moestrup et al., 1996] with no effect on CD320 binding [Quadros et al., 2009]) suppressed the transport of labeled bTC–HO[57Co]Cbl in a dose-dependent way (Figure 3). The shapes of translocation curves (representing integrated radioactivity in the basolateral compartment traced over time) were consistent with the minimal kinetic scheme in Figure 1 (see also Materials and Methods, under Kinetics).
FIGURE 3:

Time–dependent accumulation of radioactive Cbl in the basolateral compartment (C in % of total radioactivity added to the apical compartment) and the effect of inhibitors. (A) Suppression of transport by nonradioactive bTC–HOCbl. The apical compartment contained 1.5 nM of bTC–HO[57Co]Cbl and 0–283 nM of the inhibiting complex bTC–HOCbl. (B) Suppression of transport by RAP. The apical compartment contained 18 nM of bTC–HO[57Co]Cbl and 0–16,400 nM of RAP. All curves were approximated by Eq. 4.
In the first set of experiments, we monitored the translocation of radioactivity (supplied as bTC–HO[57Co]Cbl, called “substrate,” with an apical concentration of s0 = 1.5 nM) and the inhibition of this process by variable concentrations of its nonradioactive antagonist bTC–HOCbl (called “inhibitor,” with apical i0 = 0–282 nM). The respective records for accumulation of C in the basolateral compartment are shown in Figure 3A. The initial fits were done with the help of Eq. 4 under Kinetics, which included three floating parameters (v0, k1, and k2). It was, however, found that the value of k1 fluctuated around 1 h–1 without any particular correlation with the inhibitor concentration (preliminary fits are omitted). After a few trials, k1 was fixed at 1.3 h–1, which was reasonably consistent with both all C-curves in Figure 3A and the endpoint levels of intracellular radioactivity (B-curves in Figure 4; see the next section). The remaining floating parameters (v0 and k2) were calculated for each C-curve by fitting and used for the analysis of binding processes in the apical compartment (via v0 values) and inside the cells (via k2 values); see the corresponding sections. The final fitting curves are presented in Figure 3A as solid lines.
FIGURE 4:

Accumulation of the radioactive ligand in the cells (B in % of the total radioactivity at 10 h) and the effect of inhibitors: nonradioactive bTC–HOCbl (circles) and RAP (squares). Open symbols show the experimental values; closed symbols depict predictions of the kinetic model based on the curve fitting in Figure 3. Concentrations of both inhibitors on the X-axis correspond to the apical compartment. (A) Short concentration scale, direct X coordinates. (B) Full concentration scale, logarithmic X coordinates.
The second setup elucidated inhibition of the transcellular transport by RAP (Figure 3B). These experiments used higher concentrations of bTC–HO[57Co]Cbl (fixed at s0 = 18 nM), which in turn required an increase in RAP (i0 = 0–16,400 nM). More radioactive tracer (s0) was added, because the high-affinity binding of RAP gave the half-inhibition effect at a very low protein concentration (if using s0 = 1.5 nM as in the bTC experiment; Figure 3A). The kinetic RAP–curves in Figure 3B were approximated by Eq. 4, where k1 was set to 1.3 h–1 (see the preceding paragraph). The floating coefficients v0 and k2 were calculated by curve fitting and subjected to further analysis of the binding equilibria; see the relevant section.
Intracellular tracer accumulation and its inhibition by bTC–HOCbl and RAP
The intracellular radioactivity of [57Co]Cbl was measured at the end of transport studies (10 h). The recovered percentage of total radioactivity was plotted versus the starting apical concentrations of bTC–HOCbl and RAP. Figure 4A presents the data plotted on a direct scale of ligand concentrations (within a shorter span), while Figure 4B depicts the full span of measurements shown in semilogarithmic coordinates. The experimental measurements (open symbols) are aligned with the theoretical values (closed symbols) predicted from the fitting of each C-curve in Figure 3. A good correspondence between the experimental data and the kinetic predictions (deduced from the kinetic events in other compartments) serves as additional validation of the model. The intracellular radioactivity (in the absence of inhibitors) corresponded to the intracellular concentrations of [57Co]Cbl ≈ 15 nM in the bTC–HOCbl experiment (with a lower content of the substrate) and ≈160 nM in the RAP experiment (where a higher content of the substrate was used). The usual steady state concentrations of Cbl in animal tissues range from 10 nM (e.g., in the muscles) to 1000 nM (e.g., in the liver), as reviewed by Watanabe (2007) and Fedosov (2012).
Extracellular receptor binding of bTC–HOCbl and RAP in the apical compartment
The data on the inhibition of transport (Figure 3) and the intracellular accumulation of bTC–HO[57Co]Cbl after 10 h of incubation (Figure 4) helped to quantify the binding equilibria in the upper (apical) compartment. We used for this purpose the rate v0 calculated in two variants: 1) according to the curve fitting in Figure 3 (Eq. 4 was used) and 2) from a single 10-h measurement of the summed radioactivity, covering the intracellular counts (Figure 4) and counts transcytosed into the lower (basolateral) compartment (Figure 3). The result of second evaluation was called a “surrogate” v0; see the substantiation in Eq. 5. Both assessments of v0 represented the actual data assessed by two different calculation techniques, which were expected to give similar results (if the model did not contain an internal contradiction). The points in Figure 5 did not show any conspicuous difference from each other and were overlaid. Approximation of the pooled data sets was done using Eq. 6. This equilibrium saturation function allows calculation of both the dissociation constant(s) (Ks and/or Ki) and the apparent concentration of the binding sites (e0), when their values are comparable under the experimental conditions (see Materials and Methods, under Equilibrium reactions).
FIGURE 5:

Inhibition of the receptor transformation velocity v0 by (A) nonradioactive bTC–HOCbl and (B) RAP. Circles indicate v0 values obtained from the transcellular transportation curves in Figure 3. Triangles show the “surrogate” v0 based on single measurements of the transported radioactivity (10 h in Figure 3) combined with the intracellular radioactivity (Figure 4). All curves were fitted by Eq. 6.
Inhibition of transport by bTC–HOCbl (Figure 5A) was characterized by the following parameters: F0 = 1.75 ± 0.02%·h–1 (i.e., v0 without the inhibitor), ∆F = –1.64 ± 0.05%·h–1 (the maximal amplitude of v0 changes), e0 = 14.0 ± 2.1 nM (the receptor concentration in the apical compartment), and Ks = Ki = 12.9 ± 4.5 nM (the dissociation constants of bTC–HO[57Co]Cbl and bTC–HOCbl complexes, assumed to be identical to each other). All fitting results are shown as the optimal value ± SE.
The analogous analysis for RAP is presented in Figure 5B. Fitting was done using the stipulated value of Ks = 12.9 nM (the dissociation constant of bTC–HOCbl determined in the preceding paragraph). The other parameters were assessed by fitting as F0 = 1.51 ± 0.01%·h–1, ∆F = –1.45 ± 0.02%·h–1, e0 = 18.0 ± 1.2 nM, and Ki = 1.31 ± 0.18 nM, indicating that RAP binds to the Caco-2 surface receptor ∼10-fold more strongly than bTC–HOCbl. A small difference in receptor concentrations (e0) in bTC and RAP experiments was ascribed to a slight variation in the cell number.
Intracellular events of [57Co]Cbl secretion to the basolateral compartment
Secretion of HO[57Co]Cbl (and possibly minor amounts of processed Ado[57Co]Cbl and Me[57Co]Cbl) from the monolayer to the basolateral compartment is governed by the parameter k2 (Figure 1), determined from the kinetic curves in Figure 3. The nonradioactive complex bTC–HOCbl noticeably decreased k2 within the lower range of its apical concentrations, <50 nM (Figure 6A). Such sensitivity of the kinetic “constant” to inhibition confirms its apparent status (conjectured in the model) and exposes competitive relationships between the radioactive tracer HO[57Co]Cbl and the nonradioactive HOCbl inside the cell. The inhibiting effect of RAP on k2 was marginal at low-to-moderate apical concentrations of 0–500 nM (Figure 6B), probably because of the lysosomal degradation of endocytosed RAP (Czekay et al., 1997), with no consequence for the intracellular medium. Some decrease in k2 at a very high concentration of RAP (corresponding to protein ≈ 0.1–1 mg/ml) was regarded as nonspecific.
FIGURE 6:

Inhibition effects of nonradioactive bTC–HOCbl and RAP inside the intracellular compartment. Response of the cellular secretion rate constant k2 to (A) extracellular bTC–HOCbl and (B) extracellular RAP; both data sets are approximated by empirical curves. (C) Connection of the intracellular HO[57Co]Cbl and the intracellular nonradioactive HOCbl by Eq. 8. (D) Dependence of the transportation parameter k2 on the intracellular inhibitor (nonradioactive HOCbl). The curve was fitted by Eq. 6.
We used the percentage of intracellular radioactivity at 10 h of incubation (smoothing curve in Figure 4) to estimate the intracellular concentrations of HO[57Co]Cbl and HOCbl based on the apical concentrations of bTC–HO[57Co]Cbl and bTC–HOCbl (see Eqs. 7 and 8 in Materials and Methods). The two values were plotted versus each other in Figure 6C and used to quantify HOCbl–mediated inhibition of the intracellular transporter E (e.g., multidrug resistance protein 1 [MRP1]; Beedholm-Ebsen et al., 2010), which participates in the secretion of Cbl into the lower compartment. For this purpose, k2 was plotted versus icell in Figure 6D, whereupon the chart was fitted by Eq. 6, either supplemented by Eq. 8 (to express scell as a function of icell) or using any small s0 (see Kinetics). The two fitting procedures gave a total overlap of the curves and only marginal differences in the calculated parameters, assessed as F0 = –∆F = 0.193 ± 0.01 h–1 (starting value of k2, equated to the negative total amplitude to stipulate the absent final level), e0 ≈ 70 ± 67 nM (the intracellular concentration of transporter E), and Ks = Ki ≈ 110 ± 102 nM (the dissociation constant of Cbl from the intracellular transporter). The obtained values of e0 and Ks corroborated the initial assumption of our kinetic model that the intracellular concentrations of [57Co]Cbl ≤ 15 nM (bTC–HOCbl experiment) are considerably smaller than both e0 and Ks, thereby making the layouts of Eqs. 3 and 4 acceptable in connection with their presentation of k2 (stipulating no B terms within the k2 function).
DISCUSSION
In the current study, we employed polarized monolayers of Caco-2 cells to analyze the ligand–receptor interactions under transcellular passage of Cbl, free or bound to TC. A kinetic model (Figure 1) was developed to quantify and interpret the transportation curves (Figure 3). The suggested method is generally applicable to transcellular trafficking and intracellular accumulation of ligands.
The two tested carriers bTC and hTC (of bovine and human origin, respectively) behaved differently in promoting the uptake of Cbl (Figure 2A) and its transcellular transport (Figure 2B). It appeared that bTC was much more efficient, especially under the transcellular passage. The difference between bTC and hTC might be associated with different pI values of the two proteins (9.22 and 6.29, respectively). A positive charge of bTC at neutral pH should stabilize it at the negatively charged cell membrane surface, facilitating the subsequent encounter with the specific receptor. We also found that facilitated uptake of bTC–Cbl was approximately fourfold higher than previously reported by other authors, who used a rather low degree of TC–saturation by Cbl (16%; Hine et al., 2014), in comparison to our assay (≥90%). The presence of excessive ligand-free bTC should cause a noticeable inhibition of bTC–Cbl uptake, as follows from our data in Figure 2, C and D.
The original bTC apparently degraded upon translocation of [57Co]Cbl, because nearly all radioactivity in the basolateral compartment (≈93%) was associated with protein-free [57Co]Cbl, counting here both the “truly free” ligand and its fractions recaptured by the specific proteins in the medium. Basolateral liberation of free Cbl implies the lysosomal processing of endocytosed TC–Cbl, observed in different epithelial cells (see Pons et al., 2000; Hannibal et al., 2018, and references therein). The lysosomal mechanism was confirmed in our study by a noticeable inhibition of the transport by chloroquine (Figure 2, C and D), also observed by Pons et al. (2000) but not by Bose et al. (1997).
The transportation of bTC–HO[57Co]Cbl complex by the Caco-2 cells is probably receptor-mediated, and not caused by a facilitated unspecific passage through the monolayer, as was also stated by other authors (Bose et al., 1997, 2007; Pons et al., 2000). This conclusion follows from the aforementioned release of processed free [57Co]Cbl on the basolateral side, as well as from inhibition of the transport by bTC–Cbl and bTC (exposing competition for a receptor). Even more pronounced inhibition was caused by RAP (Figure 3, A and B), a specific ligand antagonist that interacts with the LDL receptor family (Czekay et al., 1997). The observed effects of the unsaturated bTC (Figure 2, C and D) and RAP exclude one of the possible receptor candidates (CD320), because it shows poor recognition of both proteins (Quadros et al., 2009). This in turn suggests that megalin might be responsible for recognition of bTC in Caco-2 cells, because this receptor binds RAP and does not discriminate between the saturated and unsaturated forms of TC (Moestrup et al., 1996, and references therein).
Expression of megalin in the animal intestinal tissues has been reported earlier (Birn et al., 1997; Yammani et al., 2001), though there is no clear consensus in this regard (Jensen et al., 2014). Notably, immunoblotting analysis of apical versus basolateral plasma membrane fractions from polarized Caco-2 cells indicated that megalin was present in the apical fragments (Bose et al., 2007), though the authors ascribed recognition of hTC to a megalin-associated protein, “TC–R.” Our immunocytochemical staining of the filter-grown Caco2 cells also revealed megalin in the apical membrane (Juul, 2017). Obviously, the possibility that a novel megalin-like receptor (coexisting with megalin in the apical membrane of Caco-2 cells) is at play cannot be excluded.
Previously reported affinities of (semi)purified megalin for TC and RAP vary within a broad range of values, apparently reflecting different treatments and immobilization techniques (Moestrup et al., 1996). In our setup, the megalin-like receptor and its ligands interacted with each other in the apical compartment of Caco-2 chamber as a close proxy for the natural environment, providing the best imitation of the functionally relevant binding to date. Analysis of the translocation curves (Figure 3), supplemented by the intracellular accumulation of [57Co]Cbl (Figure 4), allowed reconstruction of the binding events in the apical compartment (Figure 5), if suitable kinetic equations were used (shown in Kinetics). The current measurements indicated a high affinity of bTC–Cbl for the megalin-like receptor in the functioning Caco-2 cells (Kd ≈ 13 nM), which matches that of iodinated rabbit TC added to megalin in a microwell experiment (Moestrup et al., 1996).
Our setup allowed titration of the apical receptor sites, because their “active/apparent” concentration was comparable to that of the ligands and their dissociation constants. The apparent receptor concentration of ≈15 nM (corresponding to the “chemical activity” of surface receptors in a given volume) was measured in 1 ml of the apical compartment exposed to the growth surface of 3.14 cm2. The above geometric dimensions (also shown in Supplemental Figure S2) give a surface/volume ratio (S/V) of 0.314 mm–1, and this result can be used to predict the efficient concentrations of the TC receptor in the small intestine with a diameter of d = 25 mm (Helander and Fandriks, 2014) and renal proximal tubules with d = 0.05 mm (Homan et al., 2016), if the receptor-expressing surfaces of these tissues indeed resemble Caco-2 cells. We should mention in this regard that the polarized epithelial cells of different origin share many morphological and transport characteristics, as was demonstrated during comparison of Caco-2 and Madin–Darby canine kidney monolayers (e.g., Bittermann and Goss, 2017, and references thereof). The surface of the small intestine should be further increased by a factor of 6.5 (Helander and Fandriks, 2014) because of additional villi folding, absent in Caco-2 cells and epithelial cells of proximal tubules (where only a microvilli brush border exists). The S/V of an open tube depends only on its radius (r ) according to the standard geometric expression S/V = 2/r. Simple calculations give the ratios of 6.5 × 2/12.5 = 1.04 mm–1 for the intestine and 2/0.025 = 80 mm–1 for the renal proximal tubules. A comparison to S/V = 0.314 mm–1 in the apical compartment of a Caco-2 monolayer (containing ≈15 nM of the megalin-like receptor) gives an estimate of the apparent concentration of this receptor in the intestinal lumen (≈50 nM), as well as in the renal tubules (≈3800 nM).
The performed assessment of the apparent receptor concentrations and the ligand affinities predicts that ∼80% of 1.0–1.5 nM bTC–Cbl in cow’s milk will bind to megalin (megalin-like receptor) in the intestinal tract if bTC can survive proteolysis long enough to interact with the receptor. The latter requirement is rather difficult to fulfill, however. The dissociation of Cbl from bTC at pH 2 (Fedosov et al., 1996; stomach conditions) and the presence of a large number of Lys and Arg residues (trypsin targets) in the bTC sequence (Fedosov et al., 1999) make unprotected bTC an unlikely candidate to deliver Cbl. Theoretically, the protein can be partially protected by milk matrix, especially if secretion of gastric acid and proteolytic enzymes is decreased. For example, a possibility of bTC-mediated uptake can be conjectured for patients with compromised digestion, common in the elderly. Some authors claim detection of the native iodinated TC in portal blood of rats after oral administration of 125I–TC–Cbl (Bose et al., 1997), though the quantity of translocated TC has not been assessed.
The critical role of megalin in the kidney is better established (Birn et al., 2002). Here we assess the apparent concentration of “active” megalin in the kidney tubules (3.8 µM). A small diameter of kidney tubules gives a high S/V, which guarantees a high apparent concentration of the receptor and an efficient binding of nearly any ligand, such as 80% binding of a low-affinity ligand with Kd = 1 µM.
Regarding the intracellular content of Cbl, we made an attempt to evaluate the interaction of Cbl with protein(s), responsible for transfer of Cbl to the basolateral medium. The performed analysis pointed to ≈70 nM intracellular concentration of this transporter (likely to be MRP1), which bound free Cbl with the estimated dissociation constant Kd ≈ 110 nM. To the best of our knowledge, this kind of calculation has not been performed previously. It should be noted that all intracellular Cbl was treated as a ligand present within the same intracellular compartment, even though Cbl is likely to be divided between several compartments, exchanging with the ligand at unknown rates. Therefore, the binding characteristics of the intracellular transporter E should be treated with some caution. An experiment with inside-out vesicles containing MRP1 pointed to Kd = 6–23 µM for different Cbl forms (Beedholm-Ebsen et al., 2010), though it is difficult to imagine any significant binding of intracellular Cbl (10–100 nM in most tissues) at such high Kd values.
In summary, we suggest a novel kinetic method for assessing receptor–ligand binding in the polarized cells under uptake and translocation of a ligand (here Cbl). We found that bovine transcobalamin considerably enhanced transcytosis of Cbl through the Caco-2 monolayer, and this process was assisted by a RAP-sensitive megalin-like receptor. Inferences about the binding interactions were suggested for the relevant tissues.
MATERIALS AND METHODS
Materials
CN[57Co]Cbl (0.41 µCi/pmol) was purchased from MP Biomedicals (Santa Ana, CA). CN[57Co]Cbl was converted into HO[57Co]Cbl by photoaquation as previously described (Kornerup et al., 2016). D-[1-14C]-mannitol (56.8 mCi/mmol) was purchased from Perkin Elmer (Waltham, MA). The human colorectal adenocarcinoma cell line Caco-2 (passage 29) was obtained from DSMZ (Braunschweig, Germany). Cell culture medium (DMEM Glutamax) and bovine serum were from Life Technologies (Carlsbad, CA). The BCA protein assay kit was from Pierce Biotechnology (Waltham, MA). Recombinant bovine and human TCs were expressed in Pichia pastoris and further processed as detailed earlier (Fedosov et al., 1999, 2000). Recombinant human IF was obtained as described elsewhere (Fedosov et al., 2003). Semipurified human TC was obtained from seminal fluid as previously described (Hansen and Nexo, 1992). Human recombinant RAP was expressed in Escherichia coli and purified as described earlier (Nykjaer et al., 1992). Complete protease inhibitor tablets were from Roche (Basel, Switzerland). Ni–NTA resin was purchased from G Biosciences (St. Louis, MO). EDTA-free SigmaFAST protease inhibitor tablets, heparin from porcine intestinal mucosa, chloroquine, and all standard compounds were purchased from Sigma-Aldrich (St. Louis, MO).
Preparation of TC–HO[57Co]Cbl complex
The complex of recombinant TC (bovine or human) and radioactive HO[57Co]Cbl was prepared in the course of at least 15 min coincubation in the culture medium (22°C) before the cell experiments. The radioactive ligand contained a minor fraction of HO[57Co]Cbl (35–40 pM, 500–650 Bq/ml) plus a major fraction of HOCbl (1 nM or more), regarded as a single pool. The TC sample contained 1.1 molar excess binding capacity.
Cell culture
Caco-2 cells were grown to 50–60% confluence in DMEM Glutamax cell culture medium, which contained 4 µg/ml folate (specifications) and no vitamin B12 (specifications and measurements), as far as the cofactors of one carbon metabolism were concerned. The medium was supplemented with 10% heat-inactivated fetal bovine serum (FBS; 20 pM B12 in the original serum), 100 U/ml penicillin, and 100 µg/ml streptomycin. The other conditions included humidified 5% CO2/95% air atmosphere at 37°C. The culture medium was replaced every second day. The cells were subcultured by trypsinization with 0.25% trypsin and 0.9 nM EDTA in Dulbecco’s phosphate-buffered saline (PBS) without Mg2+ or Ca2+ (DPBS–).
The Caco-2 cells used for transport studies were seeded in Nunc cell culture inserts (growth area 3.14 cm2, pore size 0.4 µm; Thermo Fisher Scientific, Waltham, MA) at a density of ∼2.25 × 10⁵ cells/insert. The seeded cells were cultured in growth medium (1 ml apically and 2 ml basolaterally) with changes of medium 16 h after seeding and then every second day.
Cbl transport studies
Caco-2 cells (passage 32–42) were grown for 3 wk on porous membranes in the upper compartment of a two-compartment system as described above. The integrity of monolayers was assessed by transepithelial electric resistance (TEER), measured with a Millicell ERS 2 V ohmmeter (Millipore) and transepithelial flux of D-[1-14C]-mannitol (see below). Caco-2 monolayers with TEER values above 900 ohm cm2 were used for transport studies. Cbl transport studies were performed under humidified 5% CO2/95% air at 37°C with complete culture medium (1 ml) in the basolateral compartment.
The apical incubation solution (1 ml of the complete culture medium) contained a constant initial concentration of the preformed complex of TC–HO[57Co]Cbl or free HO[57Co]Cbl and various initial concentrations of unlabeled TC–HOCbl and TC; see Results for further details. Samples of free HO[57Co]Cbl were prepared by adding unlabeled HOCbl (10–15 nM) to the complete culture medium 15 min before adding free radiolabeled HO[57Co]Cbl (500–650 Bq/ml). This scheme was chosen because the complete culture medium possessed a minor binding capacity for free Cbl (40–50 pM). The whole mixture was regarded afterward as a “radioactive substrate,” disregarding the binding of a small fraction of HOCbl. In samples supplemented with chloroquine (75 µM), heparin (50 µg/ml), or RAP (up to 16400 nM), these compounds were coincubated with bTC–HO[57Co]Cbl in the complete culture medium.
Basolateral samples of transported HO[57Co]Cbl were collected at the indicated time points by replacement of the complete growth medium. The transport reaction was terminated by aspiration of the apical medium. The monolayers were rinsed twice with DPBS containing MgCl2 and CaCl2 (DPBS+) and the TEER values were measured. The cells were detached by trypsinization, washed three times in DPBS+ with protease inhibitors (Complete), and lysed by sonication (Branson SLPe sonifier). Aliquots of the solubilized cells were taken for measurement of protein and radioactivity. Protein quantification was done using the Pierce BCA Protein Assay Kit (Thermo Scientific). The amount of [57Co]Cbl in the collected fractions (apical and basolateral media and cell lysates) was measured in equal volumes by gamma counting (Perkin Elmer/Wallac Wizard-2 2470 automatic gamma counter), and the results were adjusted to the total sample volume. Intracellular uptake and transcytosis of [57Co]Cbl are presented as percentages relative to the total radioactivity recovered (the apical and basolateral media plus cell lysates) and normalized to the protein content of the cell lysate.
Gel filtration study
Size exclusion chromatography was done by high-performance liquid chromatography on a Superdex 200 column injected with 0.5 ml of the test medium containing the necessary additives (e.g., none, 10 nM IF, 161 pM HO[57Co]Cbl). The elution buffer (pH 8.0) contained 0.1 M Tris, 1 M NaCl, 0.02% NaN3, and 0.05% bovine albumin and was pumped at a rate of 0.4 ml/min.
D-[14C]-mannitol permeability
Permeability of D-[14C]-mannitol (3.5 µM) after 10 h with or without bTC–HOCbl (18 nM bTC and 16 nM HOCbl) was measured. Basolateral samples were counted in a scintillation counter and the apparent permeability coefficient (Papp, cm/s) was determined as
 |
where dQ/dt is the steady state flux (cpm/s), A is the surface area of the cell culture insert membrane (3.14 cm2), and C0 is the initial concentration in the apical compartment (cpm/ml).
Statistical analysis
Results from transport experiments are presented as mean ± SEM. Multiple pairwise tests of the equal outcome (e.g., A = B, A = C, B = C) or multiple comparisons to the baseline set (A = baseline, B = baseline, C = baseline) were done by Tukey–Kramer and Dunnett tests, respectively. Curve fitting used the quasi-Newton least-squares method. All mathematical procedures employed KyPlot 5.0 (free software from KyensLab, Japan).
Cell dimensions
To estimate the volume and the surface area of the polarized Caco-2 cells, each cell was assumed to be a cylinder (diameter 5 µm, height 35 µm) supplemented by an apical brush border of microvilli (each microvillus being a smaller cylinder with diameter 0.1 µm and height 1.0 µm) as described in the literature (Crowe and Marsh, 1993; Crawley et al., 2014; Helander and Fandriks, 2014); see also Supplemental Figure S2. The cells were arranged within a hexagonal lattice packing, which provides ∼90.7% occupation of the total base surface (S = 3.14 cm2). The total number of cells in the layer was therefore calculated from the ratio (base surface × 0.907)/(end face surface of one cell) = 1.45 × 10⁷. The number of microvilli per cell (n = 375) was assessed using their linear dimensions and the surface enlargement factor (SEF = 13) measured on the average for the microvilli brush border in cells of the small intestine (Crawley et al., 2014). This number is somewhat less than n = 566 in the tightest hexagonal packing of microvilli. The chosen measures and spatial arrangements provided additional reference values: volume of one cell (with apical brush border) = 690 μm3; apical surface of the cell (without brush border) = 19.6 μm2; apical surface of the cell (with brush border) = 255 μm2. The total inner volume of the cellular compartment was finally estimated as ≈10 µl.
Kinetics: time-dependent reactions
The scheme in Figure 1 describes three transitions, A → A* → B → C, where the kinetic description of each compound is presented below.
Compound A.
The radioactive ligand (HO[57Co]Cbl ± TC) in the upper compartment constitutes A (given in percent), and its transition to A* is described by a rate function v0. This process goes via initial formation of the “inactive” receptor–substrate complex RS, which is further transformed to its “active” state R*S (ready for cellular uptake). The preliminary complex RS exists in a fast equilibrium involving the receptor “R,” the substrate “S” (e.g., bTC–HO[57Co]Cbl), and optionally the inhibitor “I” (e.g., bTC–HOCbl). It is plausible to assume that the total amount of all receptor forms on the cell surface (R + RS + RI) is constant, because the processes of endocytosis, recycling, destruction, and synthesis of novel receptors to some extent counterbalance each other. The transformation RS → R*S makes R*S partially or completely occluded within a membrane cavity (A* is not a part of A). However, A* is not part of the intracellular pool B either, assuming that R* loses S during washing (loss of ≤1% in total). The transformation A → A* occurs at a nearly constant rate v0 (at each given set of R, S, and I concentrations) because the overall decrease of bTC–HO[57Co]Cbl in the apical compartment is low (≤15%), meaning that A ≈ constant. As a consequence, all RS-related fast equilibria remain unperturbed. The expression for v0 can be written in several variants with the same physical meaning:
 |
The notation runs as follows: v+i = k0·rs+i and v-i = k0·rs-i are the respective rates of specific transformations in the presence and absence of inhibitor, both values being proportional to the concentration of RS complex (rs+i and rs-i); v∞i is the rate of unspecific transformation in the presence of an infinitely high inhibitor (the mechanism is not specified). The sum of (v-i + v∞i) corresponds to the overall rate v0 at a given substrate concentration without any inhibitor, whereas v-i equals the total amplitude of response to the inhibition. If the rate of unspecific transformation is very low (v∞i ≈ 0), the inhibition starts from v0 = v-i and ends at v0 ≈ 0. The final expression for v0 is identical to the fitting Eq. 6 (see further, where the advantages of such a presentation are discussed). The value of v0 depends on the ligand concentrations, their dissociation constants, and the receptor concentration (all being components of the ratio rs+i/rs-i). Further information is given in Equilibrium binding.
Decrease in A can be described with help of Eq. 1:
| (1) |
Here A0 is the quantity of A at the starting point (100%); t is the time of reaction; and v0 is the rate of change (A → A*) expressed as a percentage per time unit.
Compound A*.
The turnover of “activated” receptor–substrate complex R*S (i.e., A*) is determined by the balance between its production rate (A → A*, discussed in the preceding paragraph) and the rate of its cellular uptake (A → B) in accordance with the following expressions:
 |
 |
(2) |
Here a new coefficient k1 is introduced. This is the rate constant of mass transfer (A* → B) expressed as the reciprocal time, for example, h-1. It should be noticed that the constant of mass transfer (k1) depends on the compartment volumes and can be connected (if necessary) to the constant of concentration transfer (k1conc, independent of the volumes) as shown in the extension to Eq. 2, where VA serves as a reference volume. The value of A* increases exponentially from zero (at t = 0) to a plateau v0/k1 (at t → ∞) with the time of half reaction t½ = 0.693/k1. The plateau level remains unperturbed, as long as the changes in A0 are insignificant.
Compound B.
The intracellular quantity of bTC–HO[57Co]Cbl (or just free HO[57Co]Cbl, or both) is notated as B (expressed as a percentage). The rates of influx A* → B (the uptake of bTC–HO[57Co]Cbl from the apical compartment) and efflux B → C (the secretion of HO[57Co]Cbl to the basolateral compartment) determine changes of B over time:
 |
Here a new mass transfer coefficient k2 describes B → C secretion. The nature of k2 is somewhat ambiguous without assessment of a ready data set. This coefficient might reflect either some unspecific membrane crossing (when k2 is a true constant) or crossing via a specific transporter. In the latter case, k2 is an apparent constant and depends on the ligand and the transporter concentrations. In our setup, we assumed that the intracellular concentration of S (HO[57Co]Cbl) is much lower than the intracellular concentration of the transmembrane carrier E plus a relevant dissociation constant. This allows cancellation of S-concentrations from k2, which becomes dependent only on the transporter and the inhibitor (nonradioactive Cbl). The latter is present at much higher concentrations and quickly reaches a pseudo–steady state (making k2 ≈ constant over time). The physical interpretation of k2 · B involves transformation of B to the intracellular concentration of the substrate scell (Eq. 7), an optional correction of the intracellular substrate for each inhibitor concentration (Eq. 8), or just stipulation of any small “insignificant” value of scell and incorporation of the ligand concentrations into Eqs. 6A–6D, containing the inhibitor-dependent element ω(i), all discussed in the next sections. The function of k2 can be transformed to a form identical with the expression for v0 (discussed above) and fitting Eq. 6.
The kinetic function of B is described by Eq. 3:
 |
(3) |
The curve of intracellular radioactivity (B) is a sigmoid. It starts from zero (at t = 0) and tends to a steady state plateau v0/k2 (at t → ∞), assuming A and v0 ≈ constant.
Compound C.
The accumulated basolateral radioactivity (C as a percentage) is governed by the transition B → C. The value of C follows from the overall material balance:
Considering the aforementioned expressions for A* and B (Eqs. 2 and 3), the kinetic function of C (Eq. 4) is easily deducible:
 |
(4) |
Here the meaning of all parameters and variables is the same as in the preceding paragraphs. The appearance of C in the lower compartment should go with a noticeable lag, followed by an acceleration tending to a slope v0 (reflecting a pseudo steady state, if A ≈ constant). The C-curves were used to assess all relevant parameters (v0, k1, and k2) by nonlinear fitting.
Parameter v 0.
The independent assessment of v0 is also possible from a single point using the sum of B (intracellular radioactivity) and C (radioactivity in the lower basolateral compartment) measured after a sufficiently prolonged reaction:
 |
(5) |
The ratio (B + C)/t gives the value of a “surrogate” velocity v0 calculated from a single point (determined for a given combination of S and I).
Equation 5 can also be used for analysis of receptor–ligand interactions (reflected via the parameter v0) if basolateral secretion is absent. In this case, measurement of the accumulated substrate (either over time or at t → ∞) at different concentrations of some inhibitor would help to reconstruct a saturation curve like those in Figure 5.
Equilibrium reactions
Two parameters of the model in Figure 1 (v0 and k2) are not the real constants but depend on the respective rapid equilibria, EI ↔ I + E + S ↔ ES (where E stands for any binding protein). The scheme of competition between two ligands for a protein-binding site (when all compounds have similar concentrations comparable with their dissociation constants) was solved in the literature (Wang, 1995) and is used here in the adapted form. In each set of our kinetic experiments, the substrate was maintained at the same level but the concentration of inhibitor increased and caused a gradual decrease in the assessed factor according to Eq. 6:
 |
(6) |
Here f is the measured factor (either v0 or k2 at a given concentration of the variable i0); F0 is the initial value of this variable (at i0 = 0); ∆F corresponds to the maximal amplitude of response, where f = F0 - ∆F (at i0 → ∞), and optionally f = F0 - F0 (at i0 → ∞); es+i stands for the concentration of ES or RS in the respective S + I ligand mixtures (es+i = es-i at i0 = 0 and tends to zero at i0 → ∞); es-i corresponds to the concentration of ES complex at a given concentration of S in the absence of I. Equation 6 looks somewhat cumbersome but gives two easy identifiable parameters, namely the start value (F0) and the amplitude of response to inhibition (∆F), simplifying the fitting procedure for other parameters.
The value of es+i was expressed via a series of extending equations,
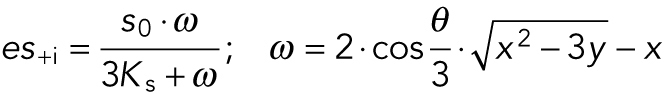 |
(6A) |
 |
(6B) |
| (6C) |
| (6D) |
where s0, i0, and e0 are the total concentrations of S, I, and E in the corresponding compartments; Ks and Ki are the dissociation constants of ES and EI, respectively; and all other symbols in Eqs. 6A–6D represent “service” functions, expressed via s0, i0, e0, and the dissociation constants.
The value of es-i can be calculated via Eqs. 6A–6D at i0 = 0, but an easier procedure involves a separate extending equation,
 |
(6E) |
Equation 6 (together with all its extensions) can be used to determine the dissociation constants Ks and Ki and the concentration of binding sites e0. The saturation functions for the intracellular compartment consider either any small s0 (eliminated in a ratio of es+i/es-i) or an empirical function expressing s0 for each particular i0; see the next section.
Intracellular events of equilibrium reactions
The percentage of intracellular radioactivity at the end of the experiment (Figure 4) was used to calculate the intracellular concentration of HO[57Co]Cbl and its nonradioactive competitor HOCbl (added as bTC–HOCbl to the apical compartment). It should be remembered that the two molecules are identical (except for radioactivity), and the percentage of uptake is expected to be the same for both compounds. We used the following expression for the intracellular concentrations of the substrate scell and the inhibitor icell, connected to the respective apical concentrations via Eq. 7:
 |
(7) |
Here xcell refers to either scell or icell (the intracellular concentrations); B(%) is the percentage of the radioactive tracer inside the cells; x0 refers to either s0 or i0 (the respective concentrations in the apical compartment); and Vup/Vcell is the ratio between the volumes of the upper (apical) compartment (1 ml) and the intracellular space (0.01 ml). The two concentrations (scell and icell) were calculated, plotted versus each other in Figure 6C, and connected via an empirical function:
| (8) |
This Eq. 8 was inserted into Eq. 6 instead of the fixed value of s0 to correct the effect of inhibitor (if any) on the intracellular scell. The alternative fitting procedures (scell fixed at any value below 15 nM) should not affect the outcome if the real transport is consistent with an assumption of scell << e0 + Ks (important for stipulation of k2 as an scell-independent term).
Supplementary Material
Acknowledgments
We warmly appreciate the competent technical assistance provided by Jette Fisker Pedersen and Inger Marie Jensen. This work is part of the TRIM Project supported by the Innovation Fund Denmark, Grant 0603–00518B (12-132437).
Abbreviations used:
- Ado/Me/CN/HOCbl
5′-deoxyadenosyl/methyl/cyano/hydroxocobalamin
- b/hTC
bovine/human transcobalamin; Cbl, cobalamin (vitamin B12)
- [57Co]Cbl
core moiety of radioactive Cbl
- HC
haptocorrin
- HO[ 57Co]Cbl
radioactive form of HOCbl
- IF
intrinsic factor
- RAP
receptor-associated protein
- TC
transcobalamin
- TC–Cbl
transcobalamin–cobalamin complex
- X[ 57Co]Cbl
radioactive Cbl with an unspecified group.
Footnotes
This article was published online ahead of print in MBoC in Press (http://www.molbiolcell.org/cgi/doi/10.1091/mbc.E18-09-0571) on December 19, 2018.
REFERENCES
- Beedholm-Ebsen R, van de Wetering K, Hardlei T, Nexø E, Borst P, Moestrup SK. (2010). Identification of multidrug resistance protein 1 (MRP1/ABCC1) as a molecular gate for cellular export of cobalamin. Blood , 1632–1639. [DOI] [PubMed] [Google Scholar]
- Birn H, Verroust PJ, Nexo E, Hager H, Jacobsen C, Christensen EI, Moestrup SK. (1997). Characterization of an epithelial approximately 460-kDa protein that facilitates endocytosis of intrinsic factor–vitamin B12 and binds receptor-associated protein. J Biol Chem , 26497–26504. [DOI] [PubMed] [Google Scholar]
- Birn H, Willnow TE, Nielsen R, Norden AG, Bonsch C, Moestrup SK, Nexo E, Christensen EI. (2002). Megalin is essential for renal proximal tubule reabsorption and accumulation of transcobalamin—B12. Am J Physiol Renal Physiol , F408–F416. [DOI] [PubMed] [Google Scholar]
- Bittermann K, Goss KU. (2017). Predicting apparent passive permeability of Caco-2 and MDCK cell-monolayers: A mechanistic model. PLoS One , e0190319. [DOI] [PMC free article] [PubMed] [Google Scholar]
- Bose S, Kalra S, Yammani RR, Ahuja R, Seetharam B. (2007). Plasma membrane delivery, endocytosis and turnover of transcobalamin receptor in polarized human intestinal epithelial cells. J Physiol , 457–466. [DOI] [PMC free article] [PubMed] [Google Scholar]
- Bose S, Seetharam S, Dahms NM, Seetharam B. (1997). Bipolar functional expression of transcobalamin II receptor in human intestinal epithelial Caco-2 cells. J Biol Chem , 3538–3543. [DOI] [PubMed] [Google Scholar]
- Carmel R. (1995). Malabsorption of food cobalamin. Baillieres Clin Haematol , 639–655. [DOI] [PubMed] [Google Scholar]
- Crawley SW, Mooseker MS, Tyska MJ. (2014). Shaping the intestinal brush border. J Cell Biol , 441–451. [DOI] [PMC free article] [PubMed] [Google Scholar]
- Crowe PT, Marsh MN. (1993). Morphometric analysis of small intestinal mucosa. IV. Determining cell volumes. Virchows Arch A Pathol Anat Histopathol , 459–466. [DOI] [PubMed] [Google Scholar]
- Czekay RP, Orlando RA, Woodward L, Lundstrom M, Farquhar MG. (1997). Endocytic trafficking of megalin/RAP complexes: dissociation of the complexes in late endosomes. Mol Biol Cell , 517–532. [DOI] [PMC free article] [PubMed] [Google Scholar]
- Fedosov SN. (2012). Physiological and molecular aspects of cobalamin transport. Subcell Biochem , 347–367. [DOI] [PubMed] [Google Scholar]
- Fedosov SN, Berglund L, Nexo E, Petersen TE. (1999). Sequence, S–S bridges, and spectra of bovine transcobalamin expressed in Pichia pastoris. J Biol Chem , 26015–26020. [DOI] [PubMed] [Google Scholar]
- Fedosov SN, Fedosova NU, Nexo E, Petersen TE. (2000). Conformational changes of transcobalamin induced by aquocobalamin binding. Mechanism of substitution of the cobalt-coordinated group in the bound ligand. J Biol Chem , 11791–11798. [DOI] [PubMed] [Google Scholar]
- Fedosov SN, Laursen NB, Nexø E, Moestrup SK, Petersen TE, EØ Jensen, Berglund L. (2003). Human intrinsic factor expressed in the plant Arabidopsis thaliana. Eur J Biochem , 3362–3367. [DOI] [PubMed] [Google Scholar]
- Fedosov SN, Nexo E, Heegaard CW. (2018). Binding of aquocobalamin to bovine casein and its peptides via coordination to histidine residues. Int Dairy J , 30–39. [Google Scholar]
- Fedosov SN, Orning L, Lovli T, Quadros EV, Thompson K, Berglund L, Petersen TE. (2005). Mapping the functional domains of human transcobalamin using monoclonal antibodies. FEBS J , 3887–3898. [DOI] [PubMed] [Google Scholar]
- Fedosov SN, Petersen TE, Nexo E. (1996). Transcobalamin from cow milk: isolation and physico-chemical properties. Biochim Biophys Acta , 113–119. [DOI] [PubMed] [Google Scholar]
- Green R, Allen LH, Bjørke-Monsen AL, Brito A, Guéant JL, Miller JW, Molloy AM, Nexo E, Stabler S, Toh BH, et al. (2017). Vitamin B12 deficiency. Nat Rev Dis Primers , 17040. [DOI] [PubMed] [Google Scholar]
- Hannibal L, Bolisetty K, Axhemi A, DiBello PM, Quadros EV, Fedosov S, Jacobsen DW. (2018). Transcellular transport of cobalamin in aortic endothelial cells. FASEB J , 5506–5519. [DOI] [PMC free article] [PubMed] [Google Scholar]
- Hansen M, Nexo E. (1992). Cobalamin binding proteins in human seminal plasma. Scand J Clin Lab Invest , 647–652. [DOI] [PubMed] [Google Scholar]
- Helander HF, Fandriks L. (2014). Surface area of the digestive tract—revisited. Scand J Gastroenterol , 681–689. [DOI] [PubMed] [Google Scholar]
- Hine B, Boggs I, Green R, Miller JW, Hovey RC, Humphrey R, Wheeler TT. (2014). Transcobalamin derived from bovine milk stimulates apical uptake of vitamin B12 into human intestinal epithelial cells. J Cell Biochem , 1948–1954. [DOI] [PubMed] [Google Scholar]
- Homan KA, Kolesky DB, Skylar–Scott MA, Herrmann J, Obuobi H, Moisan A, Lewis JA. (2016). Bioprinting of 3D convoluted renal proximal tubules on perfusable chips. Sci Rep , 34845. [DOI] [PMC free article] [PubMed] [Google Scholar]
- Hubatsch I, Ragnarsson EG, Artursson P. (2007). Determination of drug permeability and prediction of drug absorption in Caco-2 monolayers. Nat Protoc , 2111–2119. [DOI] [PubMed] [Google Scholar]
- Jensen LL, Andersen RK, Hager H, Madsen M. (2014). Lack of megalin expression in adult human terminal ileum suggests megalin-independent cubilin/amnionless activity during vitamin B12 absorption. Physiol Rep , e12086. [DOI] [PMC free article] [PubMed] [Google Scholar]
- Juul CB. (2017). Investigating the Effect of Bovine Transcobalamin on the Absorption of Cobalamin (Vitamin B12)—Studies in Cell Culture and the Rat. Ph.D. thesis, Department of Molecular Biology and Genetics, Aarhus University, Aarhus, Denmark, 150 pp.
- Kornerup LS, Juul CB, Fedosov SN, Heegaard CW, Greibe E, Nexo E. (2016). Absorption and retention of free and milk protein–bound cyano– and hydroxocobalamins. An experimental study in rats. Biochimie , 57–62. [DOI] [PubMed] [Google Scholar]
- Kräutler B, Puffer B. (2012). Vitamin B12-derivatives: organometallic catalysts, cofactors and ligands of bio-macromolecules. In: Handbook of Porphyrin Science, vols. , ed. Kadish KM, Smith KM, Guilard R, Singapore/London: World Scientific, 133–263. [Google Scholar]
- Matte JJ, Guay F, Girard CL. (2012). Bioavailability of vitamin B12 in cows’ milk. Br J Nutr , 61–66. [DOI] [PubMed] [Google Scholar]
- Miller DR, Specker BL, Ho ML, Norman EJ. (1991). Vitamin B-12 status in a macrobiotic community. Am J Clin Nutr , 524–529. [DOI] [PubMed] [Google Scholar]
- Moestrup SK, Birn H, Fischer PB, Petersen CM, Verroust PJ, Sim RB, Christensen EI, Nexo E. (1996). Megalin-mediated endocytosis of transcobalamin–vitamin-B12 complexes suggests a role of the receptor in vitamin-B12 homeostasis. Proc Natl Acad Sci USA , 8612–8617. [DOI] [PMC free article] [PubMed] [Google Scholar]
- Nexo E, Hollenberg MD. (1980). Characterization of the particulate and soluble acceptor for transcobalamin II from human placenta and rabbit liver. Biochim Biophys Acta , 190–200. [DOI] [PubMed] [Google Scholar]
- Nielsen MJ, Rasmussen MR, Andersen CB, Nexo E, Moestrup SK. (2012). Vitamin B12 transport from food to the body’s cells—a sophisticated, multistep pathway. Nat Rev Gastroenterol Hepatol , 345–354. [DOI] [PubMed] [Google Scholar]
- Nykjaer A, Petersen CM, Moller B, Jensen PH, Moestrup SK, Holtet TL, Etzerodt M, Thogersen HC, Munch M, Andreasen PA, Gliemann J. (1992). Purified alpha 2–macroglobulin receptor/LDL receptor-related protein binds urokinase.plasminogen activator inhibitor type-1 complex. Evidence that the alpha 2–macroglobulin receptor mediates cellular degradation of urokinase receptor-bound complexes. J Biol Chem , 14543–14546. [PubMed] [Google Scholar]
- Pons L, Guy M, Lambert D, Hatier R, Gueant J. (2000). Transcytosis and coenzymatic conversion of [(57)Co]cobalamin bound to either endogenous transcobalamin II or exogenous intrinsic factor in caco-2 cells. Cell Physiol Biochem , 135–148. [DOI] [PubMed] [Google Scholar]
- Quadros EV, Nakayama Y, Sequeira JM. (2005). The binding properties of the human receptor for the cellular uptake of vitamin B12. Biochem Biophys Res Commun , 1006–1010. [DOI] [PubMed] [Google Scholar]
- Quadros EV, Nakayama Y, Sequeira JM. (2009). The protein and the gene encoding the receptor for the cellular uptake of transcobalamin-bound cobalamin. Blood , 186–192. [DOI] [PMC free article] [PubMed] [Google Scholar]
- Quadros EV, Sai P, Rothenberg SP. (1994). Characterization of the human placental membrane receptor for transcobalamin II–cobalamin. Arch Biochem Biophys , 192–199. [DOI] [PubMed] [Google Scholar]
- Ramanujam KS, Seetharam S, Ramasamy M, Seetharam B. (1991). Expression of cobalamin transport proteins and cobalamin transcytosis by colon adenocarcinoma cells. Am J Physiol , G416–G422. [DOI] [PubMed] [Google Scholar]
- Seligman PA, Allen RH. (1978). Characterization of the receptor for transcobalamin II isolated from human placenta. J Biol Chem , 1766–1772. [PubMed] [Google Scholar]
- Vogiatzoglou A, Smith AD, Nurk E, Berstad P, Drevon CA, Ueland PM, Vollset SE, Tell GS, Refsum H. (2009). Dietary sources of vitamin B-12 and their association with plasma vitamin B-12 concentrations in the general population: the Hordaland Homocysteine Study. Am J Clin Nutr , 1078–1087. [DOI] [PubMed] [Google Scholar]
- Wang ZX. (1995). An exact mathematical expression for describing competitive binding of two different ligands to a protein molecule. FEBS Lett , 111–114. [DOI] [PubMed] [Google Scholar]
- Watanabe F. (2007). Vitamin B12 sources and bioavailability. Exp Biol Med (Maywood) , 1266–1274. [DOI] [PubMed] [Google Scholar]
- Yammani RR, Seetharam S, Seetharam B. (2001). Cubilin and megalin expression and their interaction in the rat intestine: effect of thyroidectomy. Am J Physiol Endocrinol Metab , E900–E907. [DOI] [PubMed] [Google Scholar]
Associated Data
This section collects any data citations, data availability statements, or supplementary materials included in this article.