Abstract
Magnetic microscopy of malarial hemozoin nanocrystals is performed by optically detected magnetic resonance imaging of near-surface diamond nitrogen-vacancy centers. Hemozoin crystals are extracted from Plasmodium falciparum–infected human blood cells and studied alongside synthetic hemozoin crystals. The stray magnetic fields produced by individual crystals are imaged at room temperature as a function of the applied field up to 350 mT. More than 100 nanocrystals are analyzed, revealing the distribution of their magnetic properties. Most crystals (96%) exhibit a linear dependence of the stray-field magnitude on the applied field, confirming hemozoin’s paramagnetic nature. A volume magnetic susceptibility of 3.4 × 10⁻⁴ is inferred with use of a magnetostatic model informed by correlated scanning-electron-microscopy measurements of crystal dimensions. A small fraction of nanoparticles (4/82 for Plasmodium falciparum–produced nanoparticles and 1/41 for synthetic nanoparticles) exhibit a saturation behavior consistent with superparamagnetism. Translation of this platform to the study of living Plasmodium-infected cells may shed new light on hemozoin formation dynamics and their interaction with antimalarial drugs.
I. INTRODUCTION
Magnetic field sensors based on diamond nitrogen-vacancy (NV) centers have emerged as a powerful platform for detecting nanomagnetism in biological samples [1,2]. With this technique, magnetic fields from magnetotactic bacteria [3], ferritin proteins [4], magnetically labeled cancer cells [5], and neuronal currents [6] have been detected with a remarkable combination of spatial resolution and sensitivity. Diamond magnetic microscopy has even been able to resolve magnetic fields produced by individual nanoparticles exhibiting ferromagnetism and superparamagnetism [7–9]. However, observation of individual paramagnetic nanoparticles at ambient temperature has remained a challenge, owing to their weaker magnetic signatures.
Of particular interest are paramagnetic hemozoin biocrystals that nucleate inside several blood-feeding organisms [10], including the Plasmodium species responsible for malaria. Malarial parasites feed on their host’s hemoglobin for essential amino acids, while decomposing the iron complexes into highly toxic free radicals. These radicals are subsequently bound into chemically inert elongated crystals (50–1500 nm in size) called “hemozoin” [10–12]. Hemozoin crystals are a biomarker for malaria, and a substantial effort has been devoted to developing diagnostic platforms based on their detection [10,13]. Hemozoin detection is also used in pharmacological studies of malaria [14], since some antimalarial drugs work by altering hemozoin formation [11,12].
Hemozoin crystals have characteristic optical properties, including birefringence [15], linear dichroism [16], and nonlinear dielectric susceptibility [17], that allow their detection without the use of extrinsic labels. They are also paramagnetic due to the presence of unpaired electrons in their Fe3+ centers, meaning they are magnetized only in the presence of an external magnetic field. Direct detection of hemozoin’s magnetization is intriguing because it gives quantitative information related to crystal size and iron composition.
Several methods of studying hemozoin magnetic signatures have been demonstrated, including magneto-optical rotation [18–20], nuclear-magnetic-resonance relaxometry [21,22], electron paramagnetic resonance [23], and magnetic separation [24]. Direct magnetic detection of hemozoin ensembles has been performed by bulk magnetometry [25–27]. However, detection of stray magnetic fields produced by single hemozoin nanocrystals has not yet been reported, likely due to stringent requirements on sensitivity and spatial resolution.
We hypothesized that diamond magnetic microscopy [3,5,9,28,29] possesses sufficient sensitivity and spatial resolution to image the stray magnetic field produced by individual hemozoin nanocrystals. To test this, we performed room-temperature optically-detected-magnetic-resonance (ODMR) imaging of a NV-doped diamond substrate in contact with either “natural” (Plasmodium-produced) or synthetic hemozoin nanocrystals. Spatially resolved maps of the magnetic fields produced by individual hemozoin nanocrystals were obtained and used to characterize the distribution of their paramagnetic properties. With appropriate modifications, this detection strategy may be used to study the formation dynamics of hemozoin crystals in living Plasmodium-infected cells.
II. DETECTION PRINCIPLE
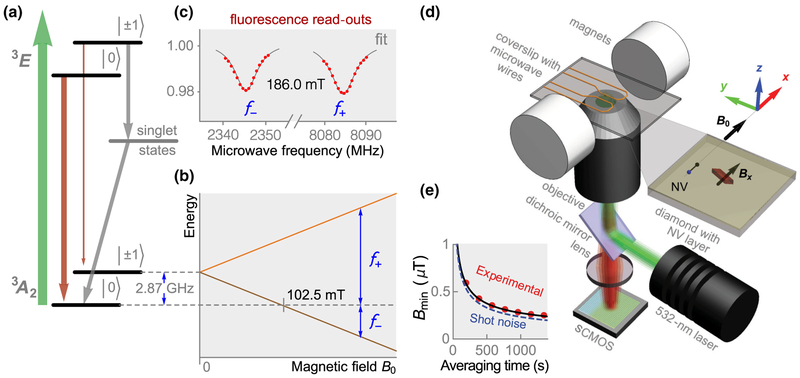
NV centers are spin-1 defects in the diamond lattice. The energy levels and optical excitation and emission path-ways of the NV center are shown in Fig. 1(a). For a magnetic field B‖ applied along the NV symmetry axis, the |0〉 ↔ | ± 1〉 spin transition frequencies are f ± D ± γNVB‖, where D = 2.87 GHz is the zero-field splitting and γNV = 28 GHz/T is the NV gyromagnetic ratio [Fig. 1(b)]. The principle of NV magnetometry is to measure these transition frequencies precisely with ODMR techniques [1,2]. When 532-nm light continuously excites NV centers, the ground-state population is optically polarized into |0〉 via a nonradiative, spin-selective decay path-way involving intermediate singlet states. Because of the same spin-selective decay mechanism, NV centers excited from |0〉 emit fluorescence (collected at 650–800 nm) at a higher rate than those originating from |1±〉. Application of a transverse microwave magnetic field mixes the spin populations, resulting in a dip in fluorescence when the microwave frequency matches the spin transition frequencies, f± [Fig. 1(c)]. Monitoring of NV fluorescence as the microwave frequency is swept across the resonances reveals f± and thus B‖.
FIG. 1.
Diamond magnetic microscopy. (a) NV energy-level diagram depicting magnetic sublevels (|0〉, 1), optical (green arrow), fluorescence (red arrows), and nonradiative (gray arrows) pathways. Gray arrows excitation show spin-selective intersystem crossing leading to polarization into the |0〉 ground-state sublevel. (b) Energy splitting of the ground-state sublevels in an external magnetic field applied along the NV axis. Blue arrows indicate the f± microwave transitions. (c) Example of an ODMR spectrum. From the separation between peaks, the projection of the local magnetic field along the NV axis is inferred. (d) Epifluorescence ODMR microscope used for magnetic imaging. Dry hemozoin crystals are placed on top of a diamond substrate with an ~ 0.2-μm top layer doped with NV centers. (e) Experimental and photoelectron-shot-noise-limited detection threshold for 65 × 65 nm2 detection pixels versus averaging time. The experimental data are fit to the function with α = 8.4 ± 0.1 μT s1/2
The minimum detectable magnetic field of a Lorentzian ODMR signal is limited by photoelectron shot noise as [2,30,31]
| (1) |
where Γ is the full-width-at-half-maximum (FWHM) linewidth, C is the contrast (the relative difference in ODMR signal on and off resonance), I0 is the photoelectron detection rate, and t is the measurement time. In room-temperature NV ODMR experiments, the spin projection noise is typically more than one order of magnitude lower than the photoelectron shot noise and is therefore negligible [32–34]. With typical experimental values (Γ = 12 MHz, C = 0.02, I0 5 106 electrons/s) for a 65 × 65 nm2 pixel, detection Eq.= (1) predicts Bmin ≃ 7.4 μT for t = 1 s. Experimentally, we observe a detection threshold that is within 15% of the photoelectron shot-noise limit [Fig. 1(e)]. The experimentally determined Bmin is calculated as the standard deviation of field values in 65 × 65 nm2 pixels in magnetic images lacking visible features. Scaling of the experimental detection threshold to a 390 × 390 nm2 pixel (approximately the diffraction-limited resolution), gives Bmin ≃ 1.4 μT threshold for t = 1 s. This detection is a factor of six lower than that for 65 × 65 nm2 pixels because I0 increases by a factor of 36 [Eq. (1)].
This detection threshold is sufficient to image the microtesla fields from hemozoin nanocrystals. In our experimental geometry [Fig. 1(d)], hemozoin crystals are magnetized along the x axis and the Bx component of the magnetic field is detected by diamond magnetic microscopy. In the point-dipole approximation [35], which is valid for crystals with dimensions smaller than the ~390-nm spatial resolution of our microscope, the magnetic field produced from a single crystal (volume V) is
| (2) |
where B0 is the applied magnetic field and χ is the volume magnetic susceptibility. χ depends on the crystal orientation and purity, and values of (3.2−4.6) 10−4 have been reported in the literature [10,18]. For ×conservative values χ = 3.2 × 10⁻⁴, V = 100 × 100 × 100 nm3, and NV sensing depth z = 200 nm, the field produced by a hemozoin nanocrystal in a B0 = 350 mT applied field has a minimum of Bx= −1.1 μT at x = y = 0 and maxima of Bx = 0.2 μT at y = 0, x = ± 245 nm.
To more accurately describe the instrument response, magnetostatic modeling is used to calculate the Bx(x, y, z) field produced by elongated crystals, with dimensions taken from scanning-electron-microscopy (SEM) images. We then integrate Bx over the NV vertical distribution, which is assumed to be uniform from 20 to 220 nm below the diamond surface (Appendix B). Finally, we account for the effect of optical diffraction and image drift by convolution with a two-dimensional Gaussian kernel (“blur”) with 540-nm FWHM. A discussion of model parameters is given in Appendix F.
III. EXPERIMENTAL METHODS
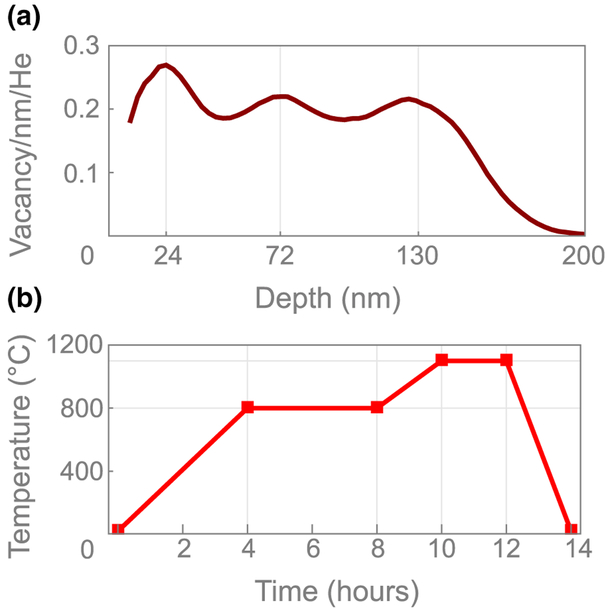
Figure 1(d) depicts the epifluorescence ODMR micro-scope used for diamond magnetic microscopy. The diamond substrate is a [110]-polished, 2 × 2 × 0.08 mm3 type-Ib-diamond substrate grown by high-pressure, high-temperature synthesis. 4He+ ions were implanted into the substrate [31] at three different energies (5, 15, and 33 keV) to produce a roughly uniform distribution of vacancies in an ~ 200-nm near-surface layer (see Appendix B). After implantation, the diamond was annealed in a vacuum furnace [36] at 800 °C (4 h) and 1100 °C (2 h) to produce a near-surface layer of NV centers with a density of ~ 10 ppm. Microwaves are delivered by copper loops printed on a contacting glass coverslip. A magnetic field, , produced by a pair of permanent magnets, points along one of the in-plane NV axes. A linearly polarized 532-nm laser beam (0.2 W) excites the NV centers over an area of ~ 40 × 40 μm2, and their fluorescence is imaged onto a scientific CMOS (sCMOS) camera. A detailed description of the apparatus is given in Appendix B.
Magnetic field maps are obtained by performing ODMR imaging of the near-surface NV layer (see Appendix D). Fluorescence images (600 pixels 600 pixels, 39 × 39 μm2 field of view, 3-ms exposure time) of the NV layer are recorded at 16 different microwave frequencies around each of the NV ODMR resonances (32 frequencies in total). The sequence is repeated, and the image set is integrated for several minutes to increase the signal-to-noise ratio. The fluorescence-intensity-versus-microwave-frequency data for each pixel are fit by Lorentzian functions to determine the ODMR central frequencies, f±. The magnetic field projection along the NV axis is then calculated as B‖ ≡ B0 +Bx = (f+ − f−)/(2γNV). Determining B‖ in this way eliminates common-mode shifts in f± due to temperature-dependent changes in zero-field splitting D [37] and variations in longitudinal strain [33,38]. The external field, B0, is subtracted from the image, revealing a map of the stray magnetic fields, Bx, produced by the magnetized nanocrystals.
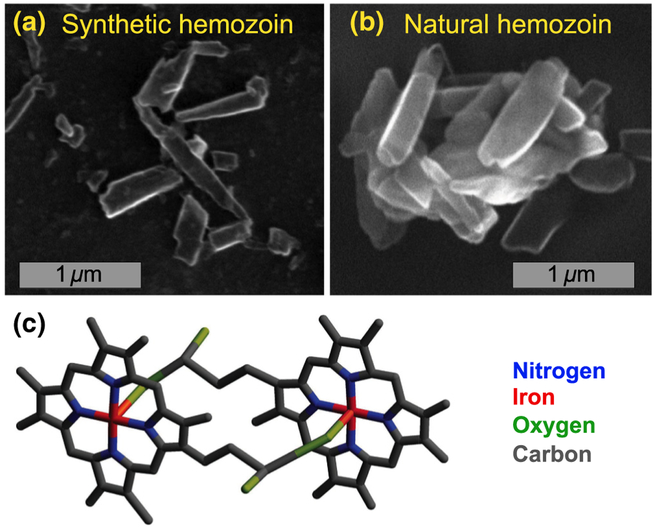
Figure 2 shows SEM images of the synthetic and natural hemozoin nanocrystals studied here. The synthetically produced hemozoin crystals (tlrl-hz, InvivoGen) have an elongated shape and varied dimensions (50–1500 nm). The natural hemozoin nanocrystals, extracted from human red blood cells cocultured with Plasmodium falciparum [24], have similar elongated shapes with slightly larger average dimensions. For diamond magnetic microscopy, hemozoin samples are diluted in water and drop-cast on the diamond surface to yield a relatively nonaggregated surface density with approximately 0.04 nanocrystals/μm2.
FIG. 2.
Hemozoin nanocrystals. (a) SEM image of synthetic hemozoin nanocrystals on a diamond substrate. (b) SEM image of natural hemozoin nanocrystals extracted from human red blood cells cocultured with Plasmodium falciparum, on a diamond substrate. (c) Molecular structure of a hematin dimer, which can form hemozoin crystals when joined together by hydrogen bonds. The molecular structure is expected to be the same for natural and synthetic hemozoin crystals.
IV. RESULTS
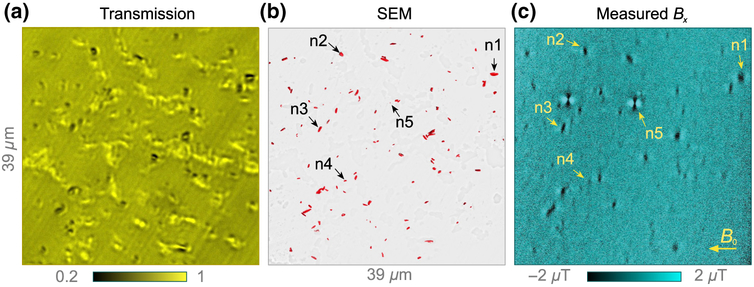
Figure 3(a) shows a bright-field transmission image of natural hemozoin crystals dispersed on the diamond sensor’s surface. Most of the bright features in the image come from host-cell residue; they do not appear in magnetic images. Results from another region without residue are reported in Appendix 3.
FIG. 3.
Natural hemozoin. (a) Bright-field transmission image of natural hemozoin crystals dispersed on a diamond substrate. The scale bar is the relative transmission. (b) SEM image of the same nanocrystals. To enhance hemozoin visibility, the SEM image is modified by a segmentation procedure, depicted in Fig. 7. (c) Diamond-magnetic-microscopy image for applied field B0 = 350 mT. Nanocrystals labeled n1–n5 are studied in detail in Figs. 4(a)–4(e).
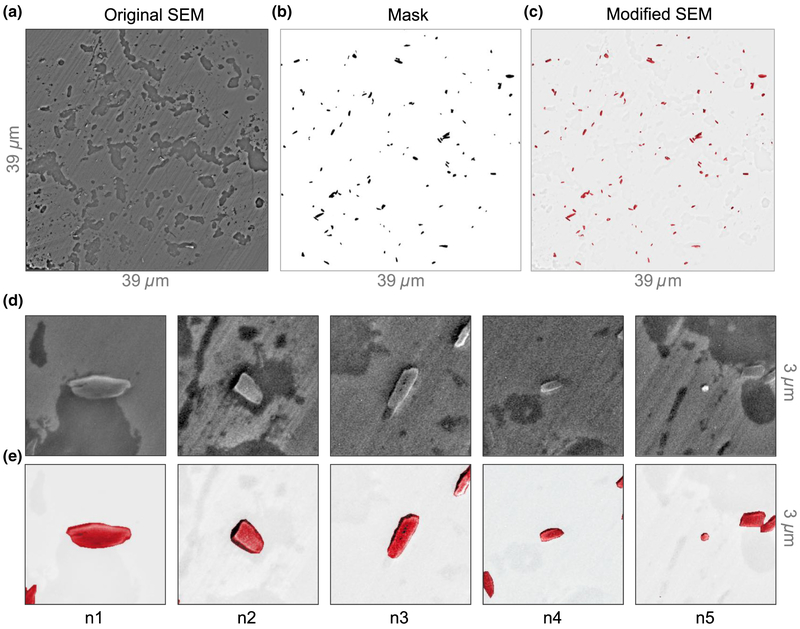
Figure 3(b) displays a modified SEM image of the same region as in Fig. 3(a). We use an image-segmentation procedure (Appendix C) to more clearly visualize the hemozoin crystals. Figure 3(c) shows the corresponding magnetic field map obtained by diamond magnetic microscopy. Of a total of 120 features identified as potential hemozoin nanocrystals in the SEM image, 82 exhibit magnetic features resolved by our technique. Surprisingly, the two magnetic features with the largest magnitude correspond to crystals with dimensions of ~200 nm or less in the SEM image. Such anomalously strong features are observed consistently, but infrequently (less than 5% of all magnetic features), in both natural and synthetic hemozoin samples. We tentatively attribute them to superparamagnetism [39], for reasons discussed below.
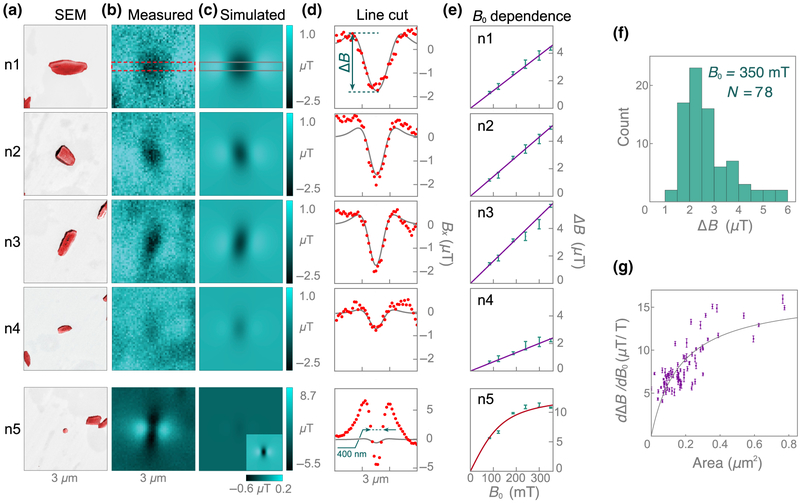
Five example crystals are labeled n1–n5 in the images in Figs. (b) and 3(c), including one of the aforementioned strongly magnetized nanocrystals (n5). Figure 4(a) shows SEM images of each example crystal; n1–n4 have a typical size and shape for these crystals, whereas n5 is barely visible, with dimensions of < 200 nm. Figure 4(b) shows the corresponding diamond-magnetic-microscopy images taken at B0 = 186 mT. Each crystal exhibits a different field pattern characteristic of its unique size, shape, and orientation.
FIG. 4.
Magnetic imaging of individual natural hemozoin nanocrystals. (a) SEM images of hemozoin nanocrystals n1–n5, labeled in Fig. 3. (b) Corresponding diamond-magnetic-microscopy images (B0 = 186 mT) for each crystal. (c) Simulated magnetic images (χ = 3.4 × 10⁻⁴, B0 = 186 mT) obtained with nanocrystal dimensions inferred from (a). Only the crystal at the center of each SEM image is included in the model. (d) Line cuts of each nanocrystal (red, measured; gray, simulated), from which the field-pattern amplitude ΔB is inferred. A minimum feature width of ~ 400-nm FWHM is observed for n5, close to the optical diffraction-limited resolution of our microscope. (e) ΔB(B0) = 0 (zero-coercivity assumption). (f) Histogram of ΔB (B0 = 350 mT) of the 78 crystals exhibiting linear paramagnetic behavior (including n1–n4). The four crystals exhibiting superparamagnetic behavior (including n5) are excluded from the analysis. (g) Fitted slopes, dΔB/dB0, as a function of crystal area, A, as determined from SEM images. The data are fitted with an empirical saturation function, dΔB/dB0 = Smax/(1 + Asat/A), with Smax = 16.5 ± 1.4 μT/T and Asat = 0.17 ± 0.03 μm2.
Figure 4(c) shows the expected magnetic field patterns of each nanocrystal, calculated with the procedure described in Sec. II. Each nanocrystal is modeled as a three-dimensional (3D) ellipsoid with uniform susceptibility and dimensions inferred from the corresponding SEM images. The height of the crystals is assumed to be 200 nm. For n1–n4, the model produces field patterns similar to those observed experimentally. The pattern amplitude is best described with a volume magnetization M = 50 A/m, which corresponds to a volume susceptibility χ = μ0M/B0 = 3.4 × 10⁻⁴, where μ0 = 4π × 10−7 m T/A is the vacuum permeability. This value of χ is well within the range of literature values for hemozoin [10,18] and is in good agreement for most crystals, despite a wide variation in their magnetic patterns. This demonstrates that crystal size, shape, and orientation are the primary factors in determining the magnetic pattern behavior. Factors contributing to ~ 25% or less uncertainty in χ are discussed in Appendix F.
For crystal n5, however, the model does a poor job of describing the magnetic behavior. It predicts a field-pattern amplitude more than one order of magnitude lower than the observed value, suggesting n5 is not paramagnetic hemozoin. It is difficult to estimate this particle’s magnetization, since it may arise from a small inclusion or an adjacent particle not resolved in the SEM image.
Line cuts of the magnetic field patterns for n1–n5 are shown in Fig. 4(d). The line cuts are obtained by averaging Bx values over six rows (390 nm) in a band along the magnetic feature, as indicated in Figs. 4(b) and 4(c). The line cuts are used to calculate the magnetic pattern amplitude ΔB, determined from the difference in extreme Bx values in the line cuts. The uncertainty in ΔB is approximately ±0.2 μT, on the basis of the scatter in the Bx values in the line cuts in a magnetic-feature-free region. The amplitudes for n1–n4 differ due to size and shape, but all fall in the range ΔB = 1.3−2.9 μT. However, the amplitude for n5 is much larger, ΔB = 11.0 ± 0.2 μT. The FWHM of this feature is ~400 nm, close to our microscope’s diffraction-limited spatial resolution, providing further evidence that it comes from a pointlike particle.
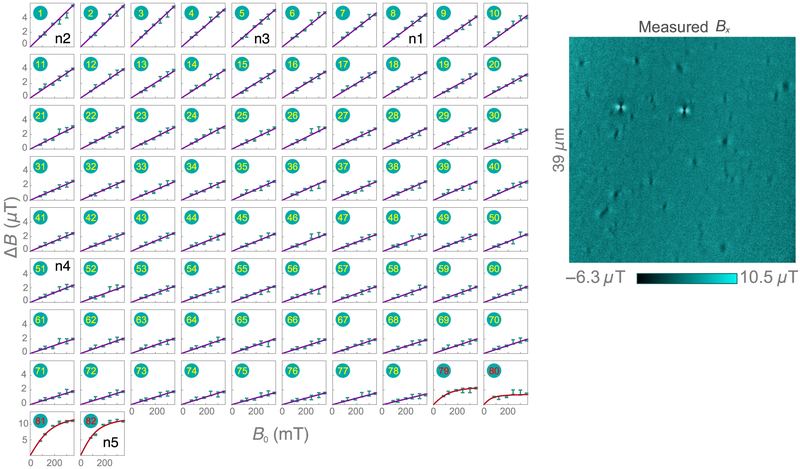
Magnetic images of all nanocrystals shown in Fig. 3 were obtained for six values of the external field: B0 = 83, 122, 186, 240, 300, and 350 mT. From these images, we identify 82 individual magnetized crystals and calculate ΔB as a function of B0 for each of them. The ΔB(B0) curves for all 82 crystals are provided in Fig. 13. Figure 4(e) shows the curves of nanocrystals n1–n5. A linear dependence is found for n1–n4 and is characteristic of a paramagnetic response. In total, 78 of 82 natural hemozoin crystals show a similar linear behavior, with a slope in the range dΔB/dB0 = 4−16 μT/T.
FIG. 13.
Natural hemozoin: field-dependent magnetization. ΔB(B0) curves for all 82 natural hemozoin crystals reported in Sec. IV (left). Magnetic image (B0 = 350 mT) showing the positions of each nanocrystal (right).
The remaining four nanoparticles from the natural hemozoin sample exhibit a saturation behavior, as seen for n5. These curves are fit with a Langevin function of the form ΔB(B0) = a[coth(bB0) − 1/(bB0)], where a and b are fit parameters. For n5, a = 13.3 ± 0.7 μT and b = 0.017 ± 0.002 mT−1. This model is commonly used to describe superparamagnetic nanoparticles in the limit that the thermal energy exceeds the magnetic anisotropy energy [40]. The large magnetization and saturation behavior observed in these small nanoparticles is consistent with recent reports of superparamagnetism in hemozoin samples [39,41]. However, only a small fraction (~ 5% or less) of the nanoparticles exhibit such behavior. This may explain why superparamagnetic behavior was not observed in previous ensemble studies with unrefined samples [18,22,25]. The atomic structure of these outlier nanoparticles remains a topic for future work.
A histogram of B for all 78 paramagnetic nanocrystals at B0 = 350 mT is shown in Fig. 4(f). The distribution is characterized by a mean amplitude of 2.9 μT, a median of 2.6 μT, and a standard deviation of 1.6 μT. Figure 4(f) plots the best-fit slopes, dΔB/dB0, as a function of crystal area, as determined from SEM images. The slopes increase in a roughly monotonic fashion before saturating when the crystal dimensions exceed the spatial resolution of the microscope. This behavior is expected for crystals with uniform susceptibility. For crystal volumes much smaller than the sensing voxel, V «Vsense ≈ 0.4 × 0.4 × 0.2 μm3, Eq. (2) predicts dΔB/dB0 ∝ χ V, while for V »Vsense we expect dΔB/dB0 ∝ χ independent of crystal dimensions.
We have also measured the magnetic properties of synthetic hemozoin crystals manufactured by InvivoGen. These nanocrystals are commonly used as a model for natural hemozoin, owing to their ease of procurement and nearly identical crystal morphology and chemical structure [42,43]. Previous studies reported similarities in the ensemble magnetic properties of synthetic and Plasmodium falciparum–extracted hemozoin [44]; however, here we compare the distribution of their magnetic properties at the single-nanocrystal level.
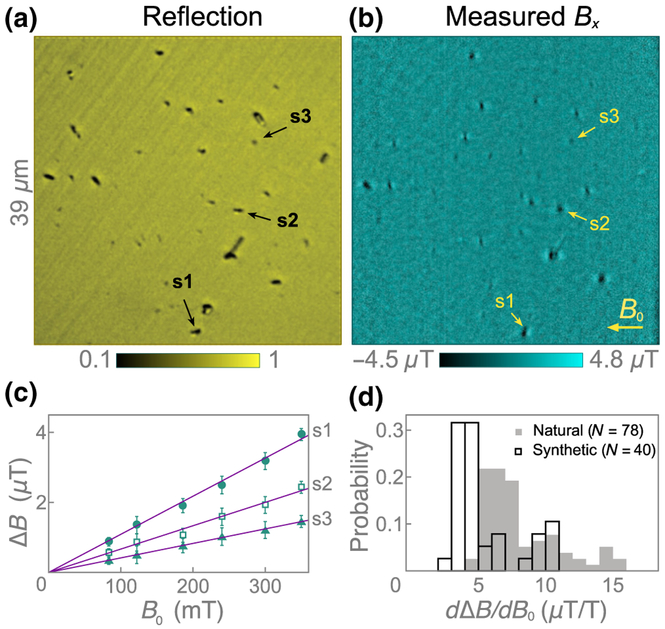
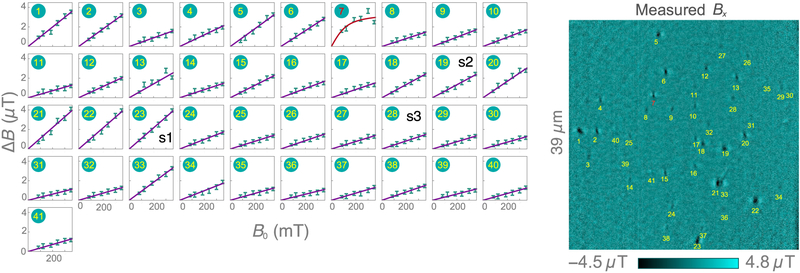
Figure 5(a) shows a confocal reflection image of dried synthetic hemozoin crystals dispersed on the diamond substrate. Of a total of 46 dark features identified as potentially being hemozoin, 41 produce magnetic features in the diamond-magnetic-microscopy images [Fig. 5(b)]. As with natural hemozoin, B(B0) curves are generated by monitoring these features in magnetic images taken at six different applied fields. The ΔB(B0) curves for all 41 nanocrystals are displayed in Fig. 14. One nanocrystal exhibits a Langevin saturation, suggesting superparamagnetic behavior, while the remaining 40 crystals exhibit a linear dependence. Figure 5(c) shows the ΔB(B0) curves for three example nanocrystals exhibiting linear behavior, labeled s1–s3 in Fig. 5(b). Magnetostatic modeling [Fig. 10(d)] of these three nanocrystals shows good agreement with the experimental images with χ = 3.4 × 10⁻⁴. This is the same value as found for natural hemozoin [Figs. 4(c) and 4(d)], indicating the natural and synthetic crystals have similar magnetic properties.
FIG. 5.
Synthetic hemozoin. (a) Confocal reflection image (excitation at 405 nm) of synthetic hemozoin nanocrystals on a diamond substrate. In total, 46 dark features are identified as likely hemozoin nanocrystals. (b) Corresponding diamond-magnetic-microscopy image at B0 = 350 mT. 41 of 46 possible crystals exhibit an observable magnetic feature. (c) ΔB(B0) curves for three synthetic hemozoin crystals labeled in (b). Solid lines are weighted linear fits. (d) Histograms of dΔB/dB0 for natural and synthetic hemozoin crystals.
FIG. 14.
Synthetic hemozoin: field-dependent magnetization. ΔB(B0) curves for all 41 synthetic hemozoin crystals reported in Sec. IV (left). Magnetic image (B0 = 350 mT) showing the positions of each nanocrystal (right).
FIG. 10.
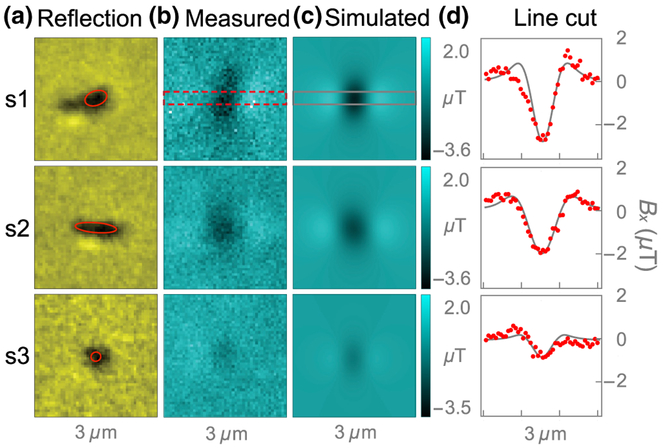
Individual synthetic hemozoin crystals. (a) Confocal reflection images of hemozoin nanocrystals s1–s3, labeled in Figs. 5(a) and 5(b). The estimated area used for magneto-static modeling is outlined in red. (b) Corresponding diamond-magnetic-microscopy images (B0 = 350 mT) for each crystal.(c) Simulated magnetic images (χ = 3.4 × 10⁻⁴, B0 = 350 mT)obtained with nanocrystal dimensions roughly estimated from(a). (d) Line cuts of each nanocrystal (red, measured; gray, simulated), from which the field pattern amplitude ΔB is inferred.
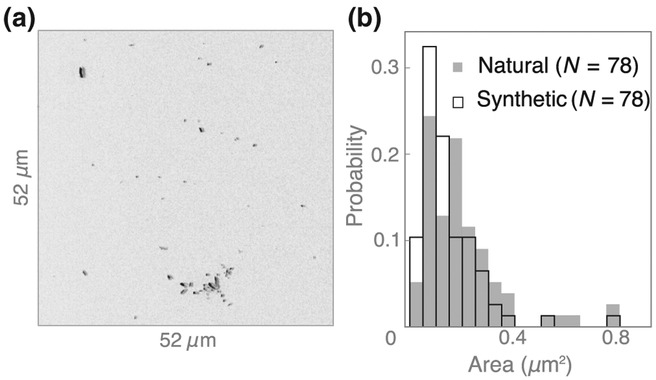
Figure 5(d) shows histograms of the fitted slopes, dΔB/dB0, for all 40 paramagnetic synthetic crystals and all 78 paramagnetic natural crystals. The synthetic nanocrystals have a slightly smaller slope (mean 5.5, median 4.3 μT/T) than natural hemozoin (mean 8.1, median 7.2 μT/T), while the standard deviation is similar (6.2 and 8.0 μT/T, respectively). This is likely due to a small difference in their size distributions (see Appendix C and Fig. 8).
FIG. 8.
Size comparison of natural and synthetic hemozoin crystals. (a) SEM image of synthetic hemozoin crystals dispersed on a diamond substrate. (b) Histogram of crystal area for natural and synthetic hemozoin crystals, as determined from SEM images in Figs. 7(a)–7(c) and 8(a).
V. OUTLOOK AND CONCLUSION
Our results demonstrate the capability of diamond magnetic microscopy to simultaneously measure the magnetic properties of numerous individual biocrystals. Whereas bulk measurements yield ensemble-average properties, diamond magnetic microscopy can measure the distribution of nanocrystal susceptibilities, extract information about each crystal’s dimensions and orientation, and differentiate paramagnetic hemozoin from superparamagnetic nanoparticles. This brings up the intriguing possibility of using this platform to monitor the formation dynamics of individual hemozoin nanocrystals in living cells without the use of extrinsic contrast agents.
To assess the feasibility of performing magnetic imaging of hemozoin inside cells, we estimate a typical hemozoin crystal volume is V = 0.04 μm3, on the basis of the median area found from SEM images (0.2 μm2) and an assumed thickness of 0.2 μm. We assume the hemozoin crystal forms in a digestive vacuole within a Plasmodium-infected red blood cell (typical thickness 2 μm [13]) such that it is located 2 μm from the diamond surface. Such a crystal with susceptibility χ = 3.4 × 10⁻⁴ under an applied field B0 = 350 mT would produce a magnetic pattern amplitude at the diamond surface (z = 2 μm) of ΔB = 0.057 μT [Eq. (2)]. This field shift would be detectable with a signal-to-noise ratio of one after ~ 10 min of averaging using the present diamond sensor with 390 × 390 nm2 detection pixels (see Sec. II). However, the 200-nm NV layer currently used is optimized for negligible diamond-hemozoin separation. If the separation is ~ 2 μm, an NV layer of 1 μm would be more optimal, leading to a signal-to-noise ratio of one after approximately 2 min. If a higher magnetic field is used (already realized for nanoscale NV magnetometry [45,46]), a signal-to-noise ratio of one should be obtained for B0 = 3 T after ~ 1.6 s of signal averaging.
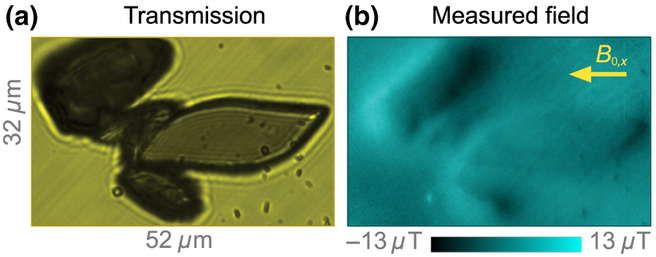
This sensitivity would be suffcient to monitor the formation dynamics [47] of individual hemozoin nanocrystals on minute-to-hour timescales. It could enable monitoring of crystal position and orientation throughout the parasite life cycle under different conditions, including the influence of antimalarial drugs. However, the movement of red blood cells would need to be constrained such that crystals remain close to the diamond surface. This may be accomplished by promotion of cell adhesion [48] or sedimentation [49], confinement of cells within microstructures [36,50], and/or increase of the viscosity of the surrounding medium [51–53]. If the platform is simplified and miniaturized, it may also find application as a label-free malaria diagnostic tool with sensitivity rivaling the current staining or microscopy standard [18]. Our platform can also be used to study paramagnetic substances other than hemozoin. Figure 11 shows diamond-magnetic-microscopy images of the pharmacological agent hemin.
FIG. 11.
Magnetic imaging of hemin crystals. (a) Bright field transmission image of hemin crystals. (b) Corresponding diamond-magnetic-microscopy image (B0 = 186 mT). The inplane component of the applied field is labeled with an arrow. An out-of-plane component of similar magnitude is also present. Smaller particles are synthetic hemozoin crystals that are dispersed along with hemin crystals.
In summary, we use diamond magnetic micro-scopy to characterize the distribution of magnetic properties of synthetic and natural hemozoin samples at the individual nanocrystal level. More than 95% of the nanocrystals exhibit paramagnetic behavior, with magnetic field patterns well described by a magnetostatic model using a volume susceptibility χ = 3.4 × 10⁻⁴. Five of the 123 nanocrystals studied exhibit anomalously large magnetization that saturates at fields above approximately 0.1 T, suggesting superparamagnetism. Further work is needed to determine the composition and structure of these outlier nanoparticles. With improvements in the experimental setup, diamond magnetic microscopy should be capable of imaging hemozoin formation dynamics in living cells, with implications for malaria diagnosis and drug development.
ACKNOWLEDGMENTS
The authors acknowledge valuable conversations with C. Belthangady, D. Budker, Y. Silani, and J. Damron, as well as sample characterization resources at the UNM Comprehensive Cancer Center Fluorescence Microscopy Shared Resource and the U.S. Department of Energy Center for Integrated Nanotechnologies. This work was funded by NIH (National Institute of General Medical Sciences) Grant No. 1R41GM130239–01, NIH (National Institute of Mental Health) Grant No. 1R41MH115884–01, NIH (National Institute of Biomedical Imaging and Bioengineering) Grant No. 1R01EB025703–01, and a Beckman Young Investigator award.
APPENDIX A. HEMOZOIN
Hemozoin crystals consist of dimers of α-hematin molecules each containing an iron center. Figure 2 shows the molecular structure of a dimer, constructed with the Avogadro open-source molecular builder and visualization tool. The central iron of the first α-hematin is bonded to the oxygen of the carboxylate side chain of the second α-hematin. The dimers are joined by hydrogen bonds to form a triclinic crystal [47]. These crystals are alternatively called “hemozoin” or “β-hematin.” Throughout this paper, we use the term “hemozoin” to refer to crystals produced both naturally (through biocrystallization inside living organisms) and synthetically.
The organisms that produce hemozoin crystals include the various Plasmodium species, the parasitic worm Schis-tosoma mansoni, the avian protozoan parasite Hemoproteus columbae, and the kissing bug Rhodnius prolixus [47]. In humans, hemozoin plays an important role in the pathological mechanism of the Plasmodium parasites responsible for malaria, a disease that has devastating effects in tropical and subtropical regions [10].
During their life cycle, malarial protozoans feed on host-cell hemoglobin by decomposing it inside digestive vacuoles into amino acids and toxic α-hematin radicals [10–13]. The iron radicals are then bound, inside the same vacuoles, into inert hemozoin crystals and released into the host blood during erythrocyte disintegration.
The suppression (or alteration) of hemozoin formation inside Plasmodium parasites is considered a key action of widely used antimalarial drugs, such as quinine and chloroquine [11,12]. Quinine has been successfully used for more than 300 years to treat malaria by suppressing hemozoin crystallization [12]. Chloroquine has been widely used since the 20th century and is thought to invoke a similar response in hemozoin formation [11,12]. The regular use of these drugs led to the selection of resistant forms of Plasmodium parasites, which carry genes responsible for preventing the drugs from entering digestive vacuoles [11,12].
The motivation for the present study was to establish diamond magnetic microscopy as an effective tool for fast, quantitative, noninvasive characterization of individual hemozoin nanocrystals. Translation of this technique to the study of hemozoin formation in living protozoans could be used to elucidate the interaction between hemozoin formation, the host immune system, and antimalarial drugs. This line of inquiry may even lead to the establishment of a bank of effective antimalarial drugs able to counteract the highly adaptive parasites.
APPENDIX B. EXPERIMENTAL DETAILS
The diamond substrate used in this work is a [110]-polished, 2 × 2 × 0.08 mm3 type-Ib-diamond grown by high-pressure, substrate high-temperature synthesis. The diamond was acquired from Delaware Diamond Knives Inc. and had an initial nitrogen concentration of ~ 100 ppm. 4He+ ions were implanted in the substrate by CuttingEdge Ions LLC [31] at three different energies (5, 15, and 33 keV) to produce a roughly uniform distribution of vacancies in an ~ 200-nm near-surface layer. Vacancy distribution depth profiles are estimated by Stopping and Range of Ions in Matter (SRIM) Monte Carlo simulation [Fig. 6(a)]. The diamond substrates are modeled as a pure carbon layer with density of 3.52 g/cm3 and atom-displacement threshold energy of 37.5 eV. The lattice-damage threshold and surface-damage threshold are set to 7.35 and 7.5 eV, respectively. SRIM simulations do not take into account crystallographic effects such as ion channeling, and therefore could lead to underestimation of the vacancy-layer depth, but are sufficiently accurate for our purposes. Our SRIM simulations predict a modal depth of approximately 24 nm (the depth where the vacancy density is greatest) for 5-keV 4He+-ion implantation, approximately 72 nm for 15 keV, and approximately 130 nm for 33 keV. The diamond substrate was implanted with helium ion doses of 4 × 10¹², 2 × 10¹², and 2 × 10¹² He/cm2 for implantation energies of 5, 15, and 33 keV, respectively. SRIM simulations [Fig. 6(a)], indicate this produces a vacancy density of approximately 50 ppm with approximately 30% or less variation throughout the layer. After implantation, the diamond was annealed in a vacuum furnace at 800 and 1100 °C [Fig. 6(b)]. This process resulted in an ~ 200-nm near-surface layer of NV centers with a density of approximately 10 ppm, as determined by the fluorescence intensity [30]. The largest source of uncertainty in the final NV-layer distribution is the extent of vacancy diffusion during annealing. Previous studies [54] predicted tens of nanometers of diffusion during annealing of type-Ib diamonds grown by high-pressure, high-temperature synthesis under similar conditions. We thus expect a slight broadening of the vacancy distribution in Fig. 6(a) to approximately 200 nm after annealing.
FIG. 6.
NV-layer fabrication. (a) SRIM vacancy-depth profile for implantation conditions discussed in the text. (b) Time temperature graph for the annealing procedure used in this study.
To magnetize nanocrystals, we use the static magnetic field created by a pair of permanent magnets [Fig. 1(d)]. The magnetic field is aligned to the [110]-polished diamond surface such that B0 is parallel to one of the two possible in-plane NV symmetry axes. Microwave fields are delivered by two copper loops (each addressing a different spin transition) printed on a glass coverslip. The loops are positioned with respect to the diamond to maximize the microwave-field components orthogonal to the NV axis. The microwaves are generated by a Stanford Research Systems SG384 frequency generator with two outputs for the first and second harmonics. The frequency of the generator is swept by sending a ramp function to the generator’s analog frequency-modulation input. For B0 > 186 mT, additional frequency doublers (Mini-Circuits ZX90-2-24-S+ and ZX90-2-36-S+) are used on both harmonic outputs to access higher microwave frequencies. The microwaves for each transition are amplified separately by Mini-Circuits amplifiers: ZHL-16W-43-S+ (for microwave frequencies below 4 GHz), ZVE-3W-83+ (for 4–8 GHz), and ZVE-3W-183+ (for more than 8 GHz). The output of the amplifiers is subsequently routed to the coverslip-printed loops.
To produce NV fluorescence, ~ 0.2 W of 532-nm light from a Lighthouse Photonics Sprout-G-10W laser is used in a homebuilt inverted epifluorescence microscope [Fig. 1(d)]. We use an oil-immersion objective with a numerical aperture of 1.3, but an air gap between the coverslip and diamond reduces the diffraction-limited spatial resolution to ~ 390 nm. The laser light is focused to the lateral periphery of the objective’s back focal plane to produce an illumination region of ~ 40 × 40 μm2 on the diamond’s top surface (the surface in contact with the dry hemozoin). By excitation in this way, the laser beam enters the bottom of the transparent diamond substrate at a steep angle, leading to substantial internal reflection from the top diamond-air interface. This is helpful in maximizing NV excitation intensity, while minimizing the intensity incident on hemozoin samples. We find no evidence of photodamage on hemozoin samples even after studying them under intense, continuous illumination for several days. For sensitive samples, a light-shield layer, ~ 50 nm thick, can be used to block all light from interacting with the sample [55]. For example, coating the face of the diamond that interfaces with the sample with a metal layer (e.g., Ag or Al) of ~ 25 nm would result in reflection of all light, particularly when combined with excitation at an angle exceeding the total-internal-reflection angle. Adding an additional dielectric layer of ~ 25 nm on top of the metal (e.g., SiN, SiO2, or Al2O3) would further prevent any evanescent optical field from interacting with the sample even if cells are adhered to the top of the sensor.
The microscope is operated on a standard vibration-isolation optical table in a climate-controlled laboratory environment. The fluorescence is spectrally filtered by a dichroic mirror and a Semrock BrightLine 731/137 nm band-pass filter, focused by a 200-mm-focal-length achromatic lens (Thorlabs ITL200), and detected by a Hamamatsu Orca v2 sCMOS sensor. By alternation of a flip mirror, the fluorescence could also be detected by a Thorlabs APD410A avalanche photodiode connected to a Yokogawa DL9040 oscilloscope for faster tuning and alignment. The same microscope configuration is used to obtain bright-field transmission images by collecting white light transmitted through the analyte and diamond.
A LabVIEW program is used to control the experiment. A software command triggers the camera to initiate a burst of sixteen 3-ms frames in rolling-shutter mode. Just before the first frame, the camera provides a precisely timed transistor–transistor logic (TTL) pulse that is used to trigger a sequence generated by a National Instruments multifunction data-acquisition module. The data-acquisition module provides an analog ramp function that is used to sweep the microwave-generator frequency via its analog frequency-modulation input. Sixteen frames are acquired for each microwave sweep. After each sweep, the microwave generator is reconfigured via a general-purpose-interface-bus command to alternate between first and second harmonics to alternately address f+ or f− transitions. Frame acquisition and real-time Camera image processing are synchronized via the LabVIEW interface. The image-processing procedure is described in detail in Appendix D.
APPENDIX C. HEMOZOIN PREPARATION AND CHARACTERIZATION
Synthetic hemozoin crystals were purchased from InvivoGen™ (tlrl-hz) and natural hemozoin crystals were obtained from human red blood cells co-cultured with Plasmodium falciparum parasites. The hemozoin samples were centrifuged several times (5 min at 6000 rpm) in deionized water to wash out salts and cell residues. They were subsequently sonicated to minimize aggregation, and finally homogeneously dispersed on the diamond surface by dropcasting the hemozoin suspension and wicking away the water until it had dried.
The shape, size, and orientation of the hemozoin crystals were investigated by SEM (UNM Center for High Technology Materials and DOE Center for Integrated Nanotechnologies) and confocal reflectance microscopy (UNM Comprehensive Cancer Center Fluorescence Microscopy Shared Resource). An SEM image for the synthetic hemozoin sample reported in the main text was not obtained due to the sample’s early destruction. However confocal reflectance images (405 nm excitation) were obtained, which offer a spatial resolution of ~225 nm.
Figure 7(a) shows the raw SEM image of the natural hemozoin sample studied in the main text. The faint slanted-line pattern is due to imperfections in the diamond polishing. Although the raw SEM images are of high-enough quality to identify and measure hemozoin crystals, there is some background due to cell residue. We thus post-process the raw SEM image to enhance hemozoin visibility in Fig. 3(b). The hemozoin crystals are selected with the free selection tool in the graphics editor GIMP, and a mask is created from the selection [Fig. 7(b)]. The mask is used to colorize the selected crystals, and the inverted mask is used to diminish the contrast of the background.
FIG. 7.
SEM processing. (a) Unprocessed SEM micrograph of the natural hemozoin sample. (b) A mask used to highlight and colorize hemozoin crystals and to attenuate their background. (c) Modified SEM image as shown in Fig. 3(b). (d) Unprocessed and (e) modified SEM images of hemozoin crystals n1–n5 addressed in Figs. 4(a)–4(e).
We use another set of 78 synthetic hemozoin crystals [Fig. 8(a)] to characterize the distribution of sizes in the synthetic hemozoin sample. Figure 8(b) shows a histogram of the nanocrystal areas for natural and synthetic hemozoin crystals. The mean area is 0.16 μm2 for synthetic hemozoin and 0.20 μm2 for natural hemozoin. The slightly larger size of natural crystals is in agreement with the slightly larger magnetic fields produced by those crystals, as seen in Fig. 5(d).
In the limit that the crystal dimensions are smaller than the magnetic image resolution, we expect the relationship between χ, the mean crystal area (Ā), and the mean mag-netization slope is , where we assume that the mean crystal volume is proportional to Ā3/2. Using values from Figs. 5(d) and 8(b), we find for synthetic crystals and 90 (μT/T)/μm3/2 for natural crystals. These nearly identical values support our claim that χ is approximately the same for both populations and that the slightly larger size of natural crystals accounts for their slightly larger magnetic fields.
In Sec. IV, we report that 82 of 120 features identified in the natural-hemozoin SEM images produce observable magnetic features. We also report that 41 of 46 features observed in synthetic hemozoin reflectance images produce observable magnetic features. There are two possible explanations for why some particles do not produce magnetic features: (i) the particles are paramagnetic but we cannot observe their magnetization with the available signal-to-noise ratio or (ii) the particles are actually diamagnetic and we have misidentified them as hemozoin crystals from the SEM (or reflectance) images. Considering many of these features had an area comparable to, or larger than, the mean crystal area, the first explanation would require that the magnetically inactive crystals have anomalously small volume susceptibility. This is inconsistent with the monolithic hemozoin-crystal structure, which would predict much smaller variations in χ. We therefore conclude that the second explanation is more likely.
APPENDIX D. DIAMOND-MAGNETIC-MICROSCOPY IMAGE PROCESSING
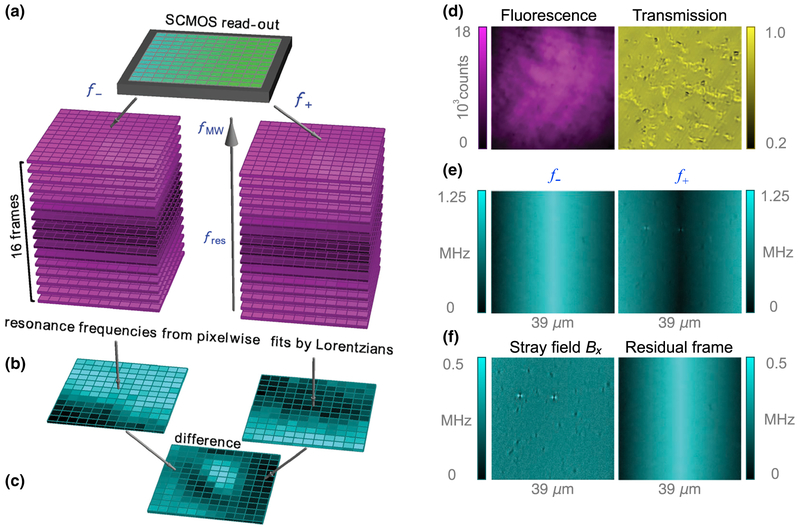
The principle of our image-processing procedure is shown in Fig. 9. While the microwave frequency is swept in a range of ~ 12 MHz about each ODMR transition, a set of 32 arrays of fluorescence images are acquired from the sCMOS sensor and accumulated for signal averaging. Each of the images comprises 600 pixels 600 pixels. Each pixel corresponds to an area of 65 × 65 nm2 in the sample plane [Fig. 9(d)]. The images are arranged in two image stacks with dimensions of 16 × 600 × 600, where the first dimension is arranged by microwave frequency. By fitting Lorentzian functions along the microwave-frequency dimension, we produce two 600 × 600 images corresponding to each ODMR central frequency [Figs. 9(b) and 9(e)].
FIG. 9.
Data processing. (a) Fluorescence images are acquired at each of 32 different microwave frequencies (16 frequencies for each of the f± spin transitions). (b) For any given pixel, two 16-point ODMR curves (fluorescence intensity versus microwave frequency)are generated. Each ODMR curve is fit to a Lorentzian function to reveal the ODMR central frequencies for that pixel. This is repeated for each pixel, yielding two maps of ODMR central frequencies corresponding to f+ and f−. (c) The magnetic field pattern is obtained by subtraction of the images for f+ and f−, division by 2γNV, and subtraction of the applied B0 field. (d) An example fluorescence image for a fixed microwave frequency along with a bright-field transmission image of the same field of view. (e) Intermediate step showing separate maps for frequencies f+ and f−. (f) The final taken at B0 = 350 mT, is proportional to stray magnetic fields, γNVBx =(f+ − f−)/2 − γNVB0. This is shown alongside a map of residual nonmagnetic shifts, (f+ f−)/2 − 2D. Note that f− is defined such that it is negative when | −1〉 is lower in energy than |0〉. The horizontally varying pattern is an artifact of the sCMOS camera’s read-out dual-sensor This artifact is present when rolling-shutter mode is used, but is eliminated by our subtraction procedure.
The ODMR central frequency of a particular pixel probed in a particular pixel of the sensor contains information about the local magnetic field, B0 + Bx. However, other factors, such as strain or temperature [37], can also produce frequency shifts. Fortunately, the difference of the two ODMR frequencies gives a pure measure of the magnetic field, f+ − f− = 2γNV(B0 + Bx). Subtraction of the contribution from B0 gives the final magnetic images as in Figs. 9(c) and 9(f). The horizontally varying pattern in Fig. 9(e) is actually varying along columns of the sCMOS sensor (the images are rotated by 90° in our setup). This is an artifact of using the sCMOS sensor’s rolling-shutter mode. The sCMOS camera has two sensors, and the read-out from each sensor starts from the center rows and moves out to the edges of the sCMOS chip. The total read-out time is ~ 3 ms, which is approximately the same as the exposure time. This means that rows in the center see a microwave frequency different from that seen by the rows at the edges. The difference is approximately the sweep range divided by the number of microwave points, 12 MHz/16 0.75 MHz. To eliminate this artifact, we scan the microwave frequencies across both ODMRs in the same direction for B0 < 102.5 mT (f+ and f− are both positive), whereas for B0 > 102.5 mT (f+ and f− have opposite signs) we scan the microwave frequencies in opposite directions. This scanning and sub-traction procedure is effective in removing this artifact [Fig. 9(f)].
We use 16 frequencies per ODMR peak, as we find that near-shot-noise-limited performance can be realized in this manner without introducing artifacts. This leads to a maximum magnetic image acquisition rate of ~10 Hz. While we have performed Lorentzian fitting off-line, if one have to implement this postprocessing procedure in real time, the image rate may be further reduced. However, in principle, only two frequencies per resonance are necessary, and in this manner the ODMR positions could be determined algebraically without Lorentzian fitting. This would allow magnetic image refresh rates of ~100 Hz, enabling video recording of fast dynamics.
APPENDIX E. AUXILIARY RESULTS
1. Magnetostatic modeling of s1–s3
Three individual crystals, labeled s1–s3 in the images in Figs. 5(b) and 5(c), are addressed in detail in Fig. 10. Figure 10(a) shows confocal reflection images of each crystal. Figure 10(b) shows the corresponding diamond-magnetic-microscopy images taken at B0 = 186 mT. As with the natural hemozoin sample shown in Figs. 4(a)–4(c), each synthetic crystal exhibits a different field pattern characteristic of its unique size, shape, and orientation.
Figure 10(c) shows the expected magnetic field patterns of each nanocrystal, calculated using the procedure described in Sec. II. Each nanocrystal is modeled as a 3D ellipsoid with uniform susceptibility and dimensions roughly estimated from the corresponding confocal reflection images. The height of the crystals is assumed to be 200 nm. For all crystals, the model produces similar field patterns to those observed experimentally. The pattern amplitude is best described using a susceptibility of χ = 3.4 × 10⁻⁴, which is the same as the value of χ used for natural hemozoin crystals (Sec. IV).
Line cuts of the magnetic field patterns for s1–s3 are shown in Fig. 10(d). The line cuts are obtained by averaging Bx values over six rows (390 nm) in a band along the magnetic feature, as indicated in Figs. 10(b) and 10(c). The line cuts are used to calculate the magnetic pattern amplitudes ΔB at each value of B0. The results of this analysis are displayed in Figs. 5(c) and 5(d) and 14.
2. Diamond magnetic microscopy of hemin
Our diamond magnetic microscope is capable of imaging paramagnetic substances other than hemozoin. Of possible interest are hemin microcrystals, which are used as a pharmacological agent for treating porphyria [56]. Hemin crystals have magnetic susceptibility similar to that of hemozoin but are much larger (up to 30 μm). They thus serve as a convenient test sample for imaging paramagnetism.
3. Natural hemozoin in a second field of view
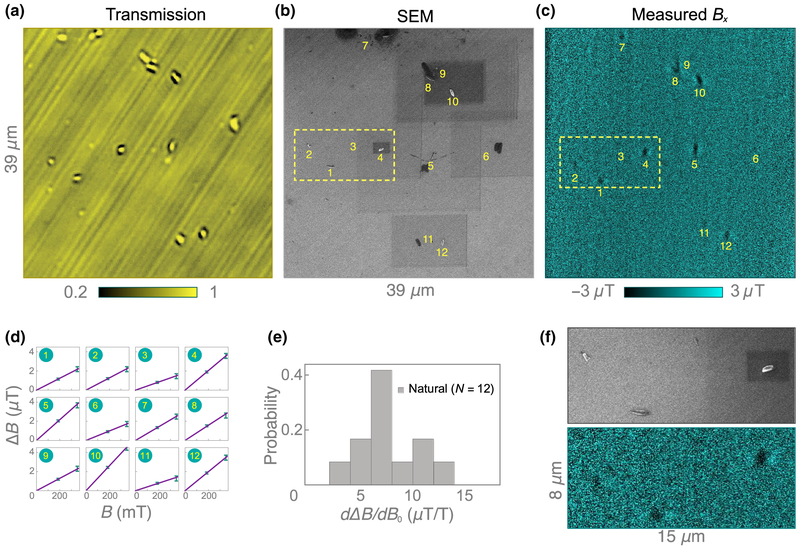
In addition to the hemozoin samples discussed in Sec. IV, we have also studied natural hemozoin crystals in a second region of the diamond substrate. Figures 12(a)–12(c) show, respectively, bright-field transmission, SEM, and diamond-magnetic-microscopy images in this second field of view. The hemozoin density is sparser in this region (only 12 crystals are identified) and less cell residue is present. Figure 12(d) shows the ΔB(B0) curves for each of the 12 crystals, and Fig. 12(e) shows the histogram of the fitted slopes. The distribution is similar to that for natural hemozoin shown in Fig. 5(d). Figure 12(f) shows a magnified view of the SEM and magnetic images containing four crystals.
FIG. 12.
A second region of the natural hemozoin sample. (a) Bright-field transmission image of natural hemozoin crystals dispersed on a diamond substrate. (b) SEM image of the same nanocrystals. Dark rectangles are due to overcharging during zooming. (c) Corresponding diamond-magnetic-microscopy image at B0 = 350 mT showing the positions of each nanocrystal. (d) ΔB(B0) curvesfor all 12 hemozoin crystals. (e) Histogram of dΔB/dB0 determined from the linear slopes in (e). (f) Magnified SEM and magnetic images of crystals 1–4.
4. Complete field-dependent magnetization data set for samples studied in Sec. IV
Figure 13 shows ΔB(B0) curves for all 82 observed magnetic features in the natural hemozoin sample. The paramagnetic crystals are labeled with yellow numbers, while particles exhibiting superparamagneticlike behavior are labeled with red numbers. The corresponding magnetic features are labeled with numbers on the wide-field magnetic image (taken at B0 = 350 mT).
Figure 14 shows ΔB(B0) curves for the 41 magnetic features observed in the synthetic hemozoin sample reported in Sec. IV. The particle exhibiting superparamagnetic behavior is labeled with a red number. The corresponding magnetic features are labeled with numbers on the wide-field magnetic image (taken at B0 = 350 mT).
Figure 11(a) shows a bright-field transmission image of hemin crystals dispersed on a diamond substrate. Figure 11(b) shows the corresponding diamond magnetic image. The magnetic pattern of these crystals appears different from the field patterns presented elsewhere in this paper. This is because we have used a different diamond substrate (with a 1.7-μm-thick NV layer) that is polished with [100] surfaces. All four NV axes in this substrate are directed at 55° from the surface normal, and the magnetic field is applied along one of these NV axes. This geometry leads to more asymmetric patterns than the in-plane field geometry used elsewhere. The pattern amplitudes are consistent with a magnetic susceptibility χ ≈ 3 10−4, similar to that of hemozoin. Some smaller particles×shown on Fig. 11 are hemozoin crystals measured along with hemin crystals.
APPENDIX F. UNCERTAINTY IN SUSCEPTIBILITY
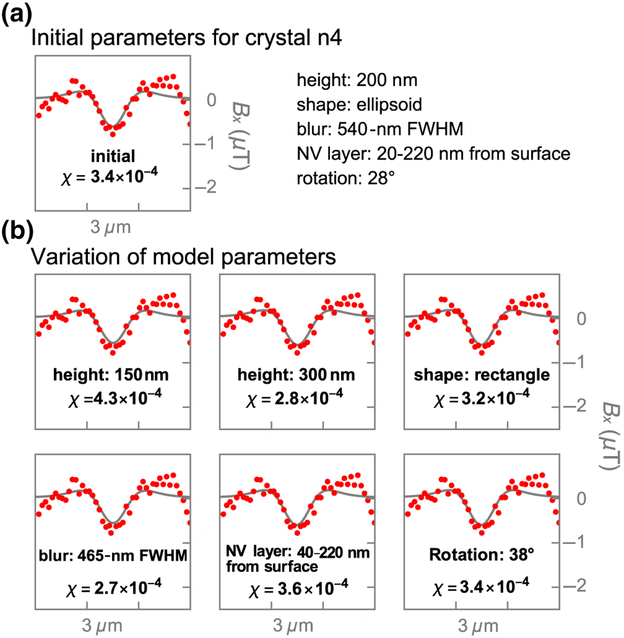
For both natural and synthetic hemozoin, we estimate a relative uncertainty in χ of ~ 25% or less due to imperfect assumptions on NV-layer distribution, image blur, and hemozoin crystal dimensions and shape (see Fig. 15). The image blur is incorporated by convolving the magnetic image with a two-dimensional Gaussian kernel. Some of these assumptions are conflated; for example, image blur and crystal height both contribute to the width of the line cuts seen in Figs. 4(d) and 10(d). We find the best agreement when using a blur with a FWHM of 540 nm and a crystal height of 200 nm. However, we have observe some magnetic features with a FWHM of 400 nm, such as n5 in Fig. 4(d), which is closer to the expected diffraction-limited resolution of our microscope (~ 390 nm). This suggests either the image blur is spatially varying (due to imaging aberrations) or the extra modeled blur is compensating imperfections in another assumption, such as crystal height. We find that reducing the image blur by 15% [Fig. 15(b)] leads to a best-fit estimate of χ = 2.7 × 10⁻⁴, which is 21% smaller than the estimate made in Sec.IV. However, the overall agreement with use of those parameters is slightly worse than for the assumptions of 540-nm blur and χ = 3.4 × 10⁻⁴ made in Sec. IV. By comparing the best-fit values of χ under various reasonable perturbations to the model, we arrive at an uncertainty in χ of ~ 25% or less.
FIG. 15.
Impact of model parameters on magnetic susceptibility χ. (a) Line cuts of measured (red) and simulated (gray) magnetic patterns from crystal n4 [reproduced from Fig. 4(d)] obtained with the initial model parameters shown on the right.(b) Simulated line cuts of n4 for different model parameters. Only one parameter is changed at a time. The varied model parameters and best-fit magnetic susceptibility values are shown as insets.
Another source of systematic uncertainty is that we treat χ as an isotropic quantity. Two factors suggest χ is actually anisotropic [18]: (i) the crystals are elongated, and therefore may be more susceptible to magnetize along their long axes, and (ii) the iron centers in hematin dimers have C4v symmetry [Fig. 2(c)], which is largely preserved after crystal formation. The latter suggests a hard axis and an easy plane, whereas the former suggests all three components of magnetization may be different. Butykai et al. [18] made the hard-axis and easy-plane assumption and found a magnetic anisotropy Mhard axis/Measy plane of 1.16 ± 0.03 at room temperature. We have not incorporated magnetic anisotropy in our model because we have not directly measured it and we do not have information about crystal orientation. However, the variation in χ due to anisotropy is smaller than the estimated uncertainty due to imperfect model assumptions. Nonetheless, it may be a contributing factor to the slight disagreement for some crystals, such as n2 [see Fig. 4(d)]. None of these uncertainties come close to being large enough to explain the behavior of n5 or the other presumed superparamagnetic nanoparticles.
APPENDIX G. SUPERPARAMAGNETISM
Several points are made in Sec. IV that support the argument that five outlier nanoparticles (including n5) are superparamagnetic. Here we outline four more pieces of evidence supporting this argument:
The nanoparticles are small. For two of the features we do not see anything in the SEM images at the locations of the magnetic features. The other features do have small corresponding particles in their SEM (or confocal reflectance) images, but we cannot be sure they are responsible for the magnetic features.
All five particles have zero coercivity; that is, ΔB(0) = 0. Thus, they are unlikely to be ferromagnetic.
The magnetic patterns of these particles are always aligned in the same way as the features from the linear paramagnetic crystals. This further decreases the likelihood these particles are ferromagnetic since they appear to be magnetized by the applied field even at fields below 0.1 T.
The magnetizing field (the B0 field needed to magnetize the particles to half their maximum saturation magnetization) is ~ 0.1 T. This is a reasonable value for superparamagnetic particles [61].
APPENDIX H. COMPARISON WITH OTHER IMAGING METHODS
Several techniques capable of label-free imaging of individual hemozoin crystals are compared in Table I. Optical methods such as absorption microscopy, polarization microscopy, and differential interference microscopy use weak optical fields and are able to register high-contrast images of hemozoin at fast frame rates (~ 100 Hz). Reso-nance Raman microscopy and third-harmonic-generation imaging use more-invasive focused laser beams and require slower scanning, but are capable of visualizing hemozoin with a high degree of specificity. In contrast, diamond magnetic microscopy does not require penetration of light into the hemozoin sample [55] and is the only method capable of registering quantitative magnetic images of individual hemozoin crystals. The frame rate of our method of ~ 1 Hz is slower than that of the weak optical probe methods but comparable to that of third-harmonic-generation imaging and resonance Raman microscopy.
TABLE I.
Methods for label-free imaging of individual hemozoin crystals.
| Imaging method | Physical observables | Penetration of probe | Frame rate (Hz) |
|---|---|---|---|
| Absorption microscopy [57] | Optical absorption | Optical field | ~ 100 |
| Polarization microscopy [58] | Birefringence or dichroism | Optical field | ~ 100 |
| Differential interference contrast [59] | Refractive index | Optical field | ~ 50 |
| Resonance Raman microscopy [60] | Vibrational structure | Intense optical field | ~ 1 |
| Third-harmonic generation [17] | Crystal structure | Intense optical field | ~ 1 |
| Diamond magnetic microscopy (this study) | Magnetic moment | dc or ac magnetic field | ~ 1 |
The perturbative nature of diamond magnetic microscopy lies in the application of weak microwave pulses and a large dc-bias magnetic field. The microwave field could, in principle, lead to heating of the sample. We typically use a low-enough microwave power that the diamond temperature increases by ~ 2 °C or less, as measured by the shift in NV ODMR [37]. Considering diamond’s excellent thermal properties, we can expect that the samples will undergo an even-smaller temperature change. Diamond magnetic microscopy has already been successfully applied to the study of living cells [3,5,62,63]. It is not known whether the introduction of a large bias field may impact hemozoin formation processes in red blood cells. If this is found to be invasive, a time-lapse approach may be required where the field is off for long periods followed by short measurement intervals.
Footnotes
L.B., A.J., and V.M.A. are named as coinventors on a related U.S. patent application: 20180203080 A1. A.J. and L.B. are cofounders of ODMR Technologies and have financial interests in the company. The remaining authors declare no competing financial interests.
References
- [1].Schirhagl Romana, Chang Kevin, Loretz Michael, and Degen Christian L., Nitrogen-vacancy centers in diamond: Nanoscale sensors for physics and biology, Annu. Rev. Phys. Chem 65, 83 (2014). [DOI] [PubMed] [Google Scholar]
- [2].Rondin Loïc, Tetienne Jean-Philippe, Hingant Thomas, Roch Jean-François, Maletinsky Patrick, and Jacques Vincent, Magnetometry with nitrogen-vacancy defects in diamond, Rep. Prog. Phys 77, 056503 (2014). [DOI] [PubMed] [Google Scholar]
- [3].David Le Sage Koji Arai, Glenn David R., De Vience Stephen J., Pham Linh M., Rahn-Lee Lilah, Lukin Mikhail D., Yacoby Amir, Komeili Arash, and Walsworth Ronald L., Optical magnetic imaging of living cells, Nature 496, 486 (2013). [DOI] [PMC free article] [PubMed] [Google Scholar]
- [4].Ziem Florestan C., Götz Nicolas S., Zappe Andrea, Steinert Steffen, and Wrachtrup Jörg, Highly sensitive detection of physiological spins in a microfluidic device, Nano Lett. 13, 4093 (2013). [DOI] [PubMed] [Google Scholar]
- [5].Glenn David R., Lee Kyungheon, Park Hongkun, Weissleder Ralph, Yacoby Amir, Lukin Mikhail D., Lee Hakho, Walsworth Ronald L., and Connolly Colin B., Single-cell magnetic imaging using a quantum diamond microscope, Nat. Methods 12, 736 (2015). [DOI] [PMC free article] [PubMed] [Google Scholar]
- [6].Barry John F., Turner Matthew J., Schloss Jennifer M., Glenn David R., Song Yuyu, Lukin Mikhail D., Park Hongkun, and Walsworth Ronald L., Optical magnetic detection of single-neuron action potentials using quantum defects in diamond, Proc. Natl. Acad. Sci. U. S. A 113, 14133 (2016). [DOI] [PMC free article] [PubMed] [Google Scholar]
- [7].Gould Michael, Barbour Russell J., Thomas Nicole, Arami Hamed, Krishnan Kannan M., and Fu Kai-Mei C., Room-temperature detection of a single 19 nm super-paramagnetic nanoparticle with an imaging magnetometer, Appl. Phys. Lett 105, 072406 (2014). [Google Scholar]
- [8].Tetienne Jean-Philippe, Lombard Alain, Simpson David A., Ritchie Cameron, Lu Jianing, Mulvaney Paul, and Hollenberg Lloyd C. L., Scanning nanospin ensemble microscope for nanoscale magnetic and thermal imaging, Nano. Lett 16, 326 (2016). [DOI] [PubMed] [Google Scholar]
- [9].Davis Hunter C., Ramesh Pradeep, Bhatnagar Aadyot, Audrey Lee-Gosselin John F. Barry, Glenn David R., Walsworth Ronald L., and Shapiro Mikhail G., Mapping the microscale origins of MRI contrast with subcellular NV diamond magnetometry, Nat. Commun 9, 131 (2018). [DOI] [PMC free article] [PubMed] [Google Scholar]
- [10].Coronado Lorena M., Nadovich Christopher T., and Car-menza Spadafora, Malarial hemozoin: From target to tool, Biochim. Biophys. Acta 1840, 2032 (2014). [DOI] [PMC free article] [PubMed] [Google Scholar]
- [11].Sullivan David J., Theories on malarial pigment formation and quinoline action, Int. J. Parasitol 32, 1645 (2002). [DOI] [PubMed] [Google Scholar]
- [12].Hempelmann Ernst, Hemozoin biocrystallization in Plasmodium falciparum and the antimalarial activity of crystallization inhibitors, Parasitol. Res 100, 671 (2007). [DOI] [PubMed] [Google Scholar]
- [13].Cho Sangyeon, Kim Soomin, Kim Youngchan, and Park YongKeun, Optical imaging techniques for the study of malaria, Trends Biotechnol. 30, 71 (2012). [DOI] [PubMed] [Google Scholar]
- [14].Rebelo Maria, Sousa Claudia, Shapiro Howard M., Mota Maria M., Grobusch Martin P., and Hänscheid Thomas, A novel flow cytometric hemozoin detection assay for realtime sensitivity testing of Plasmodium falciparum, PLoS ONE 8, e61606 (2013). [DOI] [PMC free article] [PubMed] [Google Scholar]
- [15].Lawrence Christine and Olson Julie A., Birefringent hemozoin identifies malaria, Am. J. Clin. Pathol 86, 360 (1986). [DOI] [PubMed] [Google Scholar]
- [16].Frita Rosangela, Rebelo Maria, Pamplona Ana, Vigario Ana M., Mota Maria M., Grobusch Martin P., and Hänscheid Thomas, Simple flow cytometric detection of haemozoin containing leukocytes and erythrocytes for research on diagnosis, immunology and drug sensitivity testing, Malaria J. 10, 74 (2011). [DOI] [PMC free article] [PubMed] [Google Scholar]
- [17].Bélisle Jonathan M., Costantino Santiago, Leimanis Mara L., Bellemare Marie-Josée, Bohle D. Scott, Georges Elias, and Wiseman Paul W., Sensitive detection of malaria infection by third harmonic generation imaging, Biophys. J 94, L26 (2008). [DOI] [PMC free article] [PubMed] [Google Scholar]
- [18].Butykai Adam, Agnes Orbán Viktória Kocsis, Szaller Dávid, Bordács Sándor, Tátrai-Szekeres Erzsébet, Kiss Levente, Bóta Attila, Vértessy Beáta, Zelles Tivadar, and Kézsmárki Istvan, Malaria pigment crystals as magnetic micro-rotors: Key for high-sensitivity diagnosis, Sci. Rep 3, 1431 (2013). [DOI] [PMC free article] [PubMed] [Google Scholar]
- [19].Orban Agnes, Rebelo Maria, Molnar Petra, Albuquerque Inês S., Butykai Adam, and Kezsmarki Istvan, Effcient monitoring of the blood-stage infection in a malaria rodent model by the rotating-crystal magneto-optical method, Sci. Rep 6, 23218 (2016). [DOI] [PMC free article] [PubMed] [Google Scholar]
- [20].McBirney Samantha E., Chen Dongyu, Scholtz Alexis, Ameri Hossein, and Armani Andrea M., Rapid diagnostic for point-of-care malaria screening, ACS Sens. 3, 1264 (2018). [DOI] [PubMed] [Google Scholar]
- [21].Peng Weng Kung, Kong Tian Fook, Ng Chee Sheng, Chen Lan, Huang Yongxue, Bhagat Ali Asgar S., Nguyen Nam Trung, Preiser Peter Rainer, and Han Jongyoon, Micromagnetic resonance relaxometry for rapid label-free malaria diagnosis, Nat. Med 20, 1069 (2014). [DOI] [PubMed] [Google Scholar]
- [22].Gossuin Yves, Ndjolo Philippe Okusa, Vuong Quoc Lam, and Duez Pierre, NMR relaxation properties of the synthetic malaria pigment β-hematin, Sci. Rep 7, 14557 (2017). [DOI] [PMC free article] [PubMed] [Google Scholar]
- [23].Sienkiewicz Andrzej, Krzystek J, Vileno Bertrand, Chatain Guillaume, Kosar Aaron J., Bohle D. Scott, and Forró László, Multi-frequency high-field EPR study of iron centers in malarial pigments, J. Am. Chem. Soc 128, 4534 (2006). [DOI] [PubMed] [Google Scholar]
- [24].Kim Charles C., Wilson Emily B., and Derisi Joseph L., Improved methods for magnetic purification of malaria parasites and haemozoin, Malar. J 9, 17 (2010). [DOI] [PMC free article] [PubMed] [Google Scholar]
- [25].Hackett Sara Lyons, Hamzah Juliana, Davis Timothy M. E., and St. Pierre Timothy G., Magnetic susceptibility of iron in malaria-infected red blood cells, Biochim. Biophys. Acta 1792, 93 (2009). [DOI] [PubMed] [Google Scholar]
- [26].Brémard Claude, Jacques Girerd Jean, Merlin Jean Claude, and Moreau Serge, Iron (iii) porphyrin aggregates grafted on agarose gel as models of hemoglobin degradation products, J. Mol. Struct 267, 117 (1992). [Google Scholar]
- [27].Scott Bohle D, Debrunner Peter, Jordan Peter A., Madsen Sara K., and Schulz Charles E., Aggregated heme detoxification byproducts in malarial trophozoites: β-hematin and malaria pigment have a single S = 5/2 iron environment in the bulk phase as determined by EPR and magnetic Mössbauer spectroscopy, J. Am. Chem. Soc 120, 8255 (1998). [Google Scholar]
- [28].Pham Linh M., Le Sage David, Stanwix Paul L., Yeung Tai Kong, Glenn Derek W., Trifonov Andrey, Cappellaro Paola, Hemmer Philip R., Lukin Mikhail D., Park Hongsik, Yacoby Amir, and Walsworth Ronald L., Magnetic field imaging with nitrogen-vacancy ensembles, New J. Phys 13, 045021 (2011). [Google Scholar]
- [29].Tetienne Jean-Philippe, Dontschuk Nikolai, Broadway David A., Stacey Alastair, Simpson David A., and Hollenberg Lloyd C. L., Quantum imaging of current flow in graphene, Sci. Adv 3, e1602429 (2017). [DOI] [PMC free article] [PubMed] [Google Scholar]
- [30].Acosta Victor M., Bauch Erik, Ledbetter Micah P., Santori Charles, Fu Kai-Mei C., Barclay Paul E., Beausoleil Raymond G., Linget Héloïse, Jean Francois Roch Francois Treussart, Chemerisov Sergey D., Gawlik Wojciech, and Budker Dmitry, Diamonds with a high density of nitrogen-vacancy centers for magnetometry applications, Phys. Rev. B 80, 115202 (2009). [Google Scholar]
- [31].Ed Kleinsasser E, Stanfield Matthew M., Banks Jannel K. Q., Zhu Zhouyang, Li Wen-Di, Acosta Victor M., Watanabe Hideyuki, Itoh Kohei M., and Fu Kai-Mei C., High density nitrogen-vacancy sensing surface created via He+ ion implantation of 12C diamond, Appl. Phys. Lett 108, 202401 (2016). [Google Scholar]
- [32].Acosta VM, Bauch E, Jarmola A, Zipp LJ, Ledbetter MP, and Budker D, Broadband magnetometry by infrared-absorption detection of nitrogen-vacancy ensembles in diamond, Appl. Phys. Lett 97, 174104 (2010). [Google Scholar]
- [33].Fang Kejie, Acosta Victor M., Santori Charles, Huang Zhihong, Itoh Kohei M., Watanabe Hideyuki, Shikata Shinichi, and Beausoleil Raymond G., High-sensitivity magnetometry based on quantum beats in diamond nitrogen-vacancy centers, Phys. Rev. Lett 110, 130802 (2013). [DOI] [PubMed] [Google Scholar]
- [34].Shields Brendan J., Unterreithmeier Quirin P., de Leon Nathalie P., Park Hee Su, and Lukin Mikhail D., Effcient readout of a single spin state in diamond via spin-to-charge conversion, Phys. Rev. Lett 114, 136402 (2015). [DOI] [PubMed] [Google Scholar]
- [35].Dolgovskiy Vladimir, Fescenko Ilja, Sekiguchi Noboru, Colombo Simone, Lebedev Victor, Zhang Jiawan, and Weis Antoine, A magnetic source imaging camera, Appl. Phys. Lett 109, 023505 (2016). [Google Scholar]
- [36].Kehayias Pauli, Jarmola Andrey, Mosavian Nazanin, Fescenko Ilja, Benito Francisco M., Laraoui Abdelghani, Smits Janis, Bougas Lykourgos, Budker Dmitry, Neumann Alexander, Brueck Steve R. J., and Acosta Victor M., Solution nuclear magnetic resonance spectroscopy on a nanostructured diamond chip, Nat. Commun 8, 188 (2017). [DOI] [PMC free article] [PubMed] [Google Scholar]
- [37].Acosta Victor M., Bauch Erik, Ledbetter Micah P., Waxman Amir, Bouchard Louis S., and Budker Dmitry, Temperature dependence of the nitrogen-vacancy magnetic resonance in diamond, Phys. Rev. Lett 104, 070801 (2010). [DOI] [PubMed] [Google Scholar]
- [38].Bauch Erik, Hart Connor A., Schloss Jennifer M., Turner Matthew J., Barry John F., Kehayias Pauli, Singh Swati, and Walsworth Ronald L., Ultralong dephasing times in solidstate spin ensembles via quantum control, Phys. Rev. X 8, 031025 (2018). [Google Scholar]
- [39].Inyushin Michail, Kucheryavih Yuriy V., Kucheryavih Lilia Y., Rojas Luévanos, Khmelinskii Igor, and Makarov Vladimir I., Superparamagnetic properties of hemozoin, Sci. Rep 6, 26212 (2016). [DOI] [PMC free article] [PubMed] [Google Scholar]
- [40].Coffey William T. and Kalmykov Yuri P., in The Langevin Equation (Publisher World Scientific, 2017), Vol. 28, Chap. 1, p. 1. [Google Scholar]
- [41].Khmelinskii Igor and Makarov Vladimir I., Temperature dependence of the spin relaxation time of Fe3O4 and hemozoin superparamagnetic nanocrystals, Chem. Phys 493, 120 (2017). [Google Scholar]
- [42].Jaramillo Maritza, Bellemare Marie Josée, Martel Caroline, Shio Marina Tiemi, Contreras Ana Paulina, Godbout Marianne, Roger Michel, Gaudreault Eric, Gosselin Jean, Bohle D. Scott, and Olivier Martin, Synthetic Plasmodium-like hemozoin activates the immune response: A morphology–function study, PLoS ONE 4, e6957 (2009). [DOI] [PMC free article] [PubMed] [Google Scholar]
- [43].Oliveira Marcus F., Kycia Stefan W., Gomez Ariel, Kosar Aaron J., Bohle D. Scott, Hempelmann Ernst, Menezes Diego, Vannier-Santos Marcos André, Oliveira Pedro L., and Ferreira Sérgio T., Structural and morphological characterization of hemozoin produced by Schistosoma mansoni and Rhodnius prolixus, FEBS Lett. 579, 6010 (2005). [DOI] [PubMed] [Google Scholar]
- [44].Ágnes Orbán Ádám Butykai, András Molnár Zófia Prähle, Gergö Fülöp Tivadar Zelles, Forsyth Wasan, Hill Danika, Ivo Müller Louis Schofield, Rebelo Maria, Thomas Hänscheid Stephan Karl, and Kézsmárki István, Evaluation of a novel magneto-optical method for the detection of malaria parasites, PLoS ONE 9, e96981 (2014). [DOI] [PMC free article] [PubMed] [Google Scholar]
- [45].Stepanov Viktor, Cho Franklin H., Abeywardana Chathuranga, and Takahashi Susumu, High-frequency and high-field optically detected magnetic resonance of nitrogen-vacancy centers in diamond, Appl. Phys. Lett 106, 063111 (2015). [Google Scholar]
- [46].Aslam Nabeel, Pfender Matthias, Rainer Stöhr Philipp Neumann, Scheffer Marc, Sumiya Hitoshi, Abe Hiroshi, Onoda Shinobu, Ohshima Takeshi, Isoya Junichi, and Jörg Wrachtrup, Single spin optically detected magnetic resonance with 60–90 GHz (E-band) microwave resonators, Rev. Sci. Instrum 86, 064704 (2015). [DOI] [PubMed] [Google Scholar]
- [47].Egan Timothy J., Physico-chemical aspects of hemozoin (malaria pigment) structure and formation, J. Inorg. Biochem 91, 19 (2002). [DOI] [PubMed] [Google Scholar]
- [48].Lavalle Philippe, Stoltz Jean François, Senger Bernard, Voegel Johannes C., and Schaaf Pierre, Red blood cell adhesion on a solid/liquid interface, Proc. Natl. Acad. Sci. U. S. A 93, 15136 (1996). [DOI] [PMC free article] [PubMed] [Google Scholar]
- [49].Langehanenberg Patrik, Ivanova Lyubomira, Bernhardt Ingolf, Ketelhut Steff, Vollmer Angelika, Dirksen Dieter, Georgiev Georgi K., von Bally Gert, and Kemper Björn, Automated three-dimensional tracking of living cells by digital holographic microscopy, J. Biomed. Opt 14, 014018 (2009). [DOI] [PubMed] [Google Scholar]
- [50].Smits Janis, Damron Joshua, Kehayias Pauli, McDowell Andrew F., Mosavian Nazanin, Fescenko Ilja, Ristoff Nathaniel, Laraoui Abdelghani, Jarmola Andrey, and Acosta Victor M., Two-dimensional nuclear magnetic resonance spectroscopy with a microfluidic diamond quantum sensor, arXiv:1901.02952 [physics.ins-det] (2019). [DOI] [PMC free article] [PubMed] [Google Scholar]
- [51].Jamjoom Ghazi A., Dark-field microscopy for detection of malaria in unstained blood films, J. Clin. Microbiol 17, 717 (1983). [DOI] [PMC free article] [PubMed] [Google Scholar]
- [52].Kim Sooyeong, Kim Kyung Chun, and Yeom Eunseop, Microfluidic method for measuring viscosity using images from smartphone, Opt. Lasers Eng 104, 237 (2018). [Google Scholar]
- [53].Naidu Renugah, Subramanian Gowtham, Lim Ying Bena, Lim Chwee Teck, and Chandramohanadas Rajesh, A reference document on permissible limits for solvents and buffers during in vitro antimalarial screening, Sci. Rep 8, 14974 (2018). [DOI] [PMC free article] [PubMed] [Google Scholar]
- [54].Santori Charles, Barclay Paul E., Fu Kai-Mei C., and Beausoleil Raymond G., Vertical distribution of nitrogen-vacancy centers in diamond formed by ion implantation and annealing, Phys. Rev. B 79, 125313 (2009). [Google Scholar]
- [55].Acosta Victor M., Jarmola Andrey, Budker Dmitry, and Bougas Lykourgos, Magnetic Resonance Spectrometer, US Patent 20180203080 A1 (2017). [Google Scholar]
- [56].Attarian Shirin, Yu Chunli, Anderson Karl E., and Friedman Ellen W., Effects of hemin and hemodialysis in a patient with acute intermittent porphyria and renal failure, Blood Adv. 1, 915 (2017). [DOI] [PMC free article] [PubMed] [Google Scholar]
- [57].Burnett Jennifer L., Carns Jennifer L., and Richards-Kortum Rebecca, In vivo microscopy of hemozoin: towards a needle free diagnostic for malaria, Biomed. Opt. Express 6, 3462 (2015). [DOI] [PMC free article] [PubMed] [Google Scholar]
- [58].Romagosa Cleofé, Menendez Clara, Ismail Mamudo R., Quintó Llorenç, Ferrer Berta, Alonso Pedro L., and Ordi Jaume, Polarisation microscopy increases the sensitivity of hemozoin and plasmodium detection in the histological assessment of placental malaria, Acta Tropica 90, 277 (2004). [DOI] [PubMed] [Google Scholar]
- [59].Abkarian Manouk, Massiera Gladys, Berry Laurence, Roques Magali, and Braun-Breton Catherine, A novel mechanism for egress of malarial parasites from red blood cells, Blood 117, 4118 (2011). [DOI] [PubMed] [Google Scholar]
- [60].Wood Bayden R., Hermelink Antje, Lasch Peter, Bambery Keith R., Webster Grant T., Mehdi Asghari Khiavi Brian M. Cooke, Deed Samantha, Naumann Dieter, and McNaughton Don, Resonance raman microscopy in combination with partial dark-field microscopy lights up a new path in malaria diagnostics, Analyst 134, 1119 (2009). [DOI] [PubMed] [Google Scholar]
- [61].Kolhatkar Arati G., Jamison Andrew C., Litvinov Dmitri, Willson Richard C., and Lee T. Randall, Tuning the magnetic properties of nanoparticles, Int. J. Mol. Sci 14, 15977 (2013). [DOI] [PMC free article] [PubMed] [Google Scholar]
- [62].McGuinness Liam P., Yan Yuling, Stacey Alastair, Simpson David A., Hall Liam T., Maclaurin Dougal, Prawer Steven, Mulvaney Paul C., Scholten Robert E., and Hollenberg Lloyd C. L., Quantum measurement and orientation tracking of fluorescent nanodiamonds inside living cells, Nat. Nanotechnol 6, 358 (2011). [DOI] [PubMed] [Google Scholar]
- [63].Kucsko Georg, Maurer Peter C., Yao Norman Y., Kubo Minoru, Hyun Jong Noh Po Kam Lo, Park Hongkun, and Lukin Mikhail, Nanometre-scale thermometry in a living cell, Nature 500, 54 (2013). [DOI] [PMC free article] [PubMed] [Google Scholar]


