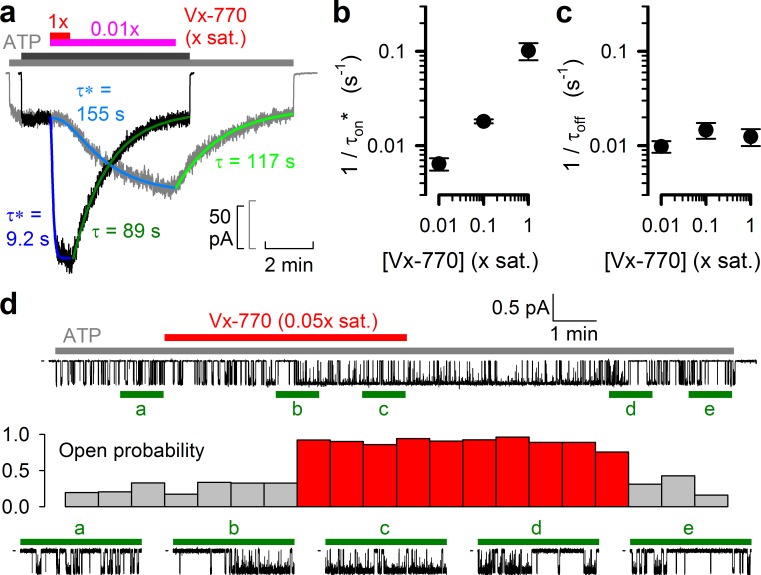
Figure 4. Delayed activation by low nanomolar Vx-770 suggests multiple sequential slow steps in activation process.
(a) Stimulation of macroscopic WT CFTR currents in 2 mM ATP by exposure to a 1x (black trace; dark gray and red bar) or an 0.01x (gray trace; light gray and purple bar) saturated aqueous solution of Vx-770. Current amplitudes have been rescaled by their pre-drug values, and superimposed traces are shown synchronized to the time point of drug addition. Sigmoidal activation time courses are fitted (blue lines) by a sequential three-step mechanism, and apparent activation time constants (τ*, see Materials and methods) are plotted. Deactivation time courses are fitted (green lines) by single exponentials with time constants (τ) indicated. (b–c) Overall rates of current stimulation (1/τon*; b) and rates of deactivation (1/τoff; c) in response to addition and removal, respectively, of indicated concentrations of Vx-770. Mean ± S.E.M. from 5-7 experiments. (d) (Top) Continuous ~16-min recording from a single prephosphorylated WT CFTR channel gating in 2 mM ATP (gray bar) and exposed for ~6 min to 0.05x saturated (~3 nM) Vx-770 (red bar). (Center) Open probability calculated over sequential 46-s intervals for the recording shown on top. Note sudden switch from low- (gray bars) to high-activity gating (red bars) ~3 min after initiation of drug exposure, and a similarly sudden switch back to low-activity gating ~5 min after drug removal. (Bottom) 1-min segments marked by green bars in the recording on top are shown at an expanded time scale.

