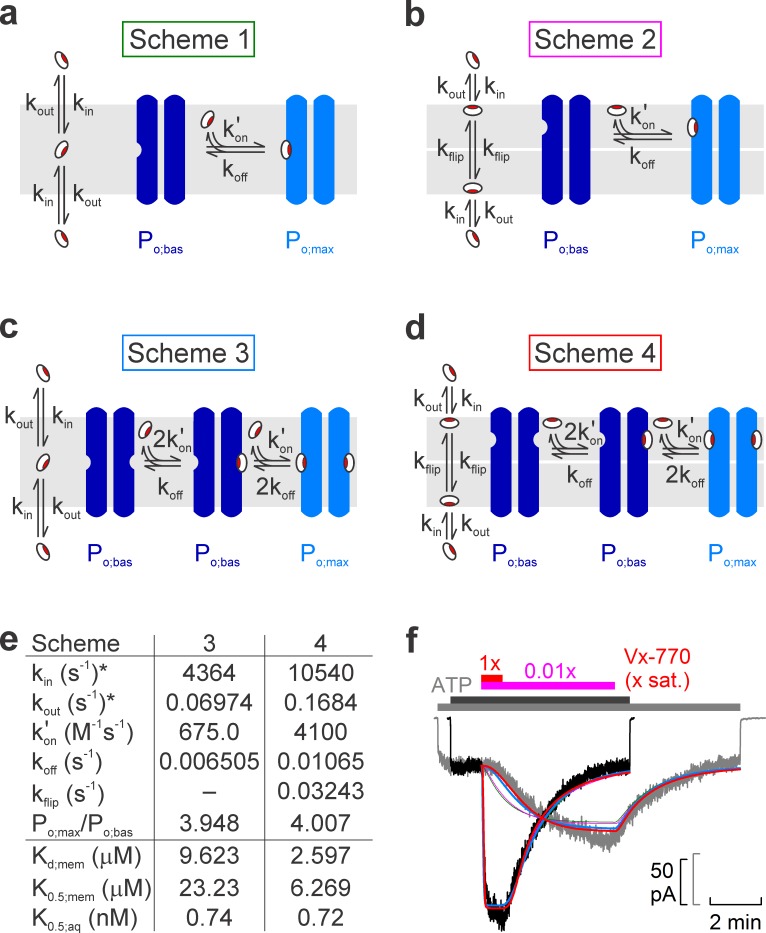
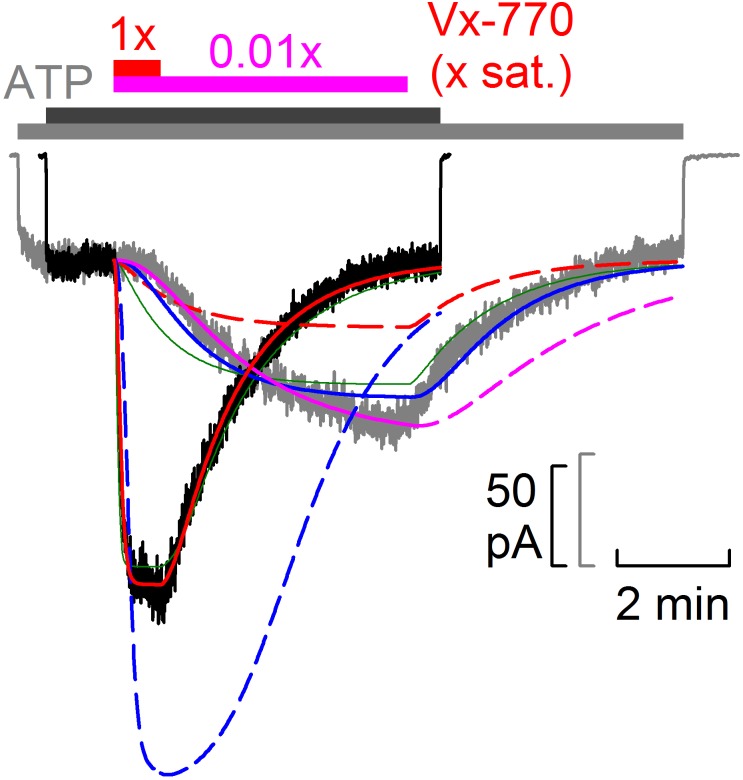
Figure 5. Model fitting of activation/deactivation time courses in response to cytosolic addition/removal of Vx-770.
(a-d) Cartoon representation of schemes with one (a, b) or two (c, d) drug binding sites, and one (a, c) or two (b, d) membrane compartments (cytoplasmic, bottom; extracellular, top). (e) Fit parameters obtained from global fits of Schemes 3 (left column) and 4 (right column) to the data set shown in f. *Parameters kin and kout were constrained through kin/kout = Doct/wat(pH=7.1) = 62580. Parameters Kd;mem, K0.5;mem, and K0.5;aq were calculated from the fit parameters as described in Materials and methods. (f) Pair of normalized macroscopic WT CFTR current activation/deactivation time courses recorded in response to cytosolic addition/removal of 0.01x saturated (gray trace) and 1x saturated (black trace) concentrations of Vx-770 (replotted from Figure 4a), and ensemble fits by the models in a–d (colored lines; green, Scheme 1, pink, Scheme 2, blue, Scheme 3, red, Scheme 4). See also Figure 5—figure supplement 1.


