

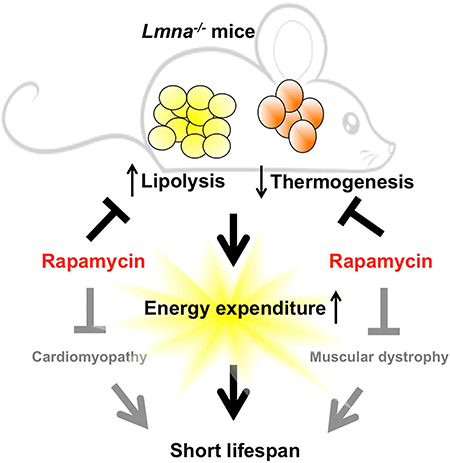
SUMMARY
The role of the mTOR inhibitor rapamycin in regulation of adiposity remains controversial. Here, we evaluate mTOR signaling in lipid metabolism in adipose tissues of Lmna−/−mice, a mouse model for dilated cardiomyopathy and muscular dystrophy. Lifespan extension by rapamycin is associated with increased body weight and fat content, two phenotypes we link to suppression of elevated energy expenditure. In both white and brown adipose tissue of Lmna−/− mice, we find that rapamycin inhibits mTORC1 but not mTORC2, leading to suppression of elevated lipolysis and restoration of thermogenic protein UCP1 levels, respectively. The short lifespan and metabolic phenotypes of Lmna−/− mice can be partially rescued by maintaining mice at thermoneutrality. Together, our findings indicate that altered mTOR signaling in Lmna−/− mice leads to a lipodystrophic phenotype that can be rescued with rapamycin, highlighting the impact of loss of adipose in Lmna−/− mice and the consequences of altered mTOR signaling.
Keywords: rapamycin, lifespan, mTOR, Lmna−/− mice
Graphical Abstract
INTRODUCTION
The mechanistic target of rapamycin (mTOR) protein is well known to orchestrate cell growth and proliferation (Laplante and Sabatini, 2012) and is linked to a range of age-related diseases (Johnson et al., 2013a). Rapamycin, which inhibits the mTOR signaling, prolongs lifespan in a variety of genetically different mice (Anisimov et al., 2011; Harrison et al., 2009; Neff et al., 2013) and genetically modified mouse models of various human diseases (Fujishita et al., 2008; Johnson et al., 2013b; Ramos et al., 2012).
Accumulating evidence also indicates that the mTOR complex 1 (mTORC1) plays a key role in the regulation of fat metabolism (Cai et al., 2016; Lamming and Sabatini, 2013). Upon activation, mTORC1 suppresses lipolytic enzymes and represses lipolysis, and activates lipogenesis and lipid storage, while inhibition of mTOR blocks adipogenesis and stimulates lipolysis (Chakrabarti et al., 2010; Lamming and Sabatini, 2013). In light of this, rapamycin, which is known to acutely inhibit mTORC1, has been shown to suppress adiposity and/or body weight (BW) of mice (Anisimov et al., 2011; Fang et al., 2013; Miller et al., 2014). Genetic interventions leading to mTORC1 inhibition, such as adipose-specific Raptor knockout, result in lean mice with increased energy expenditure (Polak et al., 2008). However, some studies show the absence of changes in BW or even an increase with rapamycin treatment in mice (Fischer et al., 2015; Liu et al., 2014; Zhang et al., 2013b). Thus, the link between mTOR signaling, the effects of rapamycin and fat metabolism remains unresolved (Cai et al., 2016).
Compared to the numerous studies on mTORC1, knowledge of the role of mTORC2 in metabolism is less understood (Albert and Hall, 2015), and is confounded by the multi-level crosstalk between the two complexes (Julien et al., 2010). Unlike mTORC1, mTORC2 is largely insensitive to rapamycin in an acute setting; however, it can be inhibited by chronic exposure to rapamycin in vitro (Sarbassov et al., 2006). Chronic rapamycin treatment also disrupted both mTORC1 and mTORC2 complexes in muscle, liver and adipose tissues (Lamming et al., 2012; Schreiber et al., 2015). Interestingly, inactivation of mTORC2 signaling by deletion of Rictor specifically in adipose tissue of mice also profoundly affects whole body metabolism, leading to weight gain and insulin resistance (Kumar et al., 2010) and suggesting that whole body metabolism could be affected only by altered mTORC2 activity in adipose tissues.
Over 450 distinct mutations in LMNA, which encode A-type lamins that form intermediate filaments in the nucleus, cause a range of diseases termed laminopathies (Schreiber and Kennedy, 2013). The laminopathies comprise multiple diseases with a range of phenotypic overlap (Worman and Bonne, 2007), including different forms of cardiomyopathy, muscular dystrophy, lipodystrophy, neuropathy, and progeria (Hutchinson-Gilford progeria syndromes, HGPS). Lamin A/C-deficient (Lmna−/−) mice, which are really hypomorhs due to low level expression of an altered splice variant (Jahn et al., 2012), can capture some of those phenotypes, including cardiomyopathy, muscular dystrophy, neuropathy and possibly lipodystrophy (Sullivan et al., 1999). Previously, we found that the dilated cardiomyopathy and skeletal muscle dystrophy is associated with aberrantly elevated mTORC1 signaling (Ramos et al., 2012), a result consistent with findings in mice expressing a Lmna variant, H222P, associated with cardiomyopathy (Choi et al., 2012). Rapamycin-mediated mTORC1 inhibition improves cardiac and muscle function and robustly enhances survival in Lmna−/− mice (Ramos et al., 2012). Given the role of mTOR activity in regulating cellular metabolism, we speculated that aberrant mTOR signaling may be fundamental to the development of lipodystrophy in Lmna−/− mice, and possibly human patients, as well. Here, we examined whether life extension by rapamycin in Lmna−/− mice is due to the mTOR-mediated regulation of lipid metabolism in adipose tissue.
RESULTS
Rapamycin increases body weight and fat content in the context of Lmna−/− mice
Previously, we reported that the survival of Lmna−/− mice can be extended by rapamycin (Ramos et al., 2012). To examine metabolic phenotypes in more detail and the consequences of rapamycin administration, we repeated this experiment, delivering rapamycin by intraperitoneal injection every other day. The results validate the previous findings, indicating that Lmna−/− mice treated with rapamycin lived approximately twice as long as control littermates (Figure 1A, Figure S1).
Figure 1. Lamin A/C-deficient mice treated with rapamycin live longer and maintain more body weight and adiposity.

(A) Kaplan-Meier plot of Lmna−/− mice that were treated with vehicle (n = 32; black) or rapamycin (n = 37; red) every other day starting at 4 weeks of age. Symbols represent individual mice. (B) Lmna−/− mice treated with vehicle (n = 32; black) or rapamycin (n = 38; red) were weighed every other day. (C) Adiposity (% body fat) was measured weekly [(fat mass/BW) x 100] from mice treated with vehicle (n = 8; black) or rapamycin (n = 11; red). Symbols represent mean BW or % body fat ± SEM. (D, E) Energy expenditure (EE) and respiratory quotient (RQ) of Lmna+/+ and Lmna−/− mice treated with rapamycin (rapa) during day and night cycle. (F) Food intake of Lmna+/+ and Lmna−/− mice treated with rapa. Data from males and females are combined. Each value is mean ± SEM for the number of mice indicated in parentheses.
Lmna−/− mice rapidly become cachexic, losing body weight (BW) significantly before death. Interestingly and consistent with enhanced survival, the drug partially suppressed the rapid weight loss in Lmna−/− mice (Figure 1B). However, rapamycin-treated Lmna−/− mice still undergo a significant weight decline before death, suggesting that cachexia may still contribute to their mortality. Consistent with BW data, rapamycin-treated Lmna−/− mice showed a significant increase in total fat content (Figure 1C). These findings suggested that, in addition to the potential direct benefits of rapamycin on cardiac and muscle function (Ramos et al., 2012), increasing fat content may be a factor in the improved survival of Lmna−/− mice. Interestingly, this short-term treatment of rapamycin does not increase the BW of wild type (WT) mice, but tends to increase the percentage of fat (Figure S1G, H).
Rapamycin suppresses elevated energy expenditure in Lmna−/− mice
Energy balance is determined by energy intake and expenditure. We then employed indirect calorimetry to characterize the metabolic profiles of Lmna−/− mice treated with rapamycin to decipher the cause(s) of the lean phenotype. Interestingly, Lmna−/− mice exhibit high energy expenditure (EE) both during day and night cycle (Figure 1D). Consistent with our hypothesis, rapamycin completely reversed this elevated EE (Figure 1D). Paradoxically but perhaps consistent with their muscle pathology, Lmna−/− mice were hypoactive relative to controls, as shown by decreased movement in wheel running and pedestrian walking (Figure S2). Thus, we excluded the possibility of a significant increase in behavioral activity that contributes to the elevated EE in Lmna−/− mice (Figure S2). As reported Lmna−/− mice eat substantially less, even when food intake is adjusted to BW (Nikolova et al., 2004) (Figure 1F). However, we were unable to detect any significant increase in food intake in rapamycin-treated Lmna−/− mice (Figure 1F), indicating that other differences likely account for the altered fat content in these mice. In summary, we found that reduced fat depots in Lmna−/− mice resulted from reduced energy intake and elevated EE, and that rapamycin suppressed this elevated EE to the level comparable to WT mice (Figure 1D). This suppression of elevated EE suggested that the metabolic effects of rapamycin may in part underlie the health benefits of the drug in Lmna−/− mice.
To estimate fuel utilization, we measured respiratory quotient (RQ) in the same setting. Lmna−/− mice have indistinguishable fuel utilization compared to WT mice either during day or night cycle (Figure 1E), suggesting that the loss in fat in Lmna−/− mice is not a result of altered substrate utilization for energy production. However, the rapamycin-treated Lmna−/− mice had a significantly decreased RQ compared to their Lmna−/− controls during the day cycle, and exhibited a similar (although not significant) trend at night (Figure 1E), suggesting that rapamycin enhanced fat utilization in Lmna−/− mice even while simultaneously maintaining fat content. We consistently observe no difference in RQ in WT mice treated with rapamycin, as previously reported (Fang et al., 2013).
Collectively, the data suggest that the lean phenotype of Lmna−/− mice is likely due to increased EE, rather than changes caused by energy intake or activity. Also, rapamycin promotes weight gain in Lmna−/− mice by suppressing EE, rather than increasing food intake or decreasing behavioral activity.
Rapamycin suppresses elevated lipolysis in white adipose tissue of Lmna−/− mice
Activation of mTOR signaling promotes adipogenesis and suppresses lipogenesis in WT mice (Lamming and Sabatini, 2013). In addition, we have demonstrated that mTORC1 signaling is elevated in heart and skeletal muscle of Lmna−/− mice (Ramos et al., 2012). Therefore, we speculated that the dysregulation of mTOR signaling might contribute to the lipodystrophy in Lmna−/− mice. To test this, we characterized mTOR signaling in adipose tissue of Lmna−/− mice and its regulation by rapamycin. In the white adipose tissue (WAT) of Lmna−/− mice, mTORC1 activity, as indicated by phosphorylation of rpS6 (p-S6 S240/244), was not statistically different from that of WT mice (Figure 2A), suggesting that WAT may not be the major pathological tissue accounting for the short lifespan of Lmna−/− mice. As mTORC1 signaling is also not increased in liver of Lmna−/− mice (Ramos et al., 2012), this finding further supports the observation that elevated mTORC1 signaling in Lmna−/− mice is a tissue-specific phenomenon. We also determined mTORC2 activity indicated by p-Akt (S473), p-SGK (S422), and p-NDRG1 (T346). We found that mTORC2 activity is increased in Lmna−/− mice, although we also found no significant change in p-Akt (S473) (Figure 2D) but a significant change in p-SGK (S422) and p-NDRG1 (T346) (Figure S3A).
Figure 2. Role of mTOR activity in white adipose tissue of Lmna+/+ and Lmna−/− mice treated with rapamycin.

(A-C) Western blots of mTORC1 activity in white adipose tissue (WAT) of Lmna+/+ and Lmna−/− mice treated with rapamycin. Relative p-S6 levels (normalized to S6) were quantified. (D-F) Western blots of mTORC2 activity in WAT of Lmna+/+ and Lmna−/− mice treated with rapamycin. Relative p-Akt levels (normalized to Akt) were quantified. Each value is mean ± SEM for the number of mice indicated in parentheses. P values were derived from unpaired two-tailed Student’s t-test. ns: no significance.
As with heart and skeletal muscle of Lmna−/− mice (Ramos et al., 2012), rapamycin strongly suppressed mTORC1 signaling in WAT (Figure 2B), and mirroring findings in WT mice (Figure 2C). Chronic rapamycin treatment has been shown to disrupt mTORC2 and thus suppress p-Akt in adipose tissue of WT mice (C57BL/6J) (Lamming et al., 2012; Schreiber et al., 2015) and in our colony (mixed 129Sv-C57BL/6J) (Figure 2F). However, we failed to detect a reduction in p-Akt (S473) by rapamycin in WAT of Lmna−/− mice (Figure 2E). The same pattern is seen for other substrates of mTORC2, p-SGK (S422) and p-NDRG1 (T346) (Figure S3B). Thus, although mTORC1 signaling is not intrinsically altered in WAT of Lmna−/− mice, altered fat storage by rapamycin in Lmna−/− mice may be related to the suppression of mTORC1 activity, but not mTORC2.
Next, we examined proteins involved in lipid metabolism to look for other molecular explanations underlying the decreased adiposity of Lmna−/− mice. We found that the reduction in adiposity in Lmna−/− mice is not linked to altered expression of proteins involved in lipogenesis, such as fatty acid synthase (FAS) (Figure S3E). Furthermore, while rapamycin-treated Lmna−/− mice maintained more adiposity, this is also unlikely to be due to enhanced lipogenesis (Figure S3F). Of note, rapamycin did suppress FAS in WT mice (Figure S3G).
For lipolysis, adipose triglyceride lipase (ATGL) and hormone-sensitive lipase (HSL) are responsible for most of the triglyceride hydrolase activity in murine WAT (Schweiger et al., 2006). (Figure 3A). Consistent with our hypothesis, ATGL was elevated in Lmna−/− mice suggesting increased breakdown of fat reserves in WAT (Figure 3B) as well as the elevation of serum free fatty acids (FFA) (Figure 3H), a lipolysis product. Interestingly, rapamycin suppressed this effect (Figure 3C, H). In contrast, p-HSL (S563) was not affected by loss of A-type lamins or rapamycin (Figure 3E, F). Of note, rapamycin did not significantly suppress lipolysis in WT mice (Figure 3D, G).
Figure 3. Rapamycin reverses the elevated lipolysis in white adipose tissue of Lmna−/− mice.

(A) Simplified diagram of the lipolytic pathway in white adipose tissue (WAT). TG: triglyceride. DG: diglyceride. MG: monoacylglycerol. ATGL: adipose triglyceride lipase. HSL: hormone-sensitive lipase. FFA: free fatty acid. (B-D) Activity of lipolysis, indicated by ATGL, of Lmna+/+ and Lmna−/− mice treated with rapamycin. Relative ATGL levels (normalized to GAPDH) were quantified. (E-G) Activity of lipolysis, indicated by p-HSL, of Lmna+/+ and Lmna−/− mice treated with rapamycin. Relative p-HSL levels (normalized to HSL) were quantified. (H) FFA of Lmna+/+ and Lmna−/− mice treated with rapamycin. (I) Western blots of ATGL levels in preadipocytes derived from WAT of Lmna−/− mice. Representative blots were shown from 5 Lmna−/− mice. Rapa: rapamycin. Each value is mean ± SEM for the number of mice indicated in parentheses. P values were derived from unpaired two-tailed Student’s t-test.
We further tested this rapamaycin-suppressed lipolysis in adipocytes purified from adipose tissue. We found that rapamycin suppressed ATGL levels after 24 h of treatment in preadipocyte cells derived from WAT of Lmna−/− mice (Figure 3I). Together, these data indicate that the disappearance of fat in Lmna−/− mice is associated with increased lipolysis in WAT, and that this phenotype is suppressed by rapamycin.
Altered UCP1 expression in brown adipose tissue of Lmna−/− mice
We considered the likelihood that increased EE and reduced adiposity in Lmna−/− mice may due to altered mitochondrial uncoupling and heat generation mediated by uncoupling protein 1 (UCP1) in brown adipose tissue (BAT). Interestingly, both mTORC1 and mTORC2 signaling have been thought to suppress UCP1 expression in the WT mice, although the molecular mechanisms are not well established (Cai et al., 2016) (Figure 4A).
Figure 4. Rapamycin reverses the downregulated UCP1 protein in brown adipose tissue of Lmna−/− mice.

(A) Tested model for the role of mTOR activity in the expression of UCP1 protein in brown adipose tissue (BAT). (B-D) Western blots of mTORC1 activity in Lmna+/+ and Lmna−/− mice treated with rapamycin. Relative p-S6 levels (normalized to S6) were quantified. (E-G) Western blots of mTORC2 activity of Lmna+/+ and Lmna−/− mice treated with rapamycin. Relative p-Akt levels (normalized to Akt) were quantified. (H-J) Rapamycin increases UCP1 in BAT of Lmna−/− mice. Relative UCP1 levels (normalized to GAPDH) were quantified. (K) Body surface temperature of Lmna+/+ and Lmna−/− mice treated with rapamycin. Mice treated with vehicle (WT, black square, n = 4; KO, black circle, n = 11) or rapamycin (WT, red square, n = 5; KO, red circle, n = 11) were measured every other day. Symbols represent mean body surface temperature ± SEM. Data from males and females are combined. (L) Western blots of UCP1 levels in preadipocytes derived from BAT of Lmna−/− mice. Representative blots were shown from 5 Lmna−/− mice. WT: wild type (Lmna+/+). KO: knockout (Lmna−/−). Rapa: rapamycin. Each value is mean ± SEM for the number of mice indicated in parentheses. P values were derived from unpaired two-tailed Student’s t-test.
In light of the role of BAT in mammalian physiology, we also examined mTOR signaling in BAT. Interestingly, we observed elevation of mTORC1 signaling in BAT of Lmna−/− mice, as indicated by p-S6 (Figure 4B). The same pattern is seen for the activity of mTORC2 signaling, as indicated by p-Akt (S473) (Figure 4E). Phosphorylation of NDRG1 (T346) may also be elevated although the difference did not reach significance, and no changes were observed for p-SGK (S422) (Figure S3C). This suggests aberrant mTOR signaling in BAT may contribute to the elevated EE in Lmna−/− mice, especially mTORC1 signaling. Rapamycin suppressed mTORC1 (Figure 4F), but not mTORC2, as indicated by p-Akt (S473) (Figure 4F) and p-SGK (S422) (Figure S3D) in BAT of Lmna−/− mice. Suppressing p-S6 but not p-Akt (S473) was also found in WT mice (Figure 4D, G).
Consistent with previous reports (Xiang et al., 2015) (Figure 4A), we detected a downregulation of UCP1 in BAT of Lmna−/− mice concomitant with elevated mTOR activity (Figure 4H). This suggests that Lmna−/− mice suffer from a mis-regulation of thermogenesis. Interestingly, rapamcyin restored UCP1 expression in BAT (Figure 4I), suggesting enhanced thermogenesis coupled with reduced EE. Consistent with these results, we found that the body temperature was better maintained in rapamycin-treated Lmna−/− mice, a mouse model with intrinsic hypothermia (Figure 4K). In order to confirm that rapamycin directly mediates UCP1 expression in BAT, we isolated BAT from Lmna−/− mice and cultured preadipocytes, which were treated with or without rapamycin. We found that indeed UCP1 level was elevated by rapamycin in this setting (Figure 4L). Together, these data imply that rapamycin enhances heat production in Lmna−/− mice, either through direct regulation of UCP1 or indirectly as a result of suppression of EE through other mechanisms.
Higher housing temperature suppresses energy expenditure and extends survival of Lmna−/− mice
Given their smaller size, elevated EE and reduced expression of UCP1 in BAT of Lmna−/− mice, we tested the hypothesis that increasing ambient temperature would suppress EE and enhance the survival of Lmna−/− mice. As predicted, the ambient temperature of 30 °C, which represents thermoneutrality, dramatically suppressed elevated EE in Lmna−/− mice (Figure S4A). However, fuel utilization was not altered, since the RQ was indistinguishable from Lmna−/− mice at 22 °C (Figure S4B), indicating that Lmna−/− mice at 30 °C do not switch to fat as a major energy source.
Higher housing temperature also extended the survival of Lmna−/− mice (Figure 5A, Figure S4D, G). Lmna−/− mice under 30 °C also gained more BW and body fat than control mice (Figure 5B, C, Figure S4E, F, H, I). Surprisingly, Lmna−/− mice under 30 °C ate less than Lmna−/− mice at 22 °C (Figure S4C).
Figure 5. Higher housing temperature increases survival in Lmna−/− mice.

(A) Kaplan-Meier plot of Lmna−/− mice that were treated at 22 °C (n = 57; black) or 30 °C (n = 57; pink). Symbols represent individual mice. Data from males and females are combined. (B) Mice treated at 22 °C (n = 57; black) or 30 °C (n = 56; pink) were weighed every other day. (C) Adiposity (% body fat) was measured weekly [(fat mass/BW) × 100] from mice treated at 22 °C (n = 58; black) or 30 °C (n = 55; pink). Symbols represent mean BW or % body fat ± SEM. (D-E) Lipolysis in WAT of Lmna−/− mice treated at 22 °C or 30 °C. Relative ATGL levels (normalized to GAPDH) and p-HSL levels (normalized to HSL) were quantified. (F) Western blots of mTORC1 activity in BAT of Lmna−/− mice at 30 °C. Relative p-S6 levels (normalized to S6) were quantified. (G) Western blots of mTORC2 activity in BAT of Lmna−/− mice at 30 °C. Relative p-Akt levels (normalized to Akt) were quantified. (H) UCP1 protein expression was suppressed by 30 °C in BAT of Lmna−/− mice. Each value is mean ± SEM for the number of mice indicated in parentheses. P values were derived from unpaired two-tailed Student’s t-test. (I) Schematic model explains the functional role of rapamycin in WAT and BAT in life extension of Lmna−/− mice. See Discussion for details. ATGL: adipose triglyceride lipase. UCP1: uncoupling protein-1. FFA: free fatty acids.
At the molecular level, 30 °C suppressed lipolysis in WAT (Figure 5D), which may contribute to maintaining more BW and adiposity in Lmna−/− mice (Figure 5B, C). Also, UCP1 protein in BAT was suppressed by 30 °C (Figure 5H), which is also consistent given the reduced need for thermogenesis. Together, these findings indicate that thermoneutral conditions are sufficient to extend the lifespan of Lmna−/− mice. Of note, however, the enhancement of survival by 30 °C is less than that caused by rapamycin even though suppression of EE is more robust at 30 °C, indicating that the magnitude of the two phenotypes are not directly correlated.
Notably, elevated EE was not observed in LmnaH222P/H222P mice, which model a human mutation associated with dilated cardiomyopathy and muscular dystrophy without lipodystrophy (Arimura et al., 2005). As with the Lmna−/− mice (Ramos et al., 2012), suppressing mTORC1 signaling ameliorates cardiomyopathy in LmnaH222P/H222P mice (Choi et al., 2012); however, unlike the Lmna−/− mice, it does not extend lifespan (Figure S5).
Collectively, we interpret our data to mean that reduced EE accounts for a portion of the survival benefits conferred by rapamycin, but not all. This implies either that rapamycin enhances survival in Lmna−/− mice either through improvements in cardiac or skeletal muscle function, even though this was insufficient to affect survival in LmnaH222P/H222P mice, or through other unknown physiologic consequences, perhaps related to aspects of metabolism not phenocopied by thermoneutrality.
DISCUSSION
Lmna−/− mice, used commonly as a model for the cardiomyopathy and muscular dystrophy associated with human mutations in LMNA (Schreiber and Kennedy, 2013; Zhang et al., 2013a), are also reported to be lean (Sullivan et al., 1999), and this has been speculated to be a consequence of their myopathic disease rather than lipodystrophy (Cutler et al., 2002). Here, we show that Lmna−/− mice have elevated EE. Furthermore, we demonstrate that both rapamycin and 30 °C suppress EE, slow down BW and body fat loss, and significantly extend the survival. Molecularly, the pronounced high EE developed in Lmna−/− mice can be attributed in part to the downregulation of thermogenic protein UCP1 expression in BAT, which leads to the increase of lipolysis in WAT to provide FFAs as energy to compensate. All of these phenotypes can be rescued by rapamycin, which suppressed the elevated mTOR activity in the BAT of Lmna−/− mice (Figure 5I). This model could be supported by 1) UCP1-deficient mice, which show a great loss of BW and fat mass and consistent with increased EE (Ukropec et al., 2006) and 2) ATGL knockout mice, which accumulate fat mass with reduced EE (Haemmerle et al., 2006).
In addition to the cardiac and skeletal muscle phenotypes, Lmna−/− mice present with a lipodystrophic phenotype that appears similar to that recently observed in the HGPS model LmnaG609G/G609G mice, including increased WAT lipolysis and elevated EE (Lopez-Mejia et al., 2014). The HGPS mutation that leads to progerin expression is complex in nature, likely evoking both gain-of-function and loss-of-function phenotypes. We speculate that the lipodystrophic phenotype may be loss-of-function, an assertion supported by the existence of human lipodystrophic mutations that act recessively.
Multiple mouse models of HGPS, including Zmpste24−/− (defective for prelamin A processing) and the aforementioned LmnaG609G/G609G mice, show a loss of adiposity. Proteomic profiling of adipose tissue from Zmpste24−/− mice showed upregulation of ATGL (Peinado et al., 2011), consistent with increased lipolysis. Moreover, interventions associated with enhanced survival in these models also lead to delayed weight loss and/or increased fat content. These include Zmpste24−/− mice treated with resveratrol (Liu et al., 2012), recombinant IGF-1 (Marino et al., 2010), and the farnesyltransferase inhibitor (Fong et al., 2006), as well as LmnaG609G/G609G mice exposed to an antisense morpholino treatment strategy designed to block the pathogenic Lmna splicing that leads to progerin expression (Osorio et al., 2011). We speculate that a higher housing temperature may improve survival in these mouse models and propose that restoration of adipose tissue may be critical to therapeutic approaches in HGPS patients, as well as those with lipodystrophy.
Regarding mTOR signaling, the most striking observation in this study is that rapamycin-treated Lmna−/− mice maintained more BW, which is due to an increase in fat content. This adds to increasing evidence suggesting that mTOR-signaling plays a role in lipid homeostasis and that mTORC1 exerts a positive role in adipogenesis (Chakrabarti et al., 2010; Lamming and Sabatini, 2013). We observed elevated lipolysis in Lmna−/− mice, indicated by enhanced ATGL expression and increased serum FFAs. This phenotype was not associated with altered mTOR signaling in WAT, but rapamycin strongly suppressed it, consistent with observations in other contexts that rapamycin can suppress ATGL expression (Chakrabarti et al., 2010; Chakrabarti et al., 2013).
Contrary to WAT, both mTORC1 and mTORC2 signaling are elevated in BAT, implying a link between A-type lamin function and mTOR signaling in BAT and suggesting that metabolic dysregulation in Lmna−/− mice may be related to altered BAT function. Consistently, we found that the thermogenic protein UCP1 was downregulated in BAT of Lmna−/− mice and restored by rapamycin. Given that UCP1 functions as a H+/fatty acid symporter, fatty acids produced from lipolysis of WAT were revealed to allosterically activate UCP1-mediated uncoupling (Fedorenko et al., 2012). Thus, the working model is that rapamycin suppresses elevated EE in Lmna−/− mice in part by restoring UCP1 protein level in BAT, which leads to efficiently use the FFA from lipolysis of WAT as energy resource. Further, rapamcyin suppresses the lipolysis in WAT, which contributes to increased BW and adiposity as well as suppression of elevated EE in Lmna−/− mice (Figure 5I). In addition, the elevated mTORC1 signaling in BAT may in part account for reduced UCP-1-mediated uncoupling and impaired thermogenic function observed in mTORC1-hyperactive animal models such as Lmna−/− mice. Interestingly and as opposed to rapamycin, UCP1 levels in BAT were further suppressed by 30 °C in Lmna−/− mice, and mTORC2 activity was further increased (Figure 5). The reasons for this are unclear.
Collectively, this study provides insight into how high EE may contribute to lipodystrophy and approaches that can suppress EE, such as rapamycin and higher housing temperature, can prolong survival of Lmna−/− mice. Our findings raise the possible role of maintaining more adiposity may be an effective therapeutic approach in a subset of laminopathies, including progeroid syndromes. These findings, coupled with our previous report (Ramos et al., 2012), also further demonstrate the potential utility of rapamycin and related rapalogs in treatments of a range of laminopathies.
EXPERIMENTAL PROCEDURES
Mouse Husbandry
Lmna+/− mice (129Sv-C57BL/6J genetic background) were crossed to generate Lmna+/+ and Lmna−/− mice (Sullivan et al., 1999). Three-week-old littermate mice from Lmna+/− × Lmna+/− crosses were weaned and genotyped. LmnaH222P/+ mice were crossed to generate Lmna+/+ and LmnaH222P/H222P mice (129SvJ-C57BL/6J genetic background) were described in a previous study (Arimura et al., 2005). All the animals had food and water ad libitum and were kept in 22 °C and 12:12-h light-dark cycles. All animal care and experimental procedures were approved by the Institutional Animal Care and Use Committee (IACUC) at the Buck Institute for Research on Aging.
Lifespan study on rapamycin injection
Beginning at 4 weeks of age, mice were injected intraperitoneally with 8 mg/kg BW rapamycin (LC Laboratories, Boston, MA) or vehicle every other day and maintained for the remainder of their lifespan according to the protocol by Ramos et al. (2012). Briefly, a stock solution of rapamycin (50 mg/ml) was prepared in 100% ethanol and stored at −20 °C. Rapamycin was then diluted in vehicle (5% polyethylene glycol and 5% Tween 80) before injection. The vehicle control consisted of the same volume of ethanol.
Lifespan study on 30 °C ambient temperature
Mice were randomly chosen to be housed at 22 °C or 30 °C starting at 4 weeks of age and maintained at these temperatures until the Lmna−/− mice reached the end of their lives.
Lifespan study on rapamycin chow
After genotyping, 2 month-old LmnaH222P/H222P mice were treated with a micro-encapsulated rapamycin diet (14 ppm) or control diet fed ad libitum (Harrison et al., 2009) until they died.
Body composition
Whole-body composition analysis was conducted weekly using quantitative nuclear magnetic resonance machine (EchoMRI-2012; Echo Medical Systems Houston, TX, USA).
Indirect calorimetry
Metabolism was measured in a Promethion metabolic cage system (Sable Systems International, Las Vegas, NV) equipped with GA-3 small mammal gas analyzers. Metabolic cages were used in while the mice were awake to simultaneously measure BW, EE, physical activity, and food intake. Four-week-old mice injected for 2 weeks with rapamycin were subjected to recording. Mice were housed individually in metabolic cages and acclimatized for 24 hours before the beginning of the recording and the analysis. Conditions were all the same for the 30 °C study except for the temperature in the metabolic cages. Data was subsequently analyzed using Sable System ExpeDATA software (v1.4.9).
Free fatty acid
Mice were fasted 16 hours after 2 weeks of treatment for submandibular bleeding. Serum was separated by centrifugation at 4 °C and stored at −80 °C. Free fatty acid (WAKO, Mountain View, CA) was determined by following the manufacturer’s instructions.
Body surface temperature
Body surface temperature was measured with an infrared temperature probe (Infrascan; La Crosse Technology) directed at the abdomen of all single-housed mice.
Tissue harvesting and Immunoblotting
After 2 weeks of treatment, subcutaneous fat (white adipose tissue, WAT) and brown adipose tissue (BAT) were harvested and immediately frozen in liquid nitrogen for western blotting analysis. Tissues were homogenized using the Omni TH homogenizer (Omni International, Kennesaw, GA) on ice in RIPA buffer (300 mM NaCl, 1.0% NP-40, 0.5% sodium deoxycholate, 0.1% SDS, 50 mM Tris [pH 8.0], protease inhibitor cocktail [Roche], and phosphatase inhibitor 2, 3 [Sigma]) and then centrifuged at 13,200 rpm for 10 min at 4°C. The supernatants were collected and protein concentrations were determined using the DC protein assay (Bio-Rad). Equal amounts of protein were resolved by SDS-PAGE (4–12% Bis-Tris gradient gel, Invitrogen), transferred to membranes, and incubated with protein-specific antibodies. The antibodies against the phosphorylated rsS6S240/244 (5364), AktS473 (4058), NDRG1T346 (5482), HSLS563 (4139), S6 (2217), Akt (4691), ATGL (2439), HSL (4107), FAS (3180), and GAPDH (2118) were purchased from Cell Signaling Technology (Danvers, MA). The antibodies against the phosphorylated SGKS422 (16745R) and NDRG1 (398291) were purchased from Santa Cruz Biotechnology (Santa Cruz, CA). SGK (54726) was purchased from GeneTex (Irvine, CA). UCP1 (ab23841) was purchased from Abcam (Boston, MA). Protein bands were revealed using the Amersham ECL detection system (GE Healthcare) and quantified by densitometry using ImageJ software (http://rsb.info.nih.gov/ij/).
Isolation and culture of preadipocyte
Mouse primary preadipocytes were isolated as previously described (Hausman et al., 2008). Briefly, the white adipose pads were removed from Lmna−/− mice and finely minced in DMEM/F12 medium. The minced tissues were incubated with HEPES:collagenase solution (collagenase type 1, Worthington, LS004196) for 45 min in a shaking water bath at 37 °C. When digestion is completed, additional DMEM/F12 medium was added and the whole solution was filtered through the 240 um mesh filter. The digested fat solution was centrifuged and resuspended with RBC lysis solution for 5 min to remove the blood cells. The preadipocytes were plated with plating media (DMEM/F12 + 10% FBS) at normal culture condition (37 °C, 5% CO2) for 3 days before the DMSO or rapamycin (100 nM) treatment. Cell lysates were collected for immunoblotting. For isolation of preadipocytes from BAT, similar strategy was used but treated with collagenase type A (Fasshauer et al., 2001) in DMEM media (collagenase type A, Worthington, LS004152) instead.
Statistical Analysis
All statistical analyses were conducted using GraphPad Prism 6 (GraphPad Software, La Jolla, CA). The survival curves were completed using the Kaplan-Meier curve. We used the log-rank (Mantel-Cox) test to perform the statistical analyses of the survival curves. All the other data are shown as mean ± standard error of the mean (SEM). The statistical significance of differences between two groups was determined using unpaired, two-tailed Student’s t test. *P < 0.05.
Supplementary Material
ACKNOWLEDGEMENTS
We would like to thank the vivarium staff at the Buck Institute for Research on Aging for their expert treatment and monitoring of the mice. This work was funded by the National Institute on Aging (R01 AG033373 and R01 AG024287) to B.K.K. C-Y.L. is support by a Glenn/AFAR Postdoctoral Fellowship. B.K.K. is an Ellison Medical Foundation Senior Scholar in Aging.
Footnotes
Publisher's Disclaimer: This is a PDF file of an unedited manuscript that has been accepted for publication. As a service to our customers we are providing this early version of the manuscript. The manuscript will undergo copyediting, typesetting, and review of the resulting proof before it is published in its final citable form. Please note that during the production process errors may be discovered which could affect the content, and all legal disclaimers that apply to the journal pertain.
References
- Albert V, and Hall MN (2015). mTOR signaling in cellular and organismal energetics. Curr Opin Cell Biol 33, 55–66. [DOI] [PubMed] [Google Scholar]
- Anisimov VN, Zabezhinski MA, Popovich IG, Piskunova TS, Semenchenko AV, Tyndyk ML, Yurova MN, Rosenfeld SV, and Blagosklonny MV (2011). Rapamycin increases lifespan and inhibits spontaneous tumorigenesis in inbred female mice. Cell Cycle 10, 4230–4236. [DOI] [PubMed] [Google Scholar]
- Arimura T, Helbling-Leclerc A, Massart C, Varnous S, Niel F, Lacene E, Fromes Y, Toussaint M, Mura AM, Keller DI, et al. (2005). Mouse model carrying H222P-Lmna mutation develops muscular dystrophy and dilated cardiomyopathy similar to human striated muscle laminopathies. Hum Mol Genet 14, 155–169. [DOI] [PubMed] [Google Scholar]
- Cai H, Dong LQ, and Liu F (2016). Recent Advances in Adipose mTOR Signaling and Function: Therapeutic Prospects. Trends Pharmacol Sci 37, 303–317. [DOI] [PMC free article] [PubMed] [Google Scholar]
- Chakrabarti P, English T, Shi J, Smas CM, and Kandror KV (2010). Mammalian target of rapamycin complex 1 suppresses lipolysis, stimulates lipogenesis, and promotes fat storage. Diabetes 59, 775–781. [DOI] [PMC free article] [PubMed] [Google Scholar]
- Chakrabarti P, Kim JY, Singh M, Shin YK, Kim J, Kumbrink J, Wu Y, Lee MJ, Kirsch KH, Fried SK, et al. (2013). Insulin inhibits lipolysis in adipocytes via the evolutionarily conserved mTORC1-Egr1-ATGL-mediated pathway. Molecular and cellular biology 33, 3659–3666. [DOI] [PMC free article] [PubMed] [Google Scholar]
- Choi JC, Muchir A, Wu W, Iwata S, Homma S, Morrow JP, and Worman HJ (2012). Temsirolimus activates autophagy and ameliorates cardiomyopathy caused by lamin A/C gene mutation. Sci Transl Med 4, 144ra102. [DOI] [PMC free article] [PubMed] [Google Scholar]
- Cutler DA, Sullivan T, Marcus-Samuels B, Stewart CL, and Reitman ML (2002). Characterization of adiposity and metabolism in Lmna-deficient mice. Biochem Biophys Res Commun 291, 522–527. [DOI] [PubMed] [Google Scholar]
- Fang Y, Westbrook R, Hill C, Boparai RK, Arum O, Spong A, Wang F, Javors MA, Chen J, Sun LY, et al. (2013). Duration of rapamycin treatment has differential effects on metabolism in mice. Cell Metab 17, 456–462. [DOI] [PMC free article] [PubMed] [Google Scholar]
- Fasshauer M, Klein J, Kriauciunas KM, Ueki K, Benito M, and Kahn CR (2001). Essential role of insulin receptor substrate 1 in differentiation of brown adipocytes. Molecular and cellular biology 21, 319–329. [DOI] [PMC free article] [PubMed] [Google Scholar]
- Fedorenko A, Lishko PV, and Kirichok Y (2012). Mechanism of fatty-acid-dependent UCP1 uncoupling in brown fat mitochondria. Cell 151, 400–413. [DOI] [PMC free article] [PubMed] [Google Scholar]
- Fischer KE, Gelfond JA, Soto VY, Han C, Someya S, Richardson A, and Austad SN (2015). Health Effects of Long-Term Rapamycin Treatment: The Impact on Mouse Health of Enteric Rapamycin Treatment from Four Months of Age throughout Life. PloS one 10, e0126644. [DOI] [PMC free article] [PubMed] [Google Scholar]
- Fong LG, Frost D, Meta M, Qiao X, Yang SH, Coffinier C, and Young SG (2006). A protein farnesyltransferase inhibitor ameliorates disease in a mouse model of progeria. Science 311, 1621–1623. [DOI] [PubMed] [Google Scholar]
- Fujishita T, Aoki K, Lane HA, Aoki M, and Taketo MM (2008). Inhibition of the mTORC1 pathway suppresses intestinal polyp formation and reduces mortality in ApcDelta716 mice. Proc Natl Acad Sci U S A 105, 13544–13549. [DOI] [PMC free article] [PubMed] [Google Scholar]
- Haemmerle G, Lass A, Zimmermann R, Gorkiewicz G, Meyer C, Rozman J, Heldmaier G, Maier R, Theussl C, Eder S, et al. (2006). Defective lipolysis and altered energy metabolism in mice lacking adipose triglyceride lipase. Science 312, 734–737. [DOI] [PubMed] [Google Scholar]
- Harrison DE, Strong R, Sharp ZD, Nelson JF, Astle CM, Flurkey K, Nadon NL, Wilkinson JE, Frenkel K, Carter CS, et al. (2009). Rapamycin fed late in life extends lifespan in genetically heterogeneous mice. Nature 460, 392–395. [DOI] [PMC free article] [PubMed] [Google Scholar]
- Hausman DB, Park HJ, and Hausman GJ (2008). Isolation and culture of preadipocytes from rodent white adipose tissue. Methods Mol Biol 456, 201–219. [DOI] [PubMed] [Google Scholar]
- Jahn D, Schramm S, Schnolzer M, Heilmann CJ, de Koster CG, Schutz W, Benavente R, and Alsheimer M (2012). A truncated lamin A in the Lmna −/− mouse line: implications for the understanding of laminopathies. Nucleus 3, 463–474. [DOI] [PMC free article] [PubMed] [Google Scholar]
- Johnson SC, Rabinovitch PS, and Kaeberlein M (2013a). mTOR is a key modulator of ageing and age-related disease. Nature 493, 338–345. [DOI] [PMC free article] [PubMed] [Google Scholar]
- Johnson SC, Yanos ME, Kayser EB, Quintana A, Sangesland M, Castanza A, Uhde L, Hui J, Wall VZ, Gagnidze A, et al. (2013b). mTOR Inhibition Alleviates Mitochondrial Disease in a Mouse Model of Leigh Syndrome. Science. [DOI] [PMC free article] [PubMed] [Google Scholar]
- Julien LA, Carriere A, Moreau J, and Roux PP (2010). mTORC1-activated S6K1 phosphorylates Rictor on threonine 1135 and regulates mTORC2 signaling. Molecular and cellular biology 30, 908–921. [DOI] [PMC free article] [PubMed] [Google Scholar]
- Kumar A, Lawrence JC Jr., Jung DY, Ko HJ, Keller SR, Kim JK, Magnuson MA, and Harris TE (2010). Fat cell-specific ablation of rictor in mice impairs insulin-regulated fat cell and whole-body glucose and lipid metabolism. Diabetes 59, 1397–1406. [DOI] [PMC free article] [PubMed] [Google Scholar]
- Lamming DW, and Sabatini DM (2013). A Central role for mTOR in lipid homeostasis. Cell Metab 18, 465–469. [DOI] [PMC free article] [PubMed] [Google Scholar]
- Lamming DW, Ye L, Katajisto P, Goncalves MD, Saitoh M, Stevens DM, Davis JG, Salmon AB, Richardson A, Ahima RS, et al. (2012). Rapamycin-induced insulin resistance is mediated by mTORC2 loss and uncoupled from longevity. Science 335, 1638–1643. [DOI] [PMC free article] [PubMed] [Google Scholar]
- Laplante M, and Sabatini DM (2012). mTOR signaling in growth control and disease. Cell 149, 274–293. [DOI] [PMC free article] [PubMed] [Google Scholar]
- Liu B, Ghosh S, Yang X, Zheng H, Liu X, Wang Z, Jin G, Zheng B, Kennedy BK, Suh Y, et al. (2012). Resveratrol rescues SIRT1-dependent adult stem cell decline and alleviates progeroid features in laminopathy-based progeria. Cell Metab 16, 738–750. [DOI] [PubMed] [Google Scholar]
- Liu Y, Diaz V, Fernandez E, Strong R, Ye L, Baur JA, Lamming DW, Richardson A, and Salmon AB (2014). Rapamycin-induced metabolic defects are reversible in both lean and obese mice. Aging (Albany NY) 6, 742–754. [DOI] [PMC free article] [PubMed] [Google Scholar]
- Lopez-Mejia IC, de Toledo M, Chavey C, Lapasset L, Cavelier P, Lopez-Herrera C, Chebli K, Fort P, Beranger G, Fajas L, et al. (2014). Antagonistic functions of LMNA isoforms in energy expenditure and lifespan. EMBO Rep 15, 529–539. [DOI] [PMC free article] [PubMed] [Google Scholar]
- Marino G, Ugalde AP, Fernandez AF, Osorio FG, Fueyo A, Freije JM, and Lopez-Otin C (2010). Insulin-like growth factor 1 treatment extends longevity in a mouse model of human premature aging by restoring somatotroph axis function. Proc Natl Acad Sci U S A 107, 16268–16273. [DOI] [PMC free article] [PubMed] [Google Scholar]
- Miller RA, Harrison DE, Astle CM, Fernandez E, Flurkey K, Han M, Javors MA, Li X, Nadon NL, Nelson JF, et al. (2014). Rapamycin-mediated lifespan increase in mice is dose and sex dependent and metabolically distinct from dietary restriction. Aging cell 13, 468–477. [DOI] [PMC free article] [PubMed] [Google Scholar]
- Neff F, Flores-Dominguez D, Ryan DP, Horsch M, Schroder S, Adler T, Afonso LC, Aguilar-Pimentel JA, Becker L, Garrett L, et al. (2013). Rapamycin extends murine lifespan but has limited effects on aging. J Clin Invest 123, 3272–3291. [DOI] [PMC free article] [PubMed] [Google Scholar]
- Nikolova V, Leimena C, McMahon AC, Tan JC, Chandar S, Jogia D, Kesteven SH, Michalicek J, Otway R, Verheyen F, et al. (2004). Defects in nuclear structure and function promote dilated cardiomyopathy in lamin A/C-deficient mice. J Clin Invest 113, 357–369. [DOI] [PMC free article] [PubMed] [Google Scholar]
- Osorio FG, Navarro CL, Cadinanos J, Lopez-Mejia IC, Quiros PM, Bartoli C, Rivera J, Tazi J, Guzman G, Varela I, et al. (2011). Splicing-directed therapy in a new mouse model of human accelerated aging. Sci Transl Med 3, 106ra107. [DOI] [PubMed] [Google Scholar]
- Peinado JR, Quiros PM, Pulido MR, Marino G, Martinez-Chantar ML, Vazquez-Martinez R, Freije JM, Lopez-Otin C, and Malagon MM (2011). Proteomic profiling of adipose tissue from Zmpste24−/− mice, a model of lipodystrophy and premature aging, reveals major changes in mitochondrial function and vimentin processing. Mol Cell Proteomics 10, M111 008094. [DOI] [PMC free article] [PubMed] [Google Scholar]
- Polak P, Cybulski N, Feige JN, Auwerx J, Ruegg MA, and Hall MN (2008). Adipose-specific knockout of raptor results in lean mice with enhanced mitochondrial respiration. Cell Metab 8, 399–410. [DOI] [PubMed] [Google Scholar]
- Ramos FJ, Chen SC, Garelick MG, Dai DF, Liao CY, Schreiber KH, MacKay VL, An EH, Strong R, Ladiges WC, et al. (2012). Rapamycin reverses elevated mTORC1 signaling in lamin A/C-deficient mice, rescues cardiac and skeletal muscle function, and extends survival. Sci Transl Med 4, 144ra103. [DOI] [PMC free article] [PubMed] [Google Scholar]
- Sarbassov DD, Ali SM, Sengupta S, Sheen JH, Hsu PP, Bagley AF, Markhard AL, and Sabatini DM (2006). Prolonged rapamycin treatment inhibits mTORC2 assembly and Akt/PKB. Mol Cell 22, 159–168. [DOI] [PubMed] [Google Scholar]
- Schreiber KH, and Kennedy BK (2013). When lamins go bad: nuclear structure and disease. Cell 152, 1365–1375. [DOI] [PMC free article] [PubMed] [Google Scholar]
- Schreiber KH, Ortiz D, Academia EC, Anies AC, Liao CY, and Kennedy BK (2015). Rapamycin-mediated mTORC2 inhibition is determined by the relative expression of FK506-binding proteins. Aging cell 14, 265–273. [DOI] [PMC free article] [PubMed] [Google Scholar]
- Schweiger M, Schreiber R, Haemmerle G, Lass A, Fledelius C, Jacobsen P, Tornqvist H, Zechner R, and Zimmermann R (2006). Adipose triglyceride lipase and hormonesensitive lipase are the major enzymes in adipose tissue triacylglycerol catabolism. J Biol Chem 281, 40236–40241. [DOI] [PubMed] [Google Scholar]
- Sullivan T, Escalante-Alcalde D, Bhatt H, Anver M, Bhat N, Nagashima K, Stewart CL, and Burke B (1999). Loss of A-type lamin expression compromises nuclear envelope integrity leading to muscular dystrophy. J Cell Biol 147, 913–920. [DOI] [PMC free article] [PubMed] [Google Scholar]
- Ukropec J, Anunciado RP, Ravussin Y, Hulver MW, and Kozak LP (2006). UCP1-independent thermogenesis in white adipose tissue of cold-acclimated Ucp1−/− mice. J Biol Chem 281, 31894–31908. [DOI] [PubMed] [Google Scholar]
- Worman HJ, and Bonne G (2007). “Laminopathies”: a wide spectrum of human diseases. Exp Cell Res 313, 2121–2133. [DOI] [PMC free article] [PubMed] [Google Scholar]
- Xiang X, Lan H, Tang H, Yuan F, Xu Y, Zhao J, Li Y, and Zhang W (2015). Tuberous sclerosis complex 1-mechanistic target of rapamycin complex 1 signaling determines brown-to-white adipocyte phenotypic switch. Diabetes 64, 519–528. [DOI] [PubMed] [Google Scholar]
- Zhang H, Kieckhaefer JE, and Cao K (2013a). Mouse models of laminopathies. Aging Cell 12, 2–10. [DOI] [PubMed] [Google Scholar]
- Zhang Y, Bokov A, Gelfond J, Soto V, Ikeno Y, Hubbard G, Diaz V, Sloane L, Maslin K, Treaster S , et al. (2013b). Rapamycin Extends Life and Health in C57BL/6 Mice. J Gerontol A Biol Sci Med Sci. [DOI] [PMC free article] [PubMed] [Google Scholar]
Associated Data
This section collects any data citations, data availability statements, or supplementary materials included in this article.