

Abstract
Objectives
Pain sensitization, an important osteoarthritis (OA) pain mechanism, has not been substantially investigated in persons with hand OA. It is unknown how peripheral and central sensitization is related to self-reported hand pain.
Methods
Persons with verified hand OA in the Nor-Hand study underwent quantitative sensory testing of pressure pain Thresholds (PPT) locally (painful and non-painful finger joint) and remotely (wrist, trapezius and tibialis anterior muscle), and temporal summation (TS), a manifestation of central sensitization. We examined cross-sectional associations of PPT tertiles and TS to hand pain using the Numeric Rating Scale (NRS, range: 0–10) and AUSCAN pain subscale (range: 0–20). Linear regression models were adjusted for demographics, psychosocial factors and radiographic severity.
Results
We included 282 participants (88% female) with median (interquartile range) age of 61 (57–66) years. Persons with the lowest PPTs in their finger joints and most remote locations had higher pain on NRS compared to those with the highest PPTs (adjusted beta values (95% CI) ranging from 0.6 (0.0–1.2) to 0.9 (0.3–1.5)). The 118 (42%) participants with TS reported higher NRS pain values compared to those without TS (mean (SD) 4.1 (2.4) vs. 3.1 (1.7), adjusted beta (95% CI) 0.6 (0.2–1.1)). Neither PPTs nor TS were associated with AUSCAN pain.
Conclusion
Central sensitization was common in persons with hand OA. Lower local and widespread PPTs and TS were associated with higher hand pain intensity, even after adjustments for demographics, psychosocial factors and radiographic severity. Sensitization may therefore represent a possible treatment target.
Keywords: Hand Osteoarthritis, Patient Perspective, Epidemiology
Introduction
Pain is the main reason why persons with osteoarthritis (OA) seek medical help[1], because of its substantial burden and impact on quality of life[2]. With increasing prevalence due to an ageing population and obesity, we anticipate an increase in disability and health care costs related to OA pain. Hand joints are frequently affected by OA. In the Framingham study, 7% of men and 14% of women between 40 and 84 years had symptomatic hand OA[3]. Currently, no cure or disease modifying drug exists for OA. Treatment is focusing on symptomatic management, often with limited effect.
Traditionally, pain in OA has been considered nociceptive and related to local tissue damage. Several hand OA studies have found associations between imaging features and pain in the same joint[4–6]. However, the associations between total amount of hand OA pathology and overall hand pain are weak or non-existing[5–7]. This reflects the fact that pain experience is a complex subjective phenomenon influenced by a number of biological, psychological and social factors[8].
Recent reviews of pain etiology in OA have concluded that neurophysiological mechanisms of peripheral and central sensitization are important contributors to OA pain[9, 10]. Peripheral sensitization is a state of nociceptive hypersensitivity related to lowered excitation threshold or hyperresponsiveness of nociceptors to noxious stimuli (hyperalgesia) and to non-noxious stimuli (allodynia)[11]. Central sensitization refers to an augmentation of neural signaling in the spinal cord and brain[12], which can manifest as widespread hyperalgesia and allodynia. In patients with chronic OA pain, persistent tissue damage and inflammation in the joint is believed to induce mechanisms of peripheral sensitization, and consequently causing central sensitization.
Animal studies have demonstrated local and widespread hyperalgesia in OA models compared to healthy models[13]. Similarly, persons with knee OA are more sensitized that healthy controls, and sensitization is strongly associated with knee pain severity[14]. Sensitization is a possible new treatment target and the use of peripheral and centrally acting agents may lead to better management of OA pain[15]. The knowledge of pain sensitization in OA is mainly derived from studies of knee and hip OA[9]. A few studies with small sample sizes have suggested that peripheral and central sensitization is more common in hand OA than in healthy controls[16–18]. However, whether sensitization is related to hand pain severity in those with hand OA has not been previously examined in a larger patient sample.
The primary aim of this study was to examine the prevalence of central and peripheral sensitization in a large cohort of patients with hand OA using quantitative sensory testing (QST), and the relationship between sensitization and hand pain severity.
Method
Study design, setting and participants
The Nor-Hand study is an observational hospital-based cohort of persons with hand OA. Data from the baseline examinations in 2016–17 were used in these analyses. Persons aged 40 to 70 years with OA of at least one interphalangeal or thumb base joint by clinical examination and/or ultrasound, were eligible for inclusion. Participants were excluded if they had rheumatoid arthritis, spondyloarthritis, psoriatic arthritis, psoriasis or hemochromatosis. A full protocol description, including detailed inclusion and exclusion criteria, has been published[19]. The study is approved by the Norwegian Regional Committee for Medical and Health Research Ethics and is registered at https://clinicaltrials.gov (Ref. no: NCT03083548). All participants gave written consents after receiving oral and written information about the study.
Data collection
Hand pain severity
Self-reported hand pain was assessed with two questionnaires; the Numeric Rating Scale (NRS) of hand pain severity the last 24 hours (0 representing “no pain” and 10 “worst pain imaginable”) and the pain subscale of the Australian Canadian (AUSCAN) Hand Index (range: 0–20) where pain during rest (one item) and different activities (four items) are quantified[20].
Quantitative sensory testing (QST)
Two medical students conducted the QST testing using the same predefined protocol. They received training before the testing of participants started and they had the written protocol available during the testing to ensure fidelity.
Pressure pain threshold (PPT) tested at a diseased site assesses local pain sensitivity as a surrogate for peripheral and/or central sensitization. When tested at a distant (i.e., extra-segmental) non-painful site, it assesses widespread hypersensitivity, a marker of central sensitization[21]. First, the most painful and a non-painful interphalangeal joint was tested with the participants’ hand resting on a table. Only two finger joints were tested to reduce participant burden; we consider that one painful and one non-painful joint is sufficient to represent local sensitivity. If several joints were non-painful, one was chosen randomly. An algometer (FPIX25, 1cm2 flat rubber probe) was placed perpendicular on the dorsal side of the joint and pressure was increased with 0.5 kilogram/second, guided by a metronome. The PPT value was recorded at the point where the pressure first changed to becoming slightly painful. PPTs were also obtained at dorsal aspect of the left distal radioulnar joint and the mid-portions of trapezius and tibialis anterior muscle. The distant (i.e., extra-segmental) sites were chosen based on what has been done in previous studies of knee OA[14, 22, 23]. The tests were repeated three times at each site with 30 seconds between the assessments. The mean value of the three assessments for each anatomical site was used in the analyses.
Mechanical temporal summation (TS), the augmentation of pain response due to repetitive painful stimuli, is a physiological phenomenon reflecting central integration of nociceptive input[24]. When the response is facilitated it is believed to reflect central sensitization[21]. Punctuate probes with increasing weight of 8, 16, 32, 64, 128, 256 and 512 millinewton (mN) were applied consecutively at the participants’ left distal radioulnar joint having his/her eyes closed. The probe that first evoked pain of at least 4 on a 0–10 NRS was chosen for the test. If none of the probes evoked pain, the probe with 512mN was used. The radioulnar joint was then tapped ten times once per second (1 Hz) with the punctate probe. Participants gave an NRS pain rating of the first, fifth and tenth tap. TS-delta was calculated by subtracting the first pain rating from the peak pain rating of the fifth or tenth tap. A similar method has been used in other studies of knee OA[14, 25]. To categorize subjects into presence/absence of TS, we calculated the smallest detectable change (SDC) of TS-delta. SDC is the smallest value that is larger than what can be attributed to random variation or measurement error between two dependent measurements (e.g. within a person). We calculated SDC using the standard deviation (SD) of the difference between TS-delta scores of repeated testing of nine subjects by two examiners (SD(TS-delta-examiner 2 minus TS-delta-examiner 1)), using the following formula; ± 1.96 x SD(TS-delta-examiner 2 minus TS-delta-examiner 1)/√2. Description of the formula and its assumptions has been discussed elsewhere[26]. We defined subjects as having TS if TS-delta was ≥2, which was above the calculated SDC of 1.28 points.
Nine subjects were examined by both examiners the same afternoon. For PPT, the intraclass correlation coefficient (ICC) was good (0.61) for the painful joint and ranged from poor (0.14) to moderate (0.60) for the other joints(27) (Supplemental Table). A good (0.72) inter-observer ICC was found for TS-delta, whereas the kappa for absence/presence TS was fair (0.36) (Supplemental Table S1).
Potential Confounders
We collected information about potential confounders like age, sex, body mass index, regular use of analgesics (oral or topical non-steroidal anti-inflammatory drugs (NSAIDS), acetaminophen, opioid and opioid-like drugs) and psychosocial factors, including highest degree of completed education (1–7 scale), sleep disturbance (0–4 scale from “no disturbance” to “serious sleep disturbances, remaining awake or sleep is almost impossible despite use of hypnotics”), the Pain Catastrophizing Scale (PCS)[28] and the Hospital Anxiety and Depression Scale (HADS)[29].
Posteroanterior radiographs of bilateral hands were obtained. In total 32 joints, including the bilateral distal and proximal interphalangeal, metacarpophalangeal, first carpometacarpal and scaphotrapeziotrapezoidal joints were scored by one experience reader (IKH) for OA severity on a 0–4 scale using a modified Kellgren Lawrence (KL) scale[3]. We calculated a radiographic OA sum score for each participant (range 0–128). The reader repeated the evaluation of 20 random participants after approximately two weeks (mean (SD) of 16 (4) days), and the intra-reader reliability was excellent (ICC: 0.99, weighted kappa: 0.92).
Analytic approach
We categorized PPT into sex-specific tertiles[14, 30] to avoid assumption of a linear relationships with pain and because there are known sex differences in pain sensitivity[31], which was also present in our study population. We examined the relationship between PPT and presence of TS to NRS pain severity and AUSCAN pain subscale using linear regression, adjusting for the potential confounders listed above. We repeated the analyses using PPTs and TS-delta as continuous variables. Finally, we conducted sensitivity analyses of AUSCAN pain items by separating the “resting pain” question (0–4 scale) from the sum score of the four “activity dependent pain” questions (0–16 scale). Missing values for sleep covariate (n=1), education covariate (n=1) and pain catastrophizing covariate (n=1) received estimated mean scores based on simple imputations. Stata/IC 14.0 was used for all statistical analyzes, and p-values<0.05 were considered statistically significant.
Results
Patient characteristics and quantitative sensory testing results
Out of 431 screened persons, 300 were included in the Nor-Hand cohort. Of those, 282 were eligible for these analyses (Figure 1). A subgroup of 76 participants (26%) responded late (>14 days after clinical examination) to the pain questionnaires. Pain severity of NRS and AUSCAN pain was reported to be above patient acceptable symptom state (PASS) in 33% and 52% of our study population, respectively[32, 33]. Few participants used at least one oral and/or topical analgesics (41/282); acetaminophen (11/282), NSAIDS (34/282) and opioid or opioid-like (5/282) on a daily basis (Table 1). Use of antiepileptics or antidepressants that are approved for pain relieving purposes (gabapentin or pregabalin; n=5/282, amitriptyline n=9/282, duloxetine n=0/282) was uncommon. The radiographic OA severity ranged from mild to severe. Our study population had anxiety, depression and pain catastrophizing scores in the lower halves of the respective scales (Table 1).
Figure 1. Flowchart of the Nor-Hand cohort and the participants eligible for this study.
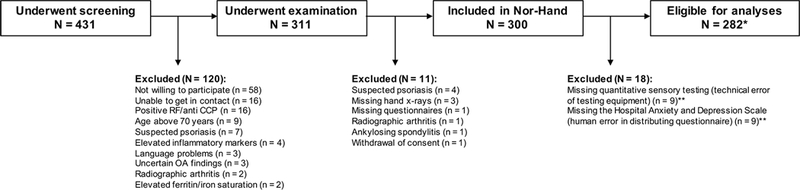
N; number RF; rheumatoid factor CCP; cyclic citrullinated peptides OA; osteoarthritis *One participant had missing NRS pain severity and was excluded from analyses with NRS, whereas another had missing PPT of a non-painful finger joint. These were excluded from corresponding analyses. **Participants with missing Hospital Anxiety and Depression Scale (HADS) were excluded because HADS was an important confounder.
Table 1.
Baseline demographics and characteristics of the study population (n=282)
| Age, median (IQR) (years) | 61 (57–66) |
| Women, n (%) | 248 (88) |
| Body mass index, mean (SD) (kg/m2) | 26.3 (4.7) |
| Education level, n (%) | |
| Primary/upper secondary school | 116 (41) |
| >1year college/university | 165 (59) |
| Fulfil ACR criteria, n (%) | 271 (93) |
| Duration of symptoms, median (IQR) (years) | 6 (3, 13) |
| Kellgren Lawrence sum score [0–128]1, mean (SD) | 30 (19) |
| Number of joints with Kellgren Lawrence score ≥2 [0–32]1, median (IQR) | 9 (4–14) |
| Using analgesics daily, n (%) | 41 (15) |
| Hospital Anxiety and Depression Scale | 6 (3–10) |
| [0–42], median (IQR) | |
| Pain Catastrophizing Scale [0–52], | 9 (5–15) |
| median (IQR) | |
| Sleep quality, n (%) | |
| Normal | 70 (25) |
| Mild impairment | 97 (34) |
| Moderate to severe impairment | 115 (41) |
| Self-reported hand pain, mean (SD) | |
| NRS pain 24 hours2 [0–10] | 3.7 (2.3) |
| AUSCAN pain subscale [0–20] | 8.2 (4.1) |
| Pressure Pain Threshold, mean (SD) (kg/cm2) | |
| Painful finger joint | 3.9 (1.9) |
| Non-painful finger joint2 | 5.0 (2.1) |
| Left wrist | 4.5 (2.1) |
| Tibialis anterior muscle | 5.5 (2.5) |
| Trapezius muscle | 4.4 (2.1) |
| Temporal Summation (TS) | |
| Presence of TS, n (%) | 118 (42) |
| TS-delta, median (IQR) | 1 (0–2) |
IQR; interquartile range SD; standard deviation ACR; American College of Rheumatology NRS; numeric rating scale AUSCAN; Australian Canadian hand osteoarthritis index Brackets present possible ranges.
Including the bilateral distal and proximal interphalangeal, metacarpophalangeal, first carpometacarpal and scaphotrapeziotrapezoidal joints.
Missing information from one subject, n = 281.
The participants had lower PPTs at the wrist and finger joints than at the more distant locations, and lower PPTs at the painful finger joint than at the non-painful finger joint (Table 1). The probe with 512mN was used in the majority of the participants when testing TS (n=264, 94%), of whom 109 reported 0 on the NRS for the first stimulus. Median TS-delta was 1 (interquartile range (IQR) 0, 2), and 118 (42%) had presence of TS (TS-delta≥2).
Pressure pain thresholds at finger joints and self-reported hand pain severity
We found a consistent trend of increasing self-reported pain with decreasing PPTs at the painful and non-painful finger joint. Participants in the lowest PPT tertiles reported on average 1.0 point (painful finger joint) and 1.2 points (non-painful finger joint) higher pain on NRS (0–10 scale) and 1.0 point (painful finger joint) and 1.4 points (non-painful finger joint) higher pain on AUSCAN pain (0–20 scale) than those in the highest PPT tertiles. In adjusted analyses an independent association between being in the lowest PPT tertiles and pain severity was found for NRS only (adjusted beta (95% CI) painful finger joint 0.7 (0.1, 1.3) and non-painful finger joint 0.9 (0.3, 1.5)) (Table 2). The effect of the relationship was stronger when we excluded the 76 participants who responded late on the NRS pain questionnaire (adjusted beta (95% CI) painful finger joint 0.9 (0.2, 1.6) and non-painful finger joint 1.1 (0.5, 1.8)). Participants in the middle PPT tertiles did not report higher pain severity than those in the highest tertiles (Table 2).
Table 2.
Relation of pressure pain thresholds of the finger joints to hand pain severity
| NRS pain severity | AUSCAN pain severity | ||||||
|---|---|---|---|---|---|---|---|
| PPT tertile | Highest | Middle | Lowest | Highest | Middle | Lowest | |
| Painful finger joint | Mean (SD) | 3.4 (2.1) | 3.5 (2.2) | 4.4 (2.4) | 7.8 (4.0) | 8.0 (4.2) | 8.8 (4.1) |
| Crude beta (95% CI) | 0.0 (Ref.) | 0.1 (−0.6, 0.7) | 1.0 (0.3, 1.6) | 0.0 (Ref.) | 0.3 (−0.9, 1.4) | 1.0 (−0.1, 2.2) | |
| Adjusted* beta (95% CI) | 0.0 (Ref.) | 0.3 (−0.3, 0.9) | 0.7 (0.1, 1.3) | 0.0 (Ref.) | 0.5 (−0.5, 1.6) | 0.4 (−0.7, 1.5) | |
| Non-painful finger joint | Mean (SD) | 3.2 (2.1) | 3.7 (2.2) | 4.4 (2.3) | 7.7 (4.1) | 8.0 (4.0) | 9.1 (4.1) |
| Crude beta (95% CI) | 0.0 (Ref.) | 0.5 (−0.2, 1.1) | 1.3 (0.6, 1.9) | 0.0 (Ref.) | 0.3 (−0.8, 1.5) | 1.4 (0.3, 2.6) | |
| Adjusted* beta (95% CI) | 0.0 (Ref.) | 0.4 (−0.2, 0.9) | 0.9 (0.3, 1.5) | 0.0 (Ref.) | 0.2 (−0.9, 1.2) | 0.8 (−0.3, 1.8) | |
OA; osteoarthritis NRS; numeric rating scale (0–10) AUSCAN; Australian Canadian hand osteoarthritis index (scale 0–20) PPT; pressure pain threshold SD; standard deviation CI; confidence interval Ref.; reference group.
Adjusted for age, sex, body mass index, use of analgesics, Kellgren Lawrence sum score, Hospital Anxiety Depression Scale, Pain Catastrophizing Scale, education and sleep.
When repeating the analyses using PPTs at the finger joints as a continuous variables, we found significant inverse associations with pain for NRS (adjusted beta (95% CI) painful finger joint −0.2 (−0.3, −0.1) and non-painful finger joint −0.2 (−0.3, −0.1)) but not for AUSCAN pain (adjusted beta (95% CI) painful finger joint −0.2 (−0.4, 0.1) and non-painful finger joint −0.1 (−0.3, 0.1)).
In sensitivity analyses we found that being in the lowest PPT tertiles was associated with higher response to the first question of the AUSCAN pain questionnaire assessing “resting pain” (0–4 scale, adjusted beta (95% CI) painful finger joint 0.3 (0.0, 0.5) and non-painful finger joint 0.3 (0.0, 0.5)), whereas no associations were found for the four “activity-dependent pain” items (0–16 scale, adjusted beta (95% CI) painful-finger joint 0.2 (−0.8, 1.1) and non-painful finger joint 0.5 (−0.4, 1.4)).
Pressure pain thresholds at distant sites and self-reported hand pain severity
Participants with lower PPTs at distant body sites reported higher hand pain severity on NRS and AUSCAN pain. Participants in the lowest PPT tertiles reported between 0.9 (tibialis anterior muscle) to 1.6 (trapezius muscle) points higher pain on NRS than those in the highest PPT tertiles (Table 3). The adjusted associations with NRS were statistically significant for the wrist and trapezius muscle. Associations with AUSCAN pain were weaker and did not reach statistical significance in adjusted analyses (Table 3). We found a consistent trend of a stronger relationship (0.1–0.3 increase in adjusted beta values) between PPTs and pain severity when excluding those who responded late to the pain questionnaires (data not shown).
Table 3.
Relation of pressure pain thresholds at distant non-painful sites to hand pain severity
| NRS pain severity | AUSCAN pain severity | ||||||
|---|---|---|---|---|---|---|---|
| PPT tertile | Highest | Middle | Lowest | Highest | Middle | Lowest | |
| Wrist | Mean (SD) | 3.2 (2.2) | 3.6 (2.1) | 4.5 (2.3) | 7.6 (4.3) | 8.1 (3.7) | 9.0 (4.2) |
| Crude beta (95% CI) | 0.0 (Ref.) | 0.5 (−0.2, 1.1) | 1.3 (0.7, 2.0) | 0.0 (Ref.) | 0.5 (−0.6, 1.7) | 1.5 (0.3, 2.6) | |
| Adjusted* beta (95% CI) | 0.0 (Ref.) | 0.4 (−0.1, 2.0) | 0.8 (0.2, 1.3) | 0.0 (Ref.) | 0.4 (−0.7, 1.4) | 0.6 (−0.6, 1.6) | |
| Trapezium | Mean (SD) | 3.0 (2.0) | 3.6 (2.1) | 4.6 (2.4) | 7.3 (3.9) | 8.1 (3.9) | 9.2 (4.3) |
| Crude beta (95% CI) | 0.0 (Ref.) | 0.6 (−0.1, 1.2) | 1.6 (0.9, 2.2) | 0.0 (Ref.) | 0.8 (−0.4, 1.9) | 1.9 (0.8, 3.1) | |
| Adjusted* beta (95% CI) | 0.0 (Ref.) | 0.2 (−0.4, 0.8) | 0.6 (0.0, 1.2) | 0.0 (Ref.) | 0.3 (−0.8, 1.3) | 0.5 (−0.7, 1.6) | |
| Tibialis Anterior | Mean (SD) | 3.4 (2.3) | 3.5 (2.2) | 4.4 (2.2) | 8.0 (4.2) | 8.0 (4.0) | 8.6 (4.2) |
| Crude beta (95% CI) | 0.0 (Ref.) | 0.1 (−0.6, 0.7) | 0.9 (0.2, 1.5) | 0.0 (Ref.) | 0.1 (−1.1, 1.3) | 0.6 (−0.6, 1.8) | |
| Adjusted* beta (95% CI) | 0.0 (Ref.) | −0.2 (−0.7, 0.4) | 0.3 (−0.3, 0.9) | 0.0 (Ref.) | −0.4 (−1.5, 0.6) | −0.4 (−1.5, 0.7) | |
NRS; numeric rating scale (0–10) AUSCAN; Australian Canadian hand osteoarthritis index (scale 0–20) PPT; pressure pain threshold SD; standard deviation CI; confidence interval Ref.; reference group.
Adjusted for age, sex, body mass index, use of analgesics, Kellgren Lawrence sum score, Hospital Anxiety Depression Scale, Pain Catastrophizing Scale, education and sleep. NRS scale 0–10, AUSCAN pain scale 0–20.
Absolute PPT analyzed as a continuous variable was significantly associated with NRS in adjusted analyses of the wrist (adjusted beta −0.2, 95% CI −0.3, 0.0) and trapezius muscle (adjusted beta −0.1, 95% CI −0.3, 0.0), while there were no significant associations with AUSCAN pain (data not shown). Sensitivity analyses of AUSCAN “resting pain” and “activity-dependent pain” separately did not alter any results (data not shown).
Temporal summation and self-reported hand pain severity
Participants with TS reported on average 1.0 points higher pain on NRS (0–10 scale) and 1.1 points more on AUSCAN pain (0–20 scale) than those without TS (Table 4). In adjusted analyses an association between TS and pain severity was found for NRS only (adjusted beta 0.6, 95% CI 0.2, 1.1) (Table 4). When excluding those who responded late to the questionnaires the results remained unchanged for NRS and became weaker for AUSCAN pain (adjusted beta (95% CI) 0.6 (0.1, 1.2) and 0.1 (−0.9, 1.2), respectively).
Table 4.
Relation of presence of temporal summation to hand pain severity
| NRS pain severity | AUSCAN pain severity | |||
|---|---|---|---|---|
| Temporal Summation | No | Yes | No | Yes |
| Mean (SD) | 3.1 (1.7) | 4.1 (2.4) | 7.4 (3.5) | 8.5 (4.3) |
| Crude beta (95% CI) | 0.0 (Ref.) | 1.0 (0.5, 1.5) | 0.0 (Ref.) | 1.0 (0.0, 2.0) |
| Adjusted* beta (95% CI) | 0.0 (Ref.) | 0.6 (0.2, 1.1) | 0.0 (Ref.) | 0.3 (−0.6, 1.2) |
NRS; numeric rating scale (0–10) AUSCAN; Australian Canadian hand osteoarthritis index (scale 0–20) SD; standard deviation CI; confidence interval Ref.; reference group.
Adjusted for age, sex, body mass index, use of analgesics, Kellgren Lawrence sum score, Hospital Anxiety Depression Scale, Pain Catastrophizing Scale, education and sleep.
Higher increase of pain during the TS examination (TS-delta) was positively associated with higher NRS pain (adjusted beta 0.2, 95% CI 0.0, 0.3), whereas no association was found for AUSCAN pain (adjusted beta 0.1, 95% CI −0.2, 0.4). Sensitivity analyses of the “resting pain”-item of AUSCAN pain did not demonstrate stronger associations with TS or TS-delta than the activity-related pain items (data not shown).
Discussion
The present study is the first to describe peripheral and central sensitization as independent contributors to pain in persons with hand OA, regardless of psychological factors and radiographic severity. Both local and widespread hypersensitivity reflected by low PPTs were related to higher NRS hand pain severity. More than 40% of our participants had central sensitization as indicated by presence of TS, which was associated with higher NRS pain severity. Our study adds important knowledge to the complex nature of hand OA pain and urge a broader clinical approach where sensitization-related pain mechanisms should be considered.
Only five previous hand OA studies have examined pain sensitivity by QST and its relationship with self-reported hand pain[16, 18, 34–36]. Farrel et al. demonstrated local hyperalgesia of pain stimuli over the carpometacarpal joints compared to a non-painful distant site in persons with symptomatic hand OA (n=38)[34]. Local hyperalgesia, as well as distant hyperalgesia of non-painful sites suggestive of central sensitization, was subsequently reported in three studies, but neither found associations with pain severity[16, 18, 35]. Lack of association to pain in these studies may be due to their small study samples (only 13, 16 and 32 hand OA cases, respectively). In a recent randomized controlled trial (RCT) of analgesics in hand OA patients (n=65), lower PPTs at the finger joints and wrist were associated with higher AUSCAN pain scores after adjusting for age, with borderline statistical significance (p=0.06)(36). Our study is the largest to date and was able to demonstrate statistically significant associations of low PPTs at local and distant sites with higher self-reported pain of NRS even after adjusting for potential confounders.
Our study found presence of TS in as many as 42% of the participants, which is in line with a previous knee OA study[14]. To our knowledge, no previous study has tested the phenomenon of TS in hand OA patients, although enhanced TS is a known manifestation of central sensitization in chronic pain conditions(21). The result of QST assessment of TS includes both amplification of signals in the dorsal horn neurons as well as the individual’s sum of inhibitory modulations. In contrast, the phenomenon of wind-up in animals, which is thought to be a parallel process as TS in humans, is considered as a reflection of the ascending pathways. Nonetheless, alterations in ascending and/or descending inhibitory pathways can ultimately lead to an increase in pain perception. In line with our results, functional magnetic resonance imaging has shown increased activity in brain regions known to implicate central sensitization in persons with hand OA, but not in pain-free healthy controls[17]. In addition, pregabalin was recently found superior to placebo in reducing pain in hand OA[36]. These results suggest that medication targeting central pain processing can have an effect in hand OA.
We consider the magnitude of the difference in self-reported pain between those with the lowest and highest PPTs locally and distant, and between those with and without TS as clinically relevant. The differences on the NRS pain questionnaire was equal to the minimal clinically important difference (MCID) of one unit on the NRS 0–10 scale[37]. This acknowledges the relevance of sensitization as a contributor to self-reported hand pain. Yet, whether it is possible to reduce pain by preventing or reducing sensitization remains to be seen.
Associations between QST results and AUSCAN pain were weaker than for NRS pain. The AUSCAN pain subscale assesses mainly pain related to different hand activities. One possible explanation of the weak associations with AUSCAN pain might be due to pain-related kinesiophobia. Alternatively, other factors than sensitization are more important causes of activity-induced pain in persons with hand OA. The relationship between activity and pain is complex. Activity-induced pain is a potential subject for further research of hand OA pain mechanism and phenotyping.
Central sensitization can be considered as a spectrum rather than as present or not, particularly as TS can be elicited in healthy individuals if the stimulus is noxious enough. To ease the interpretation of the results we conducted analyses using TS as a dichotomized variable (absence/presence) in addition to analyses on TS-delta. We used the SDC as cut-off, reflecting the smallest increase in pain (TS-delta) that is not due to measurement error, instead of the smallest possible TS-delta (i.e. 1 point) that have been used in previous knee OA studies[38]. A lower cut-off of would have included many participants who are less likely to be sensitized. It raises the question whether measurement error in pain sensitivity testing deserved more awareness. However, we acknowledge that this method may not always be appropriate. It requires reliability testing and measurement error will differ across studies.
The study is limited by its cross-sectional design and we are therefore unable to indicate whether high sensitivity is the cause or consequence of high pain levels. The subgroup that responded late to the pain questionnaires likely weakened the results, as indicated by the increase in effect estimates when excluding this group from analyses. Furthermore, we did not collect information about the use of analgesic medications on the day the participants answered the pain questionnaires and on the day they did QST testing. The participants were not instructed to abstain from analgesics at the day of examination, which may have underestimated the results. The variation in inter-reader reliability of the QSTs from poor to good represent another possible limitation. However, the reliability testing includes only nine participants, and few discordant measurements will have a large impact on the results. Furthermore, the reliability is not only dependent on the examiners, as good reliability also will require same pain response reported by the patients. Previous reliability studies of PPTs with hand held algometers and mechanical TS have been able to show good to excellent ICCs[39, 40].
In conclusion, we found that central sensitization is common in patients with hand OA and we demonstrated a relationship between higher sensitivity and higher self-reported hand pain, even after adjusting for demographic and psychological factors as well as radiographic severity. Future studies may explore the sensitization-associated pain phenotype longitudinally as a possible risk factor for prognosis as well as a potential predictor for treatment outcomes.
Supplementary Material
Acknowledgements
The authors would like to thank the participants, the project coordinators Elisabeth Mulrooney and Janicke Magnus, as well as the research assistants and physicians involved in the Nor-Hand study.
Funding The Nor-Hand study was supported by research funds from the South-East Norway Regional Health Authority, Pahles foundation, Simon Fougner Hartmanns Family foundation and Trygve Gythfeldt´s research foundation. Dr. Neogi was supported by NIH K24 AR070892 and R01 AR062506
Funding: This study was funded by funds from the South-East Norway Regional Health Authority, Pahles foundation, Simon Fougner Hartmanns Family foundation and Trygve Gythfeldt´s research foundation. Dr. Neogi was supported by NIH K24 AR070892 and R01 AR062506.
Footnotes
Disclosure: All authors declared that they have no conflict of interest.
Competing interests None declared
References
- 1.Hawker G, Stewart L, French M, Cibere J, Jordan J, March L, et al. Understanding the pain experience in hip and knee osteoarthritis–an OARSI/OMERACT initiative. Osteoarthritis and Cartilage. 2008;16(4):415–22. [DOI] [PubMed] [Google Scholar]
- 2.Chua J, Gibson K, Pincus T. Pain and other self-reported scores in patients with osteoarthritis indicate generally similar disease burden to patients with rheumatoid arthritis. Clin Exp Rheumatol. 2017;35(107):S88–S93. [PubMed] [Google Scholar]
- 3.Haugen IK, Englund M, Aliabadi P, Niu J, Clancy M, Kvien TK, et al. Prevalence, incidence and progression of hand osteoarthritis in the general population: the Framingham Osteoarthritis Study. Ann Rheum Dis. 2011;70(9):1581–6. [DOI] [PMC free article] [PubMed] [Google Scholar]
- 4.Keen HI, Wakefield RJ, Grainger AJ, Hensor EM, Emery P, Conaghan PG. An ultrasonographic study of osteoarthritis of the hand: synovitis and its relationship to structural pathology and symptoms. Arthritis Rheum. 2008;59(12):1756–63. [DOI] [PubMed] [Google Scholar]
- 5.Haugen IK, Slatkowsky-Christensen B, Boyesen P, van der Heijde D, Kvien TK. Cross-sectional and longitudinal associations between radiographic features and measures of pain and physical function in hand osteoarthritis. Osteoarthritis Cartilage. 2013;21(9):1191–8. [DOI] [PubMed] [Google Scholar]
- 6.Haugen IK, Boyesen P, Slatkowsky-Christensen B, Sesseng S, van der Heijde D, Kvien TK. Associations between MRI-defined synovitis, bone marrow lesions and structural features and measures of pain and physical function in hand osteoarthritis. Ann Rheum Dis. 2012;71(6):899–904. [DOI] [PubMed] [Google Scholar]
- 7.Dahaghin S, Bierma-Zeinstra SM, Hazes JM, Koes BW. Clinical burden of radiographic hand osteoarthritis: a systematic appraisal. Arthritis Rheum. 2006;55(4):636–47. [DOI] [PubMed] [Google Scholar]
- 8.Neogi T The epidemiology and impact of pain in osteoarthritis. Osteoarthritis Cartilage. 2013;21(9):1145–53. [DOI] [PMC free article] [PubMed] [Google Scholar]
- 9.Arendt-Nielsen L Pain sensitisation in osteoarthritis. Clin Exp Rheumatol. 2017;35(107):S68–S74. [PubMed] [Google Scholar]
- 10.Fu K, Robbins SR, McDougall JJ. Osteoarthritis: the genesis of pain. Rheumatology (Oxford, England). 2017. [DOI] [PubMed] [Google Scholar]
- 11.Bolay H, Moskowitz MA. Mechanisms of pain modulation in chronic syndromes. Neurology. 2002;59(5 suppl 2):S2–S7. [DOI] [PubMed] [Google Scholar]
- 12.Latremoliere A, Woolf CJ. Central sensitization: a generator of pain hypersensitivity by central neural plasticity. The Journal of Pain. 2009;10(9):895–926. [DOI] [PMC free article] [PubMed] [Google Scholar]
- 13.Zhang RX, Ren K, Dubner R. Osteoarthritis pain mechanisms: basic studies in animal models. Osteoarthritis Cartilage. 2013;21(9):1308–15. [DOI] [PMC free article] [PubMed] [Google Scholar]
- 14.Neogi T, Frey-Law L, Scholz J, Niu J, Arendt-Nielsen L, Woolf C, et al. Sensitivity and sensitisation in relation to pain severity in knee osteoarthritis: trait or state? Ann Rheum Dis. 2015;74(4):682–8. [DOI] [PMC free article] [PubMed] [Google Scholar]
- 15.Sofat N, Ejindu V, Kiely P. What makes osteoarthritis painful? The evidence for local and central pain processing. Rheumatology. 2011;50(12):2157–65. [DOI] [PubMed] [Google Scholar]
- 16.Chiarotto A, Fernandez-de-las-Peñas C, Castaldo M, Negrini S, Villafañe JH. Widespread pressure pain hypersensitivity in elderly subjects with unilateral thumb carpometacarpal osteoarthritis. Hand. 2013;8(4):422–9. [DOI] [PMC free article] [PubMed] [Google Scholar]
- 17.Sofat N, Smee C, Hermansson M, Howard M, Baker EH, Howe FA, et al. Functional MRI demonstrates pain perception in hand osteoarthritis has features of central pain processing. J Biomed Graph Comput. 2013;3(4). [DOI] [PMC free article] [PubMed] [Google Scholar]
- 18.Wajed J, Ejindu V, Heron C, Hermansson M, Kiely P, Sofat N. Quantitative sensory testing in painful hand osteoarthritis demonstrates features of peripheral sensitisation. Int J Rheumatol. 2012;2012:703138. [DOI] [PMC free article] [PubMed] [Google Scholar]
- 19.Gløersen M, Mulrooney E, Mathiessen A, Hammer HB, Slatkowsky-Christensen B, Faraj K, et al. A hospital-based observational cohort study exploring pain and biomarkers in patients with hand osteoarthritis in Norway: The Nor-Hand protocol. BMJ open. 2017;7(9):e016938. [DOI] [PMC free article] [PubMed] [Google Scholar]
- 20.Bellamy N, Campbell J, Haraoui B, Buchbinder R, Hobby K, Roth JH, et al. Dimensionality and clinical importance of pain and disability in hand osteoarthritis: Development of the Australian/Canadian (AUSCAN) Osteoarthritis Hand Index. Osteoarthritis and Cartilage. 2002;10(11):855–62. [DOI] [PubMed] [Google Scholar]
- 21.Woolf CJ. Central sensitization: implications for the diagnosis and treatment of pain. Pain. 2011;152(3):S2–S15. [DOI] [PMC free article] [PubMed] [Google Scholar]
- 22.Arendt-Nielsen L, Nie H, Laursen MB, Laursen BS, Madeleine P, Simonsen OH, et al. Sensitization in patients with painful knee osteoarthritis. Pain. 2010;149(3):573–81. [DOI] [PubMed] [Google Scholar]
- 23.Bartley EJ, King CD, Sibille KT, Cruz-Almeida Y, Riley JL 3rd, Glover TL, et al. Enhanced Pain Sensitivity Among Individuals With Symptomatic Knee Osteoarthritis: Potential Sex Differences in Central Sensitization. Arthritis Care Res (Hoboken). 2016;68(4):472–80. [DOI] [PMC free article] [PubMed] [Google Scholar]
- 24.Curatolo M, Petersen-Felix S, Arendt-Nielsen L. Sensory Assessment of Regional Analgesia in HumansA Review of Methods and Applications. Anesthesiology: The Journal of the American Society of Anesthesiologists. 2000;93(6):1517–30. [DOI] [PubMed] [Google Scholar]
- 25.Goodin BR, Glover TL, Sotolongo A, King CD, Sibille KT, Herbert MS, et al. The association of greater dispositional optimism with less endogenous pain facilitation is indirectly transmitted through lower levels of pain catastrophizing. The journal of pain : official journal of the American Pain Society. 2013;14(2):126–35. [DOI] [PMC free article] [PubMed] [Google Scholar]
- 26.Bruynesteyn K, Boers M, Kostense P, van der Linden S, van der Heijde D. Deciding on progression of joint damage in paired films of individual patients: smallest detectable difference or change. Annals of the rheumatic diseases. 2005;64(2):179–82. [DOI] [PMC free article] [PubMed] [Google Scholar]
- 27.Altman D. Practical Statistics for Medical Research Chapman & Hall London Google Scholar. Haung, et al [16] USA (Black). 1991.
- 28.Sullivan MJ, Bishop SR, Pivik J. The pain catastrophizing scale: development and validation. Psychological assessment. 1995;7(4):524. [Google Scholar]
- 29.Zigmond AS, Snaith RP. The hospital anxiety and depression scale. Acta psychiatrica scandinavica. 1983;67(6):361–70. [DOI] [PubMed] [Google Scholar]
- 30.Carlesso LC, Segal NA, Frey‐Law L, Zhang Y, Lu N, Nevitt M, et al. Pain Susceptibility Phenotypes in Those Free of Knee Pain with or at Risk of Knee Osteoarthritis: The Multicenter Osteoarthritis Study. Arthritis & Rheumatology. 2018. [DOI] [PMC free article] [PubMed] [Google Scholar]
- 31.Sorge RE, Totsch SK. Sex Differences in Pain. Journal of neuroscience research. 2017;95(6):1271–81. [DOI] [PubMed] [Google Scholar]
- 32.Bellamy N, Hochberg M, Tubach F, Martin‐Mola E, Awada H, Bombardier C, et al. Development of multinational definitions of minimal clinically important improvement and patient acceptable symptomatic state in osteoarthritis. Arthritis care & research. 2015;67(7):972–80. [DOI] [PubMed] [Google Scholar]
- 33.Tubach F, Ravaud P, Martin-Mola E, Awada H, Bellamy N, Bombardier C, et al. Minimum clinically important improvement and patient acceptable symptom state in pain and function in rheumatoid arthritis, ankylosing spondylitis, chronic back pain, hand osteoarthritis, and hip and knee osteoarthritis: Results from a prospective multinational study. Arthritis Care Res (Hoboken). 2012;64(11):1699–707. [DOI] [PubMed] [Google Scholar]
- 34.Farrell M, Gibson S, McMeeken J, Helme R. Pain and hyperalgesia in osteoarthritis of the hands. The Journal of rheumatology. 2000;27(2):441–7. [PubMed] [Google Scholar]
- 35.Chiarotto A, Fernandez-de-las-Peñas C, Castaldo M, Villafañe JH. Bilateral pressure pain hypersensitivity over the hand as potential sign of sensitization mechanisms in individuals with thumb carpometacarpal osteoarthritis. Pain Medicine. 2013;14(10):1585–92. [DOI] [PubMed] [Google Scholar]
- 36.Sofat N, Harrison A, Russell MD, Ayis S, Kiely PD, Baker EH, et al. The effect of pregabalin or duloxetine on arthritis pain: a clinical and mechanistic study in people with hand osteoarthritis. Journal of pain research. 2017;10:2437–49. [DOI] [PMC free article] [PubMed] [Google Scholar]
- 37.Salaffi F, Stancati A, Silvestri CA, Ciapetti A, Grassi W. Minimal clinically important changes in chronic musculoskeletal pain intensity measured on a numerical rating scale. European journal of pain. 2004;8(4):283–91. [DOI] [PubMed] [Google Scholar]
- 38.Neogi T, Guermazi A, Roemer F, Nevitt MC, Scholz J, Arendt-Nielsen L, et al. Association of Joint Inflammation With Pain Sensitization in Knee Osteoarthritis: The Multicenter Osteoarthritis Study. Arthritis Rheumatol. 2016;68(3):654–61. [DOI] [PMC free article] [PubMed] [Google Scholar]
- 39.Graven-Nielsen T, Vaegter HB, Finocchietti S, Handberg G, Arendt-Nielsen L. Assessment of musculoskeletal pain sensitivity and temporal summation by cuff pressure algometry: a reliability study. Pain. 2015;156(11):2193–202. [DOI] [PubMed] [Google Scholar]
- 40.Cathcart S, Winefield AH, Rolan P, Lushington K. Reliability of temporal summation and diffuse noxious inhibitory control. Pain Research and Management. 2009;14(6):433–8. [DOI] [PMC free article] [PubMed] [Google Scholar]
Associated Data
This section collects any data citations, data availability statements, or supplementary materials included in this article.