

Abstract
Peripheral arterial disease is characterized by impaired blood flow to tissues outside the heart due to atherosclerosis and it most frequently occurs in the lower extremities. Type 2 diabetes (T2D) is a well-known risk factor that accelerate the course and contributes to poor clinical outcomes of PAD. While there is some evidence that T2D is associated with altered expression of genes involved in regulating PAD severity, our knowledge about the specific genes and pathways involved remains incomplete.
We induced experimental PAD or hind limb ischemia in T2D and non-diabetic mice and subjected the ischemic gastrocnemius muscle tissues to genome-wide mRNA transcriptome analysis. We subsequently performed pathway analysis on the top 500 genes that showed the most significant expression differences between the ischemic diabetic and ischemic non-diabetic muscle tissues. Pathway analysis of the differentially expressed genes identified pathways involved in essential biological processes such as “metabolic pathways,” “phagosomes,” “lysosomes,” and “regulation of actin cytoskeleton”. Overall, our data provides the opportunity to test hypotheses on the potential role of the altered genes/molecular pathways in poor PAD outcomes in diabetes.
Keywords: Peripheral artery disease, Type 2 diabetes mellitus, Genome-wide gene expression profiling, Molecular pathway analysis
Introduction
Peripheral artery disease (PAD) is a major health care problem, estimated to affect millions of people world wide [1], [2]. It is characterized by atherosclerotic occlusive disease of blood vessels outside the heart and most commonly affects arteries of the lower extremities [1], [2]. Individuals with PAD exhibit two major and differential clinical manifestations: Intermittent claudication (IC), which is defined as mobility or exercise-triggered leg pain with no tissue loss; and critical limb ischemia (CLI), which is defined as leg pain at rest and is usually accompanied by tissue loss/necrosis [3], [4]. The risk factors for developing PAD are essentially the same well established risk factors for developing coronary artery disease (CAD) and this includes smoking, diabetes, hypertension, hypercholesterolemia and smoking [5]. However, unlike CAD diabetes and smoking account for about 80% of the risk of developing PAD. It is well known that both Type 1 Diabetes (T1D) and T2D significantly increase the risk of development of PAD [4], [6]. Additionally, when an individual with PAD has DM regardless of type, these individuals have poorer outcomes [7], [8], [9].
Of the estimated 400 million people in the world that have diabetes, about 90% have type 2 diabetes [10], therefore, it is expected that the vast majority of PAD patients with diabetes will have T2D. Moreover, patients with type 2 diabetes often present with other comorbid conditions such as hypertension and hypercholesterolemia that can further exacerbate PAD [4], [11]. How diabetes contributes to poorer PAD outcomes is poorly understood. There is some evidence that hyperglycemia associated with DM may contribute to endothelial cell dysfunction, inflammation, and hypercoagulability [11]. Moreover in a number of studies investigators have shown contributory data suggesting that diabetes (both T1D and T2D) might alter the expression of genes involved in regulating PAD outcomes [12], [13], [14], [15], [16]. Studies from our group recently showed in a mouse model of T1D and PAD, post-ischemic gene expression is altered and implicated molecular pathways that may be involved in the poorer PAD outcomes associated with DM [17].
Our group and others previously showed that high fat diet (HFD) feed mice (a model of T2D) have impaired perfusion recovery and lower extremity capillary density in its ischemic hind limbs compared to non-diabetic C5BL/6 (B6) control [12], [14], [18]. However, our knowledge about the specific genes and pathways involved in poor PAD outcomes in T2D remains incomplete.
Although both T1D and T2D is associated with hyperglycemia, the pathophysiology of these diseases have many differences [19], [20]. Hence, it is important to understand the effect of T2D on post-ischemic gene expression and identify the specific molecular pathways affected.
In this study, we explored the effect of T2D on ischemia-induced gene expression following experimental PAD in mice. We compared the gene expression profile in ischemic hind limbs of HFD fed mice to that of normal chow fed non-diabetic mice. We hypothesized that the gene expression profile of diabetic and non-diabetic mice post-HLI will differ considerably and the results may elucidate the specific genes and pathways that influence PAD severity and outcomes in T2D.
Materials and methods
Mice
Male C57BL/6 mice were obtained from the Jackson Laboratory (Bar Harbor, ME, USA). We generated T2D mice by placing C57BL/6 mice on high fat (60% of HFD) diet starting at 6 weeks. 16 week-old high fat diet fed C57BL/6 (HFD) mice were used. The HFD is a previously described mouse model of T2D [21]. Mice typically develop dysglycemia by 16 weeks of HFD feeding. Strain, age and sex-matched non-diabetic mice were used as controls.
Hind limb ischemia
We achieved hind limb ischemia (HLI) by unilateral femoral artery ligation and excision, as described previously [22]. Blood flow in the ischemic and contralateral non-ischemic limbs was measured by laser Doppler perfusion imaging, as described previously [12], [23], [24]. Controls were strain, age, and sex-matched.
Microarray procedures and Real-time PCR
Total RNA was extracted from the ischemic gastrocnemius muscle on day 3 post-HLI, as described previously [15], [16]. Day 3 was chosen because this is a time point that we previously showed there was no significant difference in perfusion recovery between the non-diabetic C57bL/6 and the diabetic HFD mice [12]. RNA was processed and hybridized onto Affymetrix Mouse430 expression arrays according to the manufacturer’s protocols and as previously described [17]. Microarray was performed at the DNA Science Core, Department of Microbiology, Immunology and Cancer Biology, University of Virginia. Expression values were normalized and we were provided expression analysis data on a total of 45,101 probe sets”. This probes set expression values were then subjected to statistical analyses using previously described approaches [21], [17]. Microarray results were validated by quantitative Real-time PCR of representative genes from affected molecular pathways. Expression values from ischemic C57BL/6 and HFD tissues were normalized to non-ischemic B6 tissues.
Statistical analysis
Statistical analysis of these gene expression profiles was performed on GeneSpring software (version 14.9, Silicon Genetics, Redwood, CA) as previously described [17]. Briefly, the complete dataset was first filtered on expression values which excluded transcript IDs in which 10% of the samples did not express a value above a set cut-off out of the 45,101 probe sets present on the AffyMetrix GeneChip. T-test adjusted with Benjamini-Hochberg multiple test correction (corresponding to a false discovery rate (FDR) of 5%)”was performed between HFD and C57BL/6 mice to give differentially expressed transcript IDs. “Top 500 most differentially expressed genes from the list of transcript IDs with a p-value < 0.05 and FC > 2.0 or FC < −2.0 were selected for data mining. GeneSpring was also used to produce a heat map of differentially expressed genes. Hierarchical clustering was chosen for the gene list. The list was clustered on expression values and conditions using normalized intensity values, Euclidean distance metric, and centroid linkage rule parameters.
Data mining analysis
The lists of differentially expressed genes were subjected to data mining in Web-based Gene Set Analysis Toolkit (WebGestalt, www.webgestalt.org). From this, enriched KEGG pathways and gene ontology categories (GO) were obtained.
Results
Genes differentially expressed between T2D and non-diabetic mice
The whole genome mRNA expression in gastrocnemius muscle tissue from HFD mice was compared to that of age and sex-matched C57BL/6 (non-diabetic) controls.
We identified 1261 probe sets (genes) with significant expression differences (FC > 2.0 or FC < −2.0) between controls and experimental mice (p < 0.05, adjusted with Benjamini-Hochberg multiple test correction). Of these, 496 genes had lower expression and 765 genes had higher expression in the HFD mice compared to non-diabetic mice (Fig. 1). A volcano plot of the array data showing the distribution of the probe set IDs is also provided (Fig. 2).”
Fig. 1.

Hierarchical clustering of genes whose expression was different in non-diabetic and T2D mice. The list of genes was identified with a T-test unpaired unequal variance (p < 0.05, with Benjamini-Hockberg multiple test correction) of mRNA expression data. The color of the rectangles representing averaged expression values for each gene in each set of samples (n = 3 for B6 and n = 3 for HFD) indicates the degree of increase (red) or decrease (blue) of each gene expression signal relative to the mean signal intensity (yellow).
Fig. 2.
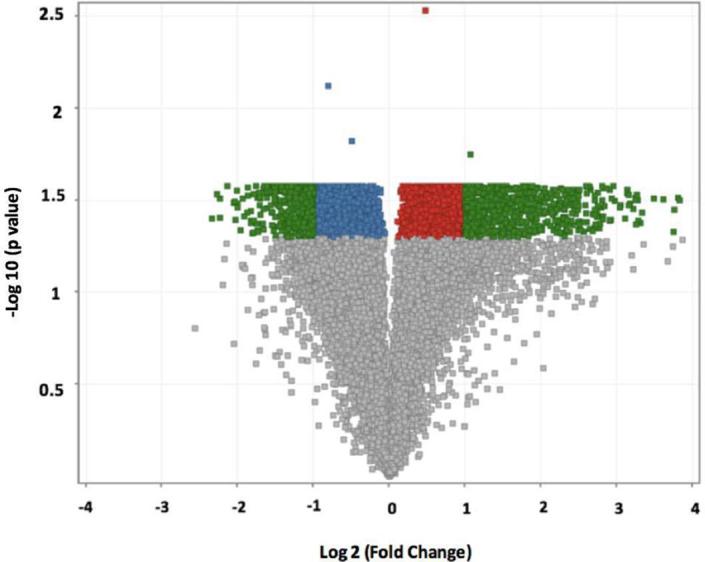
Volcano plot representing microarray probeset IDs differentially expressed in an analysis of B6 versus HFD mice by a Student’s t-test. Entities highlighted in red represent probeset IDs with a higher expression in B6 mice compared to HFD mice at p-value of <0.05. Conversely, entities highlighted in blue represent probeset IDs with a lower expression in B6 mice compared to HFD mice at p-value of <0.05. Entities highlighted in green represent probeset IDs with both a p-value of <0.05 and a fold change greater than ±2.0. Here, the 1261 probeset IDs highlighted in green represent the genes from which we selected the 500 most differently expressed genes to analyze in our study.
Kyoto encyclopedia of genes and genomes (KEGG) pathways of altered genes between non-diabetic and T2D mice
In order to better appreciate the molecular pathways and biological processes associated with the genes altered in T2D and non-diabetic mice, we performed KEGG pathway analyses on the top 500 most differentially expressed genes from the list of 1261 probe sets. The top 10 enriched KEGG pathway generated at a high stringency level (p < 0.005, with Benjamini-Hochberg multiple test correction) are shown in Table 1. The pathways that are enriched are highly significant and include important biological pathways such as “metabolic pathways,” “phagosomes,” “lysosomes,” and “regulation of actin cytoskeleton”.
Table 1.
Enriched KEGG pathways for the list of altered genes between non-diabetic and T2D mice.
| KEGG Pathway | Adjusted p-value | No. of genes | Genes in the pathway |
|---|---|---|---|
| Metabolic Pathways | 2.37e−20 | 49 | Acadvl (+), Rrm2 (-), Idi1 (-), Agpat4 (-), Gpt2 (+), Acacb (+), Mlycd (+), Gcnt1 (-), Plcd4 (+), Pigp (+), Cox11 (+), Gaa (+), Sc4mol (-), Adi1 (+), Pfkp (-), Mgat5 (-), Atp6v0d2 (-), Galnt6 (-), B3gnt5 (-), ND5 (+), Idh3b (+), Dhcr24 (-), Hadhb (+), Gyk (+), Acadl (+), Ugp2 (+), Aco2 (+), Amy1 (+), Cyp2u1 (+), Tcirg1 (-), Psat1 (-), Cyp51 (-), Hsd17b12 (-), Cmbl (+), Me3 (+), Nos1 (+), Me1 (+), Sqle (-), Ugcg (-), Atp6v1c1 (-), St3gal6 (+), Tkt (-), Hmgcr (-), Atp6v0e2 (+), Acsl6 (+), Ada (-), Enpp1 (-), Stt3a (-), Hk1 (-) |
| Phagosome | 3.27e−09 | 14 | Itga5 (-), Rilp (+), Tcirg1 (-), Ctsl (-), Atp6v1c1 (-), Msr1 (-), Coro1a (-), Sec61a1 (-), Fcgr4 (-), Itgb2 (-), Atp6v0e2 (+), Nos1 (+), Fcgr1 (-), Atp6v0d2 (-) |
| Lysosome | 9.54e−07 | 10 | Tcirg1 (-), Ctsl (-), Psap (-), Ap4s1 (+), Ctsb (-), Gaa (+), Npc2 (-), Slc11a1 (-), Ctsf (+), Atp6v0d2 (-) |
| Rheumatoid arthritis | 2.67e−06 | 8 | Tcirg1 (-), Ctsl (-), Atp6v1c1 (-), Ccl3 (-), Itgb2 (-), Atp6v0e2 (+), Cd86 (-), Atp6v0d2 (-) |
| PPAR signaling pathway | 2.67e-06 | 8 | Fabp5 (-), Scd2 (-), Ppara (+), Gyk (+), Fads2 (-), Acadl (+), Acsl6 (+), Me1 (+) |
| Steroid biosynthesis | 2.67e−06 | 5 | Sqle (-), Cyp51 (-), Sc4mol (-), Dhcr24 (-), Soat1 (-) |
| Regulation of actin cytoskeleton | 7.34e−05 | 10 | Ezr (-), Actn1 (-), Itga5 (-), Fgf1 (+), Arpc5l (+), Fgf13 (+), Vav1 (-), Pfn2 (+), Itgb2 (-), Itgax (-) |
| Starch and sucrose metabolism | 0.0002 | 5 | Gaa (+), Ugp2 (+), Enpp1 (-), Amy1 (+), Hk1 (-) |
| Galactose metabolism | 0.0003 | 4 | Gaa (+), Ugp2 (+), Pfkp (-), Hk1(-) |
| Fatty acid metabolism | 0.0003 | 5 | Acadvl (+), Eci1 (+), Acsl6 (+), Acadl (+), Hadhb (+) |
The lists of differentially expressed genes were analyzed in WebGestalt (www.webgestalt.org) for enriched KEGG pathways. Best 10 pathways sorted by adjusted p-values are shown. Pathways indicated in bold font might play a role in post-ischemic recovery. “-” signifies that the gene has a lower expression in T2D compared to non-diabetic mice, while “+” indicates that the gene has a higher expression in T2D mice compared to non-diabetic mice.
Gene ontology categories of altered genes between HFD and non-diabetic.
We subsequently performed Gene ontology analyses (p < 0.005. with Benjamini-Hochberg multiple test correction) to better categorize genes found to be differentially expressed between HFD and non-diabetic mice. The best categories for these genes sorted by p-value are shown in Table 2. Gene ontology categories most strongly represented are “cellular processes,” “primary metabolic processes,” and “localization” within the “Biological Processes” category; “binding” and “catalytic activity” within the “Molecular Function” category; and “cell” and “organelle” within the “Cellular Component” category.
Table 2.
Enriched Gene ontology categories for the list of altered genes between non-diabetic and T2D mice.
| Gene Ontology | No. of genes in category | p-value |
|---|---|---|
| Biological Process | ||
| Cellular process | 304 | 3.45e−15 |
| Metabolic process | 223 | 3.23e−11 |
| Localization | 124 | 1.30e−10 |
| Molecular Function | ||
| Binding | 274 | 1.42e−18 |
| Catalytic activity | 145 | 6.19e−10 |
| Cellular compartment | ||
| Cell | 331 | 1.18e−27 |
| Organelle | 264 | 1.36e−21 |
The lists of differentially expressed genes were analyzed in WebGestalt (www.webgestalt.org). Best categories sorted by p-value are shown.
Validation of microarray data by quantitative real-time PCR.
We used quantitative real-time Polymerase Chain Reaction (qRT-PCR) to validate the microarray data by choosing genes from some of the pathways in our KEGG pathway analysis. Rrm2, Dhcr24 from “Metabolic Pathways”, Cyp51 from “Steroid biosynthesis” and Ccl3 from“ Rheumatoid arthritis Pathway”. These tested genes showed expression differences between the ischemic non-diabetic C57BL/6 and the ischemic T2D hind limb tissues (Fig. 3). This is consistent with our gene array findings. Additionally, to test whether the differential expression of these 4 genes reflect impaired ischemia induced gene expression or existed at baseline in non-ischemic tissues, we analyzed their level of expression in non-ischemic hind limb tissues from non-diabetic and T2D mice. We found at baseline there was no difference in Rrm2, Dhcr24, Cyp51 and Ccl3 mRNA expression between non-diabetic and T2DM tissues (Fig. 3). Therefore, the result is consistent with impaired ischemia induced upregulation of these 4 genes.
Fig. 3.

Mice with type 2 DM show impaired upregulation of some genes in ischemia: Fold change values represent expression levels of genes in ischemic B6 = C57BL/6 (non-diabetic) and Type 2 DM = C57BL/6 on high fat diet (diabetic) tissues normalized to non-ischemic C57BL/6 tissues. (n = 3–4/grp and the p values are shown with p < 0.05 considered significant). The results are consistent with the microarray data results.
Discussion
A prior study has provided a broad view of post ischemic gene expression over time following induction of experimental PAD [25]. Findings from the study suggest inflammation, angiogenesis, and stress-related genes are upregulated early in the time-course (e.g. day 1) following ischemic injury while cell cycle and cytoskeletal genes are upregulated later in the process (e.g. day 3) [25]. Moreover, expression of cell cycle genes that play a key role in skeletal muscle regenerative process peaks at day 3 post-HLI [26]. Skeletal muscle repair and regeneration as well as restoration of blood flow are essential adaptive processes to minimize complications from PAD.
There are many mouse models of T2D each with its limitations as to how well it models human disease [27]. Hence, one limitation of the High fat diet model is that the hyperglycemia seen is not severe [21]. Nevertheless, this model has some of the key metabolic abnormalities in T2D, including glucose intolerance and insulin resistance and therefore allows for testing hypothesis related to effects of these metabolic abnormalities on post ischemic gene adaptation in PAD and DM [21], [12], [18]. For example, our lab and other have shown that using the HFD feeding model of T2D, mice show impaired perfusion recovery and angiogenesis following experimental PAD compared to control mice on a normal chow diet (non diabetic) [12], [8], [13]. This was shown to be due in part to maladaptive expression of an inhibitory vascular endothelial growth factor receptor (VEGFR), soluble VEGFR1 in the ischemic mouse hind limbs [12]. Such targeted studies allowed us to dissect some of the underlying mechanisms at the individual gene level, they were however limited by an inability to provide a broader view of the effects of dysglycemia on ischemia-induced gene expression. Therefore, we hypothesized that a comparison of overall gene expression (e.g. non-targeted approach) between ischemic tissues from non-diabetic mice and T2D mice would help identify which pathways are altered. Additionally, we hypothesized that the altered pathways might contribute to the poor post-ischemic adaptation and outcomes seen in PAD patients with T2D.
Our results confirmed that mice with T2D following HFD display alters gene expression in post-ischemic hind limbs and advanced our knowledge about the pathways that may modulate PAD severity and outcomes in T2D. We identified 1261 probe sets (genes) with significant expression differences (FC > 2.0 or FC < −2.0) between controls and experimental mice (p < 0.05, adjusted with Benjamini-Hochberg multiple test correction). Of these, 496 genes had lower expression and 765 genes had higher expression in the HFD mice compared to non-diabetic mice. KEGG pathway analysis on the altered list of genes between ischemic, non-diabetic and T2D tissues enriched pathways such as metabolic, lysosome and phagosomes pathway. To our knowledge, this is the first time the lysosome and phagosome pathways have been implicated in regulating post-ischemic recovery in T2D or dysglycemia. The lysosome and phagosome pathways are critical pathways involved in injury repair in part through removal of damaged tissues [28], [29]. Following ischemic injury, these pathways may be critical for tissue repair. For example, Ctsl, is a gene that encodes the protein Cathepsin L, which is one of the most abundant lysosomal proteases [30]. Mice with Ctsl deficiency develop a cardiomyopathy characterized by impaired contractility and fibrosis [31], [32]. Hence, the decreased expression of Ctsl in post-ischemic T2D mice may contribute to poor post-ischemic injury repair. We speculate that upregulation of many of genes noted to be upregulated in ischemic non-diabetic mouse hind limbs are part of the normal adaptation to ischemia while the impaired upregulation in diabetic animal likely reflects poor adaptation. Consistent with this prior, studies have shown impaired blood flow recovery in the diabetic mice and increased limbs necrosis following HLI when compared to non-diabetic mice [12], [16]. Although it is not yet clear how dysglycemia regulates expression of the genes in these pathways, our data offers, insight that can be exploited in future studies.
Using a similar approach to the one we employed in this study we previously explored the impact of T1D on post-ischemic gene expression [17]. Interestingly, the top molecular pathways that were altered in T1D ischemic tissues are quite different from the top molecular pathways identified in this study. In the previous study the top 3 pathways include cell cycle, DNA replication, metabolic pathway and pathways in cancer while in the current study the top3 pathways are metabolic, phagosome and lysosome. The fact that post-ischemic genes expression is altered in both forms of diabetes in not surprising given the underlying pathophysiology of the disease. What is unexpected is that the results implicate cell cycle and DNA replication pathways as the top pathways altered in T1D while phagosome and lysosome are the top pathways implicated in the T2D model.
In this study we have compared gene expression in gastrocnemius muscle that consist of both fast twitched and slow twitched fibers from non-diabetic mice to that of diabetic mice. The identified differences in post-ischemic gene expression may be related to the specific type of muscle fibers present in the skeletal muscle. For example, it quite possible that a different set of genes would be differentially expressed in these studies if Soleus muscles were used. There is evidence that following exercise gene expression in fast twitch muscles differ from that in slow twitched muscles [33]. Additionally, our current study focused solely on gene expression within the ischemic skeletal muscle. Local ischemia may result in systemic responses that may differ between non-diabetic and diabetic mice. Hence, future studies exploring differences in systemic response to ischemia may provide additional insight into the mechanisms contributing to impaired perfusion recovery in mice with diabetes.
Taken together, our data provide insight into the molecular pathways that may be key to understanding poorer PAD outcomes in diabetes. It also offers the opportunity to test hypotheses on the roles played by the altered genes/molecular pathways in poor PAD outcomes in diabetes. Such studies may lead to the development of specific therapies to improve PAD outcomes in diabetes.
Funding
This work was supported by the National Heart, Lung, and Blood Institute (R01 HL130399 to AO Dokun). RP & LG were supported by a Short-Term Research Training Grant (T32-5T35DK113964-02) from the National Institute of Diabetes and Digestive and Kidney Diseases (NIDDK). Software licenses were supported by UC4 DK104155.
Declaration of Competing Interest
None.
Acknowledgment
None.
Footnotes
Supplementary data to this article can be found online at https://doi.org/10.1016/j.jcte.2019.100199.
Appendix A. Supplementary data
The following are the Supplementary data to this article:
References
- 1.Fowkes F.G.R., Rudan D., Rudan I., Aboyans V., Denenberg J.O., McDermott M.M. Comparison of global estimates of prevalence and risk factors for peripheral artery disease in 2000 and 2010: a systematic review and analysis. Lancet. 2013;382(9901):1329–1340. doi: 10.1016/S0140-6736(13)61249-0. [DOI] [PubMed] [Google Scholar]
- 2.Criqui M.H., Aboyans V. Epidemiology of peripheral artery disease. Circ Res. 2015;116(9):1509. doi: 10.1161/CIRCRESAHA.116.303849. [DOI] [PubMed] [Google Scholar]
- 3.Ws A. Peripheral arterial disease of the lower extremities. Arch Med Sci. 2012;8(2):375–388. doi: 10.5114/aoms.2012.28568. [DOI] [PMC free article] [PubMed] [Google Scholar]
- 4.Norgren L., Hiatt W., Dormandy J., Nehler M., Harris K., Fowkes F. Inter-society consensus for the management of peripheral arterial disease (TASC II) Eur J Vasc Endovasc Surg. 2007;33:S1–S75. doi: 10.1016/j.ejvs.2006.09.024. [DOI] [PubMed] [Google Scholar]
- 5.Nw S. Epidemiology, classification, and modifiable risk factors of peripheral arterial disease. Vascular Health Risk Manage. 2007;3(2):229–234. doi: 10.2147/vhrm.2007.3.2.229. [DOI] [PMC free article] [PubMed] [Google Scholar]
- 6.Norgren L., Hiatt W.R., Dormandy J.A., Nehler M.R., Harris K.A., Fowkes F.G.R. Inter-society consensus for the management of peripheral arterial disease (TASC II) J Vascular Surg. 2007;45(1, Supplement 1) doi: 10.1016/j.jvs.2006.12.037. S5-S67. [DOI] [PubMed] [Google Scholar]
- 7.Jude E.B., Eleftheriadou I., Tentolouris N. Peripheral arterial disease in diabetes—a review. Diabet Med. 2010;27(1):4–14. doi: 10.1111/j.1464-5491.2009.02866.x. [DOI] [PubMed] [Google Scholar]
- 8.Marso S.P., Hiatt W.R. Peripheral arterial disease in patients with diabetes. J Am Coll Cardiol. 2006;47(5):921–929. doi: 10.1016/j.jacc.2005.09.065. [DOI] [PubMed] [Google Scholar]
- 9.Zander Heinke, Reindel Kohnert, Kairies Braun. Periphere arterielle Verschlusskrankheit bei Diabetes mellitus Typ 1 und Typ 2: unterscheiden sich die Risikofaktoren? Vasa. 2002;31(4):249–254. [Google Scholar]
- 10.Roglic G. WHO Global report on diabetes: a summary. Int J Noncommun Dis. 2016;1(1):3–8. [Google Scholar]
- 11.Clark Nathaniel. Peripheral arterial disease in people with diabetes. Diabetes Care. 2003;26(12):3333. doi: 10.2337/diacare.26.12.3333. [DOI] [PubMed] [Google Scholar]
- 12.Hazarika S., Dokun A.O., Li Y., Popel A.S., Kontos C.D., Annex B.H. Impaired Angiogenesis after hindlimb ischemia in type 2 diabetes mellitus: differential regulation of vascular endothelial growth factor receptor 1 and soluble vascular endothelial growth factor receptor 1. Circ Res. 2007;101(9):948–956. doi: 10.1161/CIRCRESAHA.107.160630. [DOI] [PubMed] [Google Scholar]
- 13.Thangarajah H., Yao D., Chang E.I., Shi Y., Jazayeri L., Vial I.N. The molecular basis for impaired hypoxia-induced VEGF expression in diabetic tissues. Proc Natl Acad Sci. 2009;106(32):13505–13510. doi: 10.1073/pnas.0906670106. [DOI] [PMC free article] [PubMed] [Google Scholar]
- 14.Thangarajah H., Vial I.N., Grogan R.H., Yao D., Shi Y., Januszyk M. HIF-1 dysfunction in diabetes. Cell Cycle. 2010;9(1):75–79. doi: 10.4161/cc.9.1.10371. [DOI] [PubMed] [Google Scholar]
- 15.Chen L., Okeke E., Ayalew D., Wang D., Shahid L., Dokun A.O. Modulation of miR29a improves impaired post-ischemic angiogenesis in hyperglycemia. Exp Biol Med. 2017;242(14):1432–1443. doi: 10.1177/1535370217716424. [DOI] [PMC free article] [PubMed] [Google Scholar]
- 16.Dokun A.O., Chen L., Lanjewar S.S., Lye R.J., Annex B.H. Glycaemic control improves perfusion recovery and VEGFR2 protein expression in diabetic mice following experimental PAD. Cardiovasc Res. 2014;101(3):364–372. doi: 10.1093/cvr/cvt342. [DOI] [PMC free article] [PubMed] [Google Scholar]
- 17.Peravali R., Gunnels L., Alleboina S., Gerling I.C., Dokun A.O. Type 1 diabetes alters ischemia-induced gene expression. J Clin Trans Endocrinol. 2018;15:19–24. doi: 10.1016/j.jcte.2018.11.003. [DOI] [PMC free article] [PubMed] [Google Scholar]
- 18.Li Y., Hazarika S., Xie D., Pippen A.M., Kontos C.D., Annex B.H. In mice with type 2 diabetes, a vascular endothelial growth factor (VEGF)-activating transcription factor modulates VEGF signaling and induces therapeutic angiogenesis after hindlimb ischemia. Diabetes. 2007;56(3):656–665. doi: 10.2337/db06-0999. [DOI] [PubMed] [Google Scholar]
- 19.Zaccardi F., Webb D.R., Yates T., Davies M.J. Pathophysiology of type 1 and type 2 diabetes mellitus: a 90-year perspective. Postgrad Med J. 2016;92(1084):63. doi: 10.1136/postgradmedj-2015-133281. [DOI] [PubMed] [Google Scholar]
- 20.Skyler J.S., Bakris G.L., Bonifacio E., Darsow T., Eckel R.H., Groop L. Differentiation of diabetes by pathophysiology, natural history, and prognosis. Diabetes. 2017;66(2):241. doi: 10.2337/db16-0806. [DOI] [PMC free article] [PubMed] [Google Scholar]
- 21.Surwit R.S., Kuhn C.M., Cochrane C., McCubbin J.A., Feinglos M.N. Diet-induced type II diabetes in C57BL/6J mice. Diabetes. 1988;37(9):1163–1167. doi: 10.2337/diab.37.9.1163. [DOI] [PubMed] [Google Scholar]
- 22.Couffinhal T., Silver M., Zheng L.P., Kearney M., Witzenbichler B., Isner J.M. Mouse model of angiogenesis. Am J Pathol. 1998;152(6):1667–1679. [PMC free article] [PubMed] [Google Scholar]
- 23.Dokun A.O., Chen L., Okutsu M., Farber C.R., Hazarika S., Jones W.S. ADAM12: a genetic modifier of preclinical peripheral arterial disease. Am J Physiol Heart Circ Physiol. 2015;309(5):H790–H803. doi: 10.1152/ajpheart.00803.2014. [DOI] [PMC free article] [PubMed] [Google Scholar]
- 24.Dokun A.O., Annex B. Genetic polymorphisms in peripheral arterial disease role of genomic methodologies. In: Ginsburg H.W.a.G., editor. Genomic and personalized medicine. Elsevier; 2008. [Google Scholar]
- 25.Lee C.W., Stabile E., Kinnaird T., Shou M., Devaney J.M., Epstein S.E. Temporal patterns of gene expression after acute hindlimb ischemia in mice: insights into the genomic program for collateral vessel development. J Am Coll Cardiol. 2004;43(3):474–482. doi: 10.1016/j.jacc.2003.09.033. [DOI] [PubMed] [Google Scholar]
- 26.Paoni N.F., Peale F., Wang F., Errett-Baroncini C., Steinmetz H., Toy K. Time course of skeletal muscle repair and gene expression following acute hind limb ischemia in mice. Physiol Genomics. 2002;11(3):263–272. doi: 10.1152/physiolgenomics.00110.2002. [DOI] [PubMed] [Google Scholar]
- 27.Baribault H. Mouse models of type 2 diabetes mellitus in drug discovery. In: Proetzel G., Wiles M.V., editors. Mouse models for drug discovery: methods and protocols. Springer, New York; New York, NY: 2016. pp. 153–175. [Google Scholar]
- 28.Honda H., Kimura H., Rostami A. Demonstration and phenotypic characterization of resident macrophages in rat skeletal muscle. Immunology. 1990;70(2):272–277. [PMC free article] [PubMed] [Google Scholar]
- 29.Tidball J.G. Inflammatory processes in muscle injury and repair. Am J Physiol-Regul, Integr Comp Physiol. 2005;288(2):R345–R353. doi: 10.1152/ajpregu.00454.2004. [DOI] [PubMed] [Google Scholar]
- 30.Brix K. Springer US; Boston, MA: 2005. Lysosomal proteases. Lysosomes; pp. 50–59. [Google Scholar]
- 31.Stypmann J., Gläser K., Roth W., Tobin D.J., Petermann I., Matthias R. Dilated cardiomyopathy in mice deficient for the lysosomal cysteine peptidase cathepsin L. Proc Natl Acad Sci. 2002;99(9):6234–6239. doi: 10.1073/pnas.092637699. [DOI] [PMC free article] [PubMed] [Google Scholar]
- 32.Spira D., Stypmann J., Tobin D.J., Petermann I., Mayer C., Hagemann S. Cell type-specific functions of the lysosomal protease cathepsin L in the heart. J Biol Chem. 2007;282(51):37045–37052. doi: 10.1074/jbc.M703447200. [DOI] [PubMed] [Google Scholar]
- 33.Murach K., Raue U., Wilkerson B., Minchev K., Jemiolo B., Bagley J. Single muscle fiber gene expression with run taper. PLoS One. 2014;9(9) doi: 10.1371/journal.pone.0108547. [DOI] [PMC free article] [PubMed] [Google Scholar]
Associated Data
This section collects any data citations, data availability statements, or supplementary materials included in this article.