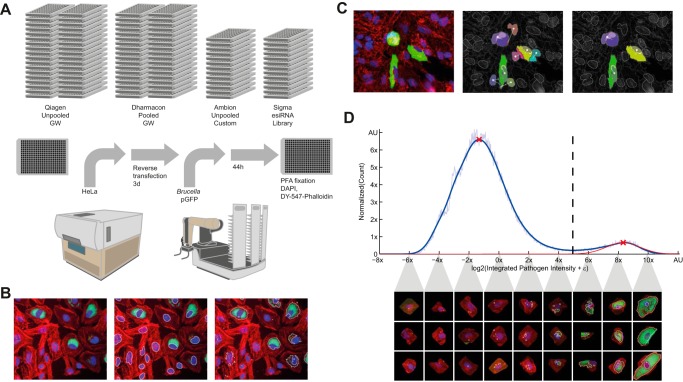
FIG 1.
Overview of the high-content screening and analysis. (A) Summary of RNAi screening workflow. Reverse transfection of HeLa cells was performed in 384-well format for 72 h, followed by 48-h infection with GFP-expressing B. abortus, PFA fixation, and staining of HeLa cells with DAPI and DY-547−phalloidin before automated imaging. GW, genomewide. (B) Image analysis was performed with CellProfiler to segment nuclei and bacteria and to extract measurements. (C) Accurate association of segmented bacteria to nuclei enables quantitative single-cell measurements. The naive association (middle image) of segmented pathogen can be affected by oversplitting in dense cell populations (left image). Our proposed solution (right image) based on a nucleus attraction score. (D) The plate histogram shows the bimodal distribution of integrated GFP intensity corresponding to Brucella replication. Intensity on the x axes is log2 scaled to account for exponential growth. The normal distribution fitted (red curve) to the kernel density estimation of the histogram allows us to compute a robust binary infection threshold (dashed line) separating HeLa cells with (right) and without (left) replicating Brucella. Associated are samples of single-cell images corresponding to the intervals of the intensity distribution (for more details, see Materials and Methods).

