

Abstract
Introduction: Renal osteodystrophy (ROD) develops early in chronic kidney disease (CKD) and progresses with loss of kidney function. While intact parathyroid hormone (PTH), 1,25-dihydroxyvitamin D3 (1,25D), and fibroblast growth factor-23 (FGF-23) levels are usually considered the primary abnormalities in ROD development, the role of serum activin A elevations in CKD and its relationships to ROD have not been explored. The aims of this study were to evaluate serum activin A at different CKD stages, and to establish the relationships between activin A, bone biomarkers, and bone histomorphometric parameters. Materials and methods: 104 patients with CKD stages 2 – 5D underwent bone biopsies. We measured in the serum activin A, BSAP, DKK1, FGF-23, α-Klotho, intact PTH, sclerostin, TRAP-5b, and 1,25D. Biochemical results were compared across CKD stages and with 19 age-matched controls with normal kidney function. Results: Median activin A levels were increased in all stages of CKD compared to controls from 544 pg/mL in CKD 2 (431 – 628) to 1,135 pg/mL in CKD 5D (816 – 1,456), compared to 369 pg/mL in controls (316 – 453, p < 0.01). The increase of activin A in CKD 2 (p = 0.016) occurred before changes in the other measured biomarkers. Activin A correlated with intact PTH and FGF-23 (r = 0.65 and 0.61; p < 0.01) and with histomorphometric parameters of bone turnover (BFR/BS, Acf, ObS/BS and OcS/BS; r = 0.47 – 0.52; p < 0.01). These correlations were comparable to those found with intact PTH and FGF-23. Conclusion: Serum activin A levels increase starting at CKD 2 before elevations in intact PTH and FGF-23. Activin A correlates with bone turnover similar to intact PTH and FGF-23. These findings suggest a role for activin A in early development of ROD.
Keywords: activin A, CKD-MBD, bone turnover, renal osteodystrophy
Introduction
In the US, there are ~ 30 million patients with chronic kidney disease (CKD). The majority of these patients has chronic kidney disease mineral and bone disorder (CKD-MBD) which represents a pervasive health problem [1]. CKD-MBD presents with dysregulated mineral metabolism, increased risk for bone fracture, cardiovascular calcification, left ventricular hypertrophy, and increased mortality [2, 3, 4, 5, 6]. Renal osteodystrophy (ROD) represents the bone manifestation of CKD-MBD; it starts in patients as early as CKD stage 2 and progresses with further loss of kidney function [7, 8]. Virtually all patients requiring replacement of kidney function by dialysis have evidence of renal osteodystrophy. Progressive loss of kidney function is associated with an increase in intact parathyroid hormone (PTH), serum phosphorus, fibroblast growth factor-23 (FGF-23), and a decrease in 1,25-dihydroxyvitamin D3 (1,25D). These abnormalities are considered to be the main pathologic factors for renal osteodystrophy [7, 9, 10], but they are not sufficient to explain the bone changes that may occur as early as stage 2 [7, 11]. Identification of novel factors, especially in the early stages of CKD, is important for a more complete understanding of the pathogenesis of ROD.
Activin A, a multifunctional cytokine [12], has recently been studied in experimental animals with reduced kidney function [13, 14]. It is the most abundant of the transforming growth factor-beta (TGF-β) family of protein found in bone matrix [15]. Moreover, its expression has been shown to be coupled with bone resorption [16] and inhibition of activin signaling results in stimulation of bone growth [13]. Activin receptor type II A inhibition by the ligand trap RAP011 was shown to inhibit osteoclast formation in vitro and bone remodeling in CKD diabetic mice [13]. These data point to a potentially important role for activin in bone turnover. Bone turnover abnormalities are an integral part of pathologic features of renal osteodystrophy, and therefore it appears important to study blood levels of activin A in patients across the spectrum of loss of glomerular filtration rate (GFR).
The aims of this study were to: 1) evaluate serum activin A levels in patients at different stages of CKD, 2) compare activin A levels with other known biomarkers of ROD at different stages of CKD, and 3) establish the relationships between histomorphometric parameters of ROD and serum levels of activin A versus the other known ROD bone markers.
Material and methods
Patients
This is a cross-sectional study of 104 CKD patients, stage 2 – 5D (on dialysis) who agreed to undergo bone biopsy for research purposes or workup for bone loss diagnosed by DXA. Before biopsy, for bone labeling, demeclocycline hydrochloride (150 mg b.i.d.) was administered for 2 days and tetracycline hydrochloride (250 mg b.i.d.) for 4 days, each separated from the other by a period of 10 days. Biopsies were performed 3 days after completion of the second label. All patients had blood draw at time of the bone biopsy. Inclusion criteria were age ≥ 18 years with a diagnosis of CKD stages 2 – 5D. Exclusion criteria were history of renal transplantation, history of parathyroidectomy, use of medications known to affect bone metabolism (except for calcitriol or cinacalcet), and life-threatening comorbid conditions such as malignancy, active infection, and hepatic disease. In addition, blood was drawn during the same time period from 19 individuals with normal kidney function who served as controls. These individuals were not receiving any anti-osteoporosis drugs at the time of the biopsy and during 2 years before biopsy. Informed consent was signed by all patients, and the study was reviewed and approved by the Institutional Review Board at the University of Kentucky. The study was conducted according to the Declaration of Helsinki. The patients’ medical records were reviewed to obtain demographic data, medication usage comorbidities, and data about dialysis vintage.
Serum biochemistry
Activin A levels were measured using R&D Systems kits (Indianapolis, ID, USA), sclerostin and DKK1 levels using Biomedica kits (Vienna, Austria), FGF-23 using Kainos kits (Tokyo, Japan), α-Klotho using IBL kits (Fujioka-Shi, Gunma, Japan), BSAP and TRAP-5b using Quidel kits (San Diego, CA, USA). Intact PTH and 1,25D were measured using chemiluminescence analyzers (DiaSorin, Stillwater, MN, USA). Serum creatinine, calcium, and phosphorus levels were measured by automated techniques. All measurements were performed in duplicate. Estimated GFR (eGFR) was determined using the MDRD formula.
Mineralized bone histology and bone histomorphometry
Bone samples were obtained by bone biopsies of the anterior iliac crest under local anesthesia and sedation. They were fixed in ethanol at room temperature, dehydrated, and embedded in methyl methacrylate as described previously [17]. Sections were stained with the modified Masson-Goldner trichrome stain [18], the aurin tricarboxylic acid stain [19], and solochrome azurine stain [20]. Unstained sections were prepared for phase-contrast and fluorescence light microscopy. Bone histomorphometry for static and dynamic parameters of bone structure, formation, and resorption was done at a magnification of 200 × using the OsteoMeasure (OsteoMetrics, Atlanta, GA, USA). All measured histomorphometric parameters are in compliance with the recommendations of the nomenclature committee of the American Society of Bone and Mineral Research [21, 22].
Statistical analyses
Results were reported as means (±SD) or medians (25th – 75th quartiles, IQR) when values were not normally distributed. Categorical variables were expressed as percentages. Comparisons of continuous variables were done using Kruskal-Wallis or Mann-Witney U-tests as appropriate. Correlations between activin A and other biochemical parameters, and between activin A and bone histomorphometric parameters were examined using Spearman’s rho (ρ) tests. Cutoff values for determination of low vs. non-low and high vs. non-high bone turnover were obtained by using the Youden’s J statistic. All statistical analyses were performed using SPSS version 24 (IBM Corp., Armonk, NY, USA). Group comparisons with p < 0.05 were considered statistically significant, and p < 0.005 was considered statistically significant for multiple correlations.
Results
There were 104 patients, consisting of 75 females and 29 males with mean age of 59 (± 15) years. 22 patients were in CKD stage 2, 29 patients in CKD stage 3, 19 patients in stages 4 or 5, and 34 patients on maintenance hemodialysis (CKD 5D). Disease etiologies included: 18% diabetes, 11% hypertension, 4% glomerulonephritis, 2% polycystic kidney disease, 30% other etiologies, and 34% unknown. Clinical and biochemical characteristics of the patients are shown in Table 1. Biochemical parameters such as phosphorus, calcium, BSAP, and TRAP-5b were significantly higher in CKD 5D compared to other CKD groups.
Table 1. Demographic, clinical, and serum biochemical parameters in patients with CKD stages 2 – 5D and controls.
| Control | CKD 2 | CKD 3 | CKD 4/5 | CKD 5D | p-value | |
|---|---|---|---|---|---|---|
| No. of subjects | 19 | 22 | 29 | 19 | 34 | |
| Age | 55 ± 12a,b | 65 ± 10a | 68 ± 12a | 60 ± 13a,b | 49 ± 13b | < 0.001 |
| Dialysis vintage, median mos. (25th, 75th) | 64 (48-119) | |||||
| Patients with diabetes, n (%) | 0 | 4 (18%) | 3 (10%) | 9 (47%) | 11 (32%) | |
| Tx with active vitamin D metabolites, n (%) | 2 (11%) | 3 (14%) | 1 (3%) | 6 (32%) | 21 (62%) | |
| Calcium containing P binders, n (%) | 0 | 0 | 1 (3%) | 2 (11%) | 20 (59%) | |
| Sevelamer and lanthanum, n (%) | 0 | 0 | 0 | 1 (5%) | 12 (35%) | |
| Calcium (mg/dL) | 9.5 ± 0.4a | 9.6 ± 0.5 a | 9.6 ± 0.6a | 9.1 ± 1.2ab | 8.8 ± 1.0b | < 0.001 |
| Phosphorus (mg/dL) | 3.6 ± 0.6a | 3.5 ± 0.8 a | 3.7 ± 0.4a | 4.0 ± 0.6ab | 5.9 ± 2.0b | < 0.001 |
| Activin A (pg/mL) | 369 (316 – 453)a | 545 (431 – 628)b | 564 (462 – 732)b | 597 (472 – 810)b | 1,125 (816 – 1,456)c | |
| Sclerostin (pg/mL) | 744 (579 – 900)a | 978 (697 – 1,371)a | 1,248 (1,049 – 1,508)b | 1,255 (986 – 1,963)b | 2,145 (1,687 – 3,184)c | |
| PTH (pg/mL) | 33 (20 – 47)a | 37 (30 – 42)a | 47 (31 – 66)b | 76 (37 – 162)b | 501 (231 – 1,612)c | |
| FGF-23 (pg/mL) | 57 (37 – 76)a | 71 (58 – 87)a | 80 (58 – 118)a | 229 (122 – 319)b | 10,348 (2,021 – 23,462)c | |
| 1,25D (pg/mL) | 50 (40 – 64)a | 44 (39 – 60)a | 46 (37 – 53)a | 34 (26 – 44)b | < 4.5c | |
| BSAP (U/L) | 27 (21 – 32)a | 23 (19 – 28)a | 24 (18 – 29)a | 23 (17 – 30)a | 80 (36 – 134)b | < 0.001 |
| TRAP5b (U/L) | 3.6 (2.4 – 4.5)a | 2.9 (2.4 – 3.8)a | 3.1 (2.5 – 3.8)a | 2.4 (1.8 – 4.1)a | 5.4 (4.4 – 10.7)b | < 0.001 |
| DKK1 (pmol/L) | 40 (30 – 46) | 32 (25 – 53) | 41 (34 – 48) | 23 (20 – 30) | 30 (13 – 41) | 0.879 |
| α-Klotho (pg/mL) | 720 (589 – 851) | 837 (522 – 947) | 669 (558 – 832) | 691 (467 – 945) | 530 (337 – 699) | 0.083 |
Results sharing the same superscript letters are not significantly different.
Activin A, sclerostin, and other biochemical parameters across CKD stages
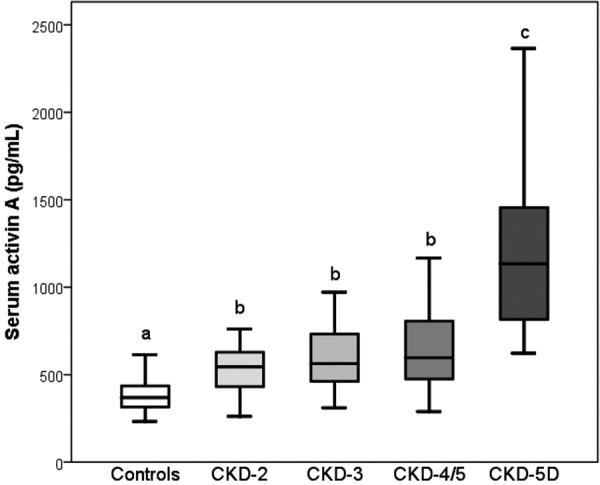
Serum activin A levels increased with declining eGFR (Figure 1) (ρ = 0.580, p < 0.001). Compared to controls, median levels of activin A were significantly elevated in CKD 2 (p = 0.016) (Figure 2). There was a trend to a further increase without significant differences between CKD 2, 3, and 4/5, while in CKD 5D there was a further significant increase in serum activin A concentrations. There were no significant differences in activin A levels between diabetics and non-diabetics and patients with or without active vitamin D metabolites among the patients with stages 2 – 5 (p = 0.911 and 0.290, respectively), as well as in CKD 5D patients (p = 0.800 and 0.276, respectively). The results on changes of activin A in patients with CKD versus controls were not altered by exclusion of patients with diabetes or vitamin D treatment.
Figure 1. Relationships between serum levels of activin A and levels of eGFR. Results of patients with CKD 5D (n = 34) are given by mean ± 95% confidence intervals. Dashed line represents linear regression (R2 = 0.316, p < 0.01).
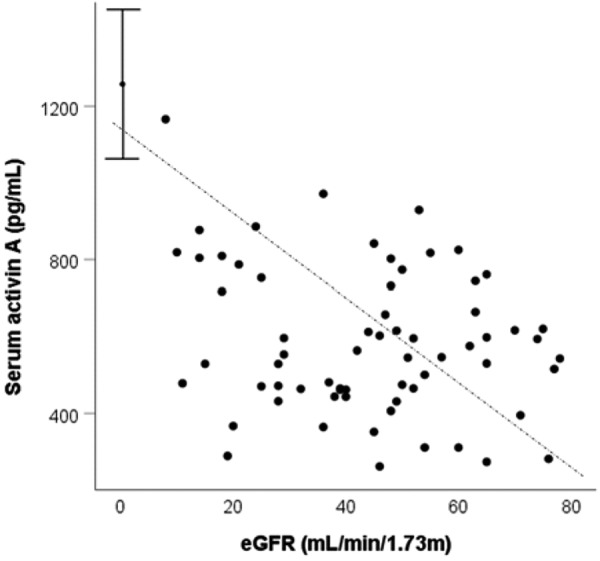
Figure 2. Serum levels of activin A in patients with CKD stages 2 – 5D. Results sharing the same letters are not significantly different.
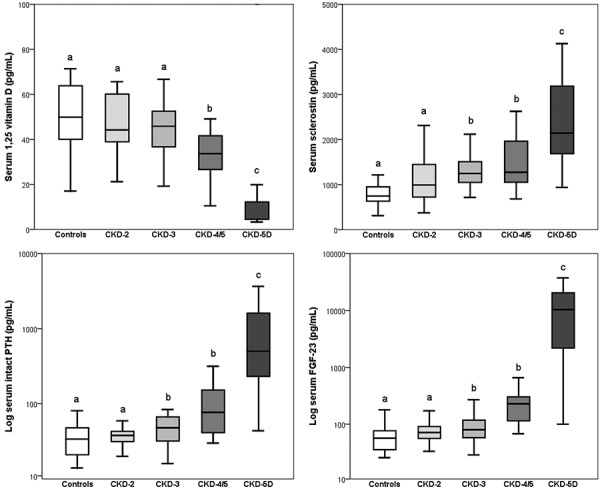
Compared to controls, median levels of sclerostin and intact PTH became elevated in CKD 3 (p = 0.018 and 0.022, respectively) (Figure 3), while median levels of 1,25D fell and FGF23 levels increased in CKD 4/5 (p = 0.008 and p < 0.001, respectively) (Figure 3).
Figure 3. Serum levels of sclerostin, intact PTH, FGF-23, and 1,25D in patients with CKD stages 2 – 5D. Results sharing the same letters are not significantly different.
Across all CKD patients, serum activin A levels correlated (in descending orders) with intact PTH, FGF-23, TRAP-5b, phosphorus, 1,25D, BSAP and sclerostin (Table 2). Serum sclerostin levels also correlated in descending order with 1,25D, phosphorus, FGF-23, intact PTH, and to a lesser extent with TRAP-5b.
Table 2. Correlation coefficients (ρ) between serum biochemical results in patients with CKD stages 2 – 5D.
| Spearman’s ρ | Activin A | Sclerostin | Intact PTH | FGF–23 | 1,25D | BSAP | TRAP–5b | Phosphorus | Calcium | DKK1 |
|---|---|---|---|---|---|---|---|---|---|---|
| Sclerostin | 0.39** | |||||||||
| Intact PTH | 0.65** | 0.30** | ||||||||
| FGF-23 | 0.61** | 0.33** | 0.67** | |||||||
| 1,25D | –0.52** | –0.36** | –0.57** | –0.71** | ||||||
| BSAP | 0.51** | 0.22 | 0.62** | 0.40** | –0.51** | |||||
| TRAP-5b | 0.52* | 0.27** | 0.44** | 0.19 | –0.38** | 0.61** | ||||
| Phosphorus | 0.54** | 0.33** | 0.45** | 0.52** | –0.45** | 0.28 | 0.29** | |||
| Calcium | –0.18 | –0.11 | –0.34** | –0.23 | 0.41** | –0.20 | –0.06 | –0.26 | ||
| DKK1 | –0.14 | 0.06 | –0.27 | –0.22 | 0.20 | –0.06 | 0.04 | –0.09 | 0.08 | |
| α-Klotho | –0.07 | –0.14 | –0.19 | –0.23 | 0.23 | –0.06 | 0.01 | –0.12 | 0.14 | 0.14 |
*p > 0.05; **p >0.01.
Relationships between activin A, other serum biochemical bone markers, and histomorphometric results (Table 3)
Table 3. Correlation coefficients (ρ) between serum biochemical results and bone histomorphometric parameters in patients with CKD stages 2 – 5D.
| Spearman‘s ρ | Activin A | Sclerostin | Intact PTH | FGF-23 | 1,25D | BSAP | TRAP-5b | Phosphorus | Calcium | DKK1 | α-Klotho |
|---|---|---|---|---|---|---|---|---|---|---|---|
| Bone formation rate/ Bone surface | 0.51** | 0.28** | 0.59** | 0.55** | –0.42** | 0.55** | 0.35** | 0.43** | –0.27** | –0.22 | –0.25 |
| Activation frequency | 0.47** | 0.18 | 0.53** | 0.51** | –0.38** | 0.50** | 0.31** | 0.37** | –0.19 | –0.26 | –0.25 |
| Osteoblast surface/ Bone surface | 0.49** | 0.16 | 0.58** | 0.54** | –0.45** | 0.39** | 0.23 | 0.42** | –0.17 | –0.24 | –0.10 |
| Osteoclast surface/ Bone surface | 0.52** | 0.35** | 0.64** | 0.55** | –0.50** | 0.57** | 0.43** | 0.48** | –0.36** | –0.18 | –0.21 |
| Osteoid surface/ Bone surface | 0.52** | 0.32** | 0.64** | 0.54** | –0.41** | 0.46** | 0.30** | 0.40** | –0.32** | –0.36** | –0.21 |
| Mineralization lag time | 0.20 | 0.13 | 0.25 | 0.12 | –0.15 | 0.13 | 0.11 | 0.12 | –0.17 | –0.13 | –0.05 |
| Bone volume/ Tissue volume | 0.15 | 0.17 | 0.24 | 0.18 | –0.35** | 0.31** | 0.18 | 0.12 | –0.33** | 0.11 | –0.08 |
| Trabecular thickness | –0.03 | 0.10 | 0.04 | 0.06 | –0.21 | 0.22 | –0.01 | 0.02 | –0.12 | 0.16 | –0.03 |
**p > 0.01.
Across all CKD stages, serum activin A levels correlated with parameters of bone formation and resorption such as activation frequency, bone formation rate, osteoblast surface, osteoclast surface, osteoid thickness, and cortical porosity. These correlations were similar to those found between intact PTH, FGF-23, and histomorphometric bone parameters. The correlations between sclerostin and the histomorphometric bone parameters were less strong and there were no significant correlations with activation frequency and osteoblast surface. DKK1 correlated with osteoid surface only while there was no correlation between histomorphometric bone parameters and α-Klotho. Intact PTH, FGF-23, 1,25D, BSAP, and TRAP-5b showed the expected relationships with histomorphometric parameters of bone formation and resorption.
Prediction of bone turnover by activin A and other serum biochemical bone markers
Patients were classified as having low, normal, and high bone turnover based on reference values for activation frequency, bone formation rate, and numbers of osteoclasts and osteoblasts [23, 24, 25]. There were 57 subjects with low bone turnover (55%), 13 with normal (13%), and 34 with high bone turnover (33%). Levels of activin A, sclerostin, intact PTH, FGF-23, 1,25D, BSAP, and TRAP-5b separated by bone turnover are shown in Figures 4 and 5. Serum levels of activin A were significantly different between bone turnover states (ANOVA p < 0.001) (Figure 4). The other markers also varied significantly (ANOVA p’s < 0.01) (Figure 5), except for sclerostin. Activin A showed similar AUC results, specificity, and sensitivity in predicting high turnover as intact PTH, BSAP, and FGF-23 (Table 4). Vitamin 1,25D and TRAP-5b showed less sensitivity and specificity for identification of bone turnover.
Figure 4. Levels of serum activin A in low, normal, and high bone turnover patients with CKD from stage 2 to 5D (group means + 95% confidence intervals). Results sharing the same letters are not significantly different.
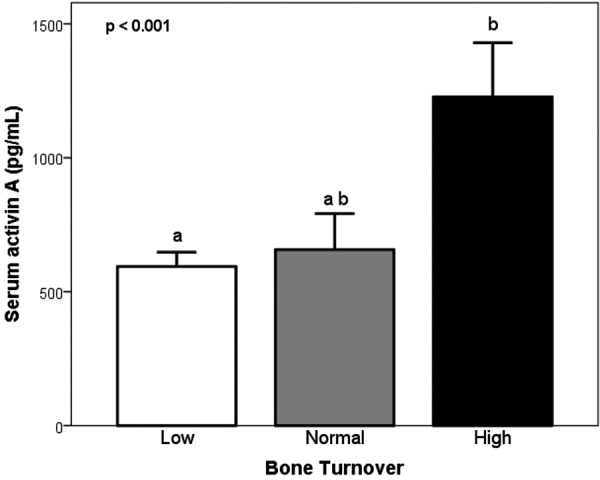
Figure 5. Levels of serum biochemical parameters in patients (CKD from stage 2 to 5D) with low, normal, and high bone turnover (group means + 95% confidence intervals). Results sharing the same letters are not significantly different.
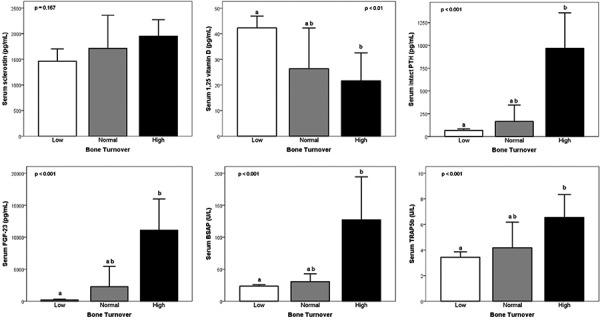
Table 4. Cutoff values using the maximum Youden’s J statistic and AUC of circulating biomarkers to distinguish low and high bone turnover from non-low and non-high bone turnover in patients with CKD stages 2 – 5D.
| |
Bone turnover | |||||||
|---|---|---|---|---|---|---|---|---|
| Low vs. non low | High vs. non high | |||||||
| Cutoffs | ROC AUC (95% CI) | Sens. | Spec. | Cutoffs | ROC AUC (95% CI) | Sens. | Spec. | |
| Activin A (pg/mL) | 677 | 0.80 (0.71 – 0.88) | 0.79 | 0.72 | 937 | 0.87 (0.79 – 0.94) | 0.62 | 0.96 |
| Sclerostin (pg/mL) | 1,670 | 0.64 ( 0.53 – 0.75) | 0.54 | 0.77 | 1,670 | 0.66 (0.54 – 0.77) | 0.61 | 0.74 |
| PTH (pg/mL) | 93 | 0.84 (0.76 – 0.92) | 0.72 | 0.87 | 243 | 0.86 (0.78 – 0.95) | 0.66 | 0.94 |
| FGF-23 (pg/mL) | 245 | 0.85 (0.77 – 0.92) | 0.65 | 0.89 | 1,339 | 0.86 (0.78 – 0.94) | 0.64 | 0.96 |
| 1,25D (pg/mL) | 27 | 0.78 (0.67 – 0.89) | 0.87 | 0.71 | 14 | 0.73 (0.60 – 0.87) | 0.9 | 0.62 |
| BSAP (U/L) | 27 | 0.81 (0.71 – 0.90) | 0.79 | 0.7 | 35 | 0.86 (0.77 – 0.95) | 0.72 | 0.84 |
| TRAP-5b (U/L) | 4.3 | 0.66 (0.53 – 0.78) | 0.56 | 0.8 | 4.3 | 0.68 (0.53 – 0.83) | 0.65 | 0.76 |
Discussion
The current data demonstrate the novel findings of a significant increase in activin A blood levels as early as CKD stage 2. Compared to controls, intact PTH and sclerostin increase significantly at CKD stage 3, while FGF-23 does not increase significantly and 1,25D decreases significantly at stage 4/5. The PTH findings are in agreement with several prior studies [7, 10]. Sclerostin has been recently shown to increase at CKD stage 3 [11] [26]. In agreement with our results, Gutierrez et al. [4, 9] found FGF-23 to increase in some patients at stage 3 with a significant increase at stage 4, while Isakova et al. [27] studying 3,879 participants found significant increases already at stage 3. Our results on 1,25D changes with CKD are in agreement with Levin et al. [10] who showed in a study of 1,814 CKD patients similar median levels of 1,25D by CKD stages. PTH, FGF-23, and 1,25D are commonly considered to be contributors to the pathogenesis of ROD [28, 29, 30, 31, 32], and sclerostin might play a role in the bone loss of ROD [33]. Our findings ascribe a role to activin A as the earliest documentable serum abnormality in the development of CKD-MBD; they open up a promising new avenue for research addressing the early pathogenesis of, and possible therapeutic approaches to, ROD.
The strong associations between activin A and intact PTH, FGF-23, and 1,25D, factors involved in bone formation, resorption and mineralization, show that activin A appears to be associated with bone turnover. This is corroborated by the observation that activin A showed similar specificity as intact PTH and FGF-23 in the discrimination of high versus non-high turnover. In experimental animals with reduced kidney function [13, 14], activin A expression has been shown to be coupled with bone resorption [16] and inhibition of activin signaling results in stimulation of bone growth [13]. Activin A also has been shown to enhance osteoclast activity, and activin receptor type II A inhibition by the ligand trap, RAP011, was shown to inhibit osteoclast formation in vitro and bone remodeling in diabetic mice with CKD [13]. In mice with CKD-MBD induced by Alport syndrome, RAP011 decreased elevated osteoclast numbers and bone resorption; importantly, osteoblast numbers were not decreased, and the reduced bone formation rate per osteoblast associated with CKD-MBD was corrected [14]. Taken together, these data point to an important role for activin in bone turnover.
Activin A showed no relationship with Klotho or DKK1 neither of which varied with CKD stages. Thus, activin A appears to be independent of α-Klotho or DKK1 in ROD. The α-Klotho results are in contrast with experimental results in animals and clinical observations in patients with acute kidney injury [34] and CKD [35]. Akimoto et al. [36, 37], using the same assay as employed in our study, found in agreement with our results no significant changes in α-Klotho and DKK1 by CKD stage. The DKK1 results are in agreement with human studies in CKD [33, 38] but in contrast with findings of elevated DKK1 in a mouse model of CKD stage 5 [39]. These discrepancies in α-Klotho and DKK1 results might be related to differences in the employed assays.
Limitations of the study are given by description of correlations that cannot establish causality. However, in mice with CKD-MBD, activin receptor type II A inhibition by the ligand trap RAP011 prevented development of renal osteodystrophy, that is, there was correction of high bone turnover and improvement of osteoblastic function [14]. Moreover, use of the natural antagonist of activin A, inhibin, in mice resulted in an increase in bone mineral density (BMD) [40]. Taken together, these data point to an important role for activin in renal osteodystrophy.
Further limitations of the study are related to its cross-sectional nature. Even though the total number of 104 subjects studied including bone biopsies is respectable, when broken down into CKD stages, the number of patients in each group is relatively small and does not allow analysis regarding diagnostic value of serum parameters for low versus high turnover and the role of factors such as diabetes and specific therapies. The present results provide justification for a prospective, multicenter, long-term study with bone biopsies in a larger number of patients. Currently available assays for novel markers such as α-Klotho and DKK1 are still undergoing refinements and standardizations, and could limit interpretation and comparisons of results across publications including ours.
In conclusion, activin A is a novel player observed in ROD in addition to or independent of the known abnormalities in PTH, FGF-23, 1,25D, and sclerostin. Activin A levels increase in blood of patients with CKD starting as early as stage 2 and the relationships with bone turnover abnormalities are as strong as those found with PTH and FGF-23. The present findings open up a new avenue for research in animals and subsequently in humans addressing the early pathogenesis of ROD and potential new therapeutic approaches to this serious abnormality of CKD-MBD.
Funding
This study was funded in part by the National Institutes of Health, Grant RO1 080770, UK Center for Clinical and Translational Science (CCTS), and the Kentucky Nephrology Research Trust (KNRT).
Conflict of interest
The authors declare no potential conflict of interest.
References
- 1. Saran R Robinson B Abbott KC Agodoa LYC Bhave N Bragg-Gresham J Balkrishnan R Dietrich X Eckard A Eggers PW Gaipov A Gillen D Gipson D Hailpern SM Hall YN Han Y He K Herman W Heung M Hirth RA US Renal Data System 2017 Annual Data Report: Epidemiology of Kidney Disease in the United States. Am J Kidney Dis. 2018; 71 (3(S1): A7. [DOI] [PMC free article] [PubMed] [Google Scholar]
- 2. Block GA Port FK Re-evaluation of risks associated with hyperphosphatemia and hyperparathyroidism in dialysis patients: recommendations for a change in management. Am J Kidney Dis. 2000; 35: 1226–1237. [DOI] [PubMed] [Google Scholar]
- 3. Drüeke TB [The new Kidney Disease: Improving Global Outcomes (KDIGO) guideline for the mineral and bone disorder associated with chronic kidney disease (MBD-CKD)]. Nephrol Ther. 2010; 6: 149–150. [DOI] [PubMed] [Google Scholar]
- 4. Gutiérrez OM Januzzi JL Isakova T Laliberte K Smith K Collerone G Sarwar A Hoffmann U Coglianese E Christenson R Wang TJ deFilippi C Wolf M Fibroblast growth factor 23 and left ventricular hypertrophy in chronic kidney disease. Circulation. 2009; 119: 2545–2552. [DOI] [PMC free article] [PubMed] [Google Scholar]
- 5. Nickolas TL Leonard MB Shane E Chronic kidney disease and bone fracture: a growing concern. Kidney Int. 2008; 74: 721–731. [DOI] [PMC free article] [PubMed] [Google Scholar]
- 6. Pimentel A Ureña-Torres P Zillikens MC Bover J Cohen-Solal M Fractures in patients with CKD-diagnosis, treatment, and prevention: a review by members of the European Calcified Tissue Society and the European Renal Association of Nephrology Dialysis and Transplantation. Kidney Int. 2017; 92: 1343–1355. [DOI] [PubMed] [Google Scholar]
- 7. Malluche HH Ritz E Lange HP Kutschera L Hodgson M Seiffert U Schoeppe W Bone histology in incipient and advanced renal failure. Kidney Int. 1976; 9: 355–362. [DOI] [PubMed] [Google Scholar]
- 8. Moe S Drüeke T Cunningham J Goodman W Martin K Olgaard K Ott S Sprague S Lameire N Eknoyan G Definition, evaluation, and classification of renal osteodystrophy: a position statement from Kidney Disease: Improving Global Outcomes (KDIGO). Kidney Int. 2006; 69: 1945–1953. [DOI] [PubMed] [Google Scholar]
- 9. Gutierrez O Isakova T Rhee E Shah A Holmes J Collerone G Jüppner H Wolf M Fibroblast growth factor-23 mitigates hyperphosphatemia but accentuates calcitriol deficiency in chronic kidney disease. J Am Soc Nephrol. 2005; 16: 2205–2215. [DOI] [PubMed] [Google Scholar]
- 10. Levin A Le Barbier M Er L Andress D Sigrist MK Djurdjev O Incident isolated 1,25(OH)(2)D(3) deficiency is more common than 25(OH)D deficiency in CKD. J Nephrol. 2012; 25: 204–210. [DOI] [PubMed] [Google Scholar]
- 11. Pelletier S Dubourg L Carlier MC Hadj-Aissa A Fouque D The relation between renal function and serum sclerostin in adult patients with CKD. Clin J Am Soc Nephrol. 2013; 8: 819–823. [DOI] [PMC free article] [PubMed] [Google Scholar]
- 12. Maeshima A Nojima Y Kojima I Activin A: an autocrine regulator of cell growth and differentiation in renal proximal tubular cells. Kidney Int. 2002; 62: 446–454. [DOI] [PubMed] [Google Scholar]
- 13. Sugatani T Agapova OA Fang Y Berman AG Wallace JM Malluche HH Faugere MC Smith W Sung V Hruska KA Ligand trap of the activin receptor type IIA inhibits osteoclast stimulation of bone remodeling in diabetic mice with chronic kidney disease. Kidney Int. 2017; 91: 86–95. [DOI] [PMC free article] [PubMed] [Google Scholar]
- 14. Williams MJ Sugatani T Agapova OA Fang Y Gaut JP Faugere MC Malluche HH Hruska KA The activin receptor is stimulated in the skeleton, vasculature, heart, and kidney during chronic kidney disease. Kidney Int. 2018; 93: 147–158. [DOI] [PMC free article] [PubMed] [Google Scholar]
- 15. Ogawa Y Schmidt DK Nathan RM Armstrong RM Miller KL Sawamura SJ Ziman JM Erickson KL de Leon ER Rosen DM Bovine bone activin enhances bone morphogenetic protein-induced ectopic bone formation. J Biol Chem. 1992; 267: 14233–14237. [PubMed] [Google Scholar]
- 16. Sakai R Eto Y Hirafuji M Shinoda H Activin release from bone coupled to bone resorption in organ culture of neonatal mouse calvaria. Bone. 2000; 26: 235–240. [DOI] [PubMed] [Google Scholar]
- 17. Malluche HH Faugere MC Atlas of Mineralized Bone Histology. New York and Basel: S. Karger; 1986. [Google Scholar]
- 18. Goldner J A modification of the masson trichrome technique for routine laboratory purposes. Am J Pathol. 1938; 14: 237–243. [PMC free article] [PubMed] [Google Scholar]
- 19. Lillie PD Fullmer HM Histopathologic Technique and Practical Histochemistry (4th ed). New York: McGraw-Hill; 1976. p. 534. [Google Scholar]
- 20. Denton J Freemont AJ Ball J Detection and distribution of aluminium in bone. J Clin Pathol. 1984; 37: 136–142. [DOI] [PMC free article] [PubMed] [Google Scholar]
- 21. Dempster DW Compston JE Drezner MK Glorieux FH Kanis JA Malluche H Meunier PJ Ott SM Recker RR Parfitt AM Standardized nomenclature, symbols, and units for bone histomorphometry: a 2012 update of the report of the ASBMR Histomorphometry Nomenclature Committee. Journal of bone and mineral research: the official journal of the American Society for Bone and Mineral Research. 2013; 28: 2-17. [DOI] [PMC free article] [PubMed] [Google Scholar]
- 22. Parfitt AM Drezner MK Glorieux FH Kanis JA Malluche H Meunier PJ Ott SM Recker RR Bone histomorphometry: standardization of nomenclature, symbols, and units. Report of the ASBMR Histomorphometry Nomenclature Committee. Journal of bone and mineral research: the official journal of the American Society for Bone and Mineral Research. 1987; 2: 595-610. [DOI] [PubMed] [Google Scholar]
- 23. Herberth J Branscum AJ Mawad H Cantor T Monier-Faugere MC Malluche HH Intact PTH combined with the PTH ratio for diagnosis of bone turnover in dialysis patients: a diagnostic test study. Am J Kidney Dis. 2010; 55: 897–906. [DOI] [PMC free article] [PubMed] [Google Scholar]
- 24. Malluche HH Porter DS Monier-Faugere MC Mawad H Pienkowski D Differences in bone quality in low- and high-turnover renal osteodystrophy. J Am Soc Nephrol. 2012; 23: 525–532. [DOI] [PMC free article] [PubMed] [Google Scholar]
- 25. Malluche HH Porter DS Pienkowski D Evaluating bone quality in patients with chronic kidney disease. Nat Rev Nephrol. 2013; 9: 671–680. [DOI] [PMC free article] [PubMed] [Google Scholar]
- 26. Evenepoel P D’Haese P Brandenburg V Sclerostin and DKK1: new players in renal bone and vascular disease. Kidney Int. 2015; 88: 235–240. [DOI] [PubMed] [Google Scholar]
- 27. Isakova T Wahl P Vargas GS Gutiérrez OM Scialla J Xie H Appleby D Nessel L Bellovich K Chen J Hamm L Gadegbeku C Horwitz E Townsend RR Anderson CA Lash JP Hsu CY Leonard MB Wolf M Fibroblast growth factor 23 is elevated before parathyroid hormone and phosphate in chronic kidney disease. Kidney Int. 2011; 79: 1370–1378. [DOI] [PMC free article] [PubMed] [Google Scholar]
- 28. Dhayat NA Ackermann D Pruijm M Ponte B Ehret G Guessous I Leichtle AB Paccaud F Mohaupt M Fiedler GM Devuyst O Pechère-Bertschi A Burnier M Martin PY Bochud M Vogt B Fuster DG Fibroblast growth factor 23 and markers of mineral metabolism in individuals with preserved renal function. Kidney Int. 2016; 90: 648–657. [DOI] [PubMed] [Google Scholar]
- 29. Hruska KA Sugatani T Agapova O Fang Y The chronic kidney disease - Mineral bone disorder (CKD-MBD): Advances in pathophysiology. Bone. 2017; 100: 80–86. [DOI] [PMC free article] [PubMed] [Google Scholar]
- 30. Lima F El-Husseini A Monier-Faugere MC David V Mawad H Quarles D Malluche HH FGF-23 serum levels and bone histomorphometric results in adult patients with chronic kidney disease on dialysis. Clin Nephrol. 2014; 82: 287–295. [DOI] [PMC free article] [PubMed] [Google Scholar]
- 31. Malluche HH Davenport DL Cantor T Monier-Faugere MC Bone mineral density and serum biochemical predictors of bone loss in patients with CKD on dialysis. Clin J Am Soc Nephrol. 2014; 9: 1254–1262. [DOI] [PMC free article] [PubMed] [Google Scholar]
- 32. Prié D Ureña Torres P Friedlander G [Fibroblast Growth Factor 23-Klotho: a new axis of phosphate balance control]. Med Sci (Paris). 2009; 25: 489–495. [DOI] [PubMed] [Google Scholar]
- 33. Cejka D Parada-Rodriguez D Pichler S Marculescu R Kramer I Kneissel M Gross T Reisinger A Pahr D Monier-Faugere MC Haas M Malluche HH Only minor differences in renal osteodystrophy features between wild-type and sclerostin knockout mice with chronic kidney disease. Kidney Int. 2016; 90: 828–834. [DOI] [PMC free article] [PubMed] [Google Scholar]
- 34. Shi M Flores B Gillings N Bian A Cho HJ Yan S Liu Y Levine B Moe OW Hu MC αKlotho Mitigates Progression of AKI to CKD through Activation of Autophagy. J Am Soc Nephrol. 2016; 27: 2331–2345. [DOI] [PMC free article] [PubMed] [Google Scholar]
- 35. Hu MC Kuro-o M Moe OW Secreted klotho and chronic kidney disease. Adv Exp Med Biol. 2012; 728: 126–157. [DOI] [PMC free article] [PubMed] [Google Scholar]
- 36. Akimoto T Shiizaki K Sugase T Watanabe Y Yoshizawa H Otani N Numata A Takeshima E Yamazaki T Miki T Ito C Pastor JV Iwazu Y Saito O Muto S Kuro-o M Kusano E The relationship between the soluble Klotho protein and the residual renal function among peritoneal dialysis patients. Clin Exp Nephrol. 2012; 16: 442–447. [DOI] [PubMed] [Google Scholar]
- 37. Akimoto T Yoshizawa H Watanabe Y Numata A Yamazaki T Takeshima E Iwazu K Komada T Otani N Morishita Y Ito C Shiizaki K Ando Y Muto S Kuro-o M Kusano E Characteristics of urinary and serum soluble Klotho protein in patients with different degrees of chronic kidney disease. BMC Nephrol. 2012; 13: 155. [DOI] [PMC free article] [PubMed] [Google Scholar]
- 38. Behets GJ Viaene L Meijers B Blocki F Brandenburg VM Verhulst A D’Haese PC Evenepoel P Circulating levels of sclerostin but not DKK1 associate with laboratory parameters of CKD-MBD. PLoS One. 2017; 12: e0176411. [DOI] [PMC free article] [PubMed] [Google Scholar]
- 39. Fang Y Ginsberg C Seifert M Agapova O Sugatani T Register TC Freedman BI Monier-Faugere MC Malluche H Hruska KA CKD-induced wingless/integration1 inhibitors and phosphorus cause the CKD-mineral and bone disorder. J Am Soc Nephrol. 2014; 25: 1760–1773. [DOI] [PMC free article] [PubMed] [Google Scholar]
- 40. Perrien DS Akel NS Edwards PK Carver AA Bendre MS Swain FL Skinner RA Hogue WR Nicks KM Pierson TM Suva LJ Gaddy D Inhibin A is an endocrine stimulator of bone mass and strength. Endocrinology. 2007; 148: 1654–1665. [DOI] [PubMed] [Google Scholar]