Abstract
Methodologies that involve the use of nanoparticles as “artificial atoms” to rationally build materials in a bottom-up fashion are particularly well-suited to control the matter at the nanoscale. Colloidal synthetic routes allow for an exquisite control over such “artificial atoms” in terms of size, shape, and crystal phase as well as core and surface compositions. We present here a bottom-up approach to produce Pb–Ag–K–S–Te nanocomposites, which is a highly promising system for thermoelectric energy conversion. First, we developed a high-yield and scalable colloidal synthesis route to uniform lead sulfide (PbS) nanorods, whose tips are made of silver sulfide (Ag2S). We then took advantage of the large surface-to-volume ratio to introduce a p-type dopant (K) by replacing native organic ligands with K2Te. Upon thermal consolidation, K2Te-surface modified PbS–Ag2S nanorods yield p-type doped nanocomposites with PbTe and PbS as major phases and Ag2S and Ag2Te as embedded nanoinclusions. Thermoelectric characterization of such consolidated nanosolids showed a high thermoelectric figure-of-merit of 1 at 620 K.
Keywords: colloidal nanoparticles, asymmetric nanoparticles, inorganic ligands, heterostructures, catalyst assisted growth, nanocomposites, thermoelectrics
Inorganic nanocrystalline solids containing two or more different materials and at least one of them with grain sizes in the nanometer scale can provide significantly improved mechanical, optical, electrical, and thermal properties.1 Such materials are being employed in a number of applications including catalysis,2,3 energy-storage devices such as batteries and capacitors,4 membranes for gas and ion diffusion or molecular separation,5 and energy conversion systems such as fuel cells6 and thermoelectrics.7,8 Because the desired physical properties of these materials often depend not only on the individual compositions of constituting phases but also on the mesoscale microstructure (domain size and mutual arrangement of grains, grain boundaries, etc.),9−11 chemical and physical processing techniques that control these parameters are paramount. Toward these goals, the bottom-up formation of such nanocomposites by the assembly and consolidation of nanoparticles (NPs) may be a facile, scalable, potentially low cost, and high yielding as well as extremely versatile, in terms of compositions and morphologies, method to produce these materials.12,13 A large library of materials in the form of uniform NP dispersions exists for their combinatorial blending.8 However, when it comes to the removal of the solvent and consolidation, a common hurdle is that the NPs often tend to segregate into clusters of the same size, shape, or composition.14 A compelling, broadly applicable strategy to overcome these limitations is to design heterostructured NPs comprising all desired phases and dopants in each NP,15 thereby allowing predictable and uniform nanoscale distribution of these constituents also in the resulting multicomponent nanosolids (Scheme 1).9,16−19 Herein, we present such a strategy by synthesizing colloidal PbS rods of tunable lengths with a Ag2S tip on one side. Although centrosymmetric lead chalcogenides are generally difficult to crystallize in the anisotropic shape, Ag2S NPs can overcome this limitation by acting as catalysts for the formation of PbS.
Scheme 1. Schematic of the Bottom-up Chemical Engineering of Inorganic Nanosolids by Assembly and Consolidation of NPs.
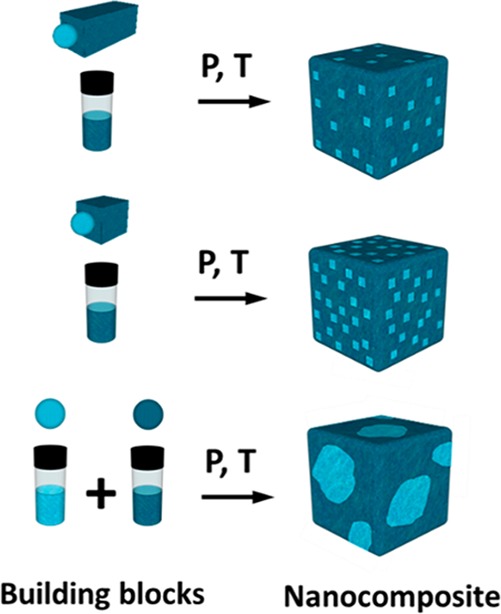
Heterostructured NRs with identical material A at the tips but with long (top) and short (middle) segments of material B in between allow for uniform distribution of the material A in the matrix of B. Such a strategy is presented in this study using colloidal heteronanorods that combine Ag2S (material A tips) with PbS (material B, rods). In contrast, mixing two separate colloids of materials A and B commonly leads to partial phase-segregation that is hard to predict and control (bottom image).
Another inherent and, in the context of this study, very useful attribute of colloidal nanomaterials is their high surface-to-volume ratio. On one hand, large specific surface areas are generally found to be detrimental, as they enhance oxidation20 or induce high densities of defects and uncontrolled impurities.21 On the other hand, NP surfaces may serve as a gateway22 to introduce needed amounts of dopants into the resulting semiconducting nanocomposites23−25 or to alter the overall composition.26,27 This convenient doping strategy and compositional engineerability of NPs can be harnessed for producing all-inorganic nanosolids with desired electronic properties. The proper surface treatment methodology needs to be conceived in each specific case to ensure that the initial insulating organic surfactants are removed, the surfaces are not oxidized, and controlled impurities are introduced from the chosen inorganic ligand upon consolidation. Herein, we outline such surface engineering methodology for colloidal PbS–Ag2S nanorods (NRs), whose native oleate capping molecules can be displaced with K2Te as inorganic surface ligands, eventually producing quintenary Pb–Ag–K–S–Te nanocomposites after thermal consolidation. We show tunable p-type transport of these composites by controlling the length of the original NRs, from 0.5 S cm–1 to 5 S cm–1. Additionally, the existence of multiple grain boundaries in nanocrystalline Pb–Ag–K–S–Te composites greatly reduce thermal conductivity, from typical bulk PbS values of ca. 2.5 W m–1 K–1,28 to 0.8 W m–1 K–1 at room temperature (rt).
Results and Discussion
On the Synthesis and Growth Mechanism of PbS–Ag2S NRs
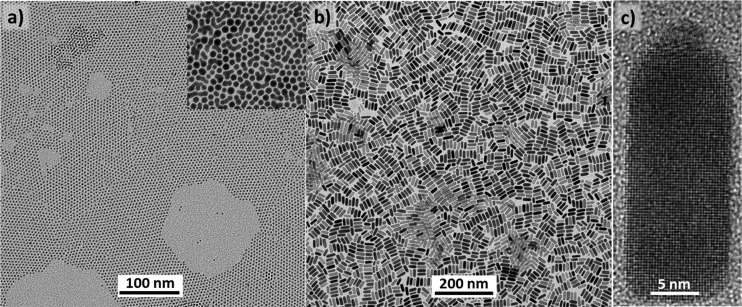
PbS–Ag2S NRs, each consisting of a PbS rod and a Ag2S tip, were produced in a three-step colloidal synthesis. First, monodisperse 2–3 nm Ag NPs (see transmission electron microscopy (TEM) images, Figure 1a) were produced using a well-established synthesis route.29 Subsequently, monodisperse Ag2S NPs (inset of Figure 1a) were prepared at rt by mixing Ag NPs with a solution of sulfur in oleylamine (OLA:S), nearly instantly leading to the color change into light-brown, characteristic of Ag2S NPs. In the last step, PbS–Ag2S NRs (Figure 1b,c) were obtained by injecting the crude solution of Ag2S NPs, still containing high quantity of OLA:S, into lead oleate dissolved in octadecene (ODE). Details can be found in the Methods.
Figure 1.
Representative TEM images of (a) Ag NPs, Ag2S NPs (inset in a) and (b) the corresponding Ag2S-PbS NRs. (c) HRTEM image of a single Ag2S-PbS NR.
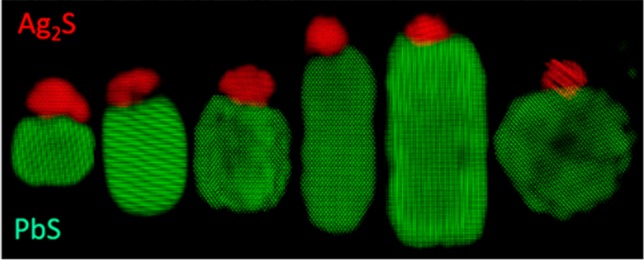
At one end of every NR an approximately hemispherical tip can be discerned by high-resolution TEM (HRTEM) imaging (Figures 1c and 2). This tip is identified as an orthorhombic Ag2S phase (space group P212121) by the detailed crystallographic analysis of the corresponding power spectrum (FFT). The FFT reveals that the tip has lattice parameters a = 0.6725 nm, b = 0.4148 nm, and c = 0.7294 nm, visualized along its [−103] axis, and that the NR body consists of a face-centered cubic PbS phase (space group = Fm3m) with lattice parameter a = 0.5936 nm, visualized along its [001] axis. The inset in Figure 2a shows the geometric-phase analysis (GPA) at the interface of both crystallographic phases. Purple arrows point to the misfit dislocations with a mismatch calculated from the GPA to be around 30% with respect to a perfectly relaxed NP. The colored structural map also suggests the epitaxial relationship between the PbS and the Ag2S phases. The epitaxy took place with the (020) plane (d020 = 0.207 nm) of Ag2S phase facing the (200) plane (d200 = 0.297 nm) of the PbS phase. The difference in plane spacing results in a clear misfit, and there are three Ag2S planes for every two PbS planes, which is in good agreement with the calculated mismatch.
Figure 2.
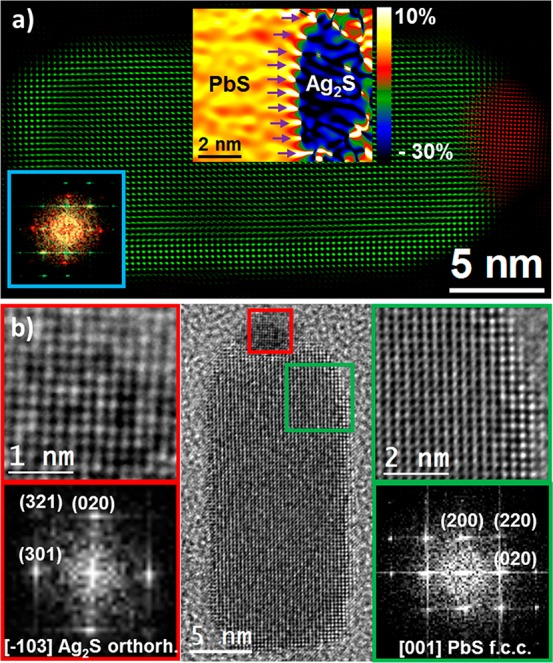
HRTEM image of a single PbS–Ag2S NR. (a) Colored structural map of a typical NR obtained from HRTEM, where red indicates the orthorhombic Ag2S phase and green indicates the face-centered cubic PbS phase. The bottom left inset corresponds to the power spectrum (FFT) used for structural map filtering, with spots colored following the same previous color code. The top middle inset corresponds to a GPA analysis obtained on the heterojunction between the PbS and the Ag2S phases. Purple arrows point to the misfit dislocations. (b) Detailed HRTEM analyses of the different crystal phases and their corresponding indexed FFT.
The narrow size distribution of the PbS–Ag2S NPs facilitated their assembly into superlattice structures, in particular, with the perpendicular alignment to the TEM grid. A square two-dimensional (2D) projection of these NRs can thus be imaged directly (Figure 3). In order to rule out the presence of cubic PbS NPs, high-angle annular dark-field scanning transmission electron microscopy (HAADF-STEM) micrographs and their corresponding surface plots (2D intensity profile) have been obtained (Figure 3c). For the same composition, HAADF intensity is determined by the probed thickness. As expected, the surface plot indicates higher intensities from rectangular profiles (vertically aligned NRs) as compared to elongated profiles (horizontally lying NRs).
Figure 3.
(a) TEM image of vertically aligned PbS–Ag2S NRs. (b) HRTEM micrograph showing vertically aligned NRs. Detail of the red squared region and its corresponding power spectrum (FFT). (c) STEM HAADF micrograph and its intensity profile.
Ag2S is an ionic conductor with a high concentration of Ag vacancies and in which Ag cations act as a fluid.30,31 Such behavior has allowed the use of Ag2S NPs as a catalyst to growth heterostructures of different types of semiconductors, such as Ag2S–ZnS,32−34 Ag2S–CdS,32,35 and Ag2S–CoS2.36 For the present case of PbS–Ag2S heterostructures, we assume that Pb ions dissolve in Ag2S and occupy Ag vacancies. As the concentration of Pb increases to the solubility limit, PbS cluster nucleates and continues to grow in a fashion similar to well-known solution–liquid–solid-catalyzed growth.37 Clearly, for a given concentration of Ag2S seeds, the NR length will be determined by the overall Ag/Pb ratio in the three-step synthesis described above. Figure 4 illustrates such length tunability from 9 to 44 nm, with the retention of the NR thickness at ca. 9–10 nm. XRD analysis, in agreement with the HRTEM study, corroborates that the NR growth direction is ⟨100⟩ (Figure 4b). It is important to note that the formation of anisotropic rodlike morphologies is hard to accomplish at high yield and good control over the dimensions and uniformity because this shape is very unusual for Pb chalcogenides due to their highly symmetric cubic crystal structure. Few known examples include ultranarrow (1.8 nm) PbS wires produced by decomposition of lead hexadecylxanthate in trioctylamine;38−40 single-crystalline PbS nanowires synthesized using a solvothermal reaction, chemical vapor transport, and gas-phase conversion reaction of pregrown CdS nanowires;41 PbS nanorods obtained via sequential cation exchange process;42 and ultrathin PbS sheets43 or PbSe nanowires44 formed by oriented attachment.
Figure 4.
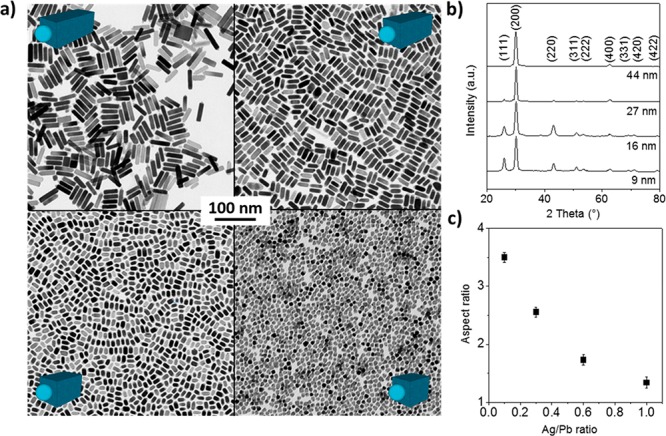
TEM micrographs of PbS–Ag2S NRs with different aspect ratios (a), corresponding XRD patterns (b), and dependence of the NR aspect ratio with respect to the Ag/Pb ratio (c).
An experiment extending the NR growth time from 3 to 5 min to 1 h illustrates the reduced thermodynamic stability of NRs with respect to spherical NPs, as can be seen from the conversion of NRs into uniform, ca. 15 nm large spherical PbS NPs (Figure 5). This transition occurs presumably after all lead oleate and sulfur precursors are consumed for the formation of NRs. An Ostwald-ripening-like process can be assumed.45,46 A ca. 3 nm large twinned Ag2S tip remains attached to the PbS NPs (Figure 5c). FFT of the HRTEM image confirmed an orthorhombic Ag2S phase with lattice parameters a = 0.6725 nm, b = 0.4148 nm, and c = 0.7294 nm, viewed along its [−120] axis; and the fcc PbS phase, viewed along its [011] axis. In this case, an epitaxial relationship between the (21–1) plane of Ag2S phase and the (1–11) plane of PbS phase is also observed, in which there are 4 Ag2S planes for every 3 PbS planes with an overall lattice mismatch of 4%.
Figure 5.
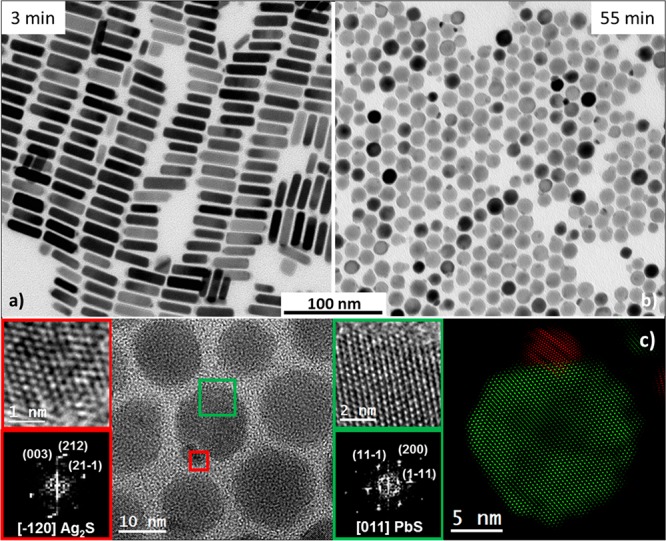
TEM images of (a) as-synthesized PbS–Ag2S NRs (growth time of 3 min) and (b) of the same sample aged for 55 min at 180 °C, showing conversion into spherical NPs. (c) HRTEM image of several spherical NPs; details of the red and green squared regions and their corresponding FFT. On the right, a colored structural map is presented, wherein the red color indicates an orthorhombic Ag2S phase and the green color indicates a face-centered cubic PbS phase.
Surface Chemical Engineering and Consolidation into Nanosolids
PbS–Ag2S NRs were initially stabilized by long-chain carboxylate groups, which were subsequently replaced with K2Te (Figure 6a). This inorganic surface functionalization can be used to introduce a p-type dopant (K) into metal chalcogenides as well as to adjust the composition by forming either metal telluride phases or by replacing some sulfur to form solid solutions.27 The ligand-exchange reaction was conducted via a phase-transfer process, in which PbS–Ag2S NRs migrated from the nonpolar phase (hexane) to the polar phase (N -methylformamide, MFA) due to the shift from steric to electrostatic mechanism of colloidal stabilization. The ligand-exchange process did not alter the XRD pattern of NRs. However, mild thermal treatments (210 °C, 10 min) induced an increase of the crystal domain size (SI) in the PbS phase as well as the emergence of a crystalline PbTe phase (Figure 6b), associated with the excess of Te2– ions in solution promoting a partial S2– to Te2– anion exchange.27,47 None of the known silver chalcogenide crystal phases could be identified by XRD, which can be attributed to the small crystal domains, low concentration, and the large quantity of peaks in the characteristic XRD pattern of orthorhombic silver chalcogenides.48−50
Figure 6.
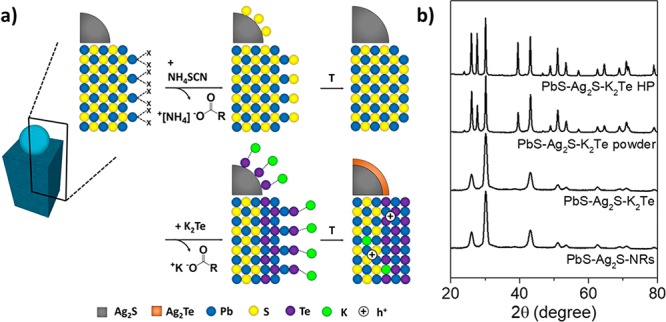
(a) Schematic of the effect of the ligand exchange processes at the surface of PbS used in this study. Analogous chemistry is assumed for Ag2S surfaces, not shown here. (b) XRD patterns of the as-synthesized (13 ± 1 nm) × (9 ± 1 nm) PbS–Ag2S NRs, the corresponding K2Te-surface modified NRs right after the ligand exchange (PbS–Ag2S–K 2Te) and after annealing at 210 °C (PbS–Ag2S–K2Te powder); hot-pressed (HP) resulting pellet (PbS–Ag2S–K 2Te, HP).
K2Te-functionalized PbS–Ag2S NRs were used as a precursor for K-doped Pb–Ag–S–Te nanocomposites (Pb–Ag–K–S–Te), with the aim of constructing efficient thermoelectric materials. To produce a nanocomposite with low porosity, precipitated and predried K2Te–PbS–Ag2S NRs were first annealed at 210 °C under argon to fully remove the physisorbed MFA solvent. Subsequently, the powder was hot-pressed into 10 mm in diameter and ca. 1 mm thick disk-shaped pellets by applying a uniaxial pressure of 40 MPa at 380–400 °C for 4 min. This consolidation yielded Pb–Ag–K–S–Te nanocomposites with relative densities between ∼90–92%. Their exact elemental composition was controlled by the rod lengths. Smaller NRs yield nanocomposites with larger Ag/Pb ratio, since the size of the Ag2S tip remains unchanged for all NR sizes. On the other hand, the smaller the NRs the larger is the surface-to-volume ratio and, hence, the K/Pb and Te/S ratios. Nanocomposites with the following elemental compositions as determined by ICP and Rietveld refinement, Pb0.81Ag0.16K0.03Te0.33S0.67 (13 × 9 nm NRs) and Pb0.89Ag0.10K0.01Te0.28S0.72 (20 × 10 nm NRs), were selected for the subsequent thermoelectric characterization.
To investigate the nanoscale structure, Pb0.81Ag0.16K0.03Te0.33S0.67 nanocomposite was studied in detail by HRTEM (Figure 7), revealing a large density of nanosized crystalline domains and interfaces. Largest crystal domains correspond to PbTe and PbS crystal phases, in agreement with narrow and intense XRD reflections. A closer look at the crystal structure of some of the nanoscale inclusions reveals the presence of Ag2S, Ag2Te and PbS NPs within the Pb–chalcogenide matrix (Figure 7b).
Figure 7.
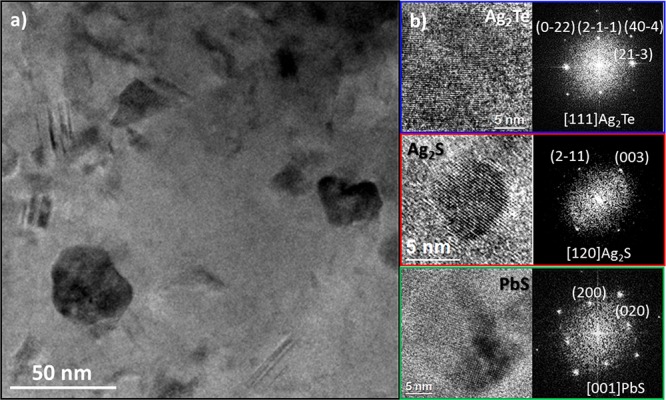
(a) TEM image of a Pb0.81Ag0.16K0.03Te0.37S0.67 nanocomposite and (b) HRTEM images along with their FFTs for typical inclusions (Ag2Te, Ag2S, PbS).
Electronic and Thermal Properties
Temperature-dependent measurements of the electrical conductivity and Seebeck coefficients are presented in Figure 8 for Pb0.81Ag0.16K0.03Te0.33S0.67 and Pb0.89Ag0.10K0.01Te0.28S0.72 materials. Both nanosolids exhibit positive Seebeck coefficients indicating a p-type electronic transport. Smaller NRs yielded nanocomposites with higher electrical conductivities in the whole temperature range, in agreement with the higher contents of a dopant (K) in the material produced with smaller NRs. Correspondingly, larger carrier concentrations were found for Pb0.81Ag0.16K0.03Te0.33S0.67 (p = 1 × 1019 cm–3) when compared with Pb0.89Ag0.10K0.01Te0.28S0.72 (p = 8 × 1018 cm–3). Several additional reference experiments, described below and summarized in Figure 9 in terms of transport properties, had confirmed the importance of each component in the Pb0.81Ag0.16K0.03Te0.33S0.67 nanocomposite. First, the functionalization with K2Te was excluded and replaced with NH4SCN treatment, thereby reducing the number of elements in a consolidated material to three (denoted as Pb–Ag–S material). To exclude Ag, pure PbS NPs were ligand-exchanged with either K2Te (a Pb–K–S-Te material) or NH4SCN (a Pb–S material).
Figure 8.
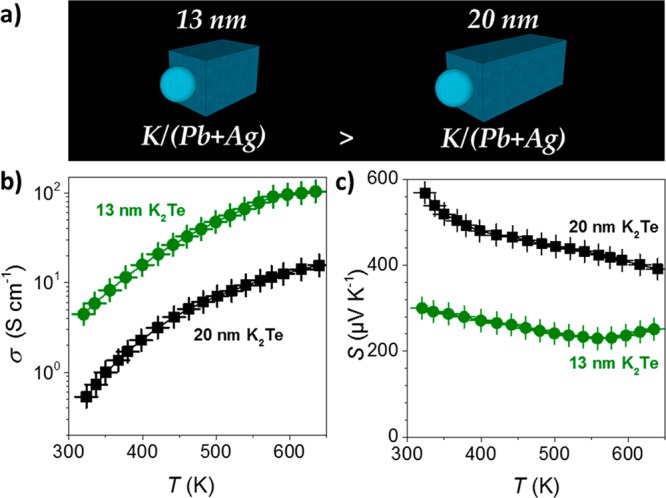
(a) 13 and 20 nm NRs used to build up Pb0.81Ag0.16K0.03Te0.33S0.67 and Pb0.89Ag0.10K0.01Te0.28S0.72 nanocomposites, respectively, and the corresponding (b) electrical conductivity, σ, and (c) Seebeck coefficient, S.
Figure 9.
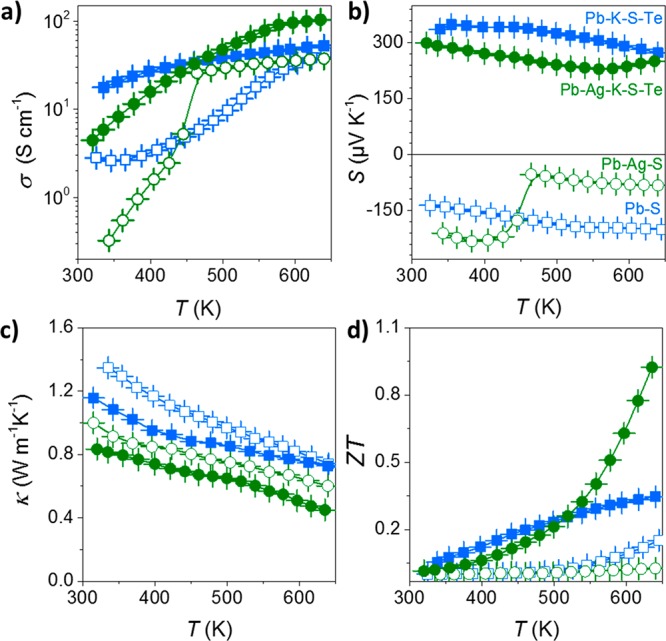
(a) Electrical conductivity, σ; (b) Seebeck coefficient, S; (c) thermal conductivity, κ; (d) thermoelectric figure of merit, ZT, of Pb–S, Pb–Ag–S, Pb–K–S–Te, and Pb–Ag–K–S–Te nanocomposites.
K-free materials (Pb–Ag–S and Pb–S; open symbols in Figure 9) are characterized by lower electrical conductivities and negative Seebeck coefficients in the whole temperature range. In the case of Pb–Ag–S, as the temperature increased, a pronounced change at 450 K of the electrical conductivity as well as the Seebeck coefficient was observed, which is associated with the phase transition from the low temperature orthorhombic β-Ag2S to the high-temperature cubic α-Ag2S phase.51 The high-temperature phase contains both electrons and Ag ions that are mobile.52 The contribution of Ag ions to the transport properties increases the electrical conductivity, but their p-type nature induces bipolar effects reducing the absolute value of the Seebeck coefficient to near −10 μV/K. Despite the fact that Ag can partially dissolve into Pb chalcogenide and then act as a p-type dopant,53,54 in our composite Ag doping was not efficient enough to change majority of carriers in the Pb–Ag–S nanocomposite. On the contrary, the K2Te treatment induces a change of the type of the majority carriers in the nanocomposites (Pb–S–K–Te and Pb–Ag–K–S–Te), seen as a change of the sign of Seebeck coefficient from negative to positive and larger electrical conductivities in the whole temperature range indicating an efficient p-type doping (solid symbols).
Ag-free nanocomposites (blue squares) exhibited larger thermal conductivities than Pb–Ag–S or Pb–Ag–K–S–Te, indicating a significant role of Ag for enhanced phonon scattering. The presence of Ag2S and Ag2Te NPs in the Pb–chalcogenide matrix with the mutual lattice mismatch might be the reason for a more efficient phonon scattering. Additionally, the ionic nature of silver chalcogenides compounds, with high mobility of Ag ions, can further reduce the thermal conductivity by scattering short-wavelength phonons.55
On the basis of the measured electrical conductivities, Seebeck coefficients, and thermal conductivities, one can estimate a thermoelectric figure-of-merit (ZT = σS2Tκ–1) of the obtained materials. The highest ZT value of ca. 1 at 620 K was obtained for Pb–Ag–K–S–Te nanocomposites, which is 3-fold higher with respect to Pb–S–Te nanocomposites.
Conclusions
In summary, a possibility of the fully rational control of electrical and thermal characteristics of a multicomponent thermoelectric material, Pb–Ag–K–S–Te in this study, by the multistep bottom-up engineering is presented. In particular, shown is the preassembly of Pb, Ag, and S atoms into a Ag2S–PbS NR morphology with tunable PbS rod lengths by means of colloidal synthesis from monodisperse Ag NPs that were consequently converted into Ag2S NP seeds, which are immediately used for formation of PbS rods. Ag2S–PbS NRs were then surface-functionalized with K2Te, followed by consolidation into all-inorganic five-component Pb–Ag–K–S–Te nanomaterials, whose chemical composition is adjustable by the size of the initial rods. Efficient suppression of thermal conductivity was attained due to nanoscale homogeneity of the mixing of the grains of several binary and ternary crystal phases. Efficient p-type transport was imparted by efficient substitutional doping with K ions. Overall, the combined effect of such engineering is a high ZT value of ca. 1 at 620 K.
Experimental Methods
Chemicals and Materials
Lead(II) oxide (PbO, 99.9%), oleic acid (OA, 90%, technical grade), 1-octadecene (ODE, 90%, technical grade), sulfur (S, 99.998%, trace metals basis), oleylamine (OLA, min. 95%), silver nitrate (AgNO3, ≥ 99.8%), iron(III) nitrate nonahydrate (Fe(NO3)3·9H2O, 99.99%), K (cubes in mineral oil 99.5%, trace metals basis), Te powder (99.999%), N-methylformamide (MFA, 99%), and hydrazine (N2H4) were obtained from Sigma-Aldrich. Anhydrous hexane, ethanol, 2-propanol, and acetone were obtained from various sources. All chemicals were used as received without further purification. MFA was dried over 4 Å molecular sieves at room temperature (rt) under an Ar flow for 20 h and then filtered using hydrophobic syringe filters. Standard airless techniques were used: a vacuum/dry argon Schlenk line for synthesis and an argon glovebox for storage and handling of air- and moisture-sensitive chemicals.
PbS NPs with a mean edge size of 11 nm were prepared similarly to previously reported procedures.23 In a typical synthesis, PbO (4.46 g, 20 mmol) and OA (50 mL, 0.158 mol) were mixed with 100 mL of ODE. This mixture was degassed at rt and 100 °C for 0.5 h each to form the lead oleate complex and remove low boiling point impurities. Then the solution was flushed with Ar, and the temperature was raised to 210 °C. At this temperature, a sulfur precursor, prepared by dissolving elemental sulfur (0.64 g, 20 mmol) in OLA (20 mL, 0.061 mol), was rapidly injected. The reaction mixture was maintained between 195 and 210 °C for 5 min and then quickly cooled to rt using a water bath. The obtained NPs were washed inside the glovebox by three precipitation/redispersion steps using hexane as solvent and ethanol as nonsolvent. Isolated NPs were dried under vacuum and then redispersed in hexane for further use.
Synthesis of Ag/Ag2S NPs/Seeds
Ag NPs with an average diameter of 2–3 nm were produced using a modified approach of that reported by Wang et al.29 In a typical reaction, AgNO3 (0.17 g, 1 mmol), Fe(NO3)3·9H2O (0.04 g, 0.01 mmol), OA (10 mL, 31.6 mmol), and OLA (10 mL, 30.5 mmol) were mixed and degassed under Ar at rt for 0.5 h. Afterward, the reaction mixture was heated to 120 °C at a rate of 5 °C min–1 and kept at this temperature for an additional 60 min. To form Ag2S seeds, Ag NPs were mixed with a OLA/S solution (5 mL/0.16 g, 5 mmol). Immediately after OLA/S was mixed with the Ag NPs, the solution changed color from yellow to light brown, indicating the formation of Ag2S seeds.
Synthesis of PbS–Ag2S NRs
PbO (1.115 g, 5 mmol), OA (12.5 mL, 0.04 mol), and ODE (25 mL) were combined in a three-neck flask. This mixture was degassed under vacuum at rt and 100 °C for at least 0.5 h each to form a lead oleate complex and to remove low-boiling-point impurities. Then the solution was flushed with Ar, and the temperature was raised to 180 °C. At this temperature the OLA/S–Ag solution was rapidly injected at 180 °C into the lead oleate complex solution. After 3 min, the reaction mixture was quickly cooled to rt using a water bath. The obtained NRs were washed inside the glovebox by three precipitation/redispersion steps using hexane as a solvent and 2-propanol as a nonsolvent. The washed NRs were dried using vacuum/Ar and then redispersed in hexane for further use.
K2Te Synthesis
K2Te was synthesized in liquid ammonia from the elemental potassium and tellurium in stoichiometric quantities. Typically, 29.2 mmol of K and 14.6 mmol of Te were placed into a 500 mL Schlenk vessel. Dry ammonia was then condensed into this reaction vessel, which was cooled with a dried ice/acetone bath. A beige powder was obtained after complete evaporation of ammonia. K2Te powder was stored and handled in an Ar-filled glovebox.
Ligand Exchange with K2Te
A 7 mM K2Te solution in MFA was prepared in an Ar-filled glovebox. Anhydrous hydrazine was added to generate a reducing environment (4 μL per milliliter of MFA). Equal volumes of K2Te/MFA solution and hexane solution of NPs (5 mg/mL) were combined in a vial and vigorously stirred at rt in an Ar-filled glovebox for 16 h. After its complete discoloration, the hexane phase was decanted and the remaining polar phase was rinsed with pure hexane. Acetone was added to the remaining polar phase, and the mixture was centrifuged to precipitate the NPs. NPs were then washed one more time with acetone, centrifuged, dried under vacuum, and stored in the glovebox for further use.
Ligand Exchange with NH4SCN
The native ligands were removed by mixing 6 mL of a 130 mM NH4SCN solution in methanol with 1 g of NPs suspended in anhydrous chloroform. NPs were then purified using chloroform and methanol to remove free carboxylic acid and excess NH4SCN, respectively.
Consolidation of NPs into Pellets
In all cases, surface-modified NPs were dried from solution under vacuum. Afterward, NPs were annealed at 210 °C on a heating plate in an Ar-filled glovebox for approximately 20 h to remove remaining volatile organics before the pellet fabrication. NPs powders were pressed using a custom-made hot press. In this system, the heat was provided by an induction coil operated in the RF range applied directly to a graphite die acting as a susceptor. This setup configuration allows increasing temperature at a similar rate as spark plasma sintering. Inside the glovebox, powders were ground into fine powder and loaded into a 10 mm diameter graphite die lined with 0.13 mm thick graphite paper. The filled die was placed in the hot press system. The densification profile applied an axial pressure of ∼40 MPa before the die was heated to 300 °C. The temperature was held between 400 and 420 °C for 5 min. The pressure was then removed and the die cooled to room temperature. The resulting pellets were ca. 90% dense, ca. 1 mm thick, 10 mm in diameter, and air stable. The density of the pressed pellets was measured by the Archimedes method.
X-ray Diffraction
XRD analysis was performed directly on the as-synthesized NPs before and after the ligand exchange as well as after the annealing and on the final pellets. The measurements were done in a Bruker D8 Advance powder diffractometer equipped with an M. Braun 50 m position sensitive detector, Bragg–Brentano geometry, Cu Kα1 radiation (1.54059 Å), focusing Ge monochromator.
(S)TEM Characterization
High-resolution transmission electron microscopy (HRTEM) and high angle annular dark field scanning TEM (HAADF STEM) images have been obtained by means of a FEI Tecnai field emission gun microscope with a 0.19 nm point-to-point resolution at 200 keV equipped with an embedded Quantum Gatan image filter (Quantum GIF) for spectrum imaging (SI) EELS analyses. Images have been analyzed by means of Gatan Digital Micrograph software. Structure phase color maps have been generated also with the latest software in order to differentiate the different heterostructures.56
Thermoelectric Characterization
Electrical Properties
The pressed samples were polished, maintaining the disk-shape morphology. Final pellets had a 10 mm diameter and were approximately 1 mm thick. The Seebeck coefficient was measured using a static DC method. Electrical resistivity data were obtained by a standard four-probe method. Both the Seebeck coefficient and the electrical resistivity were simultaneously measured with accuracies better than 1% in a LSR-3 LINSEIS system from rt to 650 K, under helium atmosphere. Samples were held between two alumel electrodes and two probe thermocouples with spring-loaded pressure contacts. A resistive heater on the lower electrode created temperature differentials in the sample to determine the Seebeck coefficient. Note: The results presented in the manuscript are an average of the results obtained after measuring two pellets produced under identical conditions. The measurements between different samples had standard deviations below 10%. Additionally, each pellet was measured three times, providing very little hysteresis between the heating and cooling cycles. The major difference was found in the first measurement. Therefore, all of the measurements presented in the manuscript correspond to the heating cycle of the second measurement.
Thermal Properties
An XFA 600 xenon flash apparatus was used to determine the thermal diffusivities of all samples with an accuracy of ca. 6%. Total thermal conductivity (κ) was calculated using the relation κ = DCpρ, where D is the thermal diffusivity, Cp is the heat capacity, and ρ is the mass density of the pellet. The ρ values were calculated using the Archimedes method. The heat capacity was calculated using the Dulong–Petit limit, taking into account the different phases of the nanocomposites and their content considering no alloying/doping.
Hall Measurement
Hall carrier concentrations and mobilities at rt were measured using a magnetic field of 2 T with a PPMS-9T (Quantum Design Inc., USA). Values reported correspond to the average of five consecutive measurements, from which an error of ca. 10% was estimated.
Acknowledgments
This work was financially supported by the European Union (EU) via FP7 ERC Starting Grant 2012 (Project NANOSOLID, GA No. 306733). M.I. was supported by IST Austria and by ETH Zurich via an ETH career seed grant (SEED-18 16-2). Y.L. acknowledges funding from the European Union’s Horizon 2020 research and innovation programme under the Marie Sklodowska-Curie Grant Agreement No. 754411. IREC receives funding from Generalitat de Catalunya (2014SGR1638). ICN2 acknowledge funding from Generalitat de Catalunya 2017 SGR 327 and the Spanish MINECO project ENE2017-85087-C3. ICN2 is supported by the Severo Ochoa program from Spanish MINECO (Grant No. SEV-2017-0706) and is funded by the CERCA Programme/Generalitat de Catalunya.
Supporting Information Available
The Supporting Information is available free of charge on the ACS Publications website at DOI: 10.1021/acsnano.9b00346.
Pictures of the different steps involved in the ligand-exchange reaction, TEM images of the different NPs after ligand exchange, STEM-EELS elemental composition maps, SEM–EDX elemental maps of different pellets, crystal domain size estimations, heat capacity values, and electric properties of the Pb–Ag–K–S–Te nanocomposite (PDF)
The authors declare no competing financial interest.
Supplementary Material
References
- Kao J.; Thorkelsson K.; Bai P.; Rancatore B. J.; Xu T. Toward Functional Nanocomposites: Taking the Best of Nanoparticles, Polymers, and Small Molecules. Chem. Soc. Rev. 2013, 42, 2654–2678. 10.1039/C2CS35375J. [DOI] [PubMed] [Google Scholar]
- Luo Z.; Martí-Sànchez S.; Nafria R.; Joshua G.; de la Mata M.; Guardia P.; Flox C.; Martínez-Boubeta C.; Simeonidis K.; Llorca J.; Morante J. R.; Arbiol J.; Ibáñez M.; Cabot A. Fe3O4@NiFexOy Nanoparticles with Enhanced Electrocatalytic Properties for Oxygen Evolution in Carbonate Electrolyte. ACS Appl. Mater. Interfaces 2016, 8, 29461–29469. 10.1021/acsami.6b09888. [DOI] [PubMed] [Google Scholar]
- Jeon K.-J.; Moon H. R.; Ruminski A. M.; Jiang B.; Kisielowski C.; Bardhan R.; Urban J. J. Air-Stable Magnesium Nanocomposites Provide Rapid and High-Capacity Hydrogen Storage without Using Heavy-Metal Catalysts. Nat. Mater. 2011, 10, 286–290. 10.1038/nmat2978. [DOI] [PubMed] [Google Scholar]
- Mahmood N.; Zhang C.; Yin H.; Hou Y. Graphene-Based Nanocomposites for Energy Storage and Conversion in Lithium Batteries, Supercapacitors and Fuel Cells. J. Mater. Chem. A 2014, 2, 15–32. 10.1039/C3TA13033A. [DOI] [Google Scholar]
- Cong H.; Radosz M.; Towler B. F.; Shen Y. Polymer–Inorganic Nanocomposite Membranes for Gas Separation. Sep. Purif. Technol. 2007, 55, 281–291. 10.1016/j.seppur.2006.12.017. [DOI] [Google Scholar]
- Seger B.; Kamat P. V. Electrocatalytically Active Graphene-Platinum Nanocomposites. Role of 2-D Carbon Support in PEM Fuel Cells. J. Phys. Chem. C 2009, 113, 7990–7995. 10.1021/jp900360k. [DOI] [Google Scholar]
- Kanatzidis M. G. Advances in Thermoelectrics: From Single Phases to Hierarchical Nanostructures and Back. MRS Bull. 2015, 40, 687–695. 10.1557/mrs.2015.173. [DOI] [Google Scholar]
- Ibáñez M.; Luo Z.; Genc A.; Piveteau L.; Ortega S.; Cadavid D.; Dobrozhan O.; Liu Y.; Nachtegaal M.; Zebarjadi M.; Arbiol J.; Kovalenko M. V.; Cabot A. High-Performance Thermoelectric Nanocomposites from Nanocrystal Building Blocks. Nat. Commun. 2016, 7, 10766. 10.1038/ncomms10766. [DOI] [PMC free article] [PubMed] [Google Scholar]
- Ibáñez M.; Zamani R.; Gorsse S.; Fan J.; Ortega S.; Cadavid D.; Morante J. R.; Arbiol J.; Cabot A. Core-Shell Nanoparticles As Building Blocks for the Bottom-Up Production of Functional Nanocomposites: PbTe-PbS Thermoelectric Properties. ACS Nano 2013, 7, 2573–2586. 10.1021/nn305971v. [DOI] [PubMed] [Google Scholar]
- Liu Y.; Zhang Y.; Lim K. H.; Ibáñez M.; Ortega S.; Li M.; David J.; Martí-Sánchez S.; Ng K. M.; Arbiol J.; Kovalenko M. V.; Cadavid D.; Cabot A. High Thermoelectric Performance in Crystallographically Textured n-Type Bi2Te3–xSex Produced from Asymmetric Colloidal Nanocrystals. ACS Nano 2018, 12, 7174–7184. 10.1021/acsnano.8b03099. [DOI] [PubMed] [Google Scholar]
- Liu Y.; Zhang Y.; Ortega S.; Ibáñez M.; Lim K. H.; Grau-Carbonell A.; Martí-Sánchez S.; Ng K. M.; Arbiol J.; Kovalenko M. V.; Cadavid D.; Cabot A. Crystallographically Textured Nanomaterials Produced from the Liquid Phase Sintering of BixSb2–xTe3 Nanocrystal Building Blocks. Nano Lett. 2018, 18, 2557–2563. 10.1021/acs.nanolett.8b00263. [DOI] [PubMed] [Google Scholar]
- Ortega S.; Ibáñez M.; Liu Y.; Zhang Y.; Kovalenko M. V.; Cadavid D.; Cabot A. Bottom-Up Engineering of Thermoelectric Nanomaterials and Devices from Solution-Processed Nanoparticle Building Blocks. Chem. Soc. Rev. 2017, 46, 3510–3528. 10.1039/C6CS00567E. [DOI] [PubMed] [Google Scholar]
- Boles M. A.; Engel M.; Talapin D. V. Self-Assembly of Colloidal Nanocrystals: From Intricate Structures to Functional Materials. Chem. Rev. 2016, 116, 11220–11289. 10.1021/acs.chemrev.6b00196. [DOI] [PubMed] [Google Scholar]
- Cadavid D.; Ibáñez M.; Gorsse S.; López A.; Cirera A.; Morante J.; Cabot A. Bottom-Up Processing of Thermoelectric Nanocomposites from Colloidal Nanocrystal Building Blocks: the Case of Ag2Te–PbTe. J. Nanopart. Res. 2012, 14, 1–10. 10.1007/s11051-012-1328-0.22448125 [DOI] [Google Scholar]
- Ibáñez M.; Hasler R.; Genç A.; Liu Y.; Kuster B.; Schuster M.; Dobrozhan O.; Cadavid D.; Arbiol J.; Cabot A.; Kovalenko M. V. Ligand-Mediated Band Engineering in Bottom-Up Assembled SnTe Nanocomposites for Thermoelectric Energy Conversion. J. Am. Chem. Soc. 2019, 141, 8025–8029. 10.1021/jacs.9b01394. [DOI] [PMC free article] [PubMed] [Google Scholar]
- Yang H.; Bahk J.-H.; Day T.; Mohammed A. M. S.; Snyder G. J.; Shakouri A.; Wu Y. Enhanced Thermoelectric Properties in Bulk Nanowire Heterostructure-Based Nanocomposites through Minority Carrier Blocking. Nano Lett. 2015, 15, 1349–1355. 10.1021/nl504624r. [DOI] [PubMed] [Google Scholar]
- Xu B.; Agne M. T.; Feng T.; Chasapis T. C.; Ruan X.; Zhou Y.; Zheng H.; Bahk J.-H.; Kanatzidis M. G.; Snyder G. J.; Wu Y. Nanocomposites from Solution-Synthesized PbTe-BiSbTe Nanoheterostructure with Unity Figure of Merit at Low-Medium Temperatures (500–600 K). Adv. Mater. 2017, 29, 1605140. 10.1002/adma.201605140. [DOI] [PubMed] [Google Scholar]
- Fang H.; Feng T.; Yang H.; Ruan X.; Wu Y. Synthesis and Thermoelectric Properties of Compositional-Modulated Lead Telluride–Bismuth Telluride Nanowire Heterostructures. Nano Lett. 2013, 13, 2058–2063. 10.1021/nl400319u. [DOI] [PubMed] [Google Scholar]
- Fang H.; Yang H.; Wu Y. Thermoelectric Properties of Silver Telluride–Bismuth Telluride Nanowire Heterostructure Synthesized by Site-Selective Conversion. Chem. Mater. 2014, 26, 3322–3327. 10.1021/cm501188c. [DOI] [Google Scholar]
- de Kergommeaux A.; Faure-Vincent J.; Pron A.; de Bettignies R.; Malaman B.; Reiss P. Surface Oxidation of Tin Chalcogenide Nanocrystals Revealed by 119Sn–Mössbauer Spectroscopy. J. Am. Chem. Soc. 2012, 134, 11659–11666. 10.1021/ja3033313. [DOI] [PubMed] [Google Scholar]
- Almeida A. J.; Sahu A.; Riedinger A.; Norris D. J.; Brandt M. S.; Stutzmann M.; Pereira R. N. Charge Trapping Defects in CdSe Nanocrystal Quantum Dots. J. Phys. Chem. C 2016, 120, 13763–13770. 10.1021/acs.jpcc.6b00910. [DOI] [Google Scholar]
- De Roo J.; De Keukeleere K.; Hens Z.; Van Driessche I. From Ligands to Binding Motifs and Beyond; the Enhanced Versatility of Nanocrystal Surfaces. Dalton Trans 2016, 45, 13277–13283. 10.1039/C6DT02410F. [DOI] [PubMed] [Google Scholar]
- Ibáñez M.; Korkosz R. J.; Luo Z.; Riba P.; Cadavid D.; Ortega S.; Cabot A.; Kanatzidis M. G. Electron Doping in Bottom-Up Engineered Thermoelectric Nanomaterials through HCl-Mediated Ligand Displacement. J. Am. Chem. Soc. 2015, 137, 4046–4049. 10.1021/jacs.5b00091. [DOI] [PubMed] [Google Scholar]
- Stavrinadis A.; Konstantatos G. Strategies for the Controlled Electronic Doping of Colloidal Quantum Dot Solids. ChemPhysChem 2016, 17, 632–644. 10.1002/cphc.201500834. [DOI] [PubMed] [Google Scholar]
- Thon S. M.; Ip A. H.; Voznyy O.; Levina L.; Kemp K. W.; Carey G. H.; Masala S.; Sargent E. H. Role of Bond Adaptability in the Passivation of Colloidal Quantum Dot Solids. ACS Nano 2013, 7, 7680–7688. 10.1021/nn4021983. [DOI] [PubMed] [Google Scholar]
- Oh S. J.; Berry N. E.; Choi J.-H.; Gaulding E. A.; Paik T.; Hong S.-H.; Murray C. B.; Kagan C. R. Stoichiometric Control of Lead Chalcogenide Nanocrystal Solids to Enhance Their Electronic and Optoelectronic Device Performance. ACS Nano 2013, 7, 2413–2421. 10.1021/nn3057356. [DOI] [PubMed] [Google Scholar]
- Ibáñez M.; Hasler R.; Liu Y.; Dobrozhan O.; Nazarenko O.; Cadavid D.; Cabot A.; Kovalenko M. V. Tuning p-Type Transport in Bottom-Up-Engineered Nanocrystalline Pb Chalcogenides Using Alkali Metal Chalcogenides as Capping Ligands. Chem. Mater. 2017, 29, 7093–7097. 10.1021/acs.chemmater.7b02967. [DOI] [PMC free article] [PubMed] [Google Scholar]
- Zhao L.-D.; He J.; Hao S.; Wu C.-I.; Hogan T. P.; Wolverton C.; Dravid V. P.; Kanatzidis M. G., Raising the Thermoelectric Performance of p-Type PbS with Endotaxial Nanostructuring and Valence-Band Offset Engineering Using CdS and ZnS. J. Am. Chem. Soc. 2012.13416327. 10.1021/ja306527n [DOI] [PubMed] [Google Scholar]
- Li L.; Hu F.; Xu D.; Shen S.; Wang Q. Metal Ion Redox Potential Plays an Important Role in High-Yield Synthesis of Monodisperse Silver Nanoparticles. Chem. Commun. 2012, 48, 4728–4730. 10.1039/c2cc18152e. [DOI] [PubMed] [Google Scholar]
- Wagner C. Investigations on Silver Sulfide. J. Chem. Phys. 1953, 21, 1819–1827. 10.1063/1.1698670. [DOI] [Google Scholar]
- Hebb M. H. Electrical Conductivity of Silver Sulfide. J. Chem. Phys. 1952, 20, 185–190. 10.1063/1.1700165. [DOI] [Google Scholar]
- Zhu G.; Xu Z. Controllable Growth of Semiconductor Heterostructures Mediated by Bifunctional Ag2S Nanocrystals as Catalyst or Source-Host. J. Am. Chem. Soc. 2011, 133, 148–157. 10.1021/ja1090996. [DOI] [PubMed] [Google Scholar]
- Shen S.; Zhang Y.; Liu Y.; Peng L.; Chen X.; Wang Q. Manganese-Doped Ag2S-ZnS Heteronanostructures. Chem. Mater. 2012, 24, 2407–2413. 10.1021/cm301342z. [DOI] [Google Scholar]
- Shen S.; Zhang Y.; Peng L.; Du Y.; Wang Q. Matchstick-Shaped Ag2S–ZnS Heteronanostructures Preserving both UV/Blue and Near-Infrared Photoluminescence. Angew. Chem., Int. Ed. 2011, 50, 7115–7118. 10.1002/anie.201101084. [DOI] [PubMed] [Google Scholar]
- Zhang Y.; Shen S.; Wang Q. Controllable Growth of Ag2S-CdS Heteronanostructures. CrystEngComm 2014, 16, 9501–9505. 10.1039/C4CE00694A. [DOI] [Google Scholar]
- Ag2S–CoS2 Hetero-Nanostructures: One-Pot Colloidal Synthesis and Improved Magnetic Properties. Funct. Mater. Lett. 2014, 7, 1450024. [Google Scholar]
- Wang F.; Dong A.; Buhro W. E. Solution–Liquid–Solid Synthesis, Properties, and Applications of One-Dimensional Colloidal Semiconductor Nanorods and Nanowires. Chem. Rev. 2016, 116, 10888–10933. 10.1021/acs.chemrev.5b00701. [DOI] [PubMed] [Google Scholar]
- Patla I.; Acharya S.; Zeiri L.; Israelachvili J.; Efrima S.; Golan Y. Synthesis, Two-Dimensional Assembly, and Surface Pressure-Induced Coalescence of Ultranarrow PbS Nanowires. Nano Lett. 2007, 7, 1459–1462. 10.1021/nl070001q. [DOI] [PubMed] [Google Scholar]
- Acharya S.; Gautam U. K.; Sasaki T.; Bando Y.; Golan Y.; Ariga K. Ultra Narrow PbS Nanorods with Intense Fluorescence. J. Am. Chem. Soc. 2008, 130, 4594–4595. 10.1021/ja711064b. [DOI] [PubMed] [Google Scholar]
- Acharya S.; Sarma D. D.; Golan Y.; Sengupta S.; Ariga K. Shape-Dependent Confinement in Ultrasmall Zero-, One-, and Two-Dimensional PbS Nanostructures. J. Am. Chem. Soc. 2009, 131, 11282–11283. 10.1021/ja903539d. [DOI] [PubMed] [Google Scholar]
- Jang S. Y.; Song Y. M.; Kim H. S.; Cho Y. J.; Seo Y. S.; Jung G. B.; Lee C.-W.; Park J.; Jung M.; Kim J.; Kim B.; Kim J.-G.; Kim Y.-J. Three Synthetic Routes to Single-Crystalline PbS Nanowires with Controlled Growth Direction and Their Electrical Transport Properties. ACS Nano 2010, 4, 2391–2401. 10.1021/nn100163k. [DOI] [PubMed] [Google Scholar]
- Luther J. M.; Zheng H.; Sadtler B.; Alivisatos A. P. Synthesis of PbS Nanorods and Other Ionic Nanocrystals of Complex Morphology by Sequential Cation Exchange Reactions. J. Am. Chem. Soc. 2009, 131, 16851–16857. 10.1021/ja906503w. [DOI] [PubMed] [Google Scholar]
- Schliehe C.; Juarez B. H.; Pelletier M.; Jander S.; Greshnykh D.; Nagel M.; Meyer A.; Foerster S.; Kornowski A.; Klinke C.; Weller H. Ultrathin PbS Sheets by Two-Dimensional Oriented Attachment. Science 2010, 329, 550–553. 10.1126/science.1188035. [DOI] [PubMed] [Google Scholar]
- Cho K.-S.; Talapin D. V.; Gaschler W.; Murray C. B. Designing PbSe Nanowires and Nanorings Through Oriented Attachment of Nanoparticles. J. Am. Chem. Soc. 2005, 127, 7140–7147. 10.1021/ja050107s. [DOI] [PubMed] [Google Scholar]
- Talapin D. V.; Rogach A. L.; Haase M.; Weller H. Evolution of an Ensemble of Nanoparticles in a Colloidal Solution: Theoretical Study. J. Phys. Chem. B 2001, 105, 12278–12285. 10.1021/jp012229m. [DOI] [Google Scholar]
- Voorhees P. W. The Theory of Ostwald Ripening. J. Stat. Phys. 1985, 38, 231–252. 10.1007/BF01017860. [DOI] [Google Scholar]
- Hewavitharana I. K.; Brock S. L. When Ligand Exchange Leads to Ion Exchange: Nanocrystal Facets Dictate the Outcome. ACS Nano 2017, 11, 11217–11224. 10.1021/acsnano.7b05534. [DOI] [PubMed] [Google Scholar]
- Yang H.; Bahk J.-H.; Day T.; Mohammed A. M. S.; Min B.; Snyder G. J.; Shakouri A.; Wu Y. Composition Modulation of Ag2Te Nanowires for Tunable Electrical and Thermal Properties. Nano Lett. 2014, 14, 5398–5404. 10.1021/nl502551c. [DOI] [PubMed] [Google Scholar]
- Cadavid D.; Ibáñez M.; Shavel A.; Dura O. J.; Lopez de la Torre M. A.; Cabot A. Organic Ligand Displacement by Metal Salts to Enhance Nanoparticle Functionality: Thermoelectric Properties of Ag2Te. J. Mater. Chem. A 2013, 1, 4864–4870. 10.1039/c3ta01455j. [DOI] [Google Scholar]
- Wang D.; Xie T.; Peng Q.; Li Y. Ag, Ag2S, and Ag2Se Nanocrystals: Synthesis, Assembly, and Construction of Mesoporous Structures. J. Am. Chem. Soc. 2008, 130, 4016–4022. 10.1021/ja710004h. [DOI] [PubMed] [Google Scholar]
- Santamaría-Pérez D.; Marqués M.; Chuliá-Jordán R.; Menendez J. M.; Gomis O.; Ruiz-Fuertes J.; Sans J. A.; Errandonea D.; Recio J. M. Compression of Silver Sulfide: X-Ray Diffraction Measurements and Total-Energy Calculations. Inorg. Chem. 2012, 51, 5289–5298. 10.1021/ic300236p. [DOI] [PubMed] [Google Scholar]
- Miyatami S.-y. α-Ag2S as a Mixed Conductor. J. Phys. Soc. Jpn. 1968, 24, 328–336. 10.1143/JPSJ.24.328. [DOI] [Google Scholar]
- Wang S.; Zheng G.; Luo T.; She X.; Li H.; Tang X. Exploring the Doping Effects of Ag in p-Type PbSe Compounds with Enhanced Thermoelectric Performance. J. Phys. D: Appl. Phys. 2011, 44, 475304. 10.1088/0022-3727/44/47/475304. [DOI] [Google Scholar]
- Zheng Y.; Wang S.; Liu W.; Yin Z.; Li H.; Tang X.; Uher C. Thermoelectric Transport Properties of p-Type Silver-Doped PbS with In Situ Ag2S Nanoprecipitates. J. Phys. D: Appl. Phys. 2014, 47, 115303. 10.1088/0022-3727/47/11/115303. [DOI] [Google Scholar]
- Kobayashi M. Review on Structural and Dynamical Properties of Silver Chalcogenides. Solid State Ionics 1990, 39, 121–149. 10.1016/0167-2738(90)90392-5. [DOI] [Google Scholar]
- Fernández-Pacheco R.; Arruebo M.; Marquina C.; Ibarra R.; Arbiol J.; Santamaría J. Highly Magnetic Silica-Coated Iron Nanoparticles Prepared by the Arc-Discharge Method. Nanotechnology 2006, 17, 1188. 10.1088/0957-4484/17/5/004. [DOI] [Google Scholar]
Associated Data
This section collects any data citations, data availability statements, or supplementary materials included in this article.


