Abstract
Background:
Irritable bowel syndrome (IBS) is reported associated with the alteration of gut microbial composition termed as dysbiosis. However, the pathogenic mechanism of IBS remains unclear, while the studies of Chinese individuals are scarce. This study aimed to understand the concept of dysbiosis among patients with Chinese diarrhea-predominant IBS (IBS-D), as a degree of variance between the gut microbiomes of IBS-D population and that of a healthy population.
Methods:
The patients with IBS-D were recruited (assessed according to the Rome III criteria, by IBS symptom severity score) from the Outpatient Department of Gastroenterology of Peking University Third Hospital, and volunteers as healthy controls (HCs) were enrolled, during 2013. The 16S rRNA sequences were extracted from fecal samples. Ribosomal database project resources, basic local alignment search tool, and SparCC software were used to obtain the phylotype composition of samples and the internal interactions of the microbial community. Herein, the non-parametric test, Wilcoxon rank-sum test was carried out to find the statistical significance between HC and IBS-D groups. All the P values were adjusted to q values to decrease the error rate.
Results:
The study characterized the gut microbiomes of Chinese patients with IBS-D, and demonstrated that the dysbiosis could be characterized as directed alteration of the microbiome composition leading to greater disparity between relative abundance of two phyla, Bacteroidetes (Z = 4.77, q = 1.59 × 10⁻⁵) and Firmicutes (Z = –3.87, q = 5.83 × 10⁻⁴). Moreover, it indicated that the IBS symptom features were associated with the dysbiosis of whole gut microbiome, instead of one or several certain genera even they were dominating. Two genera, Bacteroides and Lachnospiracea incertae sedis, were identified as the core genera, meanwhile, the non-core genera contribute to a larger pan-microbiome of the gut microbiome. Furthermore, the dysbiosis in patients with IBS-D was associated with a reduction of network complexity of the interacted microbial community (HC vs. IBS-D: 639 vs. 154). The disordered metabolic functions of patients with IBS-D were identified as the potential influence of gut microbiome on the host (significant difference with q < 0.01 between HC and IBS-D).
Conclusions:
This study supported the view of the potential influence of gut microbiome on the symptom of Chinese patients with IBS-D, and further characterized dysbiosis in Chinese patients with IBS-D, thus provided more pathological evidences for IBS-D with the further understanding of dysbiosis.
Keywords: Irritable bowel syndrome, Gut microbiome, Dysbiosis, Microbial diversity, Community network complexity
Introduction
As one of the most prevalent heterogeneous functional gastrointestinal disorders,[1] irritable bowel syndrome (IBS) has a high morbidity rate around the world and accounts for up to 50% of visits for gastrointestinal complaints.[1–3] Characterized by chronically recurrent abdominal pain, discomfort, bloating, and alteration of bowel habits,[4] diarrhea (D) and constipation (C), may predominate or alternate (A), as the symptoms of IBS, whereupon IBS is classified in general as IBS-D, IBS-C, and IBS-A, respectively.[5,6] Despite of an unknown organic cause of IBS, it is generally regarded as a multifactorial disorder involving the interplay of both host and environmental factors such as altered gut microbiota.[1,3,7] With a putative role in the development and maintenance of IBS symptoms, the gut microbiota has been suggested as one of the etiological factors in IBS.[1,4] To date, more and more studies on IBS or other gut diseases such as the Crohn disease and ulcerative colitis have revealed a characteristic of dysbiosis in gut microbiota.[1,7–12] Recognized as an unbalanced condition with qualitative or quantitative alterations in the digestive tract,[10,13] dysbiosis with imbalance of bacteria was identified as an essential factor associated with IBS according to the pathophysiological hypothesis.[13,14]
Our previous study has shown the dysbiosis of gut microbiota in the Chinese patients with IBS-D by evident variation of two major phyla, as an increase of Bacteroidetes and a decrease of Firmicutes.[15] However, the previous study of fecal 16S rRNA samples has not yet presented a consistent feature of dysbiosis with a quantitative definition, and also not investigated the possible associations between gut microbiota and the host during the course of IBS. Furthermore, it is nontrivial that the variation tendencies of the two phyla in patients with IBS were found contrary to ones from the European countries such as Finland and Sweden.[16–19] It was reported that gut microbiota was possibly influenced by gastrointestinal disease, diet, inheritance, or other potential factors that varied with racial populations,[1,7,20] which partially explained the different direction of dysbiosis, and as well contributes to our understanding of dysbiosis to some extent. However, the existing researches of dysbiosis based on the metagenomic data were still not able to clarify how the host and gut microbiota act on each other or interact mutually. On the other hand, since Chinese population has made up nearly 20% of the world's populations, the further study of dysbiosis of Chinese patients with IBS is of urgent demand to approach the unknown associations between the host and gut microbiota in the pathogenic mechanism of IBS.
In this study, we aimed to further understand the concept of dysbiosis among Chinese patients with IBS-D, as a degree of variance between the gut microbiomes of IBS-D population and that of a healthy population. This study provided more pathological evidences for IBS-D with the further understanding of dysbiosis, thus is expected to broaden our horizon on the intricate pathogenic associations between the gut microbiota and the host.
Methods
Ethical approval
The study was conducted in accordance with the Declaration of Helsinki and approved by the Ethics Committee of Peking University Health Science Center (No. 2013-112). All subjects provided written informed consent before their enrollment in this study.
Study design
The 16S rRNA sequences of gut microbiota were from fecal samples in our previous study, and we have been declared to have access to the study data.[15] Herein, patients with IBS-D were recruited (assessed according to the Rome III criteria) from the Outpatient Department of Gastroenterology of Peking University Third Hospital, and healthy volunteers were enrolled as controls, during 2013. All the subjects were confirmed not with comorbidity of psychological disorders. Fecal samples were sequenced using the Roche 454 GS FLX+ Titanium platform (Roche 454 Life Sciences, Branford, CT, USA) according to standard protocols.[21]
The IBS symptom features were evaluated by IBS symptom severity score (IBS-SSS), which includes abdominal pain, onset frequency of pain, bloating, satisfaction to bowel habit, interference to quality of life, and maximum bowel movement. Moreover, visceral sensitivity threshold of the patients with IBS-D was measured by perception, first sense to defecate, urgency, and maximum tolerance. The above features along with gender, age, and body mass index (BMI) contribute to the clinical indices of the subjects for analysis.
In this study, we used two groups consisting of 20 healthy controls (HCs) and 40 patients with IBS-D, including a total of 516,799 16S rRNA sequences (253 MB) passing quality control. As other studies,[16,22] the sample size of 60 is enough for the comparative analysis and has statistical significance.
Data processing and statistical analysis
The phylotype composition with exact taxa was obtained by searching the resources of ribosomal database project (RDP) (Michigan State University, East Lansing, MI, USA)[23] with basic local alignment search tool (BLAST) (National Institutes of Health, Bethesda, MD, USA),[24] where the e-value threshold was set at 10–5. The counts of sequences at phylotype levels (genus, family, order, class, and phylum) were then gathered into a matrix to characterize the microbial composition of each individual.
Let
be the microbial composition of the i-th individual in which  , then the Gini-Simpson index is
 |
and the Euclidean distance of two individuals is
 |
Moreover, we used principal component analysis (PCA) and partitioning around medoids (PAM) to cluster the individuals. The covariance matrix of the M individuals is given by
 |
where
 |
S is a positive semidefinite matrix with N non-negative eigenvalues  denoting the principal components and corresponding orthogonal eigenvectors aj, j = 1, 2,…, N. Thus
represents the new coordinate of the i-th individual in principal component space. Afterward, we clustered the individuals according to the new coordinates and estimated the cluster number by Calinski-Harabasz index, aiming at approaching an optimal partition of the total individuals.
Therewith, the relationship between the clinical indices and genus-level composition was constructed with the Pearson correlation test. Among the M individuals, let
be the distribution of the j-th genus, and
be the values of the k-th clinical index. Then the Pearson correlation coefficient between the genus and clinical index is given by
 |
where
 |
All the sequences were also annotated with Kyoto Encyclopedia of Genes and Genomes (KEGG) metabolic functions (Kyoto University, Kyoto, Japan)[25,26] as the following steps. The Mothur tool (University of Michigan, Ann Arbor, MI, USA)[27] was first employed to align and classify the sequences into operational taxonomic units (OTUs) with the template of Greengenes (Lawrence Berkeley National Laboratory, Berkeley, CA, USA),[28] where the cutoff was set at 60 and other options were set as default. Next, each OTU was assigned into a taxon according to the consensus of the annotation of sequences within it by the Mothur tool with default options. Then PICRUSt (Harvard School of Public Health, Boston, MA, USA)[29] was used for metagenome prediction, based on OTUs with known gene content and a method of ancestral state reconstruction. In PICRUSt, the OTUs were normalized by the 16S marker gene copy number, and predicted to metagenome with a precalculated OTU gene content based on Greengenes and IMG (Lawrence Berkeley National Laboratory, USA),[30] where the parameters were set as default.
The phylotypes or functional taxa with significantly different abundance between two groups of HC and IBS-D were found by the Wilcoxon rank-sum test (non-parametric test, also referred to as Mann-Whitney U test) via MetaComp (Peking University, Beijing, China).[31] In the Wilcoxon rank-sum test, we first calculated the minimum of the sum of ranks of HC and IBS-D groups as
 |
where rank xij is the rank of xij in i = 1, 2,…, M. Thus the statistical magnitude Z is
 |
in which, M1 and M2 are the sample size of two groups (M1 + M2 = M), M0 = M1 or M2 is the sample size of the group with the minimal sum of ranks, and ts is the number of individuals sharing rank s.
In the current study, all the P values were adjusted to q values to decrease the error rate according to previous study,[32] and the significance level was set at α = 0.05.
Synthesis of genus network
For visualization of the internal interactions and further measurement of the microbial community, SparCC (Cambridge, MA, USA)[33] was used to calculate the Spearman correlation coefficient with corresponding P value (also adjusted to q value[32]) between each two genera:
 |
The network was then visualized by Cytoscape (Institute for Systems Biology, Seattle, WA, USA),[34] with the nodes denoting the OTUs or genera, and connections representing the existence of correlation meeting given criteria.
Some quantitative measures of a genus network are necessary for further comparison. For a given node Vj (j = 1, 2 ,…, N) in a network consisting of N nodes, suppose there are bj nodes connected with Vj, and ej connections among the bj neighbor nodes. Cluster index ϕj of the node Vj was thus introduced as
 |
to measure the interacted connections of each genus in the network [Supplementary Figure 1], as a modified definition of the traditional concept, cluster coefficient,[35] which was given by
 |
Herein, the modification ϕj avoids the singular point of θj when bj = 0 or 1, and inverses θj to the sense where ϕj = 0 means no significance of node Vj in the network, while a high value of ϕj reveals an important status of Vj because of few connections among its numerous neighbor nodes. Afterward, the Wilcoxon signed-rank test (non-parametric test, via MetaComp) was used for the paired test of cluster index of all nodes (genera) between HC and IBS-D groups as
 |
and
 |
where Δϕj denoted the difference value of ϕj between two groups, and ts was the number of individuals sharing rank s.
Besides,
 |
which satisfied the criteria for measurement of network complexity, was defined as complexity index of the network.[35]
Results
Evident dysbiosis of phylum-level composition in gut microbiota of patients with IBS-D
Among the 60 fecal 16S rRNA samples, a total of 516,799 reads passing quality control were aligned with the 16S rRNA database RDP by BLAST software as described in methods. Herein, 389,120 reads were assigned into 204 genera within 14 phyla. The top two phyla (ranked by relative abundance on average among 60 individuals), Bacteroidetes and Firmicutes, on average made up 93.1% of the gut microbiota and were consequently regarded as the dominating phyla [Figure 1]. We also showed that the phylum-level composition was relatively close in the same group, but discriminative between two groups of HC and IBS-D as shown in Figure 2. According to the Wilcoxon rank-sum test, there was significant difference in the top three phyla (by relative abundance on average among 60 individuals) between HC and IBS-D (q < 0.05), and the relative abundance of Bacteroidetes in IBS-D was evidently higher than that in HC (Z = 4.77, q = 1.59 × 10⁻⁵), while the case of Firmicutes was opposite (Z = –3.87, q = 5.83 × 10⁻⁴), in the current Chinese individuals.
Figure 1.
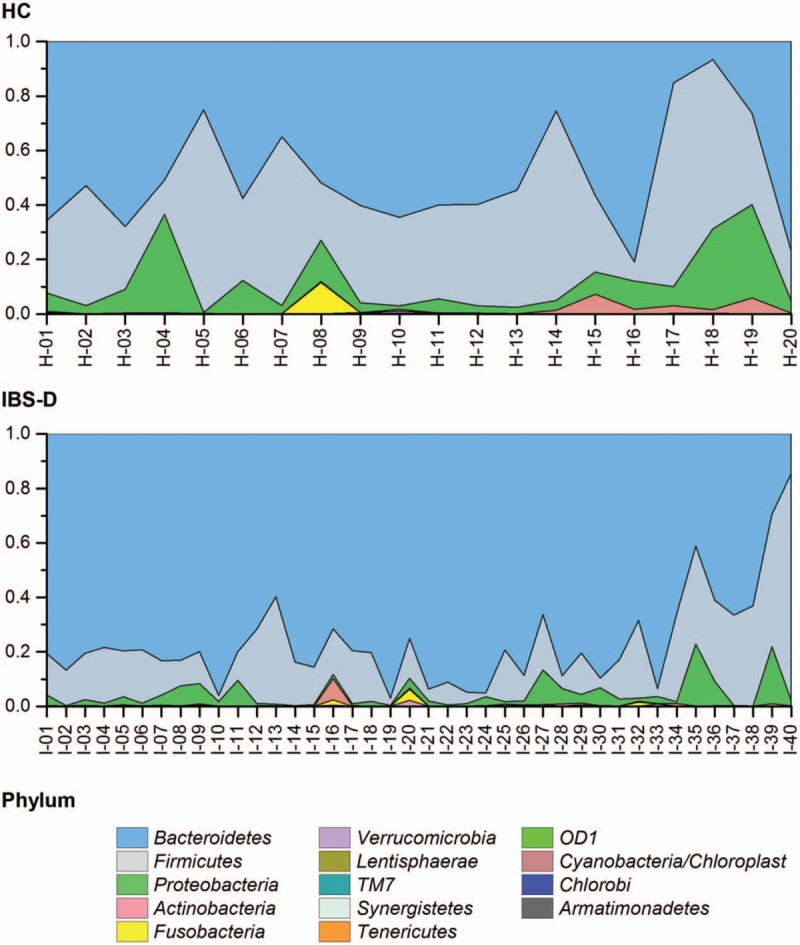
Phylum-level composition individuals for the HC and IBS-D groups. Stack area charts showed the relative phylum abundance and ticks in horizontal axis correspond to individuals. Each fill color referred to a phylum in the legend, and area approximated the average abundance. HC: Healthy control; IBS-D: Diarrhea-predominant irritable bowel syndrome.
Figure 2.
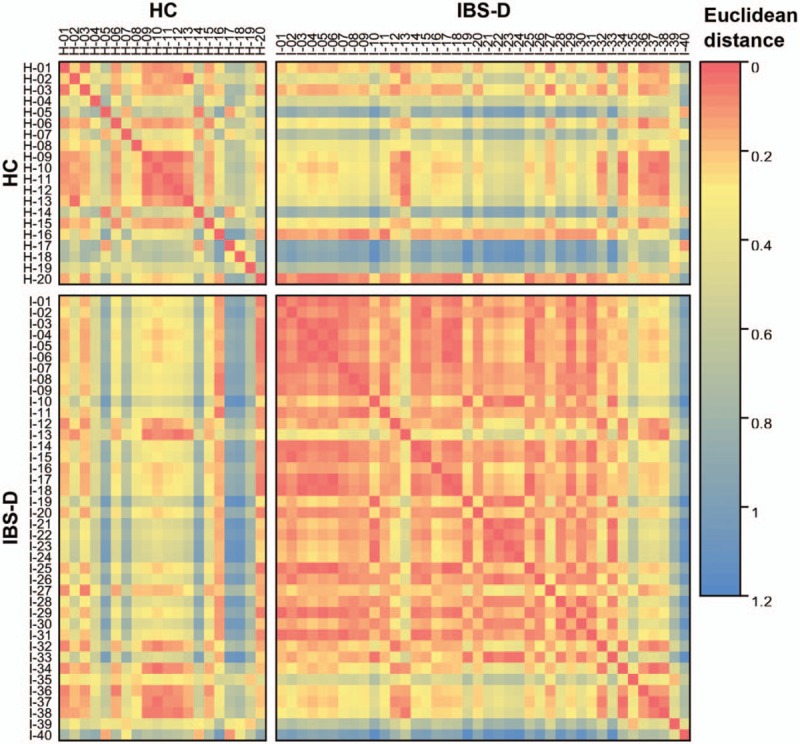
Heat map for Euclidean distance of phylum composition between any two individuals. With the color coming close to blue, the phylum composition between two individuals was more different. HC: Healthy control; IBS-D: Diarrhea-predominant irritable bowel syndrome.
Hence, the dysbiosis found in the current Chinese patients with IBS-D could be characterized as directed alteration of the gut microbiome composition leading to a greater disparity between relative abundance of the top two phyla. In a word, dysbiosis was a disturbance of the top phylotypes such as phyla or genera (shown in the following subsections) in the gut microenvironment, resulting in an unbalanced structure.
Core genera as gut colonizers while non-core genera constituting nearly half of gut microbial community
To expound more discriminative characteristics of HC and IBS-D, the following analyses were carried out at genus level. Of the 204 genera detected in total, the top 30 genera maded up 90.7% to 99.9% of the microbial community within each individual (97.8% on average among 60 individuals) [Figure 3]. Genus-level composition demonstrated a relative enrichment of Bacteroides (Z = 2.46, q = 0.00681), Prevotella (Z = 0.28, q = 0.00369), and Paraprevotella (Z = 2.09, q = 0.0236) (within Bacteroidetes phylum), and a relative depletion of Faecalibacterium (Z = –2.85, q = 0.00542), Lachnospiracea incertae sedis (Z = –3.37, q = 0.0188), Blautia (Z = –3.36, q = 0.0461), and Coprococcus (Z = –2.98, q = 0.0423) (within Firmicutes phylum), in IBS-D compared with HC (all satisfy q < 0.05 in Wilcoxon rank-sum test).
Figure 3.
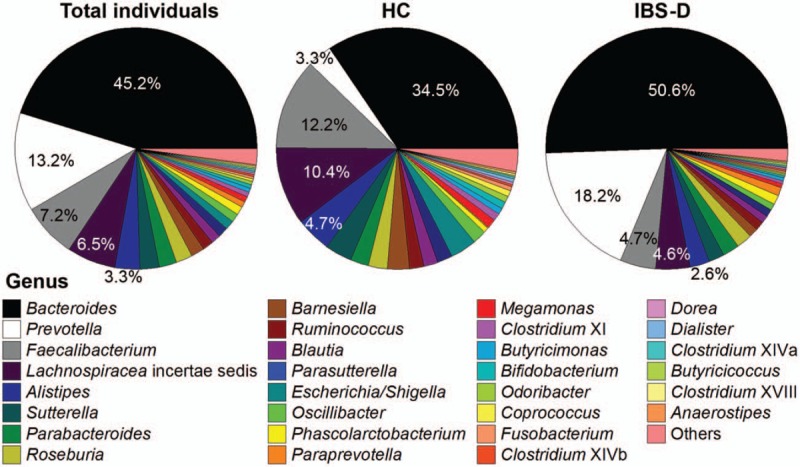
Pie charts for the genus-level composition of 60 individuals in total, 20 HC individuals, and 40 IBS-D individuals on average, respectively. Only top 30 genera were shown as separate sectors with fill colors corresponding to the legend below, and the remaining 174 genera were summed into “others” in the light red sector. HC: Healthy control; IBS-D: Diarrhea-predominant irritable bowel syndrome.
Among the 204 genera, only Bacteroides and Lachnospiracea incertae sedis belong to core genera (defined as those detected in all the 60 individuals, and the curve in Supplementary Figure 2, showed that with the analyzed sample size increasing, the number of genera detected in all individuals gradually decreased to two) representing on average 51.7% of the microbial composition, and were regarded as well-documented gut colonizers. Besides, seven genera (Faecalibacterium, Alistipes, Parabacteroides, Roseburia, Ruminococcus, Blautia, and Clostridium XI) were detected in not all but ≥54 (90.0%) individuals; whereas 169 genera were detected in <30 (50.0%) individuals. Moreover, 71 genera were found in only one individual (unique genera), implying the potential community heterogeneity across individuals.
Non-core genera contribute to a larger “pan-microbiome” of the gut microbiota
Accordingly, the 202 non-core genera characterized different compositions of gut microbiome for 60 Chinese individuals. However, the investigations or publicly available data of gut microbiota of Chinese patients with IBS are scarce, hence in the current study, we involved only the 20 HC and 40 IBS-D Chinese individuals and performed PCA to show the distribution of genus-level composition at a visible plane. With higher than 80.0% eigenvalues represented in PCA and optimal division by PAM, the PCA plots revealed strong clustering of HC or IBS-D. Herein, Cluster I and II contained mainly IBS-D individuals while Cluster III embraced almost all HC individuals except one in Cluster II. The stack bars in Figure 4 intuitively show the characteristics of the three types are Prevotella dominating, Bacteroides dominating, and relatively balanced, respectively.
Figure 4.
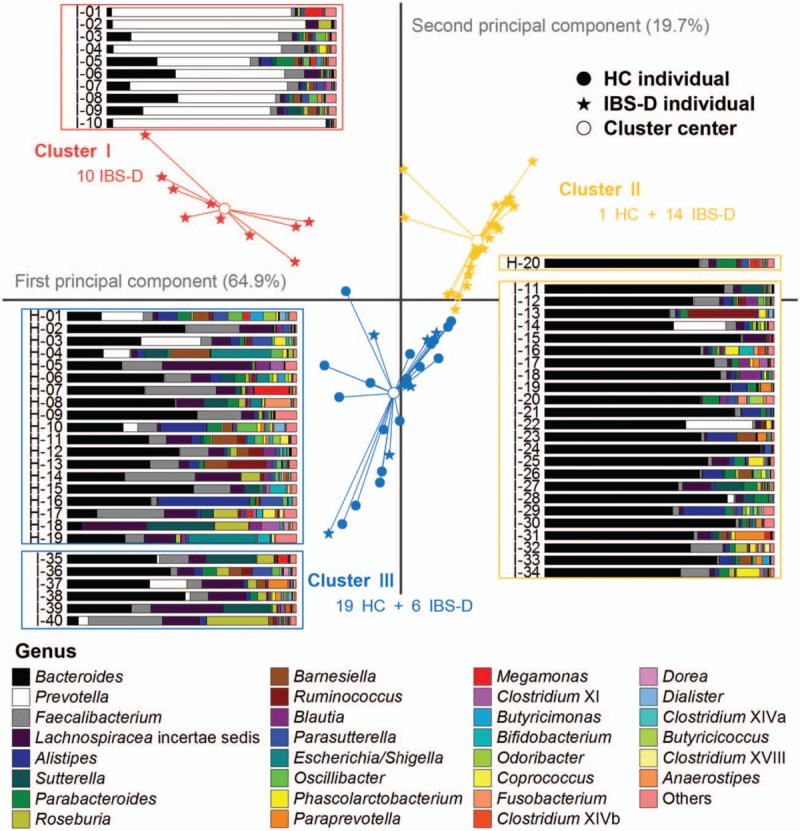
Genus-level composition and PCA plots of individuals for the HC and IBS-D groups. Scatters in different shapes represented HC individuals, IBS-D individuals, and cluster centers, with colors to distinguish the three clusters (red for I, yellow for II, and blue for III). Genus composition of each individual was displayed by stack bars, and the fill colors corresponded to genera listed in the legend below. HC: Healthy control; IBS-D: Diarrhea-predominant irritable bowel syndrome, PCA: Principal component analysis.
The observations suggested that the relative abundance of the dominating genera could explain any potential differences between the individuals of two groups, HC and IBS-D, which may not necessarily be less different than that of the individuals of the same group. That was to say, the difference between HC and IBS-D individuals was greater than the potential community heterogeneity across individuals that were indicated from the non-core genera, and thus the union of both core and non-core genera revealed a lager “pan-microbiome” among a group of individuals. Hence, the non-core genera detected in HC and IBS-D individuals contributed to two pan-microbiomes of HC and IBS-D, respectively.
To evaluate how addition of individuals from each group of HC and IBS-D extend the gut pan-microbiome, the number of genera present in each additional inclusion of a sample was plotted [Figure 5]. Compared to the averages of 40 and 37 genera per sample (horizontal lines) for the HC and IBS-D samples, respectively, the number of entire genera increases as the analyzed sample size increases, regardless whether only HC samples (blue curve), only IBS-D samples (yellow curve), or all samples (red curve) were included. The lack of plateauing for three curves suggests yet additional genera can be discovered upon analyzing more samples. Nevertheless, in the current study we presented that even with limited fecal 16S rRNA data, the gut pan-microbiome of Chinese individuals was magnitudes greater than any single sample.
Figure 5.
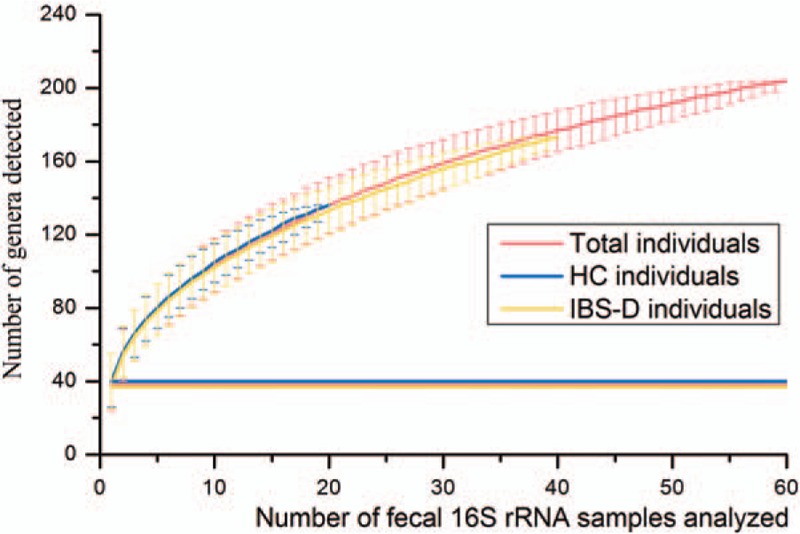
Number of genera plotted against number of additional fecal 16S rRNA samples analyzed. Samples of HC (20, blue curve), 40 IBS-D (40, yellow curve), and the total individuals (60, red curve) were respectively included in the three curves. The error bars above or below the curves showed the 95.0% confidence intervals. Horizontal lines represented the average number of genera per sample corresponding to HC (40), IBS-D (37), and the total (38). HC: Healthy control; IBS-D: Diarrhea-predominant irritable bowel syndrome.
Weak correlation between the abundant genera and IBS symptom features
In view of the high enrichment of the dominating genus Bacteroides or Prevotella in patients with IBS-D, we thus went to investigate whether there was potential pathogenicity of the genera. We implemented the Pearson correlation test between the clinical features and genus composition [Figure 6]. Seven features of IBS symptom severity, abdominal pain, onset frequency of pain, bloating, satisfaction to bowel habit, interference to quality of life, maximum bowel movement, and IBS-SSS in Figure 6, were found correlated with Bacteroides and Prevotella to be weak with no statistical significance, where the Pearson correlation magnitude r < 0.13 and q > 0.50. IBS-SSS is the global assessment of symptom severity according to the Rome III criteria, which deserves more attention. It was worthwhile to note that all the 204 genera were negatively correlated with IBS-SSS, where only Coprococcus (r = –0.43, q = 0.0121) and Sutterella (r = –0.39, q = 0.00704) presented statistical significance among the top 30 genera. Interestingly, the features of visceral sensitivity threshold, such as perception, first sense to defecate, urgency, and maximum tolerance also turned out weak correlation with Bacteroides and Prevotella.
Figure 6.
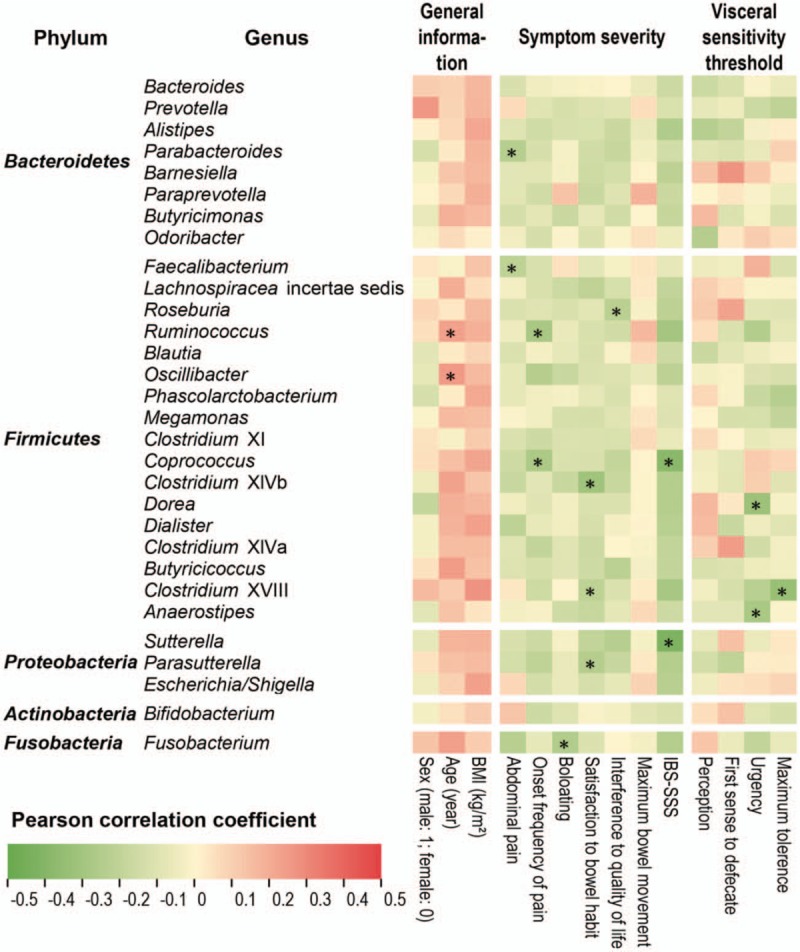
Pearson correlation between 14 clinical indices (three indices of general information and 11 IBS symptom features) and top 30 genera. The heat map showed the Pearson correlation coefficient between each index and each genus, where red was positive and green was negative as legend. The position marked by an asterisk meant that the correlation was significant (q < 0.05). BMI: Body mass index; IBS: Irritable bowel syndrome.
Therefore, it was an obvious deduction that IBS-D was associated with the dysbiosis of whole gut microbiota, instead of one or several certain genera even they are dominating with high enrichment in the whole community. In fact, Prevotella revealed beneficial ability for human such as degradation of fiber and plant-derived compounds,[36] and the essential genes for biosynthesizing vitamin B1 were found enriched in the Prevotella-dominating enterotype.[37] As to the minor genera, for instance, Faecalibacterium which ranks the third by average abundance among the 60 individuals (7.2%), the main species Faecalibacterium prausnitzii in Faecalibacterium was deemed to take an important part in balancing immunity in the intestine, and could be potentially applied as a probiotic.[38] In several investigations with respect to gut diseases such as IBS, Crohn disease and ulcerative colitis, F. prausnitzii was confirmed to decrease in the gut microbiota of patients and regarded as a sensor for health.[38,39] The fact thus implied that we should concentrate on the different structure of the whole gut microbial community between HC and IBS-D, as described in the following subsection.
Low network complexity level in gut microbial community of patients with IBS-D
To highlight the reduction of diversity and interactions among the gut microbial community of patients with IBS-D at genus level, the Gini-Simpson index was calculated based on genus composition, and was found significantly higher in HC than in IBS-D as displayed by Figure 7 (with Z = –4.99 and q = 4.85 × 10⁻⁹ in Wilcoxon rank-sum test). Moreover, we plotted the genus networks, to show the different co-abundance and co-exclusion correlations between each two genera, in two groups HC and IBS-D, respectively (Spearman correlation magnitude ≥0.4 and q < 0.05) [Figure 8]. For magnifying visualization, more detailed networks of top 30 genera are in Figure 9. As shown in Figure 8, there were 187 connections among genera in HC while only 51 ones in IBS-D, meanwhile most of which were between the genera belonging to Bacteroidetes and Firmicutes, implying that the two major phyla were evidently more interacted than any other in the microbial community for both HC and IBS-D.
Figure 7.
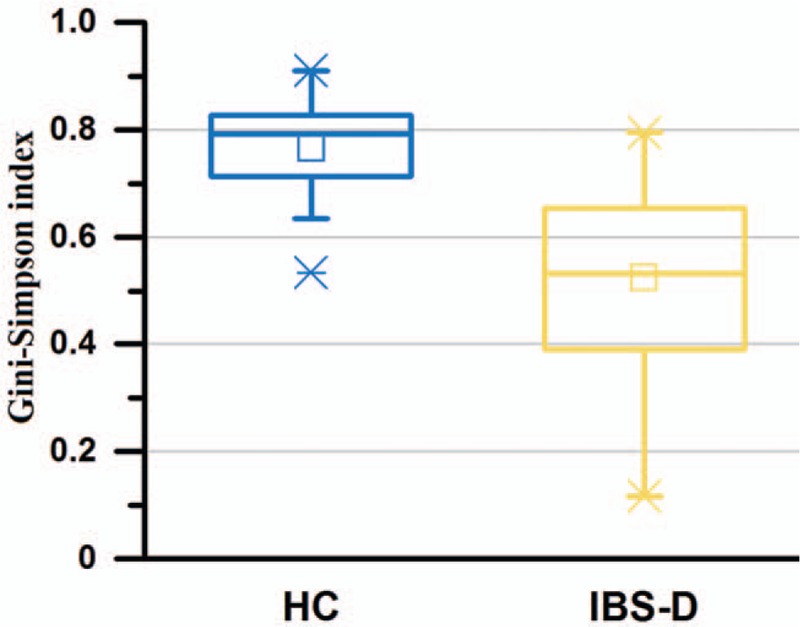
Evaluation of genus diversity between the HC (n = 20) and IBS-D (n = 40) groups. Box charts for the Gini-Simpson index of HC and IBS-D individuals. HC: Healthy control; IBS-D: Diarrhea-predominant irritable bowel syndrome.
Figure 8.
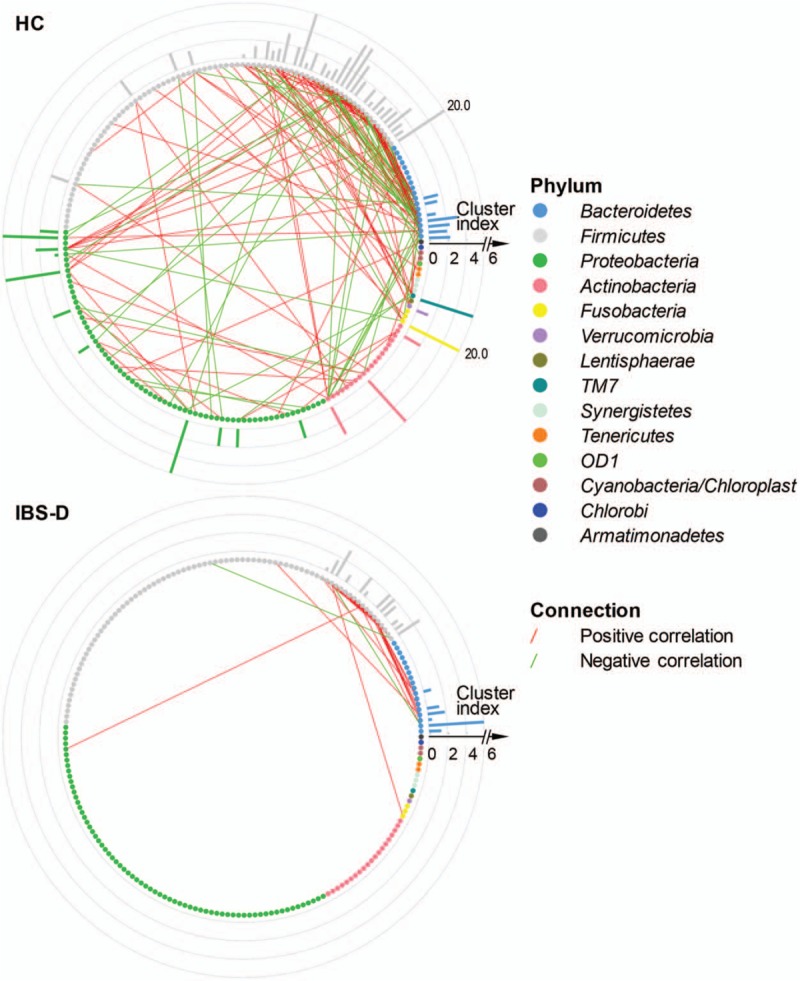
Genus networks with peripheral bars for cluster index of HC (n = 20) and IBS-D (n = 40). Each little bubble (node) represented a genus, whose color varied with phylum according to the legend. From the direction of 3 o’clock, the average abundance of phylum decreased anticlockwise, as well as that of genus within the same phylum. A connection between two bubbles indicated existence of the Spearman correlation magnitude ≥0.4 and q < 0.05 between the two corresponding genera, where red and green connections stood for co-abundance (positive correlation) and co-exclusion (negative correlation), respectively. The peripheral bars showed the cluster index of corresponding genera in the network. HC: Healthy control; IBS-D: Diarrhea-predominant irritable bowel syndrome.
Figure 9.
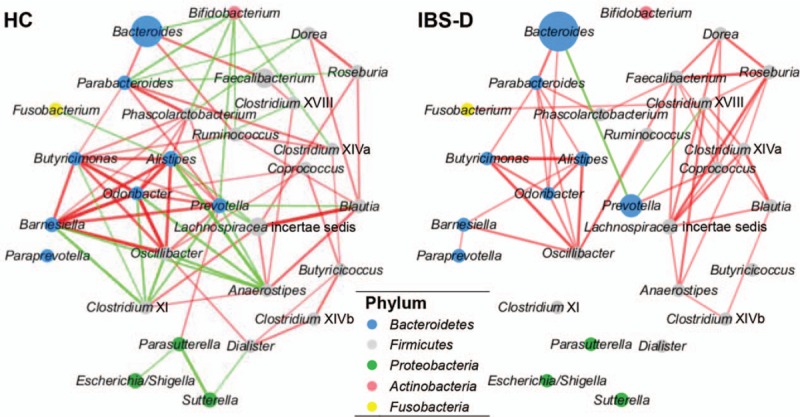
Local parts of genus networks. Colors of bubbles and connections remained the same with Figure 8. In addition, size of bubble stood for the average abundance, while thickness and transparency of connection simultaneously reflected the correlation magnitude in this figure. Values were displayed after a linear transformation to guarantee visibility. HC: Healthy control; IBS-D: Diarrhea-predominant irritable bowel syndrome.
What was more important was that HC network revealed much more complicated than IBS-D according to complexity index (639 vs. 154), in agreement with the previous study of IBS.[40] Besides, the number of co-abundance correlations were observably more than co-exclusion correlations (125:62 in HC and 48:3 in IBS-D), which clearly indicated a microenvironment of stronger symbiotic relationship than competitive or conflicted relationship among genera in the microbial community for HC than IBS-D; however, the community of IBS-D had much fewer negative correlations somewhat corresponding to the evidently competitive or conflicted social relationships.
To measure the interacted strength of the genera in the networks of HC and IBS-D, we furthermore calculated the cluster index of each genus as described in methods section and shown as peripheral bars in Figure 8. As a result, the cluster index was found significantly higher in HC than that in IBS-D with Z = –4.47 and q = 2.23 × 10⁻⁵ by the Wilcoxon signed-rank test (paired test for all genera between HC and IBS-D). Therefore, we identified 13 key genera from the networks of HC and IBS-D, with the criteria of not less than five neighbor genera and cluster index not <3.0 in at least one network [Table 1].
Table 1.
Neighbor genera count and cluster index of 13 key genera.
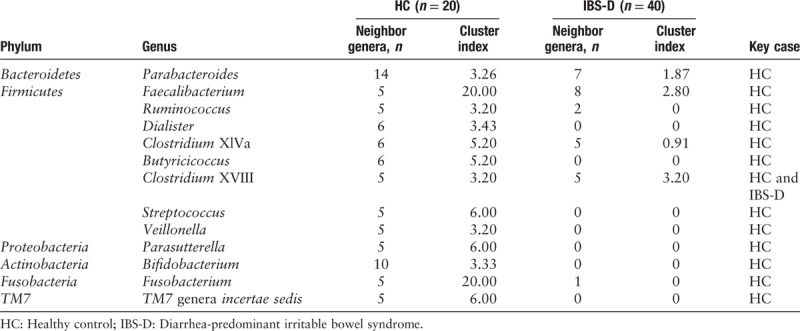
Several key genera in the community network were considered salutary to human health. For instance, some Ruminococcus species were reported to participate in the transition of several organics, such as fermentative metabolism where carbohydrate serves as substrates for growth,[41,42] and the degradation of cellulose, starch, or xylan.[43–45] The species Butyricicoccus pullicaecorum of Butyricicoccus with the ability to produce butyrate with probiotic potential to mitigate gut dysbiosis was applied to pharmabiotics for Crohn disease and ulcerative colitis.[46,47] Moreover, it is convinced that several strains of Bifidobacterium exert a range of beneficial effects within the human gastrointestinal tract, such as promoting the anti-inflammatory response, restraining the growth of pathogenic organisms, and resisting intestinal acid and bile.[48–50] Some specific Bifidobacterium strains have already been encapsulated for probiotic treatment of patients with IBS, and turned out a prominent efficacy.[48] Consequently, dysbiosis may affect the probiotic function of key genera such as Ruminococcus, Butyricicoccus, and Bifidobacterium, which are believed necessary for mammalian health.
On account of the comparison herein, the gut microbiome of IBS-D was quantificationally characterized by low diversity, low complexity, and low cluster index of key genera at the genus level.
Disordered metabolic functions of saccharides in the gut microbiota of patients with IBS-D
Finally, we analyzed the metabolic functions to identify the characteristics dysbiosis of gut microbiota of patients with IBS-D and further indicated the associations between gut microbiota and host. According to the relative abundance of the OTUs aligned with Greengenes and mapped onto KEGG metabolic functions, four functions related with fucose significantly differed between HC and IBS-D [Figure 10A], where mutarotase and isomerase of L-fucose were enriched in HC, while GDP-L-fucose synthase and fucose permease were enriched in IBS-D (q < 0.01). Table 2 displays the Z values and q values in the Wilcoxon rank-sum test.
Figure 10.
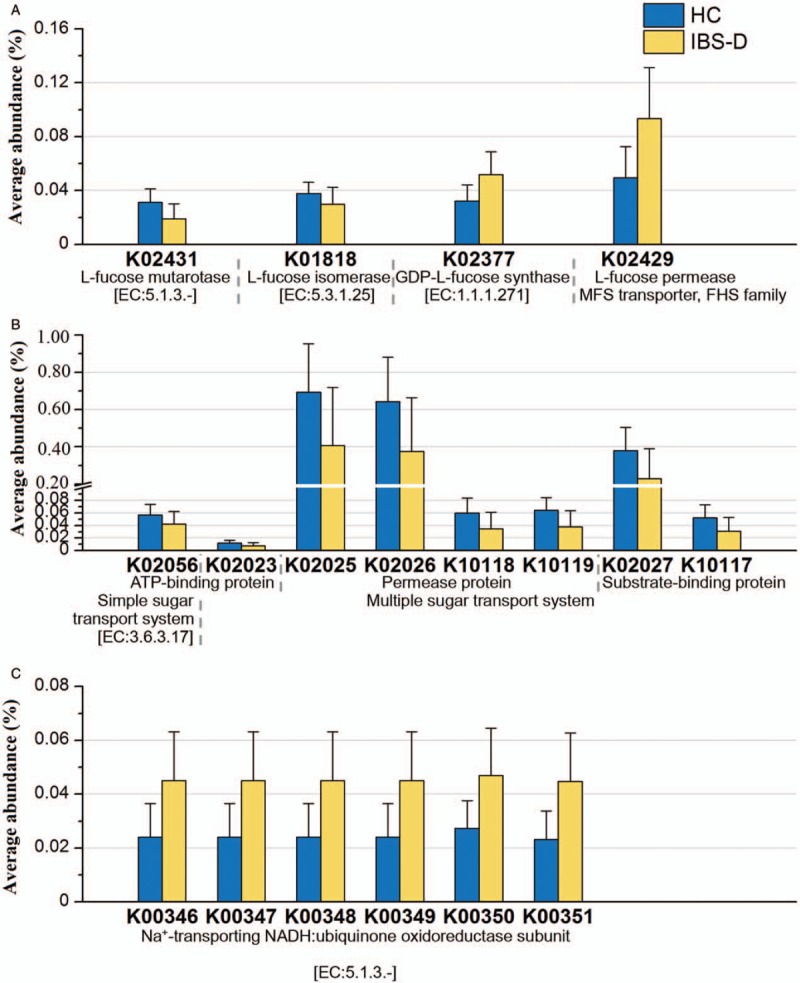
Functional abundance of several saccharides-related metabolic functions. The KEGG ID shown in the figure all satisfy q < 0.01 in Wilcoxon rank-sum test between HC (n = 20) and IBS-D (n = 40). Error bars showed the standard deviation. (A) Fucose-related functions. (B) Proteins in sugar transport systems. (C) Subunits of NADH. HC: Healthy control; IBS-D: Diarrhea-predominant irritable bowel syndrome; NADH: Nicotinamide adenine dinucleotide.
Table 2.
Statistical observation of the different KEGG metabolic functions between HC (n = 20) and IBS-D (n = 40) in the Wilcoxon rank-sum test.
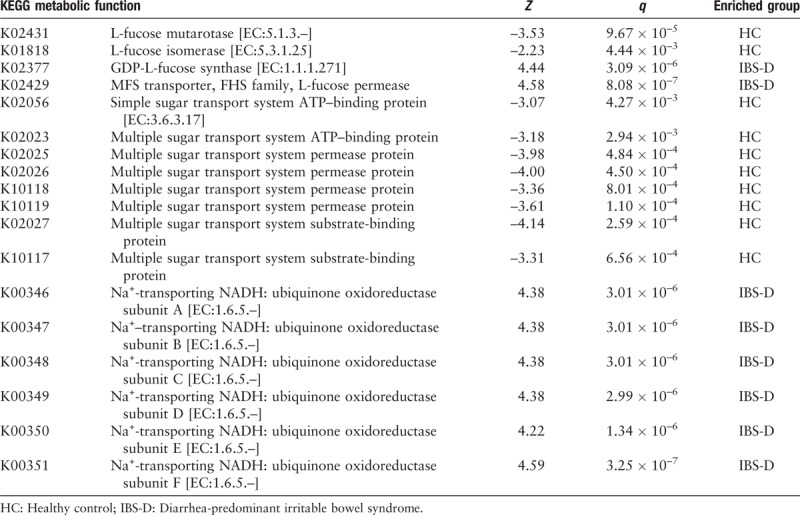
Besides, the relative abundance of several proteins for sugar transport system (substrate-binding protein, permease protein and ATP-binding protein for multiple sugar transport system, and ATP-binding protein for simple sugar transport system) were found enriched in the HC group (q < 0.01) [Figure 10B and Table 2]. Since sugar is one of the essential substances to maintain the vital movement, the sugar transport system is playing an important role in the healthy gut microenvironment. Dysbiosis might lead to reduction of the related proteins, and meanwhile, the functions of six subunits of nicotinamide adenine dinucleotide (NADH: ubiquinone oxidoreductase) were found enriched in IBS-D (q < 0.01) [Figure 10C and Table 2]. Herein, NADH is the reduced form of nicotinamide adenine dinucleotide, and is the coenzyme in the reaction of glycolysis, during which CO2 may generate as the final product. Hence, we can indicate from the enrichment of the subunits that increased gas production existing in the bowel of patients with IBS-D may potentially lead to recurrent bloating as the symptom.
Discussion
Due to high epidemicity and intricate pathological mechanism of IBS, studies on IBS have burst out in recent years, and it is commonly received that the gut microbiota has a potential association with IBS symptom. We analyzed the16S rRNA sequences of 20 HC and 40 IBS-D fecal samples of Chinese patients, where the sample size 60 is enough for the comparative analyses.[15,16,22] As is known to the field, age, BMI, illness duration, and constitution of diets may influence the gut microbial composition, but we have demonstrated in our previous study[15] that these factors did not result in different microbial composition between the HC and IBS-D groups. Of course, how the above factors are associated with IBS-D still needs further investigation.
In the current study, we showed the significant increase of Bacteroidetes and decrease of Firmicutes as dysbiosis in gut microbiota among Chinese patients with IBS-D, and characterized dysbiosis as directed alteration of the gut microbiome composition leading to a greater disparity between relative content of the abundant phylotypes, resulting in an unbalanced structure. We identified three types of gut microbiome that were Prevotella dominating, Bacteroides dominating, and relatively balanced, and showed that the individual with relatively balanced gut microbiota is healthy-like. Interestingly, two genera, Lachnospiracea incertae sedis and Ruminococcus, were not relatively abundant in the Chinese individuals in the current study, but were found potentially dominating among American individuals suffering with IBS-D[22] as a consequence of different types of gut microbiome composition among populations around the world much more likely due to diet or drug intake.[7,36,37] Besides, Bacteroides and Lachnospiracea incertae sedis were identified as core genera among the total 204 genera in the 60 individuals. This finding was not consistent with several studies of European countries such as Finland and Sweden,[14,16–19] as a possible result of gastrointestinal disease, diet, inheritance, or other potential factors that vary with racial populations.[1,7,20]
Hence the HC or IBS-D individuals living in the same region or from the same racial background present more similar gut microbiome composition and thus the aggregation of different populations with various backgrounds reveals a potential gut “pan-microbiome,” which is larger than a single microbial community. Unfortunately, since the ability of existing studies to contribute to the investigation of gut pan-microbiome of IBS-D population is quite limited, our current study can only give rise to a brief discussion of the gut pan-microbiome herein. However, through the comparative analysis of taxonomic composition at both phylum and genus level, it is still clear that the abundant phylotypes are even more enriched in the gut microenvironment with dysbiosis, which may disturb the interacted relationship of the community and occupy the living space of the phylotypes with low abundance, and thus become a potential factor of the disease.
Therefore, we analyzed the interactions among the gut microbiota community, and found reduced network complexity of IBS-D from the genus network. The more co-abundance correlations (than co-exclusion ones) in the networks of both HC and IBS-D indicate stronger symbiosis in the community. It is widely known that human intestine is colonized with an intricate community of indigenous microorganisms such that a symbiotic host-bacterial relationship exists in our intestine,[51] where the microbiota with its internal interactions are shaping a reticular system to maintain the organism. Accordingly, the strong symbiosis in microbial community, or namely, a symbiotic bacterial group, is more likely to be mutualistic with the host, and thus networking with the immune system to mediate anti-inflammatory responses necessary for mammalian health.[52] Whereas dysbiosis may weaken the symbiotic network and alter the normal function of immune system, thus become a major factor for disorders such as IBS-D.
In the end, we identified the metabolic functions in the gut microbiota of HC and IBS-D groups to indicate the associations between the gut microbiota and host enrolled in the disorder. As one might know, fucose is component of mucin in the gut epithelial barrier; hence, the enrichment of fucose permease in IBS-D may alter the normal function of the barrier, which is reported to be associated with bacterial conglutination and invasion against host cells.[53,54] It also implied that with the barrier thinner, the increased fucose synthase of gut microbiota in IBS-D provides a protection to the host. While in the case of HC, mutarotase, and isomerase of fucose may keep the normal function of the barrier. Moreover, we found the enriched functions of proteins for sugar transport system of great importance in the healthy gut microenvironment, as well as another signature NADH: ubiquinone oxidoreductase enriched in IBS-D indicating the increased gas production potentially leading to the recurrent bloating as IBS symptom. The results revealed the alteration of host functional mechanism possibly caused by the dysbiosis of gut microbiota.
Hence in the current study, we characterized dysbiosis in Chinese patients with IBS-D as directed alteration leading to greater disparity between relative content of the abundant phylotypes, and showed the important role of a relatively balanced gut microenvironment in the healthy individuals. We presented the consistent feature of dysbiosis by lower complexity level of gut microbial community, and identified the disordered metabolic functions of saccharides in the gut microbiota of patients with IBS-D, which indicated the potential influence of gut microbiota on the symptoms of patients with IBS-D. Moreover, we identified Bacteroides and Lachnospiracea incertae sedis as core genera of the Chinese individuals as a result of potential factors that vary with racial populations. Our current study provided more pathological evidences for IBS-D with the further understanding of dysbiosis, which broadened our horizon on the intricate pathogenic associations between gut microbiota and host. Nevertheless, analyses based on 16S rRNA sequences are limited, and in future studies we will aim at the more detailed distinction of potential metabolic functions of IBS-D gut microbiota to seek diagnostic biomarkers for new treatment strategies.
In conclusion, dysbiosis associated with disordered metabolic functions of saccharides in the gut microbiota possibly partially accounts for the symptoms of patients with IBS-D. Of course, the more detailed results with respect to the associations between the gut microbiota and host still need further research of metatranscriptomics or metaproteomics. However, our current study presenting the results by functional genomic methods based on 16S rRNA sequences also contributes to the understanding of the pathogenesis of IBS-D.
Acknowledgements
The authors thank Prof. Xiao-Lei Wu and Prof. Zu-Hong Lu of Peking University for their interest to the project and useful discussions. We also thank Dr. Long-Shu Yang of Peking University for his helpful technique supporting and useful discussions. For the study, the co-author, Prof. Li-Ping Duan of Peking University Third Hospital contributed with the corresponding author Prof. Huai-Qiu Zhu.
Funding
This work was supported by grants from the National Key Research and Development Program of China (No. 2017YFC1200205), the National Natural Science Foundation of China (No. 31671366 and No. 91231119), and the Special Research Project of ‘Clinical Medicine + X’ by Peking University.
Conflicts of interest
None.
Supplementary Material
Footnotes
How to cite this article: Wang Z, Xu CM, Liu YX, Wang XQ, Zhang L, Li M, Zhu SW, Xie ZJ, Wang PH, Duan LP, Zhu HQ. Characteristic dysbiosis of gut microbiota of Chinese patients with diarrhea-predominant irritable bowel syndrome by an insight into the pan-microbiome. Chin Med J 2019;00:00–00. doi: 10.1097/CM9.0000000000000192
References
- 1.Kennedy PJ, Cryan JF, Dinan TG, Clarke G. Irritable bowel syndrome: a microbiome-gut-brain axis disorder? World J Gastroenterol 2014; 20:14105–14125. doi: 10.3748/wjg.v20.i39.14105. [DOI] [PMC free article] [PubMed] [Google Scholar]
- 2.Shinozaki M, Fukudo S, Hongo M, Shimosegawa T, Sasaki D, Matsueda K, et al. High prevalence of irritable bowel syndrome in medical outpatients in Japan. J Clin Gastroenterol 2008; 42:1010–1016. doi: 10.1097/MCG.0b013e318150d006. [DOI] [PubMed] [Google Scholar]
- 3.Frank DN, Zhu W, Sartor RB, Li E. Investigating the biological and clinical significance of human dysbioses. Trends Microbiol 2011; 19:427–434. doi: 10.1016/jtim.2011.06.005. [DOI] [PMC free article] [PubMed] [Google Scholar]
- 4.Öhman L, Törnblom H, Simrén M. Crosstalk at the mucosal border: importance of the gut microenvironment in IBS. Nat Rev Gastroenterol Hepatol 2015; 12:36–49. doi: 10.1038/nrgastro.2014.200. [DOI] [PubMed] [Google Scholar]
- 5.Longstreth GF, Thompson WG, Chey WD, Houghton LA, Mearin F, Spiller RC. Functional bowel disorders. Gastroenterology 2006; 130:1480–1491. doi: 10.1053/j.gastro.2005.11.061. [DOI] [PubMed] [Google Scholar]
- 6.Quigley EM, Abdel-Hamid H, Barbara G, Bhatia SJ, Boeckxstaens G, De Giorgio R, et al. A global perspective on irritable bowel syndrome: a consensus statement of the world gastroenterology organisation summit task force on irritable bowel syndrome. J Clin Gastroenterol 2012; 46:356–366. doi: 10.1097/MCG.0b013e318247157c. [DOI] [PubMed] [Google Scholar]
- 7.Rajilić-Stojanović M, Jonkers DM, Salonen A, Hanevik K, Raes J, Jalanka J, et al. Intestinal microbiota and diet in IBS: causes, consequences, or epiphenomena? Am J Gastroenterol 2015; 110:278–287. doi: 10.1038/ajg.2014.427. [DOI] [PMC free article] [PubMed] [Google Scholar]
- 8.Collins SM. A role for the gut microbiota in IBS. Nat Rev Gastroenterol Hepatol 2014; 1:497–505. doi: 10.1038/nrgastro.2014.40. [DOI] [PubMed] [Google Scholar]
- 9.Simrén M. IBS with intestinal microbial dysbiosis: a new and clinically relevant subgroup? Gut 2014; 11:1685–1686. doi: 10.1136/gutjnl-2013-306434. [DOI] [PubMed] [Google Scholar]
- 10.Sajjadieh MS, Kuznetsova LV, Bojenko VB. Dysbiosis in Ukrainian children with irritable bowel syndrome affected by natural radiation. Iran J Pediatr 2012; 22:364–368. doi: 10.2350/12-06-1214-OA.1. [PMC free article] [PubMed] [Google Scholar]
- 11.Tamboli CP, Neut C, Desreumaux P, Colombel JF. Dysbiosis in inflammatory bowel disease. Gut 2004; 53:1–4. doi: 10.1136/gut.53.1.1. [DOI] [PMC free article] [PubMed] [Google Scholar]
- 12.Joossens M, Huys G, Cnockaert M, Preter VD, Verbeke K, Rutgeerts P, et al. Dysbiosis of the faecal microbiota in patients with Crohn's disease and their unaffected relatives. Gut 2011; 60:631–637. doi: 10.1136/gut.2010.223263. [DOI] [PubMed] [Google Scholar]
- 13.Duboc H, Rainteau D, Rajca S, Humbert L, Farabos D, Maubert M, et al. Increase in fecal primary bile acids and dysbiosis in patients with diarrhea-predominant irritable bowel syndrome. J Neurogastroenterol 2012; 24:513–520. doi: 10.1111/j.1365-2982.2012.01893.x. [DOI] [PubMed] [Google Scholar]
- 14.Kassinen A, Krogius-Kurikka L, Mäkivuokko H, Rinttilä T, Paulin L, Corander J, et al. The fecal microbiota of irritable bowel syndrome patients differs significantly from that of healthy subjects. Gastroenterology 2007; 133:24–33. doi: 10.1053/j.gastro.2007.04.005. [DOI] [PubMed] [Google Scholar]
- 15.Liu YX, Zhang L, Wang XQ, Wang Z, Zhang JJ, Jiang RH, et al. Similar fecal microbiota signatures in patients with diarrhea-predominant irritable bowel syndrome and patients with depression. Clin Gastroenterol Hepatol 2016; 14:1602–1611. doi: 10.1016/j.cgh.2016.05.033. [DOI] [PubMed] [Google Scholar]
- 16.Krogius-Kurikka L, Lyra A, Malinen E, Aarnikunnas J, Tuimala J, Paulin L, et al. Microbial community analysis reveals high level phylogenetic alterations in the overall gastrointestinal microbiota of diarrhoea-predominant irritable bowel syndrome sufferers. BMC Gastroenterol 2009; 9:95.doi: 10.1186/1471-230X-9-95. [DOI] [PMC free article] [PubMed] [Google Scholar]
- 17.Rajilić-Stojanović M, Biagi E, Heilig HG, Kajander K, Kekkonen RA, Tims S, et al. Global and deep molecular analysis of microbiota signatures in fecal samples from patients with irritable bowel syndrome. Gastroenterology 2011; 141:1792–1801. doi: 10.1053/j.gastro.2011.07.043. [DOI] [PubMed] [Google Scholar]
- 18.Salonen A, de Vos WM, Palva A. Gastrointestinal microbiota in irritable bowel syndrome: present state and perspectives. Microbiology 2010; 156:3205–3215. doi: 10.1099/mic.0.043257-0. [DOI] [PubMed] [Google Scholar]
- 19.Jeffery IB, O’Toole PW, Öhman L, Claesson JM, Deane J, Quigley EMM, et al. An irritable bowel syndrome subtype defined by species-specific alterations in faecal microbiota. Gut 2012; 61:997–1006. doi: 10.1136/gutjnl-2011-301501. [DOI] [PubMed] [Google Scholar]
- 20.Musso G, Gambino R, Cassader M. Obesity, diabetes, and gut microbiota. Diabetes Care 2010; 33:2277–2284. doi: 10.2337/dc10-0556. [DOI] [PMC free article] [PubMed] [Google Scholar]
- 21.Margulies M, Egholm M, Altman WE, Attiya S, Bader JS, Bemben LA, et al. Genome sequencing in microfabricated high-density picolitre reactors. Nature 2005; 437:376–380. doi: 10.1038/nature03959. [DOI] [PMC free article] [PubMed] [Google Scholar]
- 22.Carroll IM, Ringel-Kulka T, Siddle JP, Ringel Y. Alterations in composition and diversity of the intestinal microbiota in patients with diarrhea-predominant irritable bowel syndrome. J Neurogastroenterol 2012; 24:521–530. doi: 10.1111/j.1365-2982.2012.01891.x. [DOI] [PMC free article] [PubMed] [Google Scholar]
- 23.Cole JR, Wang Q, Cardenas E, Fisher J, Chai B, Farris RJ, et al. The ribosomal database project: improved alignments and new tools for rRNA analysis. Nucleic Acids Res 2009; 37:D141–D145. doi: 10.1093/nar/gkn879. [DOI] [PMC free article] [PubMed] [Google Scholar]
- 24.Altschul SF, Gish W, Miller W, Myers EW, Lipman DJ. Basic local alignment search tool. J Mol Biol 1990; 215:403–410. doi: 10.1016/S0022-2836(05)80360-2. [DOI] [PubMed] [Google Scholar]
- 25.Kanehisa M, Goto S, Kawashima S, Okuno Y, Hattori M. The KEGG resource for deciphering the genome. Nucleic Acids Res 2004; 32:D277–D280. doi: 10.1093/nar/gkh063. [DOI] [PMC free article] [PubMed] [Google Scholar]
- 26.Kanehisa M, Sato Y, Kawashima M, Furumichi M, Tanabe M. KEGG as a reference resource for gene and protein annotation. Nucleic Acids Res 2016; 44:D457–D462. doi: 10.1093/nar/gkv1070. [DOI] [PMC free article] [PubMed] [Google Scholar]
- 27.Schloss PD, Westcott SL, Ryabin T, Hall JR, Hartmann M, Hollister EB, et al. Introducing mothur: open-source, platform-independent, community-supported software for describing and comparing microbial communities. Appl Environ Microbiol 2009; 75:7537–7541. doi: 10.1128/AEM.01541-09. [DOI] [PMC free article] [PubMed] [Google Scholar]
- 28.DeSantis TZ, Hugenholtz P, Larsen N, Rojas M, Brodie EL, Keller K, et al. Greengenes, a chimera-checked 16S rRNA gene database and workbench compatible with ARB. Appl Environ Microbiol 2006; 72:5069–5072. doi: 10.1128/AEM.03006-05. [DOI] [PMC free article] [PubMed] [Google Scholar]
- 29.Langille MG, Zaneveld J, Caporaso JG, McDonald D, Knights D, Reyes JA, et al. Predictive functional profiling of microbial communities using 16S rRNA marker gene sequences. Nat Biotechnol 2013; 31:814–821. doi: 10.1038/nbt.2676. [DOI] [PMC free article] [PubMed] [Google Scholar]
- 30.Markowitz VM, Chen IMA, Palaniappan K, Chu K, Szeto E, Grechkin Y, et al. IMG: the integrated microbial genomes database and comparative analysis system. Nucleic Acids Res 2012; 40:D115–D122. doi: 10.1093/nar/gkr1044. [DOI] [PMC free article] [PubMed] [Google Scholar]
- 31.Zhai P, Yang LS, Guo X, Wang Z, Guo JT, Wang XQ, et al. MetaComp: comprehensive analysis software for comparative meta-omics including comparative metagenomics. BMC Bioinformatics 2017; 18:434.doi: 10.1186/s12859-017-1849-8. [DOI] [PMC free article] [PubMed] [Google Scholar]
- 32.Storey JD. A direct approach to false discovery rates. J R Stat Soc B 2002; 64:479–498. doi: 10.1111/1467-9868.00346. [Google Scholar]
- 33.Friedman J, Alm EJ. Inferring correlation networks from genomic survey data. Plos Comput Biol 2012; 8:e1002687.doi: 10.1371/journal.pcbi.1002687. [DOI] [PMC free article] [PubMed] [Google Scholar]
- 34.Shannon P, Markiel A, Ozier O, Baliga NS, Wang JT, Ramage D, et al. Cytoscape: a software environment for integrated models of biomolecular interaction networks. Genome Res 2003; 13:2498–2504. doi: 10.1101/gr.1239303. [DOI] [PMC free article] [PubMed] [Google Scholar]
- 35.Bonchev D, Buck GA. Quantitative measures of network complexity. Complexity in Chemistry, Biology, and Ecology. 2005; Boston: Springer, 191–235. doi: 10.1007/0-387-25871-X_5. [Google Scholar]
- 36.Wu GD, Chen J, Hoffmann C, Bittinger K, Chen YY, Keibaugh SA, et al. Linking long-term dietary patterns with gut microbial enterotypes. Science 2011; 334:105–108. doi: 10.1126/science.1208344. [DOI] [PMC free article] [PubMed] [Google Scholar]
- 37.Arumugam M, Raes J, Pelletier E, Le Paslier D, Yamada T, Mende DR, et al. Enterotypes of the human gut microbiome. Nature 2011; 473:174–180. doi: 10.1038/nature09944. [DOI] [PMC free article] [PubMed] [Google Scholar]
- 38.Miquel S, Martín R, Rossi O, Bermúdez-Humarán LG, Chatel JM, Sokol H, et al. Faecalibacterium prausnitzii and human intestinal health. Curr Opin Microbial 2013; 16:255–261. doi: 10.1016/j.mib.2013.06.003. [DOI] [PubMed] [Google Scholar]
- 39.Jia W, Whitehead RN, Griffiths L, Dawson C, Waring RH, Ramsden DB, et al. Is the abundance of Faecalibacterium prausnitzii relevant to Crohn's disease? FEMS Microbiol Lett 2010; 310:138–144. doi: 10.1111/j.1574-6968.2010.02057.x. [DOI] [PMC free article] [PubMed] [Google Scholar]
- 40.Shankar V, Agans R, Holmes B, Raymer M, Paliy O. Do gut microbial communities differ in pediatric IBS and health? Gut Microbes 2013; 4:347–352. doi: 10.4161/gmic.24827. [DOI] [PMC free article] [PubMed] [Google Scholar]
- 41.Hungate RE. The Rumen and its Microbes. New York-London: Academic Press; 1996. [Google Scholar]
- 42.Rainey FA, Janssen PH. Phylogenetic analysis by 16S ribosomal DNA sequence comparison reveals two unrelated groups of species within the genus Ruminococcus. FEMS Microbiol Lett 1995; 129:69–73. doi: 10.1111/j.1574-6968.1995.tb07559.x. [DOI] [PubMed] [Google Scholar]
- 43.Chassard C, Delmas E, Robert C, Lawson PA, Bernalier-Donadille A. Ruminococcus champanellensis sp. nov., a cellulose-degrading bacterium from human gut microbiota. Int J Syst Evol Microbiol 2012; 62:138–143. doi: 10.1099/ijs.0.027375-0. [DOI] [PubMed] [Google Scholar]
- 44.Flint HJ, Bayer EA, Rincon MT, Lamed R, White BA. Polysaccharide utilization by gut bacteria: potential for new insights from genomic analysis. Nature Rev Microbiol 2008; 6:121–131. doi: 10.1038/nrmicro1817. [DOI] [PubMed] [Google Scholar]
- 45.Leitch EC, Walker AW, Duncan SH, Holtrop G, Flint HJ. Selective colonization of insoluble substrates by human faecal bacteria. Environ Microbiol 2007; 9:667–679. doi: 10.1111/j.1462-2920.2006.01186.x. [DOI] [PubMed] [Google Scholar]
- 46.Marteau P. Butyrate-producing bacteria as pharmabiotics for inflammatory bowel disease. Gut 2013; 62:1673.doi: 10.1136/gutjnl-2012-304240. [DOI] [PubMed] [Google Scholar]
- 47.Eeckhaut V, Machiels K, Perrier C, Romero C, Maes S, Flahou B, et al. Butyricicoccus pullicaecorum in inflammatory bowel disease. Gut 2013; 62:1745–1752. doi: 10.1136/gutjnl-2012-303611. [DOI] [PubMed] [Google Scholar]
- 48.Whorwell PJ, Altringer L, Morel J, Bond Y, Charbonneau D, O’Mahony L, et al. Efficacy of an encapsulated probiotic Bifidobacterium infantis 35624 in women with irritable bowel syndrome. Am J Gastroenterol 2006; 101:1581–1590. doi: 10.1111/j.1572-0241.2006.00734.x. [DOI] [PubMed] [Google Scholar]
- 49.O’Mahony L, McCarthy L, Kelly P, Hurley G, Luo F, Chen K, et al. Lactobacillus and Bifidobacterium in irritable bowel syndrome: symptom responses and relationship to cytokine profiles. Gastroenterology 2005; 128:541–551. doi: 10.1053/j.gastro.2004.11.050. [DOI] [PubMed] [Google Scholar]
- 50.McCarthy J, O’Mahony L, O’Callaghan L, Sheil B, Vaughan EE, Fitzsimons N, et al. Double blind, placebo controlled trial of two probiotic strains in interleukin 10 knockout mice and mechanistic link with cytokine balance. Gut 2003; 52:975–980. doi: 10.1136/gut.52.7.975. [DOI] [PMC free article] [PubMed] [Google Scholar]
- 51.Mazmanian SK, Round JL, Kasper DL. A microbial symbiosis factor prevents intestinal inflammatory disease. Nature 2008; 453:620–625. doi: 10.1038/nature07008. [DOI] [PubMed] [Google Scholar]
- 52.Xu J, Bjursell MK, Himrod J, Deng S, Carmichael LK, Chiang HC, et al. A genomic view of the human-Bacteroides thetaiotaomicron symbiosis. Science 2003; 299:2074–2076. doi: 10.1126/science.1080029. [DOI] [PubMed] [Google Scholar]
- 53.Fearnley C, Manning G, Bagnall M, Javed MA, Wassenaar TM, Newell DG. Identification of hyperinvasive Campylobacter jejuni strains isolated from poultry and human clinical sources. J Med Microbiol 2008; 57:570–580. doi: 10.1099/jmm.0.47803-0. [DOI] [PubMed] [Google Scholar]
- 54.Stahl M, Friis LM, Nothaft H, Liu X, Li J, Szymanski CM, et al. L-fucose utilization provides Campylobacter jejuni with a competitive advantage. Proc Natl Acad Sci U S A 2011; 108:7194–7199. doi: 10.1073/pnas.1014125108. [DOI] [PMC free article] [PubMed] [Google Scholar]
Associated Data
This section collects any data citations, data availability statements, or supplementary materials included in this article.


