Abstract
Background:
Six epidemic waves of human infection with avian influenza A (H7N9) virus have emerged in China with high mortality. However, study on quantitative relationship between clinical indices in ill persons and H7N9 outcome (fatal and non-fatal) is still unclear. A retrospective cohort study was conducted to collect laboratory-confirmed cases with H7N9 viral infection from 2013 to 2015 in 23 hospitals across 13 cities in Guangdong Province, China.
Methods:
Multivariable logistic regression model and classification tree model analyses were used to detect the threshold of selected clinical indices and risk factors for H7N9 death. The receiver operating characteristic curve (ROC) and analyses were used to compare survival and death distributions and differences between indices. A total of 143 cases with 90 survivors and 53 deaths were investigated.
Results:
Average age (Odds Ratio (OR) = 1.036, 95% Confidence Interval (CI) = 1.016–1.057), interval days between dates of onset and confirmation (OR = 1.078, 95% CI = 1.004–1.157), interval days between onset and oseltamivir treatment (OR = 5.923, 95% CI = 1.877–18.687), body temperature (BT) (OR = 3.612, 95% CI = 1.914–6.815), white blood cell count (WBC) (OR = 1.212, 95% CI = 1.092–1.346) were significantly associated with H7N9 death after adjusting for confounders. The chance of death from H7N9 infection was 80.0% if BT was over 38.1 °C, and chance of death is 67.4% if WBC count was higher than 9.5 (109/L). Only 27.1% of patients who began oseltamivir treatment less than 9.5 days after disease onset died, compared to 68.8% of those who started treatment more than 15.5 days after onset.
Conclusions:
The intervals between date of onset and confirmation of diagnosis, between date of onset to oseltamivir treatment, age, BT and WBC are found to be the best predictors of H7N9 mortality.
Keywords: Clinical markers, Hospitalization, Influenza A virus, H7N9 subtype
Introduction
Since the detection of first human infection with avian influenza A (H7N9) in March 2013 in Eastern China, H7N9 has become a considerable public health issue. Both domestic poultry and wild bird populations have been affected by H7N9. The H7N9 virus is different from seasonal influenza virus in terms of pathogenicity and fatal consequences.[1–4] As of 26 October 2017, a total of 1564 laboratory-confirmed human infections with H7N9 virus have been reported,[5] and 34%–47% of H7N9 patients died in the past 5 epidemics.[6] Despite various measures taken to prevent the spread of this emerging pathogen (eg, temporary closure of live poultry markets and other control measures), H7N9 virus still caused an unprecedented influenza epidemic in 2017, resulting in nearly half of the reported cases (746 cases) since the first case in 2013.
Evidence has shown that exposure to poultry in markets could increase the risk of infection with H7N9, even without direct contact with poultry.[7] Older age, smoking, chronic drug use, obesity and underlying diseases such as chronic lung disease[8,9] have been reported to be associated with H7N9 virus infection. In addition, previous studies have described that sustained decreasing oxygenation and slight lymphocytopenia, leukocytopenia and thrombocytopenia were often observed among fatal H7N9 cases.[10–12] However, so far, the modes of H7N9 transmission, from either animal to human or person to person, remain unclear,[13] which has greatly hindered efforts to reduce transmission and to protect vulnerable groups.
Due to the lack of understanding of modes of transmission and preventing H7N9 cases, medical treatment is of particularly importance in reducing severe cases and mortality.[14] The guidelines for diagnosis and treatment of H7N9 issued by World Health Organization and the National Health Commission of China recommend that antiviral therapy should be administered at the early stage of H7N9 infection. However, these guidelines have not always been well implemented.[15,16] Apart from pathogen detection, diagnosis of human infection with H7N9 can be made based on patients’ epidemiological history of avian contact, clinical symptoms and laboratory testing results.
Nevertheless, little research has been done on how to use clinical indices to predict the severity and fatal outcome of confirmed H7N9 cases due to small sample sizes of reported studies.[10,12,17,18] In addition, retrospective cohort study design has not been widely used in prior studies.[4,19] Moreover, the quantitative relationships between risk factors and outcome with credible thresholds have not been determined. The classification and regression tree (CART) method is non-parametric and non-linear method, based on the repeated partitioning of a sample into subgroups based on a certain criterion. Classification trees (CTs) are used to analyze categorical outcomes, while regression trees (RTs) are used to analyze continuous ones. The CART methodology has become increasingly popular in the medical field,[20] although no avian influenza-related studies using this methodology specifically have been published. CTs models with adequate sample sizes could help to identify the thresholds at which clinical indices may contribute to the mortality reduction.
This study attempted to use laboratory-confirmed H7N9 case records collected in Guangdong Province, China, to identify key clinical indices of H7N9 patients, to estimate the fatality risk, and to identify the threshold of these clinical indices for the probability of death from H7N9.
Methods
Ethical approval
All participants or their relatives were informed on the purpose of this study, and informed consent was obtained at the time of enrollment. This study was approved by the Human Research Ethics Committee of Sun Yat-sen University.
Enrollment of patients
We performed a retrospective cohort study with laboratory-confirmed H7N9 cases from 2013 to 2015 in Guangdong Province (the province with the second most H7N9 cases reported in China). Cases enrolled accounted for 78.1% (143/183) of total H7N9 cases reported in Guangdong from 2013 to 2015, covering the first 3 H7N9 epidemic waves in Guangdong according to a national reporting system used by Chinese Center for Disease Control and Prevention (China CDC); the other 21.9% of patients were lost to follow up due to inaccessible clinical records or privacy reasons. In this study, 143 confirmed H7N9 cases with clinical outcome and indices were collected from 23 hospitals across 13 cities. According to the guideline for H7N9 diagnosis and treatment issued by the National Health Commission of China, H7N9 cases were confirmed by local CDCs through polymerase chain reaction (PCR) analysis of patients’ respiratory specimens. Information on H7N9 cases was obtained through epidemiological investigations conducted by our trained investigators with medical background after obtaining patients and hospitals’ permission.
Data collection
A standard form was used to collect the H7N9 patient records from the hospitals with a dual-input database. Information on patients’ epidemiological and basic clinical characteristics was collected from hospitals staff, patients, or patients’ relatives. Detailed variables included age, gender, address of residence, occupation, exposure to poultry, underlying disease, onset symptoms, date of symptom onset, date of hospital admission, date of death or discharge, date of confirmation of diagnosis, dynamic clinical indices (laboratory blood examinations and body temperature) and medication. The clinical indices were recorded from each measurement of inpatient records. The underlying disease score was defined as the number of underlying chronic conditions the patients were suffering from. Specific underlying chronic diseases we investigated in this study were: hypertension, diabetes, chronic lung disease (CLD), chronic kidney disease (CKD), cardiovascular disease, history of surgery, cancer, cerebral infarction, long-term smoking, allergic history, chronic hepatitis or cirrhosis, and gastrointestinal disease. History of surgery was also collected.
Statistical analysis
Normally distributed data were presented as mean ± standard deviation (SD), and comparisons between groups based on mortality outcomes were performed using a t-test. Non-normally distributed data were presented as median and interquartile range (IQR), and comparisons between groups based on mortality outcomes were performed using a Wilcoxon rank sum test. Categorical variables were presented as numerical data and percentages, and statistical comparisons of groups based on mortality outcomes were conducted by a Chi-square (χ2) test. Variables stood out (P < 0.05) in the univariate analysis were considered as potential risk factors and confounders of mortality and were included in separate multivariable logistic regression models for each variable of interest for adjustment and control of possible confounders. Then, the odd ratios (ORs) for mortality in patients by specific clinical indices were presented. To evaluate the performance of indices in predicting the event of death, we used the receiver operating characteristic (ROC) curves for every significant clinical index after multivariable analysis and compared the area under curves (AUC).[21,22] We collected the AUC ≥ 0.5 of clinical indices to enter in the classification tree model to obtain the thresholds and fatality rate for each range (see below). The Kaplan-Meier plot and the log-rank test were used to compare the distribution and difference of survival and death. Hypothesis testing was conducted using a 2-sided test, with an alpha value of 0.05 to indicate statistical significance. All statistical analyses performed were conducted by IBM SPSS statistics v25.0 (IBM Corp., USA) or R Project 3.4.2.
The CART is a machine-learning method for constructing prediction models from data. It involves the recursive binary splitting of explanatory variables with each split then forming the basis of a single explanatory variable and two nodes, which were selected to maximize homogeneity (minimize impurity) of the resulting two nodes. The splitting criteria for minimizing node impurity are different in the two types of methods: for regression trees, least squares are used in the process of splitting; for our classification tree analysis, the Gini index is used to split off the largest category into a separate subset group. The K-fold cross-validation is performed to cutoff the large tree to the smallest tree size using estimated prediction error rate in this study. The best tree has an estimated error rate within one standard error of the minimum. The process of ten-fold cross-validation in the current study was conducted as follows: first, all the data were used to build the overly large tree; then, the dataset was divided into ten subsets; nine in ten subsets were used for training, and the subset ten left was used for testing. Hence, the different models were built with the subgroup data with the independent error rates. The best optional tree model was selected by the minimum error rate. The accuracy of the classification tree models including sensitivity, specificity, and consistency rate was calculated and assessed in this study.
Results
General characteristics of patients
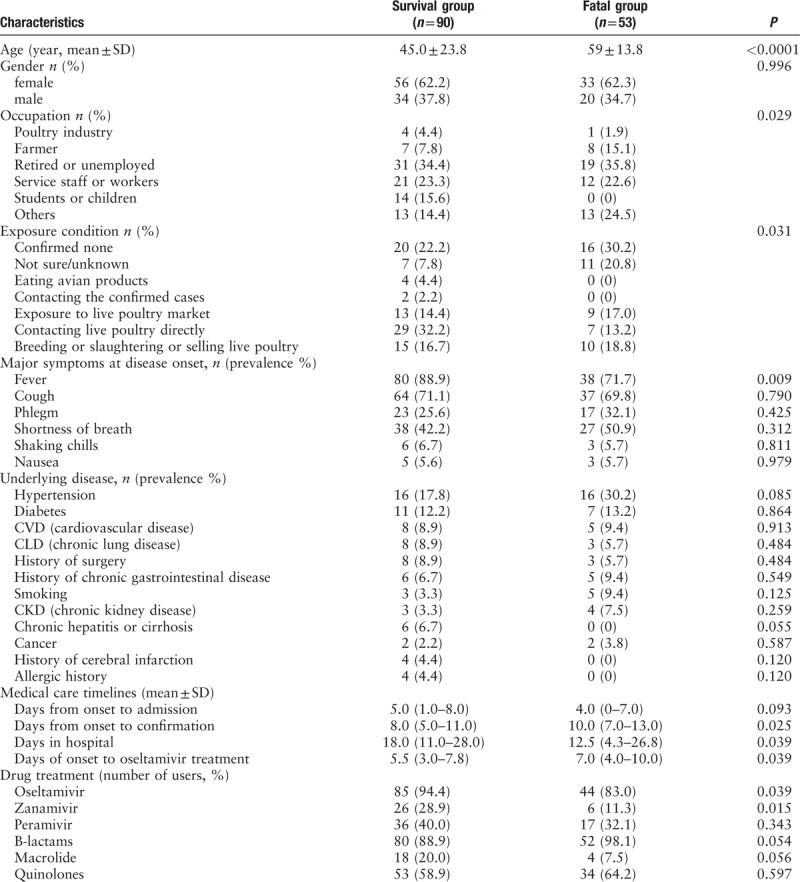
A total of 143 confirmed H7N9 cases from August 2013 to March 2015 in Guangdong province, China, were collected. Fifty-four (37.8%) were females and 89 (62.2%) were males, with a median age of 50.2 (IQR, 0.8–88.0) years. The 35.0% of the patients were retired or unemployed. As many as 89 (62.6%) patients had or possibly had a history of live poultry exposure. Moreover, 30% of survivors reported “no history of live poultry exposure or not sure”, and 51.0% patients who died reported “no history of live poultry exposure or not sure” (P < 0.05). The range from symptom onset to hospitalization was 0–31 days (mean, 7 days), and the range from symptom onset to confirmation of diagnosis was 0–36 days (mean, 9.5 days). The length of hospital stay from admission to discharge/death was 2–95 days (mean, 20.1 days). The main symptoms at disease onset were fever (82.5%) and cough (70.6%). Hypertension (22.4%) and diabetes (12.6%) were the most common underlying chronic diseases among all patients. Demographic characteristics and symptoms of 143 H7N9 cases stratified by survival and death outcome are depicted in Table 1, and age, occupation, exposure condition, fever symptom, days from onset to confirmation, days from onset to oseltamivir treatment and drug treatment were significantly different between 2 groups (P < 0.1).
Table 1.
Demographic characteristics and symptoms of 143 patients with H7N9 according clinical outcome from 2013 to 2015, Guangdong, China
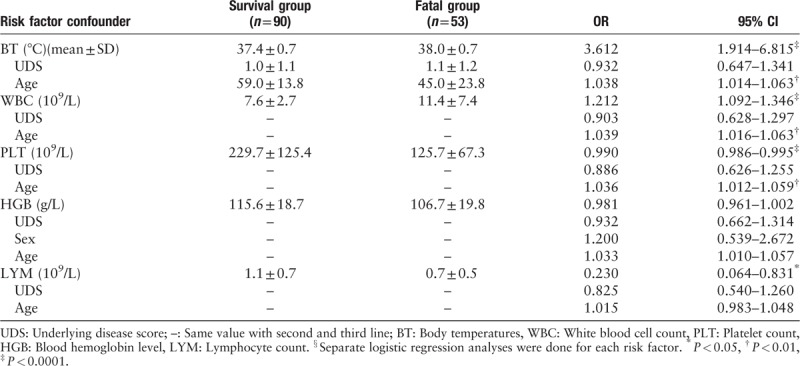
Adjusted odds ratios for clinical indices in the multivariate regression model
The dynamic clinical indices measured in this study including the laboratory blood examination and body temperature occurred in patient medical records from 1 to 47 times (mean = 10.39). A separate multivariate logistic regression analysis was performed for each of the indices to adjust for confounders. The average value of the body temperature (BT), white blood cell (WBC), hemoglobin (HGB), platelet (PLT), and lymphocytes (LYM) were selected as potential predictors of death and were entered in the multivariate analysis. Variations of BT, WBC, HBG and PLT between the fatality and survival groups during hospitalization are shown in Figure 1. After adjusting for confounders (underlying disease score and age for BT, WBC, HGB, PLT, and LYM, and gender for HGB), in separate logistic regression models for each of the clinical indices, the average BT, WBC, PLT and LYM were each identified as risk factors of mortality (all P < 0.05) adjusted for age, sex and/or underlying disease score, as appropriate to each analysis. Fatal cases had higher BT and WBC values, but lower PLT and LYM values [Table 2].
Figure 1.
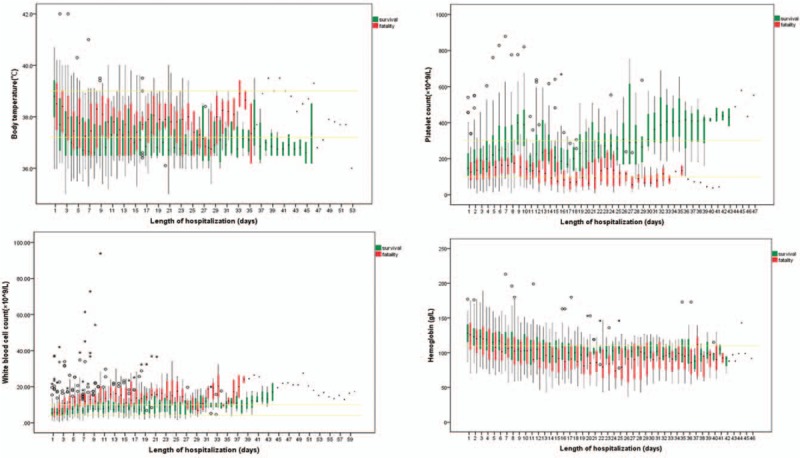
Variation of body temperature, platelet count, white blood cell count, hemoglobin between the fatality and survival groups during hospitalization among 143 H7N9 cases. The yellow lines represent the average value of survival and fatality groups; The graphs show box plots: the black dot in each colored bar is the median; the colored sections are the interquartile range (from the first to the third quartiles); circles represent exceptional values of fatal cases; asterisks represent exceptional values of survival cases.
Table 2.
The odds ratios (OR) and 95% confidence limits (CI) of average laboratory examination results/BT for risk of H7N9 mortality of 143 cases after adjustment for confounders§, 2013–2015, Guangdong, China
The ROC curves of clinical indices on predicting mortality
All variables stood out in both univariate analysis and multivariate analysis, including days of onset to confirmation, days of onset to oseltamivir treatment, average age, BT, WBC, PLT, HGB and LYM, were entered the ROC curves model for H7N9 mortality prediction. Five clinical indices were selected with areas under the curve (AUC) > 0.5 [Figure 2]. The AUC for the BT, WBC, age, days from onset to oseltamivir treatment and days from onset to confirmation were 0.734, 0.728, 0.674, 0.630, and 0.569, respectively.
Figure 2.
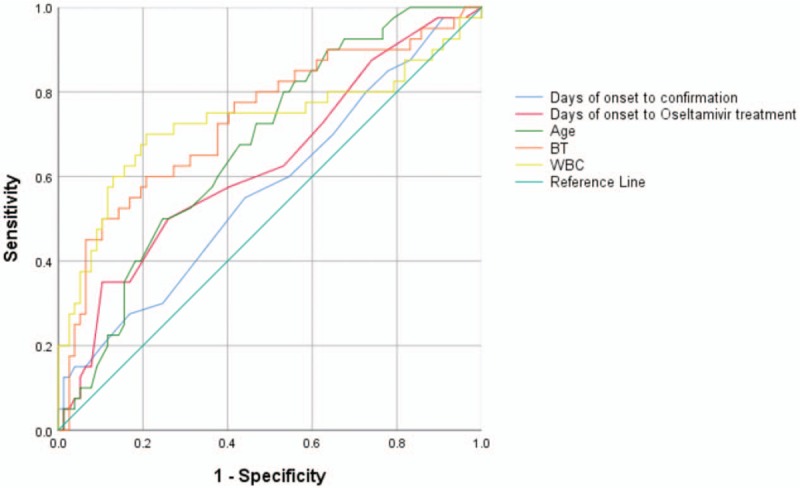
The ROC (receiver operating characteristic) curves for clinical indices in predicting mortality of 143 H7N9 cases. Area under the curve: Days from onset to confirmation of diagnosis, 0.569; Days from onset to oseltamivir treatment, 0.630; Age, 0.674; BT (body temperature) average, 0.734; WBC (white blood cell) average, 0.728.
The classification tree model for probability of death
Classification tree analysis was conducted to explore the thresholds for 5 indices that were AUC ≥ 0.5 with higher sensitivity and specificity for predicting fatal outcomes, as described above [Figure 3]. The fatality rate was 12.5% when the age of H7N9 patient was less than 41.5, and the fatality rate was 42.2% when the age was 41.5 to 63.5, and the fatality rate reached 53.8% if patient over 63.5 yr old [Figure 2A]. There was an 85.7% chance of death from H7N9 if the interval between date of onset and confirmation was over 17.5 days, whereas fatality rate is only 34.8% if such interval was below 17.5 [Figure 2B]. The interval between date of onset to oseltamivir treatment between 9.5 and 15.5 led to 42.9% of fatality rate, while fatality rate reached 68.8% if the interval is more than 15.5 [Figure 2C]. There was an 80.0% chance of death from H7N9 if BT was over 38.1 °C compared with 25% of fatality rate if BT was below 38.1 °C [Figure 2D]. For WBC, a threshold was found at 9.5 (109/L), after which mortality rate was numerically higher (67.4% vs 24.0%) [see panel Figure 3E].
Figure 3.
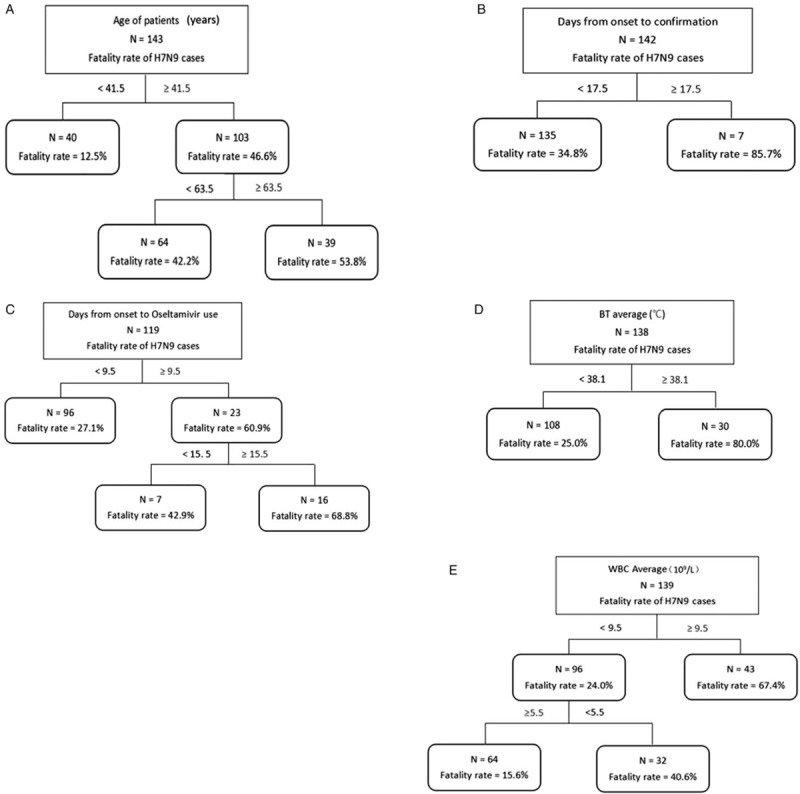
Results of classification tree model of 5 indices for probability of death of H7N9. A: Age of patients; B: Days from onset to confirmation; C: Days from onset to Oseltamivir use; D: Body temperature (BT) average; E: White blood cell (WBC) average.
Survival curves by patients with indices of thresholds range
The Kaplan-Meier survival analysis indicated that survival curves compared the difference of length of hospitalization in several groups with the range of clinical indices according to the CART thresholds for predicting death of H7N9 cases. Two of 5 indices performed showed dramatically significant difference among different thresholds ranges (P < 0.0001, Figure 4). Patients with higher BT and abnormal value had significantly shortened length of survival than those with lower BT and normal WBC. Days of onset to confirmation, days of onset to oseltamivir treatment and age also showed statistically significant differences between groups with their thresholds range (P = 0.007, 0.004, and 0.018, respectively).
Figure 4.
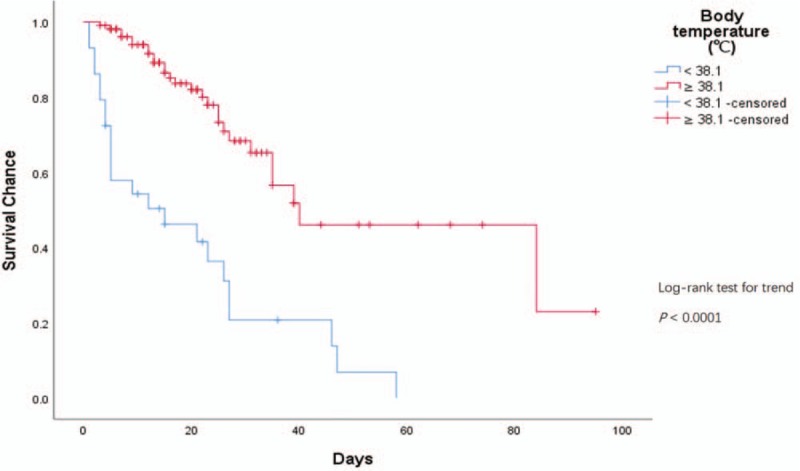
Kaplan-Meier survival curves of BT (body temperature) average and WBC (white blood cell) average with thresholds for H7N9 survival chance, by duration since onset of illness.
Discussion
To the best of our knowledge, few retrospective cohort study studies including survival and fatal H7N9 patients have been conducted to explore clinical indices as predictors of death. In our research, all factors, including demographic characteristics, underlying diseases, clinical symptom and parameters of routine blood examination, were selected to estimate the most specific and sensitive indicators of the risk of death from H7N9. After performing a three-step statistical analysis, days from onset to confirmation of diagnosis, days from onset to oseltamivir treatment, age, BT and WBC were found to be best indices for predicting in-hospital deaths.
About 70% of laboratory-confirmed human infections with A H7N9 virus reported exposure to poultry within ten days before the onset of symptoms across five epidemics. Visiting a live poultry market and exposure to backyard poultry were the two major forms of poultry exposure.[6] Most human cases were attributable to poultry exposure at live-poultry markets, where most positive isolates were sampled.[23] However, in this study, we found that more fatal cases reported “no direct or indirect contact with live poultry before onset or not sure” and those who died had longer interval between date of onset and confirmation compared with survival group that survived. Generally, physicians suspect a diagnosis of H7N9 based on epidemiological history. However, negative exposure history may mislead diagnosis and delay systematic treatment, which may be one of the causes of severe cases and deaths. One possible explanation for the low rate of reported poultry exposure in fatal cases in our study, which is different from other studies,[8,24] is that more fatal cases in our study were older and already at high risk of mortality, and to have poor memory to recall their exposure history.
The CART is a useful analytical tool to identify thresholds for continuous variables in which the outcome of interest is statistically significantly different between the resulting groups. In this study, we also used the CART analysis to demonstrate that abnormal value of body temperature, WBC, days from disease onset to confirmation of diagnosis, days of onset to oseltamivir treatment and age substantially increased the risk of death in patients infected with H7N9, and to derive appropriate thresholds. Logistic regression analyses were used to control for confounding variables separately for each of the indices of interest.[25]
The results of previous analyses examining the impact of delayed oseltamivir treatment on outcomes of H7N9 patients are consistent with our findings.[8,26,27] The guidelines for diagnosis and treatment of H7N9 issued by the World Health Organization and the National Health and Family Planning Commission of China recommend that empirical oseltamivir therapy should be initiated as soon as possible.[15,28] In this study, we also found that the length of oseltamivir treatment in the group that died was significantly shorter than the survival group, and the group with a time from onset to oseltamivir treatment of fewer than 9.5 days, had a 27.1% fatality rate compared to 68.8% of those who started treatment more than 15.5 days after onset. Many patients with severe H7N9 infection are of older age with underlying diseases. Having neuraminidase inhibitors, such as oseltamivir and zanamivir, as their main antiviral medication for H7N9 were consistent with the findings of other studies.[9,29] It is noteworthy that more patients who survived appear to be febrile on the first day in the hospital than those who died. Usually, the rise in body temperature helps the individual resolve an infection. This could indicate that patients with potential risk of death are less capable of mobilizing their immune system.
A high WBC usually suggests inflammation. We found that the average WBC in the groups that survived and died were in the normal range at admission (the group that died was slightly higher). However, the WBC average and WBC range among the group that died increased over the course of the hospitalization (higher than 10, the maximum limit of normal value), while the WBC values in the survival group declined as the hospitalization progressed. The average maximum value of WBC in the group that died was also significantly higher than that of survival cases. These WBC indices could be used to differentiate the survival and death groups. The Circular of the Office of the National Health and Family Planning Commission on the Issue of the Diagnosis and Treatment of Human Infection H7N9 Avian Influenza (latest 2014 edition)[28] indicates that total WBC is generally in the normal range at the beginning H7N9 infection, which is consistent with our study finding. However, total WBC and lymphocyte reduction in patients with severe disease were in conflict with our findings. This might be attributed to different complications that eventually resulted in death. A decreased WBC may indicate a decreased defense against underlying infection. Regardless, WBC still plays an important role in early detection and treatment, especially in predicting the progression into severe cases. The risk factors for poor outcome that we identified in this study, such as body temperature over 38 °C and reduction of absolute value of lymphocytes, were similar to findings of prior studies.[17] This association should be studied further to understand the mechanism of change of clinical indicators over the course of the disease and how it develops into the different outcomes of survival and death. Overall, incorporating blood laboratory indices and body temperature with abnormal values into determining the prognosis for H7N9 patients will provide us with a more comprehensive view of illness severity and the likely outcome.
Our study is subject to limitations. We were unable to collect the information on laboratory results for all patients, due to the heterogeneity in clinical record collection across different hospitals. However, such information was only missed in 2.8%–3.5% of total cases. We used the mean values to build the model for considering the description of the central tendency of each clinical index, which may be affected by a few extreme values. In addition, a separate logistic regression was done for each predictive risk factor so the independent contribution of each of the predictive risk factors for mortality could not be determined.
In conclusion, this study indicates that self-reported history of exposure did not always provide a positive clue for the diagnosis of H7N9, and may even cause delayed confirmation and treatment. Therefore, early confirmation of suspected cases and treatment is strongly encouraged. We screened a series of epidemiological and clinical variables through rigorous statistical methods to provide a reference for the treatment and survival prediction for H7N9 cases. The daily measurement of body temperature and blood clinical indices are important indicators of disease progression, and this study indicates that it is quantitatively associated with the outcome of death.
Acknowledgements
We would like to thank all the members in Dr. Lu's team, especially thank to Ying Chen, Huimin Bao, Mingling Lu and Jianyong Wu. We thank Pro. Wenbiao Hu and his team from Queensland University of Technology, Australia. We also thank all doctors and participants involved in this study in Guangdong Province.
Funding
This study was supported by grants from the National Science and Technology Major Project of China (No. 2018ZX10101002-001-001), and National Key Research and Development Program of China (No. 2018YFD0500500).
Conflicts of interest
None.
Footnotes
How to cite this article: Yang Y, Li X, Birkhead GS, Zheng Z, Lu JH. Clinical indices and mortality of hospitalized avian influenza A (H7N9) patients in Guangdong, China. Chin Med J 2019;000. doi: 10.1097/CM9.0000000000000043
References
- 1.World Health Organization (WHO). Influenza (Avian and other zoonotic). 2018. http://www.who.int/mediacentre/factsheets/avian_influenza/en/ [Google Scholar]
- 2.World Health Organization (WHO). Early response to the emergence of influenza A(H7N9) virus in humans in China. 2014. http://www.who.int/mediacentre/factsheets/avian_influenza/en/ [DOI] [PMC free article] [PubMed] [Google Scholar]
- 3.Ai J, Huang Y, Xu K, Ren D, Qi X, Ji H, et al. Case-control study of risk factors for human infection with influenza A(H7N9) virus in Jiangsu Province, China, 2013. Euro Surveill: Bull Eur Sur Les Mal Transm = Eur Commun Dis Bull 2013; 18:20510.doi: 10.2807/1560-7917.ES2013.18.26.20510. [DOI] [PubMed] [Google Scholar]
- 4.Gao HN, Lu HZ, Cao B, Du B, Shang H, Gan JH, et al. Clinical findings in 111 cases of influenza A (H7N9) virus infection. N Engl J Med 2013; 368:2277–2285. doi: 10.1056/NEJMoa1305584. [DOI] [PubMed] [Google Scholar]
- 5.World Health Organization (WHO). Human infection with avian influenza A(H7N9) virus – China. 2017. http://www.who.int/csr/don/26-october-2017-ah7n9-china/en/ [Google Scholar]
- 6.Wang X, Jiang H, Wu P, Uyeki TM, Feng L, Lai S, et al. Epidemiology of avian influenza A H7N9 virus in human beings across five epidemics in mainland China, 2013–17: an epidemiological study of laboratory-confirmed case series. Lancet Infect Dis 2017; 17:822–832. doi: 10.1016/s1473-3099(17)30323-7. [DOI] [PMC free article] [PubMed] [Google Scholar]
- 7.Liu B, Havers F, Chen E, Yuan Z, Yuan H, Ou J, et al. Risk factors for influenza A(H7N9) disease–China, 2013. Clin Infect Dis 2014; 59:787–794. doi: 10.1093/cid/ciu423. [DOI] [PubMed] [Google Scholar]
- 8.Liu S, Sun J, Cai J, Miao Z, Lu M, Qin S, et al. Epidemiological, clinical and viral characteristics of fatal cases of human avian influenza A (H7N9) virus in Zhejiang Province, China. J Infect 2013; 67:595–605. doi: 10.1016/j.jinf.2013.08.007. [DOI] [PubMed] [Google Scholar]
- 9.Hu Y, Lu S, Song Z, Wang W, Hao P, Li J, et al. Association between adverse clinical outcome in human disease caused by novel influenza A H7N9 virus and sustained viral shedding and emergence of antiviral resistance. Lancet 2013; 381:2273–2279. doi: 10.1016/s0140-6736(13)61125-3. [DOI] [PubMed] [Google Scholar]
- 10.Ji H, Gu Q, Chen LL, Xu K, Ling X, Bao CJ, et al. Epidemiological and clinical characteristics and risk factors for death of patients with avian influenza A H7N9 virus infection from Jiangsu Province, Eastern China. PLoS One 2014; 9:e89581.doi: 10.1371/journal.pone.0089581. [DOI] [PMC free article] [PubMed] [Google Scholar]
- 11.Shi J, Xie J, He Z, Hu Y, He Y, Huang Q, et al. A detailed epidemiological and clinical description of 6 human cases of avian-origin influenza A (H7N9) virus infection in Shanghai. PLoS One 2013; 8:e77651.doi: 10.1371/journal.pone.0077651. [DOI] [PMC free article] [PubMed] [Google Scholar]
- 12.Wang H, Xiao X, Lu J, Chen Z, Li K, Liu H, et al. Factors associated with clinical outcome in 25 patients with avian influenza A (H7N9) infection in Guangzhou, China. BMC Infect Dis 2016; 16:534.doi: 10.1186/s12879-016-1840-4. [DOI] [PMC free article] [PubMed] [Google Scholar]
- 13.Tanner WD, Toth DJ, Gundlapalli AV. The pandemic potential of avian influenza A(H7N9) virus: a review. Epidemiol Infect 2015; 143:3359–3374. doi: 10.1017/S0950268815001570. [DOI] [PMC free article] [PubMed] [Google Scholar]
- 14.Zhang Y, Liu J, Yu L, Zhou N, Ding W, Zheng S, et al. Prevalence and characteristics of hypoxic hepatitis in the largest single-centre cohort of avian influenza A(H7N9) virus-infected patients with severe liver impairment in the intensive care unit. Emerg Microbes Infect 2016; 5 e1. doi: 10.1038/emi.2016.1. [DOI] [PMC free article] [PubMed] [Google Scholar]
- 15.World Health Organization (WHO). Avian influenza A(H7N9) virus: post-exposure anti-viral chemoprophylaxis of close contacts of a patient with confirmed H7N9 virus infection and/or high risk poultry/environmental exposures. 2014. http://www.who.int/influenza/human_animal_interface/influenza_h7n9/13_January_2013_PEP_recs.pdf?ua=1.%2520Accessed%252021%2520April%25202017 [Google Scholar]
- 16.National Health and Family Planning Commission of People's Republic of China. Protocol for prevention and control of the A(H7N9) human infection outbreak (3rd edition). 2014. http://www.nhfpc.gov.cn/jkj/s3577/201401/8c1828375a7949cd85454a76bb84f23a.shtml [Google Scholar]
- 17.Yang ZF, Mok CK, Liu XQ, Li XB, He JF, Guan WD, et al. Clinical, virological and immunological features from patients infected with re-emergent avian-origin human H7N9 influenza disease of varying severity in Guangdong province. PLoS One 2015; 10:e0117846.doi: 10.1371/journal.pone.0117846. [DOI] [PMC free article] [PubMed] [Google Scholar]
- 18.Lu S, Zheng Y, Li T, Hu Y, Liu X, Xi X, et al. Clinical findings for early human cases of influenza A(H7N9) virus infection, Shanghai, China. Emerg Infect Dis 2013; 19: doi: 10.3201/eid1907.130612. [DOI] [PMC free article] [PubMed] [Google Scholar]
- 19.Shen Y, Lu H, Qi T, Gu Y, Xiang M, Lu S, et al. Fatal cases of human infection with avian influenza A (H7N9) virus in Shanghai, China in 2013. Biosci Trends 2015; 9:73–78. doi: 10.5582/bst.2014.01113. [DOI] [PubMed] [Google Scholar]
- 20.2015; Henrard S, Speybroeck N, Hermans C. Classification and regression tree analysis vs. multivariable linear and logistic regression methods as statistical tools for studying haemophilia. Haemophilia. 21:715–722. doi: 10.1111/hae.12778. [DOI] [PubMed] [Google Scholar]
- 21.Zhang S, Cui YL, Diao MY, Chen DC, Lin ZF. Use of platelet indices for determining illness severity and predicting prognosis in critically Ill patients. Chin Med J 2015; 128:2012–2018. doi: 10.4103/0366-6999.161346. [DOI] [PMC free article] [PubMed] [Google Scholar]
- 22.Winter K, Zipprich J, Harriman K, Murray EL, Gornbein J, Hammer SJ, et al. Risk factors associated with infant deaths from pertussis: a case-control study. Clin Infect Dis 2015; 61:1099–1106. doi: 10.1093/cid/civ472. [DOI] [PubMed] [Google Scholar]
- 23.Gilbert M, Golding N, Zhou H, Wint GR, Robinson TP, Tatem AJ, et al. Predicting the risk of avian influenza A H7N9 infection in live-poultry markets across Asia. Nat Commun 2014; 5:4116.doi: 10.1038/ncomms5116. [DOI] [PMC free article] [PubMed] [Google Scholar]
- 24.Jiang H, Wu P, Uyeki TM, He J, Deng Z, Xu W, et al. Preliminary epidemiologic assessment of human infections with highly pathogenic avian influenza A(H5N6) virus, China. Clin Infect Dis 2017; 65:383–388. doi: 10.1093/cid/cix334. [DOI] [PMC free article] [PubMed] [Google Scholar]
- 25.Lodise TP, McKinnon PS, Swiderski L, Rybak MJ. Outcomes analysis of delayed antibiotic treatment for hospital-acquired Staphylococcus aureus bacteremia. Clin Infect Dis 2003; 36:1418–1423. doi: 10.1086/375057. [DOI] [PubMed] [Google Scholar]
- 26.Zheng S, Wang Y, Yu F, Cui D, Xie G, Yang X, et al. Benefit of early initiation of neuraminidase inhibitor treatment to hospitalized patients with avian influenza A (H7N9) virus. Clin Infect Dis 2018; 66:1054–1060. doi: 10.1093/cid/cix930. [DOI] [PubMed] [Google Scholar]
- 27.Zhang YL, Yang SG, Li G, Yuan J, Ding H, Mao C, et al. Clinical and epidemiological characteristics of a case of avian influenza A H5N6 virus infection. J Infect 2016; 72:629–631. doi: 10.1016/j.jinf.2016.02.012. [DOI] [PubMed] [Google Scholar]
- 28.National Health and Family Planning Commission of People's Republic of China. Circular of the Office of the National Health and Family Planning Commission on the issue of the diagnosis and treatment of human infection H7N9 Avian Influenza (2014 edition). 2014. http://www.moh.gov.cn/yzygj/s3593g/201401/3f69fe196ecb4cfc8a2d6d96182f8b22.shtml [Google Scholar]
- 29.Li Q, Zhou L, Zhou M, Chen Z, Li F, Wu H, et al. Epidemiology of human infections with avian influenza A(H7N9) virus in China. N Engl J Med 2014; 370:520–532. doi: 10.1056/NEJMoa1304617. [DOI] [PMC free article] [PubMed] [Google Scholar]


