

Abstract
The basic pattern of activity underlying stepping in mammals is generated by a neural network located in the caudal spinal cord. Within this network, the specific circuitry coordinating left–right alternation has been shown to involve several groups of molecularly defined interneurons. Here we characterize a population of spinal neurons that express the Wilms' tumor 1 (WT1) gene and investigate their role during locomotor activity in mice of both sexes. We demonstrate that WT1-expressing cells are located in the ventromedial region of the spinal cord of mice and are also present in the human spinal cord. In the mouse, these cells are inhibitory, project axons to the contralateral spinal cord, terminate in close proximity to other commissural interneuron subtypes, and are essential for appropriate left–right alternation during locomotion. In addition to identifying WT1-expressing interneurons as a key component of the locomotor circuitry, this study provides insight into the manner in which several populations of molecularly defined interneurons are interconnected to generate coordinated motor activity on either side of the body during stepping.
SIGNIFICANCE STATEMENT In this study, we characterize WT1-expressing spinal interneurons in mice and demonstrate that they are commissurally projecting and inhibitory. Silencing of this neuronal population during a locomotor task results in a complete breakdown of left–right alternation, whereas flexor-extensor alternation was not significantly affected. Axons of WT1 neurons are shown to terminate nearby commissural interneurons, which coordinate motoneuron activity during locomotion, and presumably regulate their activity. Finally, the WT1 gene is shown to be present in the spinal cord of humans, raising the possibility of functional homology between these species. This study not only identifies a key component of the locomotor circuitry but also begins to unravel the connectivity among the growing number of molecularly defined interneurons that comprise this neural network.
Keywords: CPG, interneuron, locomotion
Introduction
The ventral region of the caudal spinal cord in mammals houses a neural circuit known as the locomotor central pattern generator (CPG), which is responsible for producing the basic pattern of rhythmic activity that underlies stepping (Kiehn, 2016). Since the turn of the century, significant advances have been made in our understanding of the structure and function of the locomotor CPG. This has been propelled by an experimental approach, which enables populations of spinal interneurons to be identified and manipulated based on the transcription factors they express during development (Goulding, 2009). Targeted inactivation of select interneuronal populations has allowed for the identification of those involved in a number of essential locomotor functions (Kiehn, 2016).
Control of left–right alternation is perhaps the aspect of locomotion that has been best characterized. Coordination of motor activity on the left and right sides of the spinal cord has been shown to depend on excitatory and inhibitory commissural interneurons, which project both intrasegmental and intersegmental axons (Butt and Kiehn, 2003; Quinlan and Kiehn, 2007). Initial studies investigating the involvement of genetically defined interneuronal populations demonstrated that left–right alternation is partially disrupted when Dbx1-expressing interneurons (i.e., the V0 population) are absent (Lanuza et al., 2004). Subsequently, it was demonstrated that Dbx1-expressing V0D cells were responsible for coordinating left–right alternation via monosynaptic inhibition of contralateral motoneurons at slower locomotor speeds, whereas Evx1-expressing V0V cells served this function, likely via a multisynaptic pathway, as locomotor speed increased (Talpalar et al., 2013). The discrete control of motor neurons on either side of the spinal cord is complex, and it is now apparent that appropriate activity of these commissural interneurons is modulated by additional cell types, including the ipsilaterally projecting V2a population, which are excitatory, express the transcription factor Chx10, receive input from putative rhythm-generating cells (Dougherty et al., 2013), and synapse with the V0 population (Crone et al., 2008).
The dI6 interneurons, which express the homeobox transcription factor Lbx1 in the progenitor stages (Gross et al., 2002; Müller et al., 2002), are situated in the ventromedial spinal cord postnatally and have been divided into two genetically distinct subsets based on the expression of either DMRT3 or WT1 (Vallstedt and Kullander, 2013). The DMRT3-expressing subpopulation have been shown to be exclusively inhibitory, project axons to motoneurons on both sides of the spinal cord, and have been implicated in the development of ipsilateral and contralateral coordination (Andersson et al., 2012). Here we characterize the WT1-expressing subset of dI6 interneurons and investigate their role during locomotion. Our results indicate that these neurons are overwhelmingly inhibitory, project commissural axons which terminate in close proximity to both Evx1-expressing V0V, and DMRT3-expressing dI6 neurons, and severe deficits in left–right alternation occur when they are selectively silenced during a locomotor task. Together, these findings provide key insight into the network structure of the locomotor CPG by suggesting that WT1-expressing neurons control motor output on either side of the spinal cord by regulating the activity of commissural interneurons. Finally, our finding that WT1 is expressed in the adult human spinal cord indicates that expression of this gene is conserved in the CNS of the mouse and human. These neurons are thus the first genetically defined interneuronal population involved in murine locomotion that have been mapped to the spinal cord in humans, raising the possibility that they play a similar role in regulating bipedal stepping.
Materials and Methods
Animals.
All procedures were performed on mice of either sex in accordance with the Canadian Council on Animal Welfare and approved by the Animal Welfare Committee at the University of Alberta. The following mouse strains were used (all strains with stock numbers indicated are from The Jackson Laboratory): WT1CreGFP (#010911, RRID:IMSR_JAX:010911), WT1CreER (#010912, RRID:IMSR_JAX:010912), VGlut2Cre (#028863, RRID:IMSR_JAX:028863), ROSA26tdTomato (#007909, RRID:IMSR_JAX:007909), R26-LSL-Gi-designer receptors exclusively activated by designer drugs (DREADD) (#026219, RRID:IMSR_JAX:026219), and GAD67GFP (gift from Dr. Yuchio Yanagawa, Gunma University RRID:IMSR_RBRC09645).
Immunohistochemistry.
Immunohistochemistry was performed as previously described (Griener et al., 2017). Briefly, frozen or wax serial sections of whole embryos, postnatal mouse spinal cords, or human lumbar spinal cord were cut and incubated with primary antibodies overnight (4°C) followed by incubation with species-specific secondary antibodies conjugated to Cy2, Cy3, or Cy5 for 4 h at room temperature. After coverslipping, images were collected using a Leica TCS SP8 MP microscope running Leica Application Suite X software, and figures were prepared with Adobe Photoshop and Corel Draw. Primary antibodies used were as follows: WT1 (rabbit, 1:100, Santa Cruz Biotechnology, RRID:AB_632611), GFP (goat, 1:5000, gift from Eusera), glycine (rat, 1:1000, Immunosolutions, RRID:AB_10013222), En1 (gift from Jessel laboratory, Columbia University, guinea pig, 1:1000), Chx10 (mouse, 1:200, Santa Cruz Biotechnology, RRID:AB_10842442), DMRT3 (goat, 1:100, Santa Cruz Biotechnology, RRID:AB_2091664), synaptotagmin (rabbit, 1:200, Alomone Labs), Evx1 (mouse, 1:100, DSHB, RRID:AB_2246711), and NeuN (mouse, 1:500, Millipore, RRID:AB_177621).
Retrograde trans-synaptic labeling.
Hindlimb extensor (gastrocnemius) or flexor (tibialis anterior) muscles in anesthetized P0 wild-type mice were injected with 1–2 μl of PRV-152 viral stock (∼6.68 × 10⁸ infectious units per μl), a strain of pseudorabies virus that expresses GFP in all infected cells (Kerman et al., 2003). All animals were killed 40 or 46 h after injection as these are times at which interneurons that are monosynaptically connected to motoneurons have been shown to be infected with the virus (Jovanovic et al., 2010). Spinal cords were dissected out and processed for immunohistochemistry as described above. The pattern and density of viral labeling in all spinal cords included in the dataset were similar to those previously reported (Jovanovic et al., 2010).
Electrophysiology.
The in vitro upright spinal cord preparation was used to make whole-cell patch-clamp recordings from WT1-expressing interneurons. Briefly, neonatal WT1CreGFP and WT1CreER;R26-LSL-Gi-DREADD pups were anesthetized, decapitated, and eviscerated. Spinal cords were dissected out in ice-cold oxygenated aCSF containing the following (in mm): 120 NaCl, 3 KCl, 1.25 NaH2PO4, 26 NaHCO3, 1.5 MgSO4, 1.5 CaCl2, 5 HEPES, 10 N-acetyl- l-cysteine, and 10 l-glucose. The dorsal side of the spinal cord was glued to a plastic support, which was bent at an angle of 90 degrees at the upper thoracic level. The specimen was then transferred to a vibratome, and a transverse cut was made at a mid-lumbar segment. Care was taken throughout to ensure that the ventral roots remained intact. After a 30 min recovery period in oxygenated aCSF, the preparation (including the plastic support) was placed in a recording chamber located under the objective lens of an upright fluorescent microscope and constantly perfused with oxygenated recording aCSF composed of the following (in mm): 111 NaCl, 3.08 KCl, 11 glucose, 25 NaHCO3, 1.18 KH2PO4, 1.25 MgSO4, and 2.52 CaCl2.
For whole-cell recording, patch electrodes (tip resistance: 5–7 mΩ) were filled with the following (in mm): 140 potassium gluconate, 1 NaCl, 0.5 CaCl2, 2 MgCl2, 1ATP-Na2, and 10 HEPES, pH adjusted to 7.30. An infrared differential interference contrast and bandpass (515–565 nm) filter was used to target GFP+ and mCitrane+ cells located along the extent of the cut surface of the spinal cord. Intracellular signals from all cells were amplified, digitized, and acquired on a PC.
Fictive locomotion was induced in upright spinal cords, as well as intact spinal cords isolated from newborn WT1CreER;R26-LSL-Gi-DREADD, or wild-type littermates (which were simply isolated and pinned in a recording chamber) via addition of NMDA (5 μm) and 5-hydroxytryptamine creatine sulfate complex (5-HT, 5–15 μm) to the perfusate. In the intact spinal cord fictive locomotor activity was monitored via electroneurogram (ENG) recording acquired from bipolar suction electrodes positioned on one, two, or three of the flexor-related (L1-L3) and extensor-related (L5) lumbar ventral roots. For the upright spinal cord preparation, fictive locomotor activity was recorded from ventral roots at the level of the transverse cut, typically L3. The ENG signals were amplified, filtered, digitized, and recorded on a PC. For fictive locomotor experiments on WT1CreER;R26-LSL-Gi-DREADD mice, increasing concentrations (500 nm, 10 μm, 100 μm) of clozapine N-oxide (CNO, Cayman Chemical) were added to the perfusate after a minimum of 5 min of stable fictive locomotion. Each concentration was applied for 30 min, and no measurements were made for at least 10 min after a new concentration was applied to allow sufficient time for the drug to penetrate the preparation. For patch-clamp experiments, CNO was applied after the resting membrane potential remained stable for 2 min. Because we were investigating the effect of CNO on cells located just below the cut surface of the spinal cord, each concentration was applied for 5 min before washing.
Retrograde dextran tracing.
Newborn (P0) WT1CreGFP or wild-type mice were anesthetized and spinal cords were dissected out in oxygenated aCSF. A unilateral cut was made into the ventral spinal cord at the L2 segment, and tetramethylrhodamine dextran (TMRD) crystals were inserted using insect pins. Spinal cords were then incubated in oxygenated aCSF for 16–18 h at room temperature. Following incubation, the tissue was fixed overnight with 4% PFA in 0.1 m PBS and processed for immunohistochemistry using antibodies to GFP (WT1CreGFP mouse) or WT1 (wild-type mouse); TMRD was visible without an antibody.
Data analysis and statistics.
For immunohistochemical experiments, all cell counts were performed using the Cell Counter plugin in ImageJ (RRID:SCR_003070). Data are mean ± SD, and comparisons between means were made using t tests, a one-way ANOVA, or Hotelling's paired test. For all statistical tests, a p value ≤0.05 was used to determine statistical significance. In fictive locomotor experiments, circular statistics (Zar, 1974) were used to probe the coupling strength between flexor and extensor-related ventral roots or between the WT1 cell and the ventral roots. To generate polar plots, 25 consecutive bursts in a given ventral root were selected, and their phase values were calculated in reference to each of the other ventral roots (for whole-cell recordings, phase values were calculated in reference to bursts recorded in the WT1 neuron). Mean phase values of 0.5 indicated that the bursts being compared were completely out of phase (i.e., alternating), whereas mean phase values of 1 indicated that the bursts were completely in phase (i.e., synchronous). r values, which provide a measure of the concentration of phase values around the mean, were also calculated. An r value of 1 indicates that all 25 phase values measured were identical, whereas an r value of 0 indicates that the phase values were distributed randomly (Kjaerulff and Kiehn, 1996). Hotelling's paired test was used to pool the data from all wild-type and all WT1CreER;R26-LSL-Gi-DREADD mice and probe for significant differences between experimental conditions (Control, 10 μm, 100 μm, Wash).
qPCR.
The mRNA expression level of WT1 in the adult human spinal cord was assessed using a pooled cDNA sample from 12 male/female Caucasians, age 18–56 years (Clontech). We also assessed the expression level of MNX1 as a marker of motoneurons (Ross et al., 1998) and used 18S as a reference gene. The following gene-specific primer sequences were used: WT1 forward, 5′-CGC ACG GTG TCT TCA GAG G-3′, and reverse, 5′-CCT GGG TAA GCA CAC ATG AAG G-3′ (amplicon = 118 bp); MNX1 forward, 5′-CTC ATG CTC ACC GAG ACC CA-3′, and reverse, 5′-GCC CTT CTG TTT CTC CGC TT-3′ (amplicon = 114 bp); 18S forward, 5′-CGG ACA GGA TTG ACA GAT TGA TAG C-3′, and reverse, 5′-CGT TCG TTA TCG GAA TTA ACC AGA C-3′ (amplicon = 107 bp). qPCR was performed using a QuantStudio 3 Real-time PCR system (Thermo Fisher Scientific), with a SYBR Green I master mix, according to the manufacturer's protocol. The target gene expression ratio was calculated using the 2ΔΔCt method. PCR products were run on a 1.2% agarose gel using standard methods to ensure the amplicon was of the predicted size.
Results
WT1-expressing neurons are located in the ventromedial spinal cord
Initial experiments were designed to map the development of WT1-expressing neurons in the mouse spinal cord and compare the number and location of these cells with the genetically related DMRT3-expressing subpopulation of dI6 cells. In line with previous reports (Armstrong et al., 1993), expression of WT1 was first observed between E11 and E12 in the mouse (Fig. 1A), shortly after expression of DMRT3, which can be seen at E10.5 (Andersson et al., 2012). By E13.5, WT1-expressing neurons began to migrate ventrally; and by E15.5, they had taken up their settling position in the ventromedial spinal cord where they remained postnatally (Fig. 1A; n = 3 spinal cords for E11.5, E13.5, E15.5, n = 6 for P0). The position of all cells expressing DMRT3 and WT1 at P0 was analyzed in the lumbar segments of 6 spinal cords and plotted in reference to the central canal. DMRT3-expressing cells were distributed throughout the ventromedial spinal cord and most densely clustered in the dorsal aspect of this region around the level of the central canal, whereas the WT1-expressing cells were located more ventrally (Fig. 1B). Analysis of the total number of cells along the extent of the lumbar spinal cord (Fig. 1C) indicated that significantly fewer WT1+ cells were located in each 20 μm section compared with the DMRT3+ population (WT1 = 24.4 ± 5.8 cells, DMRT3 = 34.8 ± 4.0 cells, df = 33, t = 6.18, p = 0.0013).
Figure 1.
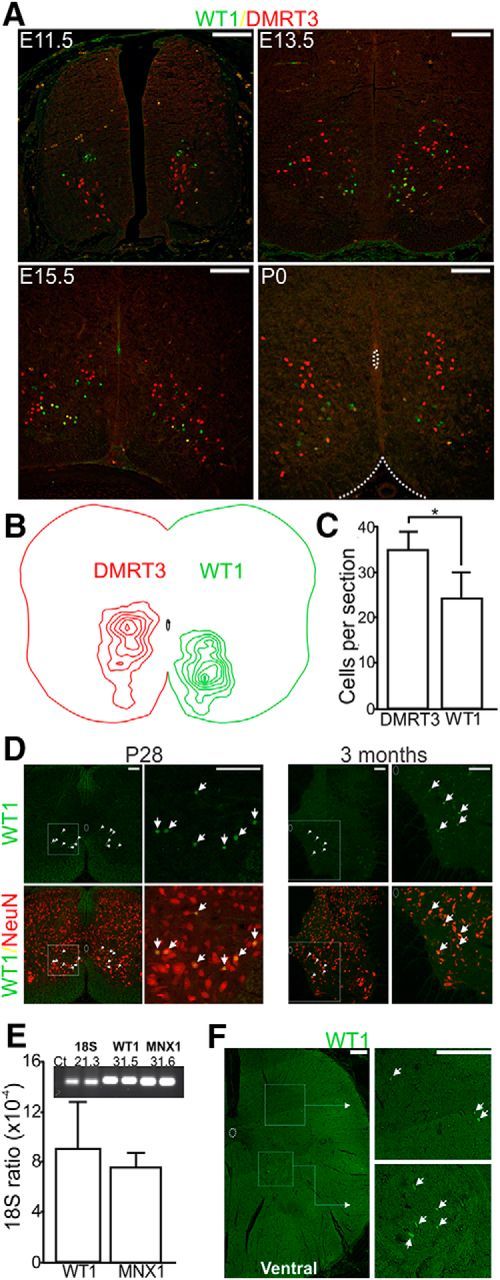
Development of WT1-expressing spinal interneurons. A, WT1-expressing interneurons (green) are first seen at E11.5, a time point at which dI6 neurons that express DMRT3 (red) have started to migrate ventromedially. Before birth, WT1-expressing interneurons also migrate ventrally and are typically situated ventral to the central canal by P0. B, Topographical map illustrating the position of all dI6 cells belonging to the DMRT3+ (red) and WT1 (green) subsets (n = 6 spinal cords). C, Bar chart indicating that the mean number of DMRT3+ cells (± SD) per 20-μm-thick spinal cord section is significantly greater than the mean number of WT1+ neurons (n = 6 spinal cords). *p = 0.0013 (t test). D, Paraffin sections cut from the spinal cord of a P28 and 3-month-old mouse and stained with antibodies to WT1 and NeuN indicate that WT1 expression persists in spinal neurons to adulthood in the mouse. Region within the dashed box in the low-magnification image is expanded to the right. E, Expression ratio of WT1 and MNX1 relative to 18S in the human spinal cord indicates that WT1 is expressed at a similar level as the motor neuronal marker. Inset, Representative image indicating agarose gel electrophoresis of qPCR amplicons and associated threshold cycle (Ct). C, E, Data are represented as mean ± SD. F, A 5-μm-thick section of lumbar spinal cord from a 32-year-old male stained with an antibody to WT1 (green) demonstrates that WT1+ cells are present in the ventromedial as well as the dorsal spinal cord of humans. Boxed regions are expanded to the right. White arrows indicate WT1+ cells. A–F, Scale bar, 100 μm.
Interestingly, previous work has shown that the development and migration pattern of WT1-expressing neurons in the embryonic mouse spinal cord are recapitulated in the human embryo, and cells expressing WT1 can be seen in the ventromedial spinal cord of humans up to 74 dpc, a time point equivalent to E15 in the mouse (Armstrong et al., 1993). Because this study did not investigate postnatal tissue, we were curious to determine whether WT1 expression in spinal interneurons was maintained at later developmental time points. Expression in both mouse and humans postnatally could lead to experiments that investigate whether these cells are functionally homologous in the two species. Initial experiments investigated whether WT1 was expressed in the mature mouse nervous system. For these experiments, an antibody stain for WT1 and the neuronal marker NeuN was performed in P28 wild-type mice, an age at which the nervous system has reached maturity (Finlay and Darlington, 1995), and also in 3-month-old mice a time point at which the mouse can be considered to have reached adulthood. Inspection of 3 spinal cords at each of these time points indicated that WT1 neurons are present as WT1+/NeuN+ cells could be seen in the ventromedial aspect of all sections examined (meanP28, 18.8 ± 4.3; mean3month, 15.2 ± 3.9; Fig. 1D). To investigate whether WT1 expression persists in the human spinal cord, we performed qPCR using a commercially available pooled cDNA sample from spinal cords harvested from 12 adults 18–56 years of age. In addition to probing for WT1, we assessed the expression level of the human motor neuron marker MNX1 (Ross et al., 1998) and used 18S as a reference gene. Analysis indicated that both WT1 and MNX1 were expressed at similar levels relative to the reference gene (Fig. 1E), indicating that WT1 is expressed in the adult human spinal cord and suggesting that a similar number of WT1-expressing cells and motoneurons are present. Further support for this finding came from an antibody stain for WT1 in paraffin sections cut from the lumbar region of an adult human spinal cord (32-year-old male) in which WT1+ labeling was present and could be seen primarily in the ventral region of all sections inspected (73.3% of all WT1 cells were located below the central canal; Fig. 1F). Although we were unable to confirm that these cells were neurons via antibody staining techniques, these findings along with the qPCR results suggest that WT1 cells are present in the human spinal cord and may reside in a similar location in both mouse and human.
WT1-expressing neurons are primarily inhibitory and project commissural axons
To investigate the neurotransmitter phenotype of WT1-expressing interneurons, we first stained transverse spinal cord sections cut from VGlut2Cre;ROSA26tdTomato mice in which all excitatory cells expressed reporter protein, and looked for coexpression of WT1 and tdTomato. Excitatory WT1+ cells were extremely rare and comprised only 1.8% of the entire WT1+ population (2 of 111 WT1 cells, n = 2 spinal cords; Fig. 2A). Inhibitory WT1+ neurons were identified either by coexpression of WT1 and an antibody for glycine, or by coexpression of WT1 and GFP in spinal cord sections cut from the GAD67GFP mouse in which all GABAergic neurons express GFP. Results confirmed that this subset of dI6 cells is primarily inhibitory as 68.7% (66 of 96, n = 3 spinal cords) of all WT1-expressing neurons coexpressed the GABAergic marker (Fig. 2B), and 34.7% (32 of 92, n = 3 spinal cords) of all WT1-expressing neurons stained positive for glycine (Fig. 2C).
Figure 2.

Neurotransmitter phenotype of WT1-expressing interneurons. A–C, Antibody stain for WT1 (blue) in (A) the VGlut2CreROSA26tdTomato mouse, (B) the GAD67GFP mouse, and (C) together with an antibody for glycine. Scale bars, 100 μm. A–C, Arrow indicates each WT1-expressing interneuron. Filled arrowheads indicate those WT1+ cells that coexpress the respective excitatory or inhibitory marker. Open arrows indicate those WT1+ neurons that do not coexpress the respective excitatory or inhibitory marker. While no WT1-expressing cells illustrated coexpress the excitatory cell marker (A), a significant proportion coexpress the markers for GABAergic (B) or glycinergic (C) cells.
To broadly define the projection pattern of WT1+ axons, backfill experiments were performed in which the fluorescent tracer TMRD was applied to a cut region of the neonatal spinal cord (n = 8) unilaterally, which results in all processes passing through this region taking up the tracer and transporting it back to their soma (Fig. 3A,B) (Stokke et al., 2002). Following a 16–18 h incubation period, transverse sectioning, and antibody staining for WT1, analysis of the spinal cords indicated that the mean number of WT1+/TMRD+ cells in each spinal cord located on the contralateral side of the spinal cord to the application site (meancomm) was significantly greater than the mean number on the ipsilateral side (meanipsi), indicating that this population preferentially extends commissural axons (meancomm = 29.8 ± 9.7; meanipsi = 8.4 ± 4.31; df = 14, t = 4.07, p = 0.0006, t test; Fig. 3C). There was no preference as to the mean number of WT1+/TMRD+ cells in each spinal cord located rostral (meanrostral) or caudal (meancaudal) to the application site (meanrostral = 21.4 ± 9.6; meancaudal = 16.9 ± 7.8; df = 14, t = 0.87, p = 0.20, t test) with soma-expressing TMRD-labeled WT1+ neurons found up to 1800 μm (∼3 spinal segments) in both the rostral and caudal directions.
Figure 3.
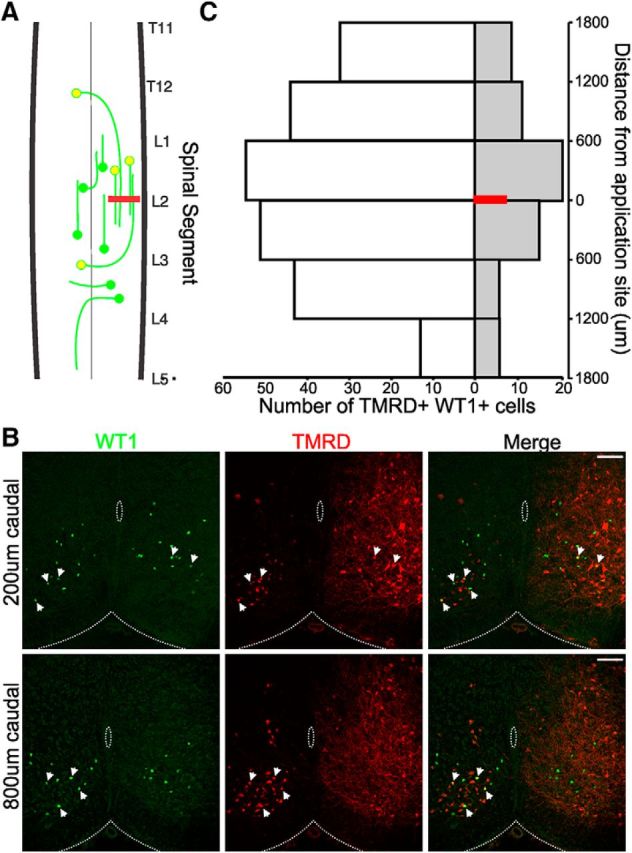
Axonal projection pattern of WT1-expressing neurons. A, Schematic of experimental setup in which the fluorescent tracer TMRD is applied to a cut region of the spinal cord unilaterally (red bar). All WT1 cells (green circles) cells passing their axons through this region will transport the tracer back to their cell bodies and also fluoresce red (yellow circles). B, A 20-μm-thick spinal cord section 18 h after TMRD application 200 μm (top) and 800 μm (bottom) caudal to the application site and stained with an antibody to WT1. Scale bars, 100 μm. WT1+ cells (green) that have taken up the TMRD (red), indicated by the white arrows and can be seen in the merged image. C, Pooled data from 8 spinal cords indicates that the vast majority of WT1 cells project commissural axons (white bars) as opposed to ipsilateral axons (gray bars) and that a similar number of cells can be found rostral and caudal to the TMRD application site (red bar).
WT1-expressing neurons are rhythmically active during fictive locomotion
Along with the DMRT3 subset of dI6 interneurons and the V0D population, our initial findings indicate that the WT1 interneurons are the third molecularly defined population of commissurally projecting, inhibitory interneurons in the mouse spinal cord. To determine whether, similar to DMRT3+ and V0D interneurons, WT1-expressing neurons participate in locomotor activity, we recorded from these cells during pharmacologically induced fictive locomotion in the neonatal mouse spinal cord and investigated their activity in relation to flexor and extensor motor axons that innervate hindlimb muscles. For these experiments, we used neonatal (P0-P2) WT1CreGFP mice (Fig. 4A). Analysis of the thoracolumbar spinal cords of 4 WT1CreGFP mice indicated that, while GFP labeled slightly more than half of all WT1-expressing spinal neurons (460 of 836), reporter protein expression is restricted to WT1-expressing cells as 99.1% (456 of 460) of GFP+ cells were WT1+ (Fig. 4B). To record activity from GFP-expressing WT1 neurons during fictive locomotion, the upright spinal cord preparation was used in which spinal cords from WT1CreGFP mice were isolated, bent at a 90 degree angle so that the caudal end of the cord was facing upward, and a transverse section was cut with a vibratome at a mid-lumbar segment. The preparation was then situated below the objective lens of a fluorescent microscope, which allowed all GFP+ WT1 neurons along the cut surface to be visually identified for patch-clamp recording (Fig. 4C). Bath application of 5-HT (5 μm) and NMDA (5–15 μm) evoked rhythmic, alternating fictive locomotor activity, which was recorded by extracellular ENG electrodes attached to one or two of the lumbar ventral roots on either side of the spinal cord, and GFP+ WT1 neurons were targeted for whole-cell recording (Fig. 4D). Activity from WT1-expressing interneurons was strikingly consistent with all 16 neurons from which we recorded exhibiting clear rhythmic oscillations relative to the ventral roots (Fig. 4E), suggestive of involvement in locomotion. Eight of the 16 WT1+ cells were active in phase with ENG activity recorded from the ipsilateral ventral root in the same spinal segment, and the remaining eight oscillated in phase with the contralateral ventral root in the same spinal segment (Fig. 4F).
Figure 4.

WT1-expressing neurons are rhythmically active during fictive locomotion. A, A 20-μm-thick section cut from a P0 WT1CreGFP mouse and stained with antibodies to WT1 (red) and GFP (green). All GFP+ cells (indicated by arrows) are WT1+. Scale bar, 100 μm. B, Count of total number of WT1+ interneurons as well as total number of GFP+ cells that express WT1 indicate that this mouse strain is an accurate marker or WT1-expressing cells. C, Schematic of upright in vitro spinal cord preparation used to make patch-clamp recordings from GFP+ interneurons as well as lumbar ventral roots (VR) during pharmacologically induced fictive locomotion. D, Image of the surface of a spinal cord taken from a P0 WT1CreGFP mouse and prepared for electrophysiological recording. GFP+/WT1 cell being recorded is circled in the image taken with a DIC (left) and GFP (right) filter. Scale bar, 20 μm. E, During fictive locomotion GFP+, WT1-expressing neuron (bottom) oscillates in phase with L3 ventral root located on the ipsilateral side of the spinal cord (iL3). F, Circular plot includes pooled data from 16 GFP+. WT1-expressing cells indicate that bursting in all cells are tightly coupled to fictive locomotor activity recorded in the local ventral root. Eight cells burst in phase with the local ventral root (those points located close to 0 in the circular plot), and 8 cells burst out of phase (those points located close to 0.5).
Silencing of WT1+ spinal neurons disrupts left–right alternation during fictive locomotion
To investigate the specific role WT1-expressing neurons play during locomotion, we reversibly silenced this population and probed for deficits that are apparent in their absence. Given the expression of WT1 throughout the body (Armstrong et al., 1993), it was necessary to restrict the silencing of this population to the spinal cord because widespread ablation of WT1 cells results in early embryonic lethality. Ultimately, we determined that the best approach was to use the R26-LSL-Gi-DREADD transgenic mouse in which an inhibitory DREADD (the mutant G-protein-coupled receptor hM4Di) is present in all Cre-expressing cells following recombination (Zhu et al., 2016). By performing experiments on spinal cords isolated from offspring of R26-LSL-Gi-DREADD × WT1CreER matings, we were able to inhibit the activity in WT1-expressing spinal neurons by adding the hM4Di receptor ligand CNO to the perfusate.
To confirm that the DREADD system effectively inhibited WT1 neurons, we isolated spinal cords from P0 WT1CreER;R26-LSL-Gi-DREADD mice and used the upright spinal cord preparation to record from mCitrane+ (coexpressed in all cells carrying the DREADD) neurons. Initial inspection revealed that these neurons were clearly visible under a fluorescent microscope and restricted to the ventromedial laminae (Fig. 5A). Upon whole-cell recording, we applied an identical train of current steps before and after bath application of CNO. All three mCitrane+ cells from which we recorded were clearly inhibited in the presence of 500 nm of CNO as a greater amount of current injection was required to evoke action potentials compared with the control condition, and there was a mean reduction (to 43.7 ± 12.2% compared with the control condition) in the total number of action potentials evoked over the duration of the train of current steps, which was partially reversed upon washout (to 72 ± 8.7% of control; Fig. 5B). In contrast, the mean number of action potentials evoked over the train of current steps in three mCitrane− cells in the presence of 500 nm of CNO was similar to control (97.7 ± 3.5%, 95.7 ± 2.4% after washout), and the amount of current injection required to evoke action potentials was unchanged (Fig. 5B). Together, these data allow us to conclude that CNO selectively inhibits cells expressing the DREADD.
Figure 5.
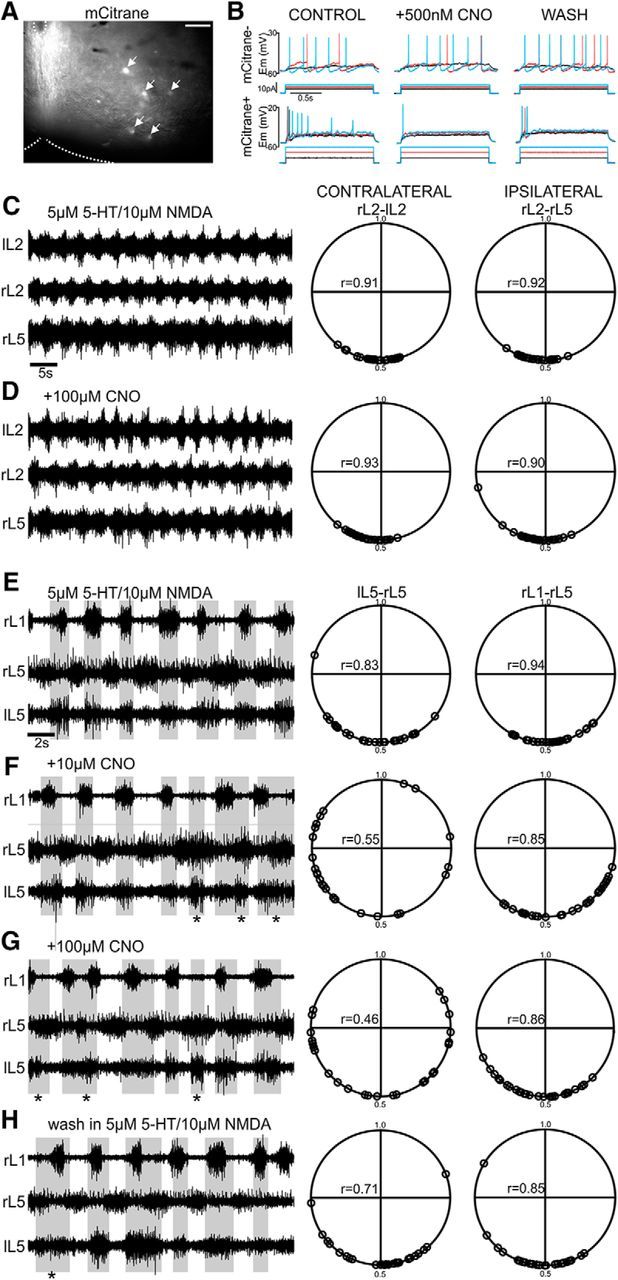
Left–right alternation is disrupted in the absence of WT1 cell function. A, Cre recombination results in expression of the DREADD as well as mCitrane (indicated by arrows) in the ventromedial laminae of an upright spinal cord preparation prepared from a P0 WT1CreERxR26-LSL-Gi-DREADD mouse. Scale bar, 100 μm. B, The response of a mCitrane− cell (no DREADD, top), and mCitrane+ cell (DREADD receptor, bottom) before CNO application, after application of 500 nm CNO, and after washout. The cell containing the DREADD is inhibited and fires fewer action potentials in the presence of CNO while the cell without the DREADD is unaffected. C, D, ENG recordings illustrate pharmacologically induced fictive locomotion in a wild-type animal before (C) and after (D) addition of 100 μm of CNO to the bath. Polar plots illustrate that alternation between flexor (L2) and extensor (L5) related ventral roots is unaffected after CNO application. E–H, ENGs recorded from flexor (L1) and extensor (L5) related ventral roots of a spinal cord isolated from a WT1CreERxR26-LSL-Gi-DREADD mouse following (E) bath application of 5-HT and NMDA, (F) addition of 10 μm of CNO, (G) addition of 100 μm of CNO, and (H) washout of CNO. Application of increasing concentrations of CNO to the bath disrupts alternation between contralateral roots marked by cobursting in left and right L5 ventral roots (indicated by asterisks) and is partially restored after washout. Ipsilateral alternation of rL1-rL5 ventral roots is unaffected in the presence of CNO. Circular plots to the right of each panel illustrate coupling between ENG bursts in contralateral as well as ipsilateral ventral roots. Each polar plot illustrated includes analysis of 25 cycles for a single spinal cord in each condition.
Spinal cords from 6 P0-P2 wild-type and 6 WT1CreER;R26-LSL-Gi-DREADD mice were isolated and perfused with oxygenated aCSF. Bath application of a mixture of NMDA (5 μm) and 5-HT (10 μm) evoked fictive locomotion in each spinal cord, which was recorded via ENG electrodes attached to three of the flexor-related or extensor-related ventral roots bilaterally. After recording a minimum of 5 min of stable fictive locomotor activity which would act as baseline, CNO was added to the perfusate at increasing concentrations (10 μm, 100 μm). A comparison of cycle period (CP, defined as the interval between the onset of burst n and burst n + 1) indicated that there was no significant change in the frequency of locomotor outputs (df = 5, F = 0.85, p = 0.49, one-way ANOVA) between the control and CNO conditions in either the wild-type (CPcontrol = 2.7 ± 1.1 s, SCPCNO-100 = 2.6 ± 0.7 s) or WT1CreERxR26-LSL-Gi-DREADD (CPcontrol = 3.1 ± 0.7 s, CPCNO-100 = 3.2 ± 0.6 s, n = 6) mice.
Circular statistics were used to analyze the coordination of flexor and extensor-related ventral root bursting during fictive locomotion. For each of the 6 wild-type and 6 WT1CreERxR26-LSL-Gi-DREADD spinal cords, we generated a polar plot in each condition (control, 10 μm CNO, 100 μm CNO, wash), which provided us with information on coupling strength between the ipsilateral and contralateral ventral roots (Kjaerulff and Kiehn, 1996). Whereas Figure 5C, D displays data from a single wild-type and a single WT1CreERxR26-LSL-Gi-DREADD (Fig. 5E–H) spinal cord, Hotelling's paired test was used to pool the circular data from the 6 wild-type mice and the 6 mice expressing the DREADD and determine whether there were significant differences in coupling strength between conditions. As expected, alternation could be seen between contralateral flexor (or contralateral extensor)-related (mean rcontrol = 0.94 ± 0.05, mean r100-CNO = 0.89 ± 0.06) and ipsilateral flexor/extensor-related (mean rcontrol = 0.91 ± 0.04, mean r100-CNO = 0.87 ± 0.10) ventral roots in wild-type mice (Fig. 5C,D), and this was unaffected after application of 100 μm CNO (Fcontra = 0.13, p = 0.89, Fipsi = 0.10, p = 0.92; Fig. 5C,D). Application of 10 μm CNO to spinal cords isolated from WT1CreERxR26-LSL-Gi-DREADD mice resulted in disrupted alternation (F = 6.4, p = 0.05, n = 6; Fig. 5E,F) between pairs of flexor-related (or pairs of extensor-related) ventral roots located on either side of the spinal cord compared with control (mean rcontrol = 0.91 ± 0.06, mean r10-CNO = 0.66 ± 0.20). The fictive locomotor pattern in the presence of CNO was marked by alternation of ENG activity in extensor-related (or flexor-related) ventral roots on either side of the spinal cord, which was regularly interrupted by periods of cobursting (Fig. 5F–H, asterisk). Alternation between ipsilateral flexor and extensor ventral roots, on the other hand, was not statistically altered (rcontrol = 0.93 ± 0.02, r10-CNO = 0.91 ± 0.05, r100-CNO = 0.87 ± 0.06, rwash = 0.86 ± 0.15, F = 2.3, p = 0.25, n = 5; Fig. 5E,F). Increasing the concentration of CNO (100 μm) resulted in further deterioration of contralateral alternation mean r100-CNO = 0.39 ± 0.19 compared with the control condition (F = 12.6, p = 0.02; Fig. 5G) in WT1CreERxR26-LSL-Gi-DREADD mice, whereas alternation between ipsilateral flexor and extensor related ventral roots (mean r100-CNO = 0.87 ± 0.06) remained statistically similar to the control condition (F = 3.2, p = 0.18; Fig. 5G). Following 30 min of washout of CNO (in aCSF containing baseline levels of 5-HT and NMDA), the activity of contralateral ventral roots became more tightly coupled, approached alternation (rwash = 0.81 ± 0.11), and was not significantly different from the control condition (F = 5.7, p = 0.07; Fig. 5H). Together, these data indicate that inhibition of WT1-expressing interneurons during a locomotor task results in a specific and severe breakdown of left–right alternation.
WT1 neurons terminate in close proximity to populations of commissural interneurons
The two previously identified populations of commissurally projecting inhibitory interneurons (DMRT3+ dI6, and V0D neurons) have both been shown to make monosynaptic connections onto motoneurons (Lanuza et al., 2004; Andersson et al., 2012). To determine whether WT1-expressing neurons also regulate alternation of motor neurons in the spinal cord via a monosynaptic pathway, we injected the retrograde transsynaptic tracer pseudorabies virus 152 (PRV-152) into a hindlimb flexor (tibialis anterior, n = 4) or extensor (gastrocnemius, n = 4) muscle of eight P0 wild-type mice. Previous work has shown that this strain of PRV infects (and expresses GFP in) cells monosynaptically connected to hindlimb motoneurons 36–46 h after intramuscular injection in neonatal mice (Jovanovic et al., 2010). Inspection of spinal cords harvested from all animals within this time window exhibited extensive GFP labeling of neurons in the ventral laminae ipsilateral to the injection as well as a modest number of cells (typically 5–15) in lamina VIII contralaterally. This pattern of staining is consistent with other studies, which have used PRV (Lanuza et al., 2004; Zhang et al., 2008; Jovanovic et al., 2010) or rabies virus (Stepien et al., 2010) to identify interneurons that are monosynaptically connected to hindlimb motoneurons. The complete absence of GFP+ WT1-expressing neurons on either side of the spinal cord in any of the 8 mice indicates that this subset of dI6 cells is not monosynaptically connected to motoneurons (Fig. 6A) and thus has a unique connectivity pattern compared with the V0D and DMRT3+ subpopulations.
Figure 6.

WT1-expressing neurons terminate in close proximity to populations of commissurally projecting interneurons. A, A 20-μm-thick section of a spinal cord 46 h after PRV-152 injection into the GS muscle on the left side and stained with antibodies to GFP (green) and WT1 (blue). At this time point, no WT1-expressing neurons on either side of the spinal cord have taken up the tracer. Contralateral region containing WT1-expressing cells (dashed box) is expanded to the right. B, To identify presumptive synapses on genetically defined interneuronal subtypes, we inspected the synaptotagmin+ “halo” (indicated by white arrows) surrounding each labeled nuclei for WT1+/synaptotagmin+ terminals. C–F, The 20-μm-thick sections cut from a P0 WT1CreERROSA26tdTomato spinal cord and stained with antibodies to tdTomato (red), the synaptic marker synatotagmin (blue), as well as (green) a nuclear marker of V2a cells (Chx10-, C), V1 cells (En1-, D), V0V cells (Evx1-, E), or DMRT3-expressing dI6 cells (F). WT1-expressing terminals (tdTomato+/synaptotagmin+ processes) were rare or absent nearby Chx10- or En1-expressing cells but were commonly seen in close proximity to Evx1+ and DMRT3+ neurons. C, D, Dashed boxes are expanded to the right. E, F, Arrow in the low-magnification image indicates the specific WT1 cell of interest in the panel to the right. In magnified images, arrows indicate presumptive WT1+ axon terminals. Double labeling of these processes is confirmed in orthogonal views to the right of E, F. Scale bars: Low-magnification images, 100 μm; High-magnification images: A, C, D, 20 μm; B, E, F, 5 μm.
In an attempt to identify potential synaptic partners of WT1+ neurons, we used offspring of WT1CreER × ROSA26tdtomato mice in which cell bodies and processes of WT1+ neurons express the reporter protein tdTomato and are visible (Fig. 6C–E). Transverse spinal cord sections were cut from these mice, and antibodies were used to identify four genetically defined interneuronal populations that have been shown to be involved in locomotor activity: the ipsilaterally projecting V2a (Chx10-expressing) and V1 (En1-expressing) cells as well as the contralaterally projecting V0V neurons (Evx1-expressing) and the DMRT3+ dI6 cells. WT1-expressing neurons with axons terminating in close proximity to the soma of these cell populations were identified via colocalization of an antibody for synaptotagmin, which labels a Ca2+ sensor in presynaptic terminals, and tdTomato+ processes located on the “halo” surrounding a labeled nucleus (Fig. 6B). Analysis of 4 WT1CreER;ROSA26tdtomato spinal cords revealed that terminals from WT1 cells were absent on the soma of V2a cells (0 of 14 cells inspected; Fig. 6C) and rarely observed on the soma of En1 cells (the soma of 2 of 14 En1 cells received terminals from WT1+ neurons; Fig. 6D). In contrast, WT1+ terminals were regularly found in close apposition to Evx1 (9 of 12 cells inspected; Fig. 6E) and DMRT3 (16 of 20 cells inspected; Fig. 6F) expressing cells suggestive of connectivity among these locomotor-related interneuronal populations.
Discussion
While the dorsal and ventral subsets of Dbx1-expressing V0 interneurons have been shown to be key regulators of left–right alternation during locomotion (Lanuza et al., 2004; Talpalar et al., 2013), it is becoming apparent that additional interneuronal populations are involved in this function either by direct contact onto motoneurons (Andersson et al., 2012) or via modulation of the V0 neurons (Crone et al., 2008). In this study, we characterize the WT1-expressing subset of dI6 interneurons. Based on their neurotransmitter phenotype, axonal projection pattern, and the clear disruption of left–right alternation that occurs when they are selectively inhibited, we provide evidence that WT1 interneurons are essential for appropriate left–right alternation during locomotion, likely via the regulation of other populations of commissural interneurons.
WT1 neurons are required for coordinated locomotor activity
We were unable to assess the locomotor pattern of intact mice in the absence of WT1-expressing neurons because there is widespread expression of WT1 throughout the body (Armstrong et al., 1993), and manipulation of this gene results in early embryonic lethality. To circumvent this issue, the role of WT1-expressing neurons during locomotor activity was studied by performing fictive locomotor experiments in neonatal mice in which an inhibitory DREADD was expressed in WT1+ neurons, which enabled selective and reversible silencing of these cells. This approach eliminated compensatory changes in network organization, which may occur if the cells were to be ablated at earlier time points, and it also allowed us to analyze locomotor activity before application, and after washout, of CNO and use these epochs as control conditions for each mouse. In the presence of CNO, the locomotor output from WT1CreERxR26-LSL-Gi-DREADD mice was characterized by a significant disruption of contralateral coordination, which became more severe with the application of an increased concentration of CNO and was reduced upon washout. Recently, it has been demonstrated that systemically administered CNO can be metabolized to clozapine, which binds to endogenous receptors and can have nonspecific actions on neurons (Gomez et al., 2017). It is unlikely that this phenomenon is responsible for the locomotor phenotype seen in our study because CNO was directly applied to the spinal cord and had an effect over a short period of time, whereas clozapine metabolism and effect typically take 2–3 h (Gomez et al., 2017). More importantly, electrophysiological recordings demonstrate a selective inhibition of cells carrying the DREADD in the presence of CNO.
Anatomical tracing experiments indicated that WT1-expressing cells do not contact motoneurons monosynaptically but regularly terminate in close proximity to the DMRT3 subset of dI6 neurons as well as Evx1-expressing V0 neurons, two populations shown to be involved in coordinating locomotor outputs. It is important to keep in mind that these experiments do not enable us to definitively conclude that these populations are synaptic partners; however, the presence of axon terminals from WT1 neurons on the soma surrounding Evx1 and DMRT3 nuclei combined with the fact that these terminals were seldom seen on soma surrounding En1 or Chx10 cells provide compelling evidence that these predominantly commissural populations may be interconnected. Together, the results of these experiments provide novel insight into the manner in which populations of commissural interneurons may interact with one another. The only known synaptic contacts of the inhibitory DMRT3-expressing cells are motoneurons bilaterally (Andersson et al., 2012), whereas Evx1-expressing V0 neurons are excitatory (Talpalar et al., 2013) and presumed to activate interneurons on the contralateral side of the spinal cord, which in turn inhibit local motoneurons (Shevtsova et al., 2015; Danner et al., 2017). Given our finding that the vast majority (>80%) of WT1+ neurons are inhibitory and a similar proportion project commissural axons, we provide evidence that WT1+, DMRT3+, and Evx1+ cells are part of a microcircuit across the midline, which is involved in regulating motoneuronal activity during locomotion.
WT1-expressing cells regulate the activity of commissural interneuron subtypes
In our proposed circuit diagram of the locomotor CPG (Fig. 7), we incorporate the WT1-expressing and DMRT3-expressing dI6 neurons into a previously devised wiring diagram that was assembled based on experimental and modeling data (Shevtsova et al., 2015). We suggest that WT1+ cells on the left side of the spinal cord project to, and inhibit, DMRT3+ dI6 and V0V cells on the right side of the spinal cord, which in turn inhibit motor neurons on the left side either monosynaptically (DMRT3+) or disynaptically (V0V). In this arrangement, activation of WT1-expressing neurons on the left side of the spinal cord release motoneurons on the left from contralateral inhibition via regulation of these two commissural interneuronal populations.
Figure 7.

Incorporating the WT1-expressing neurons into the proposed circuitry of the locomotor CPG. Filled circle represents inhibitory synapses. Y, Excitatory synapses. Solid line indicates connectivity that has been directly demonstrated. Dashed line indicates that which has been postulated.
The circuitry proposed in Figure 7 can account for the locomotor defects observed during fictive locomotion when WT1-expressing neurons are inhibited. Specifically, because ablation of the DMRT3 neurons results in dissociation between activity in contralateral ventral roots (Andersson et al., 2012), we would expect inappropriate regulation of DMRT3-expressing neurons to have a similar effect. Conversely, we would not expect the V0V cells to be involved in left–right alternation in our experiments because it has been shown that the V0D subset is primarily responsible for appropriate left–right alternation at the slower fictive locomotor speeds evoked in these experiments while the V0V cells, which are required at higher frequencies, would presumably be inactive. While lack of a postnatal marker of the V0D population kept us from investigating their potential connectivity (as well as the connectivity of the locomotor-related V2b and V3 populations) with WT1-expressing neurons, it is possible that they also receive input from WT1+ cells that regulate activity in different subsets of the V0 population at different speeds. We must keep in mind that evidence suggesting connectivity between populations does not indicate exclusivity, and WT1+ neurons may contact several other cell populations (i.e., rhythm-generating cells of the locomotor CPG); however, we have left these connections out of our schematic as we currently have no supporting experimental evidence.
Given technical limitations inherent with large-scale mapping of the spinal cord, our knowledge regarding the connectivity among various populations of genetically defined interneurons shown to be involved in locomotion is limited, and the majority of the previously described connections among components are based on deductive reasoning or computational modeling (Fig. 7, dashed lines) as opposed to direct experimental evidence (Fig. 7, solid lines). Indeed, other than synapses on V0V cells from V2a interneurons, our demonstration of WT1+ terminals in close proximity to V0V and DMRT3+ cells is the only experimental evidence suggestive of synaptic connectivity among groups of genetically defined interneurons that are active during locomotion. Based on the dearth of experimental evidence for connectivity among the genetically defined interneuronal populations, we believe that our tracing data mark a significant step forward in our understanding of the network structure of the locomotor CPG.
WT1 expression in the spinal cord is conserved between the mouse and human
In this study, we demonstrate that WT1 is expressed in the spinal cord of adult humans as well as mice. This builds on previous work showing that WT1 is expressed in spinal interneurons located in the ventromedial laminae of both mouse (E15) and human (74 dpc) embryos (Armstrong et al., 1993). There is now substantial evidence (Dimitrijevic et al., 1998; Yang and Gorassini, 2006; Dominici et al., 2011; Angeli et al., 2014; Guertin, 2014; Danner et al., 2015) that a locomotor CPG in the human spinal cord exists; and based on the role that WT1+ neurons play in coordinating left–right alternation in the mouse spinal cord, it is tempting to suggest that they may also be a key component of the locomotor network in humans. While the generation of cell types in the CNS and their assembly into functional neural circuits in all species are achieved through precise regulation of spatiotemporal gene expression (Nord et al., 2015; Shibata et al., 2015), vast differences have been shown to exist between the function of genes that are expressed in both mice and humans (Liao and Zhang, 2008), and functional homology of a gene cannot be presumed (Silbereis et al., 2016); nevertheless, WT1-expressing cells are the first genetically defined interneuronal population involved in murine locomotion that can be mapped to the human spinal cord providing support that this experimental approach can potentially provide insight into the mechanisms of motor control in humans.
In conclusion, it is becoming clear that the circuitry responsible for coordination of motor pools across the midline requires precise modulation and regulation to switch seamlessly between the different gait patterns that predominate at various locomotor speeds (Bellardita and Kiehn, 2015). Here we begin to unravel the neural circuitry connecting these interneuronal populations to one another and demonstrate that the WT1-expressing subset of dI6 cells is an essential component of the locomotor network, which appears to work in concert with several other cell types to precisely regulate motor neuronal activity during stepping. Despite potential species-specific differences in gene function between the mouse and human, our finding that WT1 cells exist in adult humans suggests that work in the mouse spinal cord may have relevance when studying motor control in more evolved species. Although we are cautious in suggesting a similar role for WT1-expressing neurons in bipedal locomotion, the fact that these cells are present in humans raises the possibility that their function can be investigated and, if found to be involved in motor control, they may represent a target for therapeutic intervention after spinal cord injury.
Footnotes
This work was supported by Canadian Institutes for Health Research Grant MOP 86470 to S.G., Canadian Foundation for Innovation-Alberta Advanced Technology and Education to S.G. and K.B., and Edmonton University Hospital Foundation to K.B. We thank the laboratories of Drs. Tom Jessell (Columbia University), Michael Fehlings (University of Toronto), Jay Bikoff (St. Jude Children's Research Hospital), and John Greer (University of Alberta) for reagents; and Dr. Ole Kiehn (University of Copenhagen) for providing essential comments on the manuscript.
The authors declare no competing financial interests.
References
- Andersson LS, Larhammar M, Memic F, Wootz H, Schwochow D, Rubin CJ, Patra K, Arnason T, Wellbring L, Hjälm G, Imsland F, Petersen JL, McCue ME, Mickelson JR, Cothran G, Ahituv N, Roepstorff L, Mikko S, Vallstedt A, Lindgren G, et al. (2012) Mutations in DMRT3 affect locomotion in horses and spinal circuit function in mice. Nature 488:642–646. 10.1038/nature11399 [DOI] [PMC free article] [PubMed] [Google Scholar]
- Angeli CA, Edgerton VR, Gerasimenko YP, Harkema SJ (2014) Altering spinal cord excitability enables voluntary movements after chronic complete paralysis in humans. Brain 137:1394–1409. 10.1093/brain/awu038 [DOI] [PMC free article] [PubMed] [Google Scholar]
- Armstrong JF, Pritchard-Jones K, Bickmore WA, Hastie ND, Bard JB (1993) The expression of the Wilms' tumour gene, WT1, in the developing mammalian embryo. Mech Dev 40:85–97. 10.1016/0925-4773(93)90090-K [DOI] [PubMed] [Google Scholar]
- Bellardita C, Kiehn O (2015) Phenotypic characterization of speed-associated gait changes in mice reveals modular organization of locomotor networks. Curr Biol 25:1426–1436. 10.1016/j.cub.2015.04.005 [DOI] [PMC free article] [PubMed] [Google Scholar]
- Butt SJ, Kiehn O (2003) Functional identification of interneurons responsible for left–right coordination of hindlimbs in mammals. Neuron 38:953–963. 10.1016/S0896-6273(03)00353-2 [DOI] [PubMed] [Google Scholar]
- Crone SA, Quinlan KA, Zagoraiou L, Droho S, Restrepo CE, Lundfald L, Endo T, Setlak J, Jessell TM, Kiehn O, Sharma K (2008) Genetic ablation of V2a ipsilateral interneurons disrupts left–right locomotor coordination in mammalian spinal cord. Neuron 60:70–83. 10.1016/j.neuron.2008.08.009 [DOI] [PubMed] [Google Scholar]
- Danner SM, Hofstoetter US, Freundl B, Binder H, Mayr W, Rattay F, Minassian K (2015) Human spinal locomotor control is based on flexibly organized burst generators. Brain 138:577–588. 10.1093/brain/awu372 [DOI] [PMC free article] [PubMed] [Google Scholar]
- Danner SM, Shevtsova NA, Frigon A, Rybak IA (2017) Computational modeling of spinal circuits controlling limb coordination and gaits in quadrupeds. eLife 6:e31050. 10.7554/eLife.31050 [DOI] [PMC free article] [PubMed] [Google Scholar]
- Dimitrijevic MR, Gerasimenko Y, Pinter MM (1998) Evidence for a spinal central pattern generator in humans. Ann N Y Acad Sci 860:360–376. 10.1111/j.1749-6632.1998.tb09062.x [DOI] [PubMed] [Google Scholar]
- Dominici N, Ivanenko YP, Cappellini G, d'Avella A, Mondì V, Cicchese M, Fabiano A, Silei T, Di Paolo A, Giannini C, Poppele RE, Lacquaniti F (2011) Locomotor primitives in newborn babies and their development. Science 334:997–999. 10.1126/science.1210617 [DOI] [PubMed] [Google Scholar]
- Dougherty KJ, Zagoraiou L, Satoh D, Rozani I, Doobar S, Arber S, Jessell TM, Kiehn O (2013) Locomotor rhythm generation linked to the output of spinal shox2 excitatory interneurons. Neuron 80:920–933. 10.1016/j.neuron.2013.08.015 [DOI] [PubMed] [Google Scholar]
- Finlay BL, Darlington RB (1995) Linked regularities in the development and evolution of mammalian brains. Science 268:1578–1584. [DOI] [PubMed] [Google Scholar]
- Gomez JL, Bonaventura J, Lesniak W, Mathews WB, Sysa-Shah P, Rodriguez LA, Ellis RJ, Richie CT, Harvey BK, Dannals RF, Pomper MG, Bonci A, Michaelides M (2017) Chemogenetics revealed: DREADD occupancy and activation via converted clozapine. Science 357:503–507. 10.1126/science.aan2475 [DOI] [PMC free article] [PubMed] [Google Scholar]
- Goulding M. (2009) Circuits controlling vertebrate locomotion: moving in a new direction. Nat Rev Neurosci 10:507–518. 10.1038/nrn2608 [DOI] [PMC free article] [PubMed] [Google Scholar]
- Griener A, Zhang W, Kao H, Haque F, Gosgnach S (2017) Anatomical and electrophysiological characterization of a population of dI6 interneurons in the neonatal mouse spinal cord. Neuroscience 362:47–59. 10.1016/j.neuroscience.2017.08.031 [DOI] [PubMed] [Google Scholar]
- Gross MK, Dottori M, Goulding M (2002) Lbx1 specifies somatosensory association interneurons in the dorsal spinal cord. Neuron 34:535–549. 10.1016/S0896-6273(02)00690-6 [DOI] [PubMed] [Google Scholar]
- Guertin PA. (2014) Preclinical evidence supporting the clinical development of central pattern generator-modulating therapies for chronic spinal cord-injured patients. Front Hum Neurosci 8:272. 10.3389/fnhum.2014.00272 [DOI] [PMC free article] [PubMed] [Google Scholar]
- Jovanovic K, Pastor AM, O'Donovan MJ (2010) The use of PRV-Bartha to define premotor inputs to lumbar motoneurons in the neonatal spinal cord of the mouse. PLoS One 5:e11743. 10.1371/journal.pone.0011743 [DOI] [PMC free article] [PubMed] [Google Scholar]
- Kerman IA, Enquist LW, Watson SJ, Yates BJ (2003) Brainstem substrates of sympatho-motor circuitry identified using trans-synaptic tracing with pseudorabies virus recombinants. J Neurosci 23:4657–4666. 10.1523/JNEUROSCI.23-11-04657.2003 [DOI] [PMC free article] [PubMed] [Google Scholar]
- Kiehn O. (2016) Decoding the organization of spinal circuits that control locomotion. Nat Rev Neurosci 17:224–238. 10.1038/nrn.2016.9 [DOI] [PMC free article] [PubMed] [Google Scholar]
- Kjaerulff O, Kiehn O (1996) Distribution of networks generating and coordinating locomotor activity in the neonatal rat spinal cord in vitro: a lesion study. J Neurosci 16:5777–5794. 10.1523/JNEUROSCI.16-18-05777.1996 [DOI] [PMC free article] [PubMed] [Google Scholar]
- Lanuza GM, Gosgnach S, Pierani A, Jessell TM, Goulding M (2004) Genetic identification of spinal interneurons that coordinate left–right locomotor activity necessary for walking movements. Neuron 42:375–386. 10.1016/S0896-6273(04)00249-1 [DOI] [PubMed] [Google Scholar]
- Liao BY, Zhang J (2008) Null mutations in human and mouse orthologs frequently result in different phenotypes. Proc Natl Acad Sci U S A 105:6987–6992. 10.1073/pnas.0800387105 [DOI] [PMC free article] [PubMed] [Google Scholar]
- Müller T, Brohmann H, Pierani A, Heppenstall AP, Lewin GR, Jessell TM, Birchmeier C (2002) The homeodomain factor Lbx1 distinguishes two major programs of neuronal differentiation in the dorsal spinal cord. Neuron 34:551–562. 10.1016/S0896-6273(02)00689-X [DOI] [PubMed] [Google Scholar]
- Nord AS, Pattabiraman K, Visel A, Rubenstein JLR (2015) Genomic perspectives of transcriptional regulation in forebrain development. Neuron 85:27–47. 10.1016/j.neuron.2014.11.011 [DOI] [PMC free article] [PubMed] [Google Scholar]
- Quinlan KA, Kiehn O (2007) Segmental, synaptic actions of commissural interneurons in the mouse spinal cord. J Neurosci 27:6521–6530. 10.1523/JNEUROSCI.1618-07.2007 [DOI] [PMC free article] [PubMed] [Google Scholar]
- Ross AJ, Ruiz-Perez V, Wang Y, Hagan DM, Scherer S, Lynch SA, Lindsay S, Custard E, Belloni E, Wilson DI, Wadey R, Goodman F, Orstavik KH, Monclair T, Robson S, Reardon W, Burn J, Scambler P, Strachan T (1998) A homeobox gene, HLXB9, is the major locus for dominantly inherited sacral agenesis. Nature 20:358–361. 10.1038/3828 [DOI] [PubMed] [Google Scholar]
- Shevtsova NA, Talpalar AE, Markin SN, Harris-Warrick RM, Kiehn O, Rybak IA (2015) Organization of left–right coordination of neuronal activity in the mammalian spinal cord: insights from computational modelling. J Physiol 593:2403–2426. 10.1113/JP270121 [DOI] [PMC free article] [PubMed] [Google Scholar]
- Shibata M, Gulden FO, Sestan N (2015) From trans to cis: transcriptional regulatory networks in neocortical development. Trends Genet 31:77–87. 10.1016/j.tig.2014.12.004 [DOI] [PMC free article] [PubMed] [Google Scholar]
- Silbereis JC, Pochareddy S, Zhu Y, Li M, Sestan N (2016) The cellular and molecular landscapes of the developing human central nervous system. Neuron 89:248–268. 10.1016/j.neuron.2015.12.008 [DOI] [PMC free article] [PubMed] [Google Scholar]
- Stepien AE, Tripodi M, Arber S (2010) Monosynaptic rabies virus reveals premotor network organization and synaptic specificity of cholinergic partition cells. Neuron 68:456–472. 10.1016/j.neuron.2010.10.019 [DOI] [PubMed] [Google Scholar]
- Stokke MF, Nissen UV, Glover JC, Kiehn O (2002) Projection patterns of commissural interneurons in the lumbar spinal cord of the neonatal rat. J Comp Neurol 446:349–359. 10.1002/cne.10211 [DOI] [PubMed] [Google Scholar]
- Talpalar AE, Bouvier J, Borgius L, Fortin G, Pierani A, Kiehn O (2013) Dual-mode operation of neuronal networks involved in left–right alternation. Nature 500:85–88. 10.1038/nature12286 [DOI] [PubMed] [Google Scholar]
- Vallstedt A, Kullander K (2013) Dorsally derived spinal interneurons in locomotor circuits. Ann N Y Acad Sci 1279:32–42. 10.1111/j.1749-6632.2012.06801.x [DOI] [PubMed] [Google Scholar]
- Yang JF, Gorassini M (2006) Spinal and brain control of human walking: implications for retraining of walking. Neuroscientist 12:379–389. 10.1177/1073858406292151 [DOI] [PubMed] [Google Scholar]
- Zar JH. (1974) Circular distribution. In: Biostatistical analysis, pp 310–327. Engelwood Cliffs, NJ: Prentice Hall. [Google Scholar]
- Zhang Y, Narayan S, Geiman E, Lanuza GM, Velasquez T, Shanks B, Akay T, Dyck J, Pearson K, Gosgnach S, Fan CM, Goulding M (2008) V3 spinal neurons establish a robust and balanced locomotor rhythm during walking. Neuron 60:84–96. 10.1016/j.neuron.2008.09.027 [DOI] [PMC free article] [PubMed] [Google Scholar]
- Zhu H, Aryal DK, Olsen RH, Urban DJ, Swearingen A, Forbes S, Roth BL, Hochgeschwender U (2016) Cre-dependent DREADD (Designer receptors exclusively activated by designer Drugs) mice. Genesis 54:439–446. 10.1002/dvg.22949 [DOI] [PMC free article] [PubMed] [Google Scholar]