Abstract
There has been a growing interest toward mitochondrial fatty acid synthesis (mtFAS) since the recent discovery of a neurodegenerative human disorder termed MEPAN (mitochondrial enoyl reductase protein associated neurodegeneration), which is caused by mutations in the mitochondrial enoyl-CoA/ACP (acyl carrier protein) reductase (MECR) carrying out the last step of mtFAS. We show here that MECR protein is highly expressed in mouse Purkinje cells (PCs). To elucidate mtFAS function in neural tissue, here, we generated a mouse line with a PC-specific knock-out (KO) of Mecr, leading to inactivation of mtFAS confined to this cell type. Both sexes were studied. The mitochondria in KO PCs displayed abnormal morphology, loss of protein lipoylation, and reduced respiratory chain enzymatic activities by the time these mice were 6 months of age, followed by nearly complete loss of PCs by 9 months of age. These animals exhibited balancing difficulties ∼7 months of age and ataxic symptoms were evident from 8–9 months of age on. Our data show that impairment of mtFAS results in functional and ultrastructural changes in mitochondria followed by death of PCs, mimicking aspects of the clinical phenotype. This KO mouse represents a new model for impaired mitochondrial lipid metabolism and cerebellar ataxia with a distinct and well trackable cellular phenotype. This mouse model will allow the future investigation of the feasibility of metabolite supplementation approaches toward the prevention of neurodegeneration due to dysfunctional mtFAS.
SIGNIFICANCE STATEMENT We have recently reported a novel neurodegenerative disorder in humans termed MEPAN (mitochondrial enoyl reductase protein associated neurodegeneration) (Heimer et al., 2016). The cause of neuron degeneration in MEPAN patients is the dysfunction of the highly conserved mitochondrial fatty acid synthesis (mtFAS) pathway due to mutations in MECR, encoding mitochondrial 2-enoyl-CoA/ACP reductase. The report presented here describes the analysis of the first mouse model suffering from mtFAS-defect-induced neurodegenerative changes due to specific disruption of the Mecr gene in Purkinje cells. Our work sheds a light on the mechanisms of neurodegeneration caused by mtFAS deficiency and provides a test bed for future treatment approaches.
Keywords: ataxia, Mecr, mitochondria, mitochondrial fatty acid synthesis, neurodegeneration, Purkinje cells
Introduction
Mitochondria are essential multipurpose organelles of intermediate and energy metabolism. In particular, the function of organs with high energy demands such as brain depends on flawless mitochondrial operation for their optimal performance. Mitochondrial defects have been reported as a cause for many neurodegenerative diseases (Johri and Beal, 2012) such as Alzheimer's disease (Moreira et al., 2010), Parkinson's disease (Winklhofer and Haass, 2010), Huntington's disease (Quintanilla and Johnson, 2009), Friedreich ataxia (Delatycki et al., 2000), and other spinocerebellar ataxias (Zeviani et al., 2012).
As a reflection of the prokaryotic ancestry of the endosymbiotic organelle, mitochondria harbor a fatty acid synthesis (mtFAS) pathway that closely follows the prokaryotic model, where each step in the process is performed by separate polypeptides. The enzymes in mammals involved with this pathway have been identified (Hiltunen et al., 2010; Monteuuis et al., 2017). Octanoic acid is a confirmed product of mtFAS and required as a precursor for endogenous synthesis of lipoic acid (LA). In Saccharomyces cerevisiae, the inactivation of any of the enzymes of mtFAS leads to respiratory defects, lack of cytochromes due to disturbed mitochondrial translation and respiratory complex assembly, rudimentary mitochondria and loss of protein lipoylation (Kastaniotis et al., 2004; Hiltunen et al., 2010; Kursu et al., 2013). Evidence generated in yeast and mammalian models indicates that, in addition to providing the LA precursor, mtFAS products play important roles in mitochondrial biogenesis, affecting heme biosynthesis, regulating respiratory chain assembly (Kursu et al., 2013, Zhu et al., 2015, Van Vranken et al., 2018), and participating in iron–sulfur (Fe–S) cluster biosynthesis (Van Vranken et al., 2016, Cory et al., 2017). Two acylated acyl carrier proteins (ACPs) of mtFAS, SDAP-α and SDAP-β, serve as structural components in the mammalian complex I (Carroll et al., 2003; Zhu et al., 2015). Acyl-ACPs have also been reported to be required for the maturation of succinate dehydrogenase (Angerer, 2015).
Mitochondrial enoyl-CoA/ACP reductase (MECR) catalyzes the NADPH-dependent reduction of enoyl ACP to saturated acyl-ACP (Miinalainen et al., 2003). This is the last enzyme of mtFAS pathway and essential for embryonic development in mouse (Nair et al., 2017). Mutations in the MECR orthologs in human were recently reported to result in a neurodegenerative disease termed MEPAN (mitochondrial enoyl reductase protein associated neurodegeneration), which is characterized by symptoms like hypotonia, dysarthria and visual impairment in patients (Heimer et al., 2016). However, the physiological roles of this pathway in mammals have only been partially characterized (Chen et al., 2009; Smith et al., 2012; Nair et al., 2017) and many open questions remain (for review, see Kastaniotis et al., 2017). Based on our observation that MECR is highly expressed in mouse Purkinje cells (PCs), we set out to elucidate the cellular functions of mtFAS in neurons using a PC-specific Mecr knock-out (KO) mouse. This is the first report on the physiological role mtFAS in the nervous system of a mammalian model.
Materials and Methods
Animals
The homozygous floxed Mecr (Mecrtm1c) mice were generated from B6Dnk; B6Brd; B6N-Tyrc-BrdMecrtm1a(EUCOMM)Wtsi (EM: 04825) lines as described previously (Nair et al., 2017). To specifically knock out Mecr from cerebellar PC, the homozygous Mecrtm1c mice were bred with B6. Cg-Tg (Pcp2-Cre) 3555Jdhu/J-transgenic mice expressing Cre recombinase under control of the PC-specific Pcp2 promoter (Zhang et al., 2004). The pups born were genotyped by two different PCRs to verify presence of Cre transgene and the loxP flanked Mecr in the pups. For the first PCR, which confirms loxP in the construct, the forward primer was 5′-CAGGGCTGACCCAGAGTTTC-3′ and the reverse primer 5′-CAGATGGATTGATAGGGGCTG-3′ is used. The amplicon size is 800 bp for the floxed allele and 650 bp for WT allele. The second PCR is to confirm presence of the gene encoding Cre recombinase and it required 5′-CGAGTGATGAGGTTCGCAAC-3′ as forward primer and 5′-TGAGTGAACGAACCTGGTCG-3′ as reverse primer. The reaction results in a 400 bp product if the Cre transgene is present.
The mice were maintained group housed in standard cages at 55% humidity, 22°C temperature, and under a 12 h/12 h dark/light cycle (lights on 7:00 A.M. to 7:00 P.M.). Food and water were provided ad libitum according to European Union directive 2010/63/EU for animal wellbeing. The experimental protocols were approved by Animal Experiment Board of Finland (license number ESAVI/7696/04.10.03/2012 and ESAVI-4553-04.10.07-2016).
Behavioral analysis
Two animal groups, 12 male and 12 female mice (six KO and six control mice of each sex) were included in a behavioral follow-up with the main focus of observing motor changes as the condition progresses. The mice were tested four times at the ages of 2, 4, 7, and 9 months. After handling, weighing, and habituation to the test equipment, the mice underwent the following tests.
Spontaneous explorative activity.
Spontaneous exploratory activity was analyzed in an observation cage (26 × 26 × 39 cm) with white opaque walls using an infrared photo detection method coupled with an automated activity monitor (TruScan, Coulbourn Instruments). The system was designed to enable separate monitoring of horizontal (X/Y move time) and vertical activity (rearing). The test session took 10 min. To avoid odor traces, the test cage was cleaned with 70% ethanol before exposure of a new mouse to the environment.
Rotarod.
The rotarod apparatus (Ugo Basile) was used to test motor coordination and balance. The mouse was placed on a round rod (2 cm in diameter), the rotation of which gradually increased from 2 to 40 rpm. The latency to fall off (or turn 2 full rounds around with the rod) was recorded up to a 6 min cutoff time. At the first age point, the mice were adapted to the test on a separate day by first allowing them to stay on the rod for 2 min at the minimum speed of rotation.
Gait analysis.
Changes in gait were measured by the CatWalk XT (Noldus), an automated gait analysis system. Mice were allowed to run freely through a 130-cm-long alley with a glass plate floor. A high-speed camera recorded the paw contacts from below and the program analyzed numerous static and dynamic parameters assessing individual paw functioning and gait patterns. We recorded three to five uninterrupted runs through the alley and selected the following parameters for analysis: stride length, swing speed, and base of support. These parameters were initially calculated for each run and for each paw, averaged over the runs, and finally the values for front and hindpaws were averaged.
PET imaging
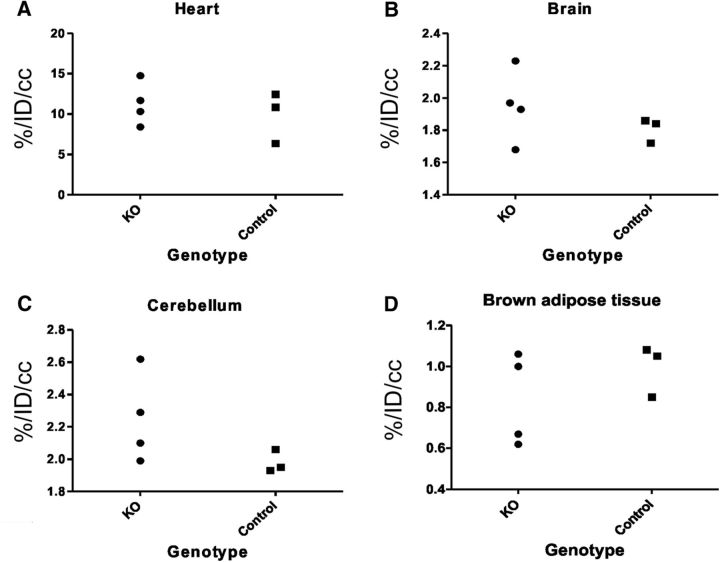
A separate group of four KO and three control male mice were used in [18F]fluoro-2-deoxy-2-d-glucose (FDG) PET study to assess potential systemic changes in basal metabolic rate (measuring glucose uptake). The mice were 6 months of age at the time of imaging and weighed 32 ± 4 g. The animals were imaged using a dedicated PET scanner (Inveon DPET, Siemens Healthcare), followed immediately by CT analysis (Flex SPECT/CT, Northridge Trimodality Imaging) for anatomical reference images using the same animal holder. The mice were placed on a heated animal holder on the scanner bed in a prone position and secured with adhesive tape to prevent movement during scanning. Dynamic imaging of 110 min was started at the time of the administration of (10.5 ± 0.4) MBq of FDG that was administered through the tail vein. Data were gathered in list mode form and corrected for dead time, randoms, scatter, and attenuation. Regions of interest were drawn for whole brain (excluding cerebellum), cerebellum, brown fat in the neck and upper back, and heart using Carimas version 2.9 software (Turku PET Centre). The time–activity curves were normalized to percentage of injected dose per cubic cm (%ID/cc) and the time window from 40 to 110 min after injection was chosen for further analysis.
Histology, immunohistochemistry (IHC), and immunofluorescence (IF) studies
Mice were dissected at 3 (four KO and six control mice), 6 (18 KO and 13 control), 9 (11 KO and five control), and 11 (five KO and four control mice) months of age after euthanasia by exposure to CO2. Brain, muscle, spinal cord, and liver samples were collected, fixed in 4% paraformaldehyde in sodium phosphate buffer (100 mm, pH 7.4), and embedded in paraffin. For hematoxylin staining, IHC and IF studies, we used 5 μm sagittal sections of cerebellum from all the mice of different ages, lumbar spinal cord (6 KO and 6 controls, 9 months old), and coronal sections of the forebrain (4 KO and 4 controls at 9 months old and 4 KO and 3 controls at 11 months). For Luxol fast blue staining, 8-μm-thick sections of cerebellar samples (2 KO and 2 control mice) from 11-month-old mice were used. The number and age of mice from which cerebellar samples were collected for IHC and IF are shown in Table 1. For IHC, cerebellar sections were incubated with anti-MECR antibody (1:250, Proteintech Group catalog #51027-2-AP, RRID:AB_615013), anti-8-isoprostane (1:1000, Oxford Biomedical Research catalog #IS20, RRID:AB_10819214), and anti-nitrotyrosine (1:250, Abcam catalog #ab7048, RRID:AB_305725) overnight at 4°C. Other antibodies were incubated for 1 h at room temperature and dilutions used were as follows; anti-calbindin (1:500, GenScript catalog #A01268, RRID:AB_1582512) anti-GFAP (1:250, Novus catalog #NBP1-40424, RRID:AB_10004914) anti-Iba1 (1:1000, Wako catalog #019-19741, RRID:AB_839504), polyclonal anti-single stranded binding protein 1 (SSBP1) (1:500, Sigma-Aldrich catalog #HPA002866, RRID:AB_1080092), anti-Cox1 (1:200, Abcam catalog #ab14705, RRID:AB_2084810), cleaved caspase-3 (1: 250 (R&D Systems catalog #MAB835, RRID:AB_2243951), and anti-LA (Millipore catalog #437695-100UL, RRID:AB_10683357). Rabbit specific HRP/DAB (ABC) detection kit (Abcam) was used for detection of primary antibodies and the sections were counterstained with hematoxylin.
Table 1.
Number and age of cerebellar samples from KO and control mice used for IHC and IF analysis with various primary antibodies
| Antibody | Age (mo) | No. of mice of each genotype |
|
|---|---|---|---|
| Control | KO | ||
| Anti-MECR (IHC) | 3 | 6 | 4 |
| 6 | 11 | 15 | |
| 9 | 6 | 9 | |
| 11 | 4 | 5 | |
| Anti- GFAP (IHC) | 3 | 4 | 4 |
| 6 | 4 | 4 | |
| 9 | 4 | 4 | |
| 11 | 4 | 4 | |
| Anti-Iba (IHC) | 3 | 4 | 4 |
| 6 | 8 | 7 | |
| 9 | 4 | 4 | |
| 11 | 4 | 4 | |
| Anti-Calbindin (IHC) | 3 | 4 | 4 |
| 6 | 7 | 8 | |
| 9 | 4 | 4 | |
| 11 | 4 | 4 | |
| Anti-LA (IHC) | 6 | 19 | 14 |
| Anti-SSBP1 (IHC) | 6 | 15 | 10 |
| Anti-COX1 (IHC) | 6 | 4 | 4 |
| Anti-8-isoprostane (IHC) | 6 | 6 | 6 |
| Anti-nitrotyrosine (IHC) | 6 | 8 | 8 |
| Anti-caspase3 (IHC) | 6 | 4 | 4 |
| Anti-MECR (IF) | 3 | 4 | 4 |
| 6 | 4 | 4 | |
| 9 | 4 | 6 | |
| 11 | 4 | 5 | |
| Anti-calbindin (IF) | 3 | 4 | 4 |
| 6 | 4 | 4 | |
| 9 | 4 | 6 | |
| 11 | 4 | 5 | |
| Anti-LA (IF) | 3 | 4 | 4 |
| 6 | 4 | 4 | |
| 9 | 4 | 6 | |
| 11 | 4 | 5 | |
For IF, cerebellar sections were incubated with anti-MECR antibody (1:250, Proteintech Group catalog #51027-2-AP, RRID:AB_615013), anti-calbindin (1:500, Abcam catalog #ab82812, RRID:AB_1658451), and anti-LA (1:250, Millipore catalog #437695-100UL, RRID:AB_10683357) overnight at 4°C. The secondary anti-rabbit antibodies used were conjugated with Alexa Fluor 488 (1:200, Jackson ImmunoResearch Laboratories catalog #711-545-152, RRID:AB_2313584) or Cy3 (1:400, Jackson ImmunoResearch Laboratories catalog #711-165-152, RRID:AB_2307443 Jackson ImmunoResearch Laboratories catalog #711-165-152), and anti-mouse secondary antibody was conjugated with Cy3 (1:200, Jackson ImmunoResearch Laboratory catalog #715-165-151). The sections were counterstained with Hoechst 33342 (BioNordika).
The stained sections were analyzed and images captured with an Olympus BX 51 microscope equipped with Cell∧ M imaging software (Olympus) using 4× or 10× objectives. The amount of calbindin positive PC was counted from IHC samples manually from the cerebellar cortex between an outer molecular layer and an innermost granular layer and length of this PC layer was determined. The density (PC/mm) was then determined by dividing the number of cells by the length of the layer. IbaI-positive cells were manually counted from a field (0.04 mm2) taken from cerebellar cortex and deep cerebellar nuclei and the density (cells/mm2) was then determined by dividing the number of cells by the area of the field of view. The intensity of MECR and LA staining in PCs in 6-month-old mouse was evaluated from IF samples by two individuals with no prior knowledge of the project and graded into three categories: high, medium, and low. Four control and three KO samples evaluated and the results were calculated as percentage of total PC count.
Electron microscopy
For transmission electron microscopy, cerebellar samples from 6-month-old mice (8 KO and 6 control mice) were fixed in 1% glutaraldehyde 4% formaldehyde mixture in 100 mm phosphate buffer, pH 7.4. They were postfixed in 1% osmium tetroxide, dehydrated in acetone and embedded in Epon LX 112 (Ladd Research Industries). Thin sections (70 nm) were cut with a Leica Ultracut UCT ultramicrotome, stained in uranyl acetate (UA) and lead citrate, and then examined in Tecnai G2 Spirit 120 kV transmission electron microscope (FEI Europe). A total of 37 PCs from KO mice and 14 PCs from control mice were analyzed in detail and images were captured with a Quemesa CCD camera operated with iTEM software (Olympus).
For immunoelectron microscopy, cerebellar samples from 6-month-old control (n = 5) and KO mice (n = 6) were fixed in 4% paraformaldehyde in 100 mm phosphate buffer, pH 7.4, with 2.5% sucrose for 2 h and processed as reported previously (Slot and Geuze, 1985). Tissue pieces were immersed in 2.3 m sucrose in PBS and rotated at 4°C for 4 h. Specimens were frozen in liquid nitrogen and thin cryosections were cut with an EM UC7 cryo ultramicrotome (Leica Microsystems). The sections were picked on Butvar-coated nickel grids. The grids were first incubated in 2% gelatin in PBS for 20 min and then in 0.1% glycine–PBS for 10 min followed by incubation in a blocking serum containing 1% BSA in PBS for 5 min. 1% BSA in PBS was used in washes and dilutions of antibody and gold conjugates. Sections were exposed to the primary antibody, polyclonal SSBP1 (1:100, Sigma Aldrich, catalog #HPA002866) for 45 min followed by incubation with protein A gold (10 nm) for 30 min (Slot and Geuze, 1985). The controls were prepared by replacing the primary antibody solution with PBS. The grids were stained with neutral UA and embedded in 2% methyl cellulose containing 0.4% UA and examined with a Tecnai Spirit transmission electron microscope (FEI). Images were captured using a Quemesa CCD camera (Olympus).
From immunoelectron micrographs, 16 PCs from 6 KO mice and 9 PCs from 5 control mice were randomly taken for detailed analysis. The numbers of random cytoplasmic areas from PCs were used in analysis were 55 and 70 from control and KO mice, respectively. The gold dots on mitochondria per square micrometer of cytoplasm and the mitochondria per 5 μm2 were counted. The presented values are means ± SD. The graphs were plotted using GraphPad Prism version 5.00.
Mitochondrial respiratory complex and aconitase activity assays
Mitochondrial respiratory complex activity stainings were done by modification of a previous protocol (Jung et al., 2002). Snap-frozen cerebella were collected from 6-month-old male/female Mecr-KO and control mice and cut into 10 μm sections with a cryostat. For complex I activity staining (9 KO and 5 control mice), sections were incubated in a solution containing 100 mm Tris–HCl, pH 7.4, 0.14 mm NADH, 1.0 mg/ml Nitroblue tetrazolium (NBT), 2 μg/μl antimycin A, and 84 mm malonate at 37°C for ∼30 min. The incubation mixture for complex II activity (6 KO mice and 4 control mice) contained 84 mm succinate, 0.2 mm phenazine methosulfate, 1.5 mg/ml NBT, 4.5 mm EDTA, 60 μm rotenone, and 2 μg/μl antimycin A in 50 mm potassium phosphate buffer, pH 7.4. For complex IV staining, sections (9 KO mice and 5 control) were incubated in a mixture containing 50 mm potassium phosphate, pH 7.4, 1.0 mg/ml 3, 3-diaminobenzidine (DAB), 24 units/ml catalase, 1 mg/ml cytochrome c, 100 mm sucrose, and 2 μg/μl antimycin A. For both of these activity stainings, incubations were performed at 37°C for ∼50 min. The negative staining control solution for complex I, complex II, and complex IV contained 60 μm rotenone, 84 mm malonate, and 2 mm potassium cyanide, respectively, in the incubation mixture. After staining, slides were washed with 50 mm potassium phosphate buffer, pH 7.4, four times followed by dehydration in ascending grades of alcohol and mounted with Pertex (Histolab).
The histochemical assay for aconitase activity was performed with 10-μm-thick cryosections of cerebellum from 6-month-old mice (6 KO and 4 control mice). The sections were thawed at room temperature for 10 min, followed by incubation with aconitase activity incubation mixture for 90 min at 37°C. The incubation mixture contained 200 mm cis-aconitate (Sigma-Aldrich), 5 mm MnCl2, 1.3 mm NADP, 2 mg/ml NBT, 100 mm Tris-HCl, pH 7.4, and 25% polyvinyl alcohol (30% polyvinyl alcohol, Molecular Dimensions). After staining, sections were washed 3 times with 50 mm potassium phosphate buffer, pH 7.4, followed by mounting with Immu-Mount (Thermo Fisher Scientific). PCs were identified by their location (lining the medulla) in conjunction with the characteristic oval shape.
Primary cerebellar neuron culture
Cerebellar neurons were cultured with slight modification of previously described protocols (Furuya et al., 1998; Tabata et al., 2000; Kageyama et al., 2012). Cerebella from embryonic day 18.5 embryos were dissected and digested with trypsin at 37°C for 3 min. The digested cerebella were washed twice with Hank's balanced salt solution containing 20 μg/ml gentamycin. After washing, cerebella were dissociated by pipetting up and down 8–10 times with 5 ml pipette first and then twice with 1 ml tip in seeding medium (100 μm putrescine, 30 nm sodium selenite, 10 μg/ml gentamycin in DME/F12) supplemented with 10% FBS, 12 mm MgSO4 and 10 U/ml DNase. The dissociated cells were pelleted (300 × g for 2 min at room temperature), the supernatant was discarded, and the cells were resuspended into 200 μl of preliminary culture medium (seeding medium supplemented with 10% FBS) per each embryo. Each cell suspension was seeded onto poly-d-lysine-coated coverslip (Sigma Aldrich, overnight coating with 5 mg/100 ml in sterile H2O) in the 6-well plate (Costar, Corning) and incubated for 3 h at 37°C. After this initial incubation step, 2.3 ml of culture medium (seeding medium supplemented with 200 μg/ml transferrin, 40 nm progesterone, 20 μg/ml insulin, 0.5 ng/ml triiodothyronine, 100 μg/ml BSA) was added. The day of plating is considered as day 0. On day 4, lentiviral transfection was performed (see below). On day 6, the culture medium was removed and replaced by 1 ml of conditioned culture medium and 1 ml of fresh culture medium supplemented with 4 μm cytosine arabinoside. Half of the culture medium was replaced on every fourth day with fresh culture medium supplemented with 4 μm cytosine arabinoside. Cells were grown for another 25 d after viral transfection and then processed for IF analysis.
Production of recombinant lentiviruses
The virus preparation was performed as described previously (Cattavarayane et al., 2015). Briefly, HEK293T cells were transiently cotransfected with pVSV-G (vesicular stomatitis virus pseudotype) envelope plasmid, pPax2 (Gag:Pol:Tat:Rev), and the lentiviral transfer constructs. Two different lentiviral transfer vectors were used. The GFP-Cre vector, expressing both GFP and Cre was a gift from Tyler Jacks (Addgene plasmid #20781). Cre-expressing cells can thus be readily identified by GFP fluorescence, which also indicates transfection/transduction efficiency. As a control, we used a lentiviral vector that expresses only GFP. The medium was replaced 24 h after transfection. The next day, the supernatant containing viral particles was collected, centrifuged at 2500 × g, for 50 s and filtered. Supernatant was harvested up to five times (or until large proportion of the packaging cells had detached) at 24 h intervals. Cleared viral supernatants were frozen and stored at −80°C until use.
IF assay of cultured cerebellar neurons
For the immunofluorescense analysis, cells were incubated with 50 nm MitoTracker Red CMXRos (Invitrogen) at 37°C for 25 min and washed twice with medium prewarmed to 37°C. Then the cells were fixed with 4% paraformaldehyde in sodium phosphate buffer at room temperature for 15 min and washed with PBS twice. The cells were then blocked in buffer containing 1% BSA and 0.1% saponin in PBS followed by primary monoclonal Tubulin III antibody (1:400, Sigma-Aldrich catalog #T8660, RRID:AB_477590) incubation at room temperature for 1 h. The sample was washed three times, followed by incubation with anti-mouse Alexa Fluor 405 (1:500, Thermo Scientific) fluorescent antibody at room temperature for 1 h. Samples were imaged using Zeiss LSM 700 confocal microscope, Zen Software (Zeiss) with 63× or 40× Apo oil-immersion objectives and appropriate filters.
Statistics
All behavioral data were analyzed with SPSS 21 (IBM Analytics) using ANOVA for repeated measures (RM-ANOVA) with age as the within-subject and genotype as the between-subjects factors. Because of the different body size, males and females were analyzed separately. For statistical analysis of immunoelectron microscopy data, the number of dots per square micrometer per mouse and the number of mitochondria per 5 μm2 per mouse in control and KO group were analyzed using a two-tailed t test using GraphPad Prism version 5.00.
Results
Generation of PC-specific Mecr KO mice
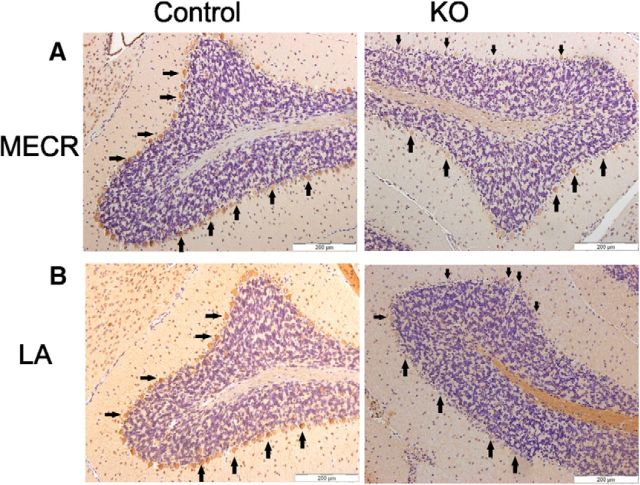
Mutations in MECR in human patients lead to neurodegenerative disease (Heimer et al., 2016). To obtain information on the distribution of MECR in the mammalian brain, we examined histological sections of mouse brain for the presence of MECR using IHC analyses. Our results indicated a strong expression of MECR in PCs of control mice (Fig. 1A, left). Because high levels of MECR in this neuronal cell type are likely to indicate a dependence of PCs on MECR and mtFAS function, we decided to specifically knock out the Mecr gene in these cells in anticipation of a neurodegeneration phenotype that would allow us to study the process of neuronal disintegration as a result of mtFAS dysfunction in more detail.
Figure 1.
MECR and LA abundance in cerebellar sections of control and KO mice at 6 months of age. The sections were treated with antibodies either to MECR or lipoylated proteins and counterstained with hematoxylin. A, Compared with the control samples (left) Mecr PCs of 6-month-old Pcp2-Cre KO mice (right) appeared to elicit lower intensities for the MECR antibody signal, with generally weaker brown staining, indicating reduced MECR protein levels. B, Anti-LA staining of cerebellar sections. Compared with control samples (left), the tissue sections of KO mice cerebella (right) treated with anti-LA antibody display a mosaic staining pattern congruent with the MECR pattern in the panel above, indicating that levels of lipoylated proteins were also reduced in PCs of KO mice. Arrows point to examples of PCs. Scale bar, 200 μm.
The breeding of floxed Mecr mice with mice expressing Cre recombinase under the Pcp2 promoter generated PC Mecr KO mice at a Mendelian ratio. Based on genotyping and IHC for MECR, the mice homozygous for the lox P site and the Pcp2-Cre cassette were identified as PC-specific Mecr KO mice deleted for exon 2 of Mecr. The mice homozygous for floxed Mecr and negative for the Cre transgene were maintained as control mice.
The Cre expression was driven by the PC-specific promoter of the Pcp2 gene, for which Cre expression has been reported to occur at postnatal day 6 (P6)–P15 (Zhang et al., 2004). The effect of removal of exon 2 of Mecr in PC was monitored by IHC staining for MECR in PCs. In DAB-stained specimen from mice at the age of 6 months, the MECR protein level appeared clearly reduced in PCs of the KO animals (Fig. 1A). Octanoic acid synthesized by mtFAS is used as a substrate for sulfuration in endogenous synthesis of LA (Hiltunen et al., 2010). To investigate the metabolic consequences of mtFAS inactivation in PCs, we used IHC analysis on protein lipoylation using anti-LA antibody in these cerebellar sections of 6-month-old mice. The brown staining of PCs in KO mice indicative of lipoylated proteins was found reduced or lost (Fig. 1B), indicating deficiency in cellular LA in these cells. Increase of lipoylation-specific signal in the medulla was observed in some KO animal samples (Fig. 1), but not reproducibly so.
Widespread PC loss in aging KO mice
The histological evaluation of the cerebella from 3-month-old mice showed that organization of oval shaped PCs arranged as into a single cellular layer between molecular and granular layers of cerebellum were similar in both control and KO mice (Fig. 2A, left). However, at the age of 6 months, the PC number had declined in KO mice and this reduced cell number resulted in discontinuity in the PC layer (Figs. 1, 2A, center left). Some of remaining PCs displayed homogenous pink cytoplasm that had lost basophilic nuclear staining. At the age of 9 months and on, the PC layer was undetectable in the mutant mice (Fig. 2A, center right and right).
Figure 2.
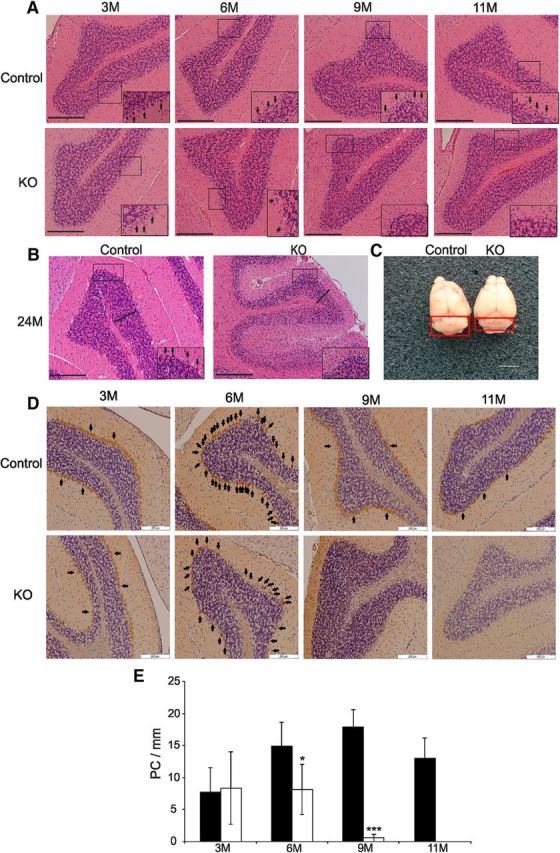
Microscopic and gross morphology of control and KO mouse cerebella. A, Progression of PC loss with age in hematoxylin-stained sections of cerebellum in KO mice. The insets show a magnified image of the boxed regions. Arrows point to PCs. Scale bar, 200 μm. B, Histology of cerebellum of a representative KO and control mouse at 2 years of age. The KO cerebella are completely devoid of PCs compared with the control mouse (inset: arrows point to PCs). Notice also the thinner granular cell layer (bold line) in the KO mouse. Scale bar, 200 μm. C, The cerebellum (boxed area) in a KO mouse appears atrophic (right) compared with that of a control mouse (left) at 2 years of age. Scale bar, 1 cm. D, Calbindin is used as a marker for PCs that are visualized by brown color. The panels demonstrate progressive loss of PCs in KO mice with increasing age. The PC layer displays discontinuity at 6 months and is absent from 9 months on. Arrows point to entire PC arrays in the panels depicting cerebellar sections of the 6-month-old mice to illustrate the extent of discontinuity in cerebellar sections of the mutant mice, and only to examples of PCs in the other panels. E, Quantitation of PC loss in mutant mice over time. At 6 months, a statistically significant difference in PC count (number of PCs per millimeter of border between the molecular/granular layers) in mice carrying the PC-specific Mecr KO allele can be found compared with controls and loss of PCs progresses with increasing age. The values are expressed as mean ± SD. *p < 0.05, ***p < 0.001.
To assess whether the loss of MECR in PCs would affect the lifespan of KO mice, two Mecr-KO mice were retained. Both mice were viable at least up to 24 months of age. In 24-month-old KO mice, the histological samples of cerebella of KO mice displayed thinner molecular and granular layers and loss of granular neurons accompanying the PC loss (Fig. 2B). Visual inspection of whole brains of these mice revealed cerebellar atrophy in the mutants compared with WT controls (Fig. 2C). To evaluate the extent of PC loss across ages, we stained a series of cerebellar sections of 3- to 11-month-old mice for calbindin. A normal density of PCs was found at the age of 3 months, but their density was visibly decreased at 6 months and no calbindin-positive cells were found in the stained cerebellar sections of KO mice from 9 months on (Fig. 2D). Quantitation of PC loss confirmed that the PC count had decreased by ∼50% in the mutant mice compared with WT, was barely detectable by 9 months, and had completely vanished by 11 months of age (Fig. 2E). We were unable to detect any lobe-specific pattern of PC loss in the KO animals.
To make a distinction between age-dependent decline of protein expression of MECR and LA versus loss of PCs, we used IF approach on tissues from control and Mecr KO mice at several age points. As in the IHC images (Figs. 1, 2), double fluorescent staining using antibodies against MECR and the specific marker for cerebellar PCs (Girard et al., 2012), calbindin, revealed an intact PC lining in the cerebella of 3-month-old control mice, whereas a gapped patterning already emerged at this age in the Mecr KO samples in these experiments (Fig. 3). This feature was strongly exacerbated in PCs of brains of 6-month-old mice carrying the PC-specific Mecr KO allele compared with samples of age-matched control mice, where also an overall lower MECR-associated fluorescence appeared to emerge. We did not find a single instance in which a calbindin positive oval PC was not also positive for MECR fluorescence. These results are consistent with a mtFAS defect in PCs of the KO animals.
Figure 3.
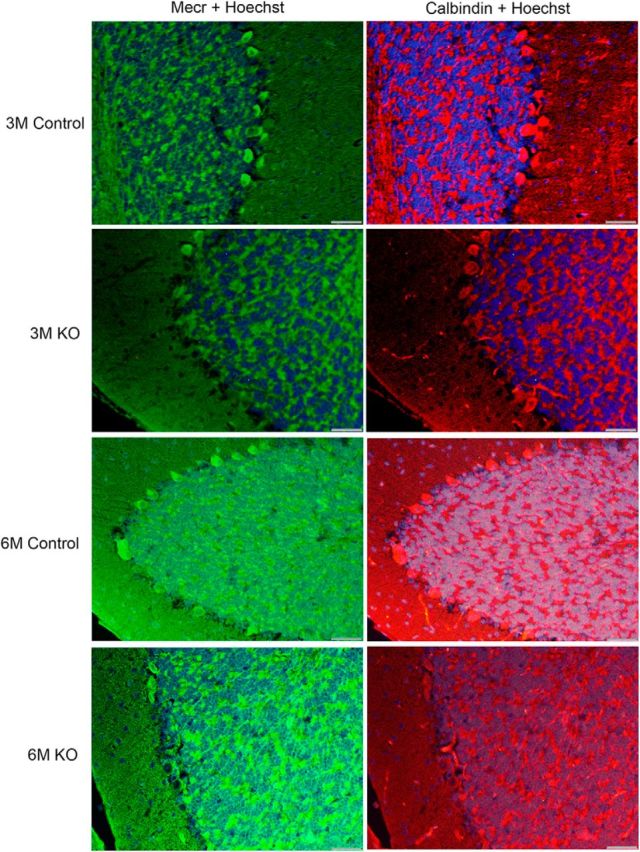
IF studies of MECR and calbindin distribution in cerebella of control and PC-specific Mecr KO mice aged between 3 and 6 months. Shown are cerebellar sections probed with two different primary antibodies and corresponding secondary antibodies carrying green or red fluorescent tags identifying MECR and calbindin proteins, respectively. A Hoechst 33342 stain was used to label cellular nuclei. Scale bar, 40 μm.
The loss of MECR-specific fluorescence appeared to be mirrored by a matching defect in lipoylation in PCs in equivalent histological samples (Fig. 4). As in the DAB stained sections, samples from mice of 6 months of age on displayed visibly reduced levels of MECR/LA-specific fluorescent signal. Because the visual inspection of the overall appearance of the images containing IHC and IF data indicated to us that there may be a reduction of MECR protein or LA detectable in the remaining PCs of 6-month-old KO mice, we set out to quantitate these differences in fluorescence intensities. However, we were unable to solidly confirm such a reduction (Table 2). Our naive evaluators found no difference at all in fluorescence intensity for the MECR-specific fluorescence. There was a trend toward reduction of fluorescence intensity of the lipoylation signal in the KO PCs, but the difference from fluorescence in the control mice did not reach statistical significance.
Figure 4.
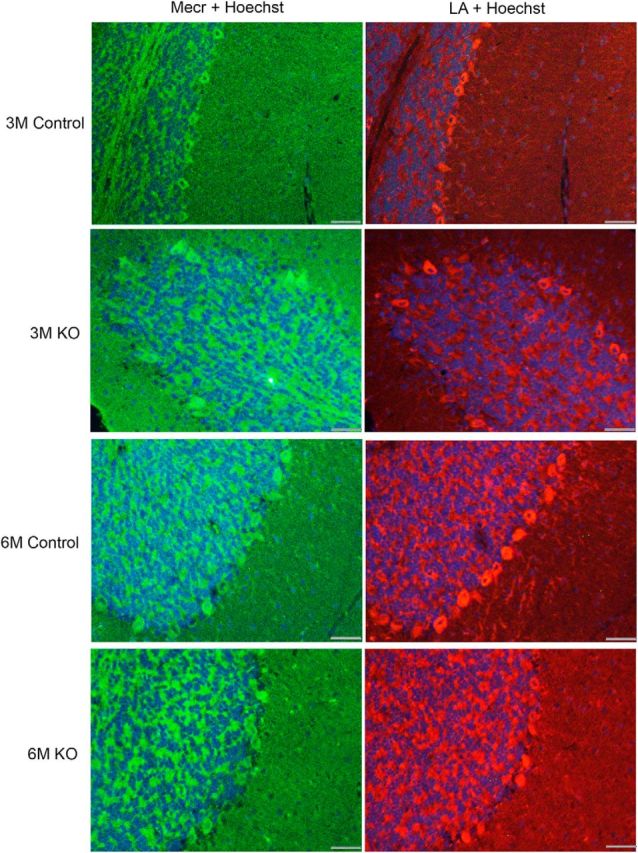
IF studies of distribution of MECR and lipoylated proteins in control and KO mice aged between 3 and 6 months. Anti-MECR and anti-LA panels are from hybridizations of consecutive sections, so the images do not co-register perfectly. Antisera with reasonable specificity against either target were only available from the same species source animal, thus not allowing for dual staining of the identical material. A Hoechst 33342 stain was used to label cellular nuclei. A dataset including these images was used for our quantitation of MECR and lipoylation intensities shown in Table 2. Scale bar, 40 μm.
Table 2.
Quantitation of fluorescent staining intensity in PCs of cerebellar histology samples from 6-month-old mice probed for MECR and lipoylated proteins
| MECR |
Lipoylation |
|||
|---|---|---|---|---|
| Control | KO | Control | KO | |
| High | 30.9 ± 19.7 | 36.2 ± 23.3 | 46.7 ± 13.2 | 15.6 ± 18.9 |
| Medium | 43.3 ± 14.6 | 39.7 ± 18.1 | 34.3 ± 14.3 | 39.3 ± 20.8 |
| Low | 25.8 ± 22.9 | 24.1 ± 21.9 | 19.1 ± 11.8 | 45.1 ± 30.3 |
Data are shown as the mean percentage of cells ± SD.
Progressive motor impairment in PC-specific Mecr KO mice
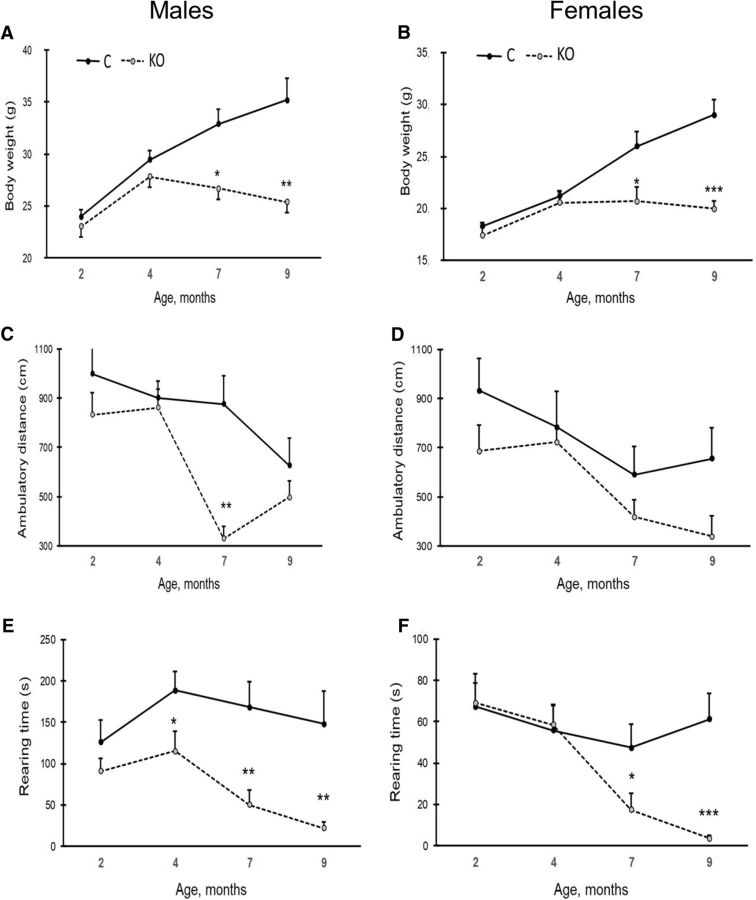
As illustrated in Figure 5, A and B, the body weight of control mice continued to increase throughout the follow-up period from 2 to 9 months. In contrast, KO mice started to deviate from controls at 4 months of age, showing essentially no further gain in body weight. The age × genotype interaction was significant in both sexes (males: F(3,12) = 8.2, p = 0.003, females: F(3,12) = 14.6, p < 0.001).
Figure 5.
Body weight and behavioral analyses of mice across ages 2 to 9 months. A, B, Body weight in KO and control mice (males, A; females, B). C, D, Changes in spontaneous explorative activity across ages. Ambulatory distance (gross horizontal locomotion) during 10 min in males (C) and in females (D). E, F, Rearing time in males (E) and in females (F). Values are expressed as mean ± SEM. *p < 0.05, **p < 0.01, ***p < 0.001 (RM-ANOVA followed by LSD post hoc test).
Spontaneous exploratory activity in the test cage gradually decreased with repetition and age. In addition, the development in exploratory activity differed between the genotypes. The RM-ANOVA showed a significant age × genotype interaction in both sexes (males: F(3,12) = 5.3, p = 0.015, females: F(3,12) = 11.4, p = 0.001), so the gross horizontal distance traversed during the 10 min test time declined faster in KO mice than in control after 4 months of age (Fig. 5C,D). A similar trend was observed in the time the mice spend rearing (Fig. 5E,F). After 4 months of age, the time spend rearing declined faster in KO mice than in their controls (age × genotype interaction; males: F(3,12) = 7.3, p = 0.005, females: F(3,12) = 10.1, p = 0.001). These findings indicate increasing difficulties in locomotion and rearing in KO mice with age.
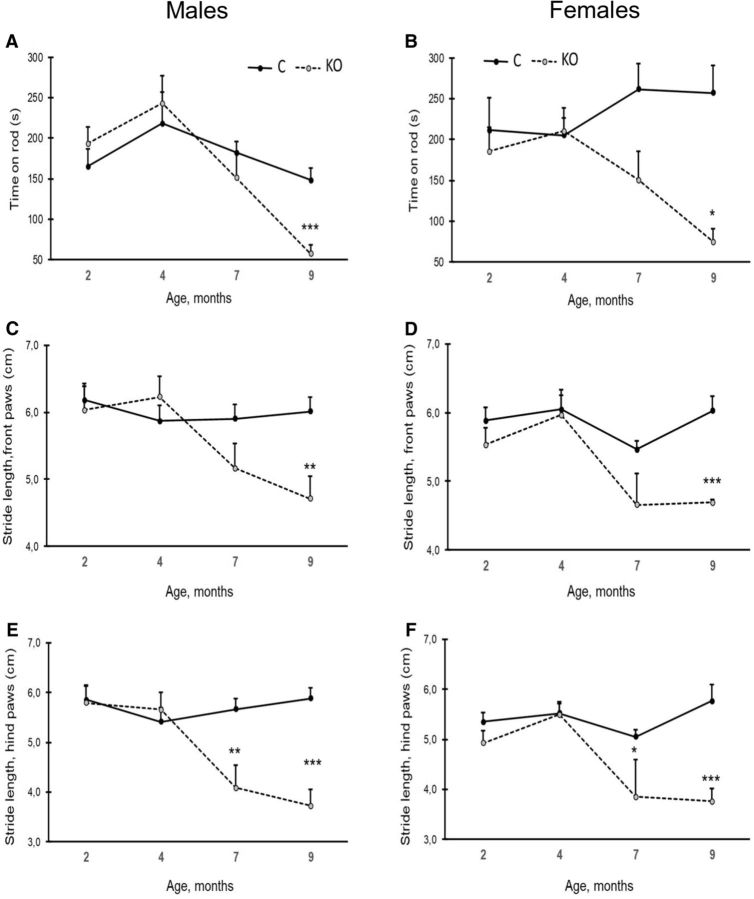
To assess changes in motor coordination and balance across age, we used the classic rotarod test. Among females, the KO mice performed equally well as control mice up to an age of 4 months, but then showed a marked decline at 7 and 9 months of age (age × genotype interaction; F(3,12) = 5.1, p = 0.017). A trend for a similar development could be seen in males, but the age × genotype interaction did not reach statistical significance (F(3,12) = 3.4, p = 0.054). Nevertheless, at 9 months of age, both female and male KO mice were severely impaired compared with controls (Fig. 6A,B). This finding suggests that female KO mice in particular start having problems with coordination and balance after the age of 4 months.
Figure 6.
Rotarod test and gait analysis for motor coordination and balance. A, B, Rotarod test data. The y-axis values indicate the time the mice were able to stay on the rotating rod up to a 6 min cutoff (males, A; females, B). C, D, Gait analysis during the follow-up from 2 to 9 months of age. Stride length of forepaws in males (C) and females (D). E, F, Gait analysis for stride length of hindpaws (males, E; females, F). Each analysis was done with six males and six females of different age group and genotype. Values are expressed as mean SEM. *p < 0.05, **p < 0.01, ***p < 0.001 (RM-ANOVA followed by LSD post hoc test).
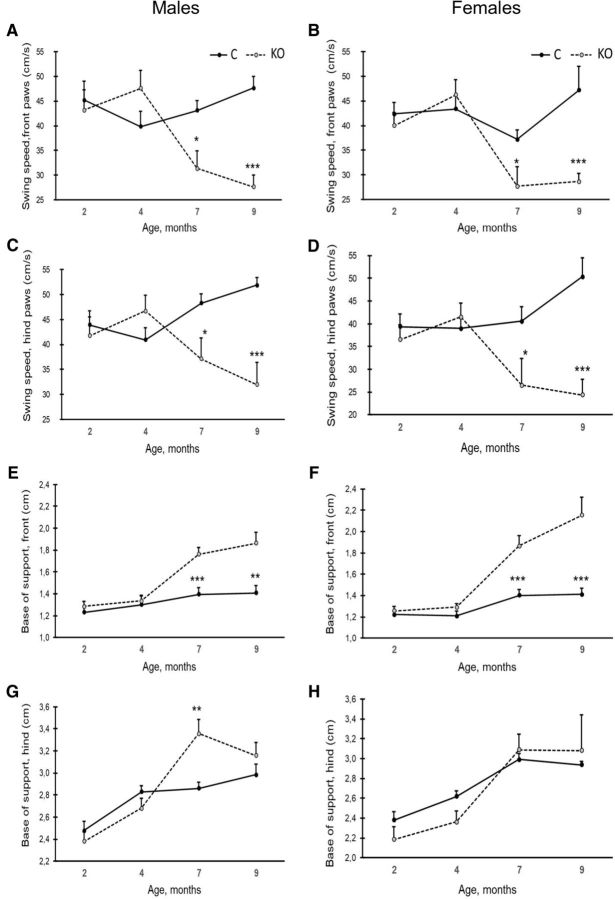
Automated gait analysis (CatWalk) revealed a progressive deterioration in KO mice. The stride length of the front paws tended to increase in KO mice from 2 to 4 months of age, but then shortened, whereas in control mice, no net changes across ages were recorded (age × genotype interaction; males: F(3,12) = 3.3, p = 0.062, females: F(3,9) = 7.2, p = 0.009; Fig. 6C,D). The same trend could be seen in the stride length of the hindpaws (age × genotype interaction; males: F(3,12) = 6.2, p = 0.010, females: F(3,9) = 6.2, p = 0.014; Fig. 6E,F). In parallel with the initial increase in stride length between 2 and 4 months of age, the swing speed of the front paws tended to increase in KO mice of both sexes, followed by a steep decline after 4 months of age (age × genotype interaction; males: F(3,12) = 6.8, p = 0.007, females: F(3,9) = 3.7, p = 0.054; Fig. 7A,B). The hindpaws showed a different pattern. In control mice, the swing speed of the hind limbs accelerated with age, whereas a steep decrease was observed in KO mice after 4 months of age. This resulted in highly significant age × genotype interaction in both sexes (males: F(3,12) = 11.4, p = 0.001, females: F(3,9) = 6.3, p = 0.013; Fig. 7C,D). These findings are indicative of general motor slowing in KO mice with age. The base of support of the front paws tended to broaden with age in all mice. However, the increase was much steeper in KO than control mice from 4 months on (age × genotype interaction; males: F(3,12) = 4.6, p = 0.025, females: F(3,9) = 5.2, p = 0.023; Fig. 7E,F). A similar genotype × age interaction in the widening of the base of support was seen for the hind limbs (males: F(3,12) = 4.1, p = 0.035, females: F(3,9) = 6.2, p = 0.018; Fig. 7G,H). The change in the base of support in control mice likely derived from increased body mass with age: the mouse needs a broader base to support its increasing mass. This trend was more apparent in KO mice even though they did not gain any weight after 4 months of age.
Figure 7.
Swing speed and base of support analyses. A, B, Swing speed of forepaws in males (A) and females (B). C, D, Swing speed of hindpaws in males (C) and in females (D). E, F, Base of support (distance between the pair of paws) of forepaws in males (E) and in females (F). G, H, Base of support of hindpaws in males (G) and in females (H). Values are expressed as mean SEM. *p < 0.05, **p < 0.01, ***p < 0.001 (RM-ANOVA followed by LSD post hoc test).
Our data indicate that onset of neurodegeneration must occur between 4 months, when weight and most behavioral parameters of the mutant mice are still within the range of WT mouse levels, and 6 months, when clear loss of PCs can be observed in the histological samples.
In aging KO mice, the ataxic condition progressively worsened and the animals had difficulties to eat from the food trough of the cage top but did well when given food on the cage floor.
No evidence of systemic change in glucose uptake in FDG-PET
The progressive weight loss raised the question of whether targeting Mecr specifically in cerebellar PCs using Pcp2 promoter driven Cre expression would have resulted in off-target suppression of mitochondrial function in other tissues. The suppressed mitochondrial function can result in an alteration of the basal metabolic rate in these tissues. To investigate the possibility of a general change of energy metabolism in these animals, we monitored the basal metabolism applying FDG-PET method by monitoring FDG uptake in heart, brain (excluding cerebellum), cerebellum and brown adipose tissue in the upper back and neck (Fig. 8A–D). The glucose uptake in these tissues was overlapping between KO and control mice except in cerebellum, which displayed a trend toward increased glucose uptake. This trend is compatible with increased glycolysis in PCs to compensate for impaired oxidative phosphorylation in their mitochondria. An alternative explanation for the higher level of glucose consumption may be an increase in glucose consumption as a result of astrogliosis following neuronal damage (see below). Nonetheless, the FDG-PET study found no support for the idea that the weight loss in KO mice would have resulted from a systemic change in basal metabolism in KO mice.
Figure 8.
FDG-PET analysis for evaluating glucose uptake in 6-month-old mice. The results of basal metabolic activities in heart (A), brain (B) (excluding cerebellum), cerebellum (C), and brown adipose tissue (D) measured as glucose uptake (y-axis) was found to be overlapping between KO mice and control mice, respectively. In cerebellum of KO mice, there was a trend toward increased glucose uptake. x-axis is the genotype; y-axis is the time–activity normalized to percentage of injected dose per cubic cm (%ID/cc).
To rule out the possibility that the lack of weight gain is due to difficulty in eating laboratory chow, we also analyzed development of chewing pattern (Li et al., 2005) in the mice with close video monitoring. We found no evidence for impaired chewing up to 9 months of age (data not shown). Considering the unchanged basal metabolism and chewing pattern up to 9 months of age in conjunction with the parallel weight loss and significant ataxia from 7 months on, expenditure of extra energy required for ataxic movements remains the most plausible explanation for the progressive weight loss.
Astrocytosis and microgliosis in cerebella of PC-specific Mecr KO mice
The observed PC loss is congruent with the detected loss of MECR and lipoylated proteins (Fig. 1A,B). Based on these observations, the age of 6 months presents an intermediate state in PC disappearance. Subsequently, this time point was chosen for further investigation of the consequences of loss of MECR function in PCs.
Neuronal damage is often accompanied by astrocytosis and activation of microglia (Almajan et al., 2012). Therefore, we stained cerebellar sections for astrocytosis using glial fibrillary acidic protein (GFAP) as a marker (Sörensen et al., 2001) and for microgliosis using Iba-1 as a marker (Almajan et al., 2012). Immunostaining for GFAP displayed enhanced brown staining in the cerebellar cortex from 6 months on in the KO mice, whereas no change was found in control mice (Fig. 9A), indicating that the PC loss was accompanied by astrocytosis in the cerebellar cortex. In addition, intensive staining of cells with anti-Iba-1 antibody (Fig. 9B) indicates activation of microglial cells in KO mice starting from 3 months of age on, continuing through the entire course of analysis (Fig. 9B). Dying neurons show Wallerian degeneration of their axons at an early stage of the process and degenerating axons often induce microglial responses. Therefore, we also performed Iba-1 staining for the first-order projection zone of PCs, the deep cerebellar nuclei, and their second-order projections in the spinal cord, ventrolateral thalamus, and motor cortex. Microgliosis was apparent in deep cerebellar nuclei of KO mice from 6 months of age on (Fig. 9C). These observations were validated in our quantitative analysis (Fig. 9D,E). We were unable to detect microgliosis in the second-order projection zones.
Figure 9.
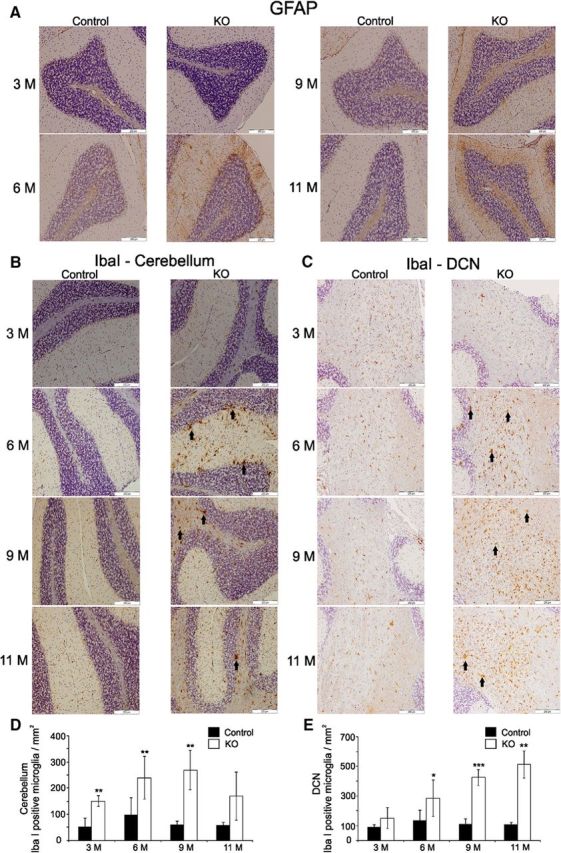
GFAP IHC in cerebellar sections and analyses of microgliosis associated with PC damage in the cerebellar cortex and deep cerebellar nuclei in KO mice. A, GFAP staining was applied to analyze the astrocytosis in different age groups of control and KO mice. Development of brown color in the sections of KO mice from 6 months and on indicate the occurrence of astrocytosis. Scale bar, 200 μm. B, Anti-IbaI identifies activated microglia (large brown cells) that can be observed in the cerebellar cortex of KO mice from 6 months of age and on. C, Microgliosis in cerebellar cortex is accompanied by increased number of active microglia stained by anti-Iba I antibody in deep cerebellar nuclei (DCN) of KO mice starting from 6 months of age and above. Arrows point to examples of activated microglia. Scale bar, 200 μm. D, E, Quantitation of Iba-I positive microglia in cerebellar cortex and DCN, respectively. The values are expressed as mean ± SD. *p < 0.05, **p < 0.01, ***p < 0.001.
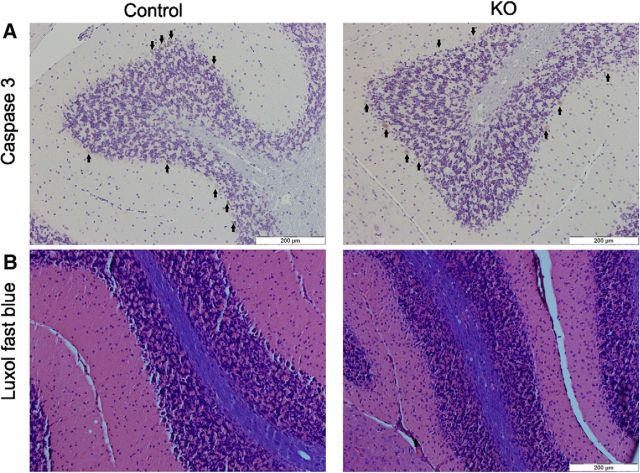
Together, the occurrence of astrocytosis in combination with activation of microglia in Mecr-KO mice indicates ongoing neuroinflammation accompanying mtFAS inactivation in PCs. This observation argues against apoptosis as the mechanism driving PC cell loss. To test the role of apoptosis in PC loss more directly, we stained cerebellar sections for the cleaved caspase-3, an established marker for apoptosis (Salvesen, 2002; Ghavami et al., 2009). The staining intensity in PCs was weak and we were unable to establish any clear difference in caspase-3 staining between samples form control mice and KO mice at 6 months of age (Fig. 10A, arrows point to PCs). In addition, a preliminary analysis using Luxol blue staining demonstrated that myelin was visualized with the same staining intensity in white matter of cerebellum in both control and KO mice at 11 months of age (Fig. 10B).
Figure 10.
Histochemical analysis of cerebellar cortex of control and KO mice for evidence of apoptosis. A, Staining for cleaved caspase-3 antibody showed similar immunopositivity in PCs from control and KO mice at 6 months of age, suggesting that the cell death does not take place via apoptosis. B, No changes in myelination between control and KO mice as assessed with Luxol fast blue staining in cerebellar white matter at 11 months of age.
Ultrastructural pathology and mitochondrial DNA content of Mecr-KO PCs
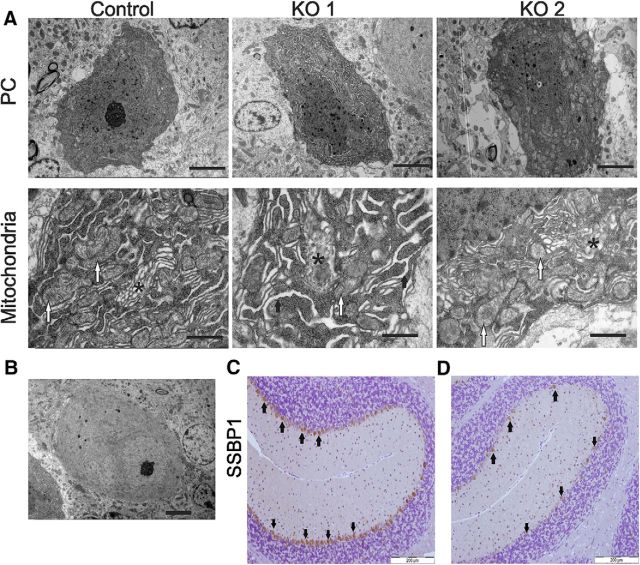
The transmission electron microscopy visualized multiple changes in subcellular compartments in PCs (Fig. 11A, Table 3) of 6-month-old KO mice compared with control animals. In KO mouse PCs, mitochondria displayed aberrant or absent cristae and the mitochondrial matrix showed electron-lucent foci. In some KO mice, the rough endoplasmic reticulum was dilated, and Golgi organization was disrupted (Fig. 11A, Table 3). Some of the PCs in KO animals had lost electrodense properties and appeared pale even though in the same view the neighboring cells appeared to retain these properties (for example, see Fig. 11B). This argues for the heterogeneity of PC population in the KO mice and support the idea that that the pale appearance is not due to staining.
Figure 11.
Ultrastructural analysis of PCs in control and Mecr-KO samples at 6 months of age by electron microscopy and assessment of PC mtDNA content. A, Example PC in one KO mouse displays mitochondria with a pale matrix and dilatation of the endoplasmic reticulum (KO 1), whereas the PC of another KO mouse has only mitochondria with pale matrix (KO 2). Scale bars in top row of A, 5 μm. Most of the mitochondria in the KO mouse PCs lack clear cristae and contain a pale matrix (bottom row of A, white arrows). The vesicular Golgi apparatus (*) in KO mice is disorganized. The endoplasmic reticulum is dilated in some of the KO mice at 6 months of age as exemplified here by the KO 1 (thick arrows). Scale bar, lower row A, 1 μm. B, Representative image of a pale PC from a KO mouse. Scale bar, 5 μm. C, D, Comparison of IHC detection of mitochondrial nucleoids identified by anti-single-stranded binding protein (SSBP1) antibody in control (C) and KO mouse (D) cerebella revealed weaker (brown) staining in PCs of the latter, indicating possible reduction of mitochondrial nucleoids in PCs of KO mice at 6 months of age. Scale bar, 200 μm.
Table 3.
Ultrastructural changes in PC, ER, and Golgi morphologies as observed in control and KO mice by transmission electron microscopy
| Phenotype at the age of 6 mo | No. of PCs Control | KO | |
|---|---|---|---|
| Pale PCs | - | 0 | 11 |
| Number of PCs with ER phenotype | Normal | 14 | 27 |
| ER dilatation | 0 | 10 | |
| Number of PCs with Golgi morphology phenotype | Normal | 13 | 26 |
| Moderate Golgi disruption | 1 | 11 | |
| Total number of PCs | 14 | 37 |
In total, 14 PCs from 6 control and 37 PCs from 8 KO mice were analyzed.
Previous studies in yeast indicated that yeast strains defective in mtFAS are prone to a higher frequency of mitochondrial DNA loss (Kursu et al., 2013), which is especially pronounced in acyl carrier protein (ACP1; Brody et al., 1997) and phosphopantetheine transferase (PPT2; Stuible et al., 1998) deletion mutants. To investigate possible mitochondrial DNA depletion in the PCs of KO mice, we used two approaches, both based on the use of anti-SSBP1 (mitochondrial single-stranded binding protein) antibody (Müller-Höcker et al., 2001). First, IHC evaluation of PCs in cerebella with the antibody showed more intense staining in control mice compared with KO mice PCs (Fig. 11C,D, respectively). We considered that this observation might be either due to depletion of mitochondrial DNA or only a reflection of a reduced number of mitochondria in PCs of KO mice. To further analyze these possibilities, we used immunogold labeling electron microscopy to detect and count the number of dots on mitochondria bound with anti-SSBP1 antibody as well as mitochondria present per 5 μm2 of cytoplasmic area in PCs of 6-month-old mice. The number of dots/ PC/μm2 mitochondria in KO mice did not differ from controls (1.26 ± 0.33 dots/μm2 mitochondria/mouse in controls compared with 1.02 dots/μm2 mitochondria/mouse in KOs; p = 0.68). However, when we assessed the number of mitochondria in PCs, we found that there were fewer mitochondria in PCs in KO mice (5.36 ± 0.37, n = 6, number of mitochondria/5 μm2 cytosol, mean ± SEM) compared with control mice (7.84 ± 1.02, n = 5; p = 0.02). This result is consistent with the observed overall lighter brown immunostaining with anti-SSBP1 antibody in PCs of KO mice. These data are evidence for an overall loss of mtDNA in the cell as a result of a decreased number of mitochondria in mutant PCs. However, we have to point out that abundance of SSBP1 may not necessarily always be proportional to mtDNA copy number because the protein is only associated with replicating mtDNA.
Mitochondrial enzyme activities
Cerebellar cryosections were used to evaluate the activities of respiratory complex I (NADH dehydrogenase), complex II (SDH), and complex IV (COX) in PCs of 6-month-old mice. The histochemical staining for complex I using NBT as an electron acceptor showed no development of blue color on PCs, indicating that complex I had lost its capability to transfer electron from NADH to an electron acceptor in these neurons in KO animals (Fig. 12A). Similarly, the incubation to visualize complex II activity also failed to give blue color to most of the PCs in the KO mice (Fig. 12B). However, when cytochrome c was used an electron donor and DAB as electron acceptor, the development of brown color, indicating COX activity, displayed a mosaic pattern in the same cerebellar tissue sections from KO mice (Fig. 12C). We have earlier demonstrated in yeast cells that cytochrome oxidase subunit I (COX I), which is mitochondrially encoded both in yeast and mammals, was lost in upon mtFAS inactivation (Kursu et al., 2013). Therefore, the presence of this subunit was also investigated in PCs of this study. However, consistent with the COX activity stain, no loss of COX I subunit was observed in PCs of KO mice at the age of 6 months (Fig. 12D).
Figure 12.
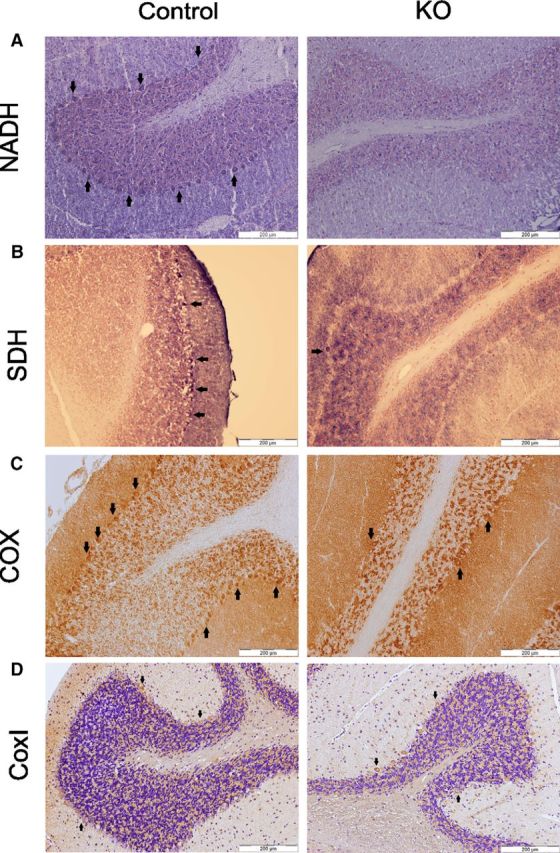
Respiratory complex activities in PCs of a representative control (left) and KO (right) mouse of 6 months of age. A, Complex I (NADH) activity staining did not result in any blue staining of PCs, indicating that the activity was absent in PCs of the KO mouse. B, Complex II (SDH) activity analysis showed almost complete absence of blue stained PCs in the KO mice, implying that the activity was also severely reduced in the KO mouse. C, Complex IV (COX) activity resulted in a mosaic PC staining pattern (notice the brown stained PCs) of the KO mouse. Arrows point to stained PCs. D, The Cox I antibody staining of PCs (brown) did not vary between control and KO mice at 6 months of age. Scale bar, 200 μm.
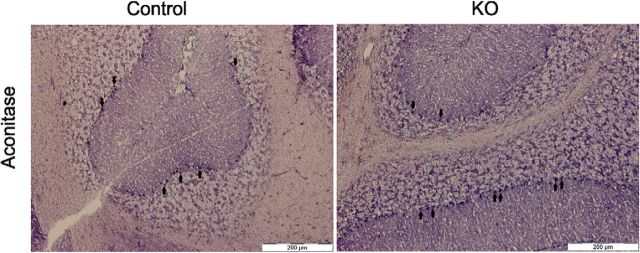
A recent study demonstrated that Fe–S cluster biosynthesis is linked to mtFAS via acyl-ACP in S. cerevisiae (Van Vranken et al., 2016). Therefore, we decided to address this aspect by testing aconitase activity as a marker the effect of mtFAS inactivation on a Fe–S-containing enzyme (Beilschmidt and Puccio, 2014). Using a histochemical assay, we were able to detect aconitase activity in all the existing PCs in both KO (blue colored cells) and control mice (Fig. 13). Using this approach, we were unable to find any evidence for a negative effect of Mecr inactivation on aconitase function in the PCs of KO mice.
Figure 13.
In situ aconitase activity stain. An in situ histochemical staining for aconitase, a Fe–S containing protein, activity revealed no difference between PCs of control and KO mice at 6 months of age because all of the PCs also stained positively. PCs were identified by visual inspection according to location and shape of the neurons. Arrows point at examples of stained PCs. Scale bar, 200 μm.
Assessment of oxidative damage in Mecr-KO PCs
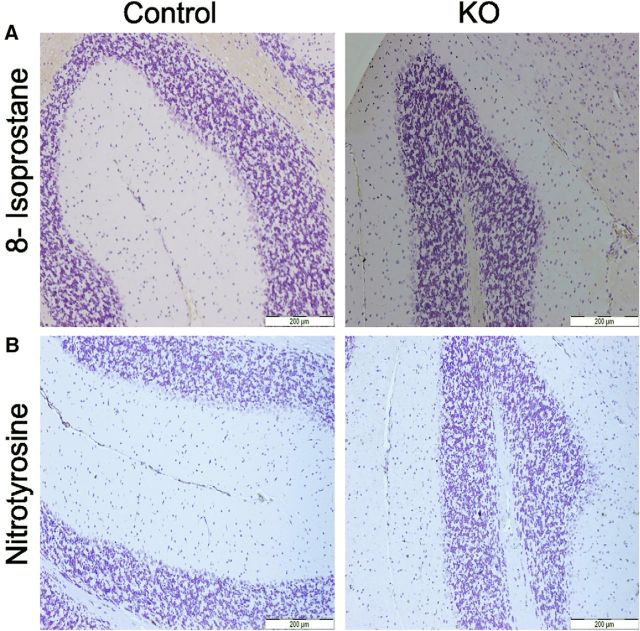
Mitochondrial respiratory complex dysfunction is commonly accompanied by enhanced generation of reactive oxygen species (ROS) resulting in elevated oxidative stress. To assess production of ROS and, ultimately, ROS-induced damage in mice at 6 months of age, we used IHC with two different antibodies recognizing commonly used oxidative damage markers, 8-isoprostane (Konzack et al., 2015) and nitrotyrosine (Sörensen et al., 2001). However, unlike in liver samples, which were used as positive controls for the assay (data not shown), there was no brown color development in PCs of KO mice (Fig. 14A,B), showing that these oxidative stress markers were absent in KO mice. Therefore, we find no evidence for oxidative damage as a major driver in the degeneration of PCs of KO mice.
Figure 14.
Oxidative-stress-related changes in PCs in control and KO mice of 6 months of age. A, 8-isoprostane, an oxidative stress marker (brown), was not detected in PCs of either control or KO mouse cerebella. B, Nitrotyrosine, another marker (brown) for oxidative damage, was also not detected by IHC in control and KO mice.
Fragmented mitochondria in primary neurons
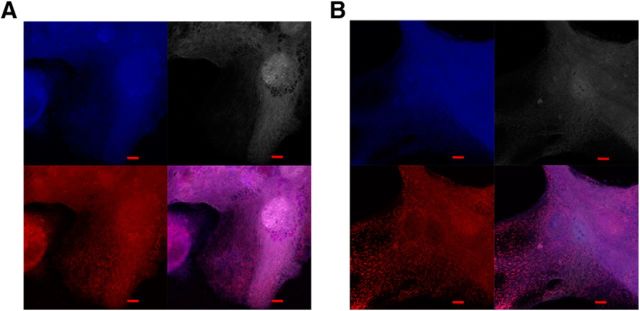
Mitochondrial dysfunction is known to often be accompanied by a change in mitochondrial morphology (Almajan et al., 2012; Girard et al., 2012). Because our current mouse model does not allow analysis for arrangement of mitochondria in neurons with the tools that are available to us, we turned to primary neuron culture to investigate the effects of mtFAS inactivation in nerve cells on mitochondrial morphology. The Mecr-KO was achieved by lentiviral introduction of Cre and GFP (for assessing transfection efficiency) into neurons carrying the floxed Mecr allele. The neuronal cells derived from embryonic cerebellum of floxed Mecr embryos and transfected with lentivirus carrying GFP for estimation of transfection efficiency were taken as control cells. The control and KO cells were processed for IF microscopy 25 d after lentiviral transfection and imaged.
Inspection of control cells stained with MitoTracker red by confocal microscope showed that the mitochondria were organized mainly in a tubular pattern (Fig. 15A). However, KO cells had lost the tubular mitochondrial architecture and mitochondria appeared as separate red dots, indicating fragmentation of the mitochondrial network (Fig. 15B). We have reported similar changes to mitochondrial morphology in cultured mouse cells exposed to RNAi-mediated knock-down of Mecr expression or a mitochondrial Acc1 variant involved in mtFAS (Monteuuis et al., 2017).
Figure 15.
Mitochondrial morphology in a primary neuron culture. A, Control cells display tubular mitochondrial morphology (bottom left, mitochondrial stain; bottom right, merged images). B, Mecr-KO cells were generated by transfection with lentivirus carrying Cre transgene and GFP. Mitochondria appear fragmented in those cells (bottom left, mitochondrial stain; bottom right, merged images). To determine transfection efficiency, both control and KO cell lines were expressing GFP. However, the GFP signal was very strong and consequently the images were processed with only red and blue channels. In each set of four images, clockwise from the top left image: anti-tubulin III stain (blue), cellular autofluorescence (pink/gray), all channels merged, and MitoTracker red only (red). Scale bar, 5 μm.
Discussion
mtFAS is essential for the function of mammalian cells (Hiltunen et al., 2010, Kastaniotis et al., 2017) and mouse embryonic development (Nair et al., 2017). The significance of this pathway is exemplified by a recent report on a neurodegenerative disease called MEPAN resulting from mutations in MECR (Heimer et al., 2016). The most conspicuous morphological change in the CNS of MEPAN patients are lesions in the basal ganglia. At least one copy of MECR in these individuals apparently encodes a partially functional MECR enzyme variant.
Our IHC evidence indicated that MECR protein is abundant in cerebellar PCs (Fig. 1A). To elucidate mtFAS functions in neurons, we generated a PC-specific conditional Mecr-KO mouse. Analysis of PCs of KO mice revealed reduction of MECR protein at 6 months of age. Because the Pcp2 promotor-driven Cre recombinase expression is active during the early postnatal period between P6 and P15 (Zhang et al., 2004), there is an apparent delay between Cre expression and the observed loss of MECR. Our data suggest that MECR is a very stable protein in mitochondria of postmitotic neuronal cells, leading to prolonged abundance of MECR even after inactivation of the Mecr gene, with a delayed onset of neurodegeneration as a consequence.
The decline in number of PCs in hematoxylin- and calbindin-immunostained sections of cerebellum was clearly detectable at 6 months of age in KO mice, with progression to complete disappearance by 9 months of age. The absence of hematoxylin-stained nuclei in the PC layer of 6- to 11-month-old KO mice confirmed that lack of calbindin immunolabeling was not due to diminished calbindin expression, but due to loss of PCs. Consistent with this observation, our visual assessment indicated that LA abundance at 6 months of age also varied in our IHC analyses, although we were unable to confirm a clear difference in MECR and LA fluorescence intensities between control and KO mice in our IF data. We propose that cell death may be rather rapid after falling below a certain threshold amount of MECR in PCs, impeding detection of differences.
mtFAS is intimately connected to mitochondrial respiration through multiple functions that extend beyond the role in lipoylation of E2 subunits of α-ketoacid dehydrogenases. For instance, respiration was reduced in mitochondria isolated from muscle tissue of mice in which the KO of mitochondrial malonyl-CoA transferase was induced (Smith et al., 2012). Furthermore, analysis of embryo homogenate from our fabI knock-in Mecr-KO model also displayed reduction in mitochondrial respiration (Nair et al., 2017) and acylated ACPs have been reported to serve as structural subunits of respiratory complex I (NADH dehydrogenase) (Zhu et al., 2015). Congruently, both complex I and succinate dehydrogenase (complex II) activities were decreased in Mecr-KO PCs. Loss of the acyl group on ACP associated with a loss of function serves as a possible explanation for the decrease in the complex activities that we observed in MECR-deficient PCs. However, the reduction in COX activity was mosaic in PCs from KO mice aged 6 months. Although we have been unable to establish a clear quantitative difference in MECR or lipoylation levels in PCs in KO cells that were still present at the age of 6 months compared with control mouse PCs, it is reasonable to speculate that the other respiratory chain activities may be more sensitive to a reduction of MECR protein than COX.
A recent study connects mtFAS to mitochondrial Fe–S cluster biogenesis via acyl-ACP (Van Vranken et al., 2016). A common feature of most of Fe–S cluster biogenesis defects is deficiencies in complex I, II, and III activities, which are frequently accompanied by reduction of the activity of aconitase, an Fe–S cluster-dependent Krebs cycle enzyme (Beilchmidt and Puccio, 2014). We were unable to confirm a general dysfunction of Fe–S cluster biogenesis in the Mecr KO PCs. Rather, the deficiency pattern in PCs of the Mecr-KO mice resemble findings in multiple mitochondrial dysfunction syndrome 1 (MMDS1) patients. MMDS 1 is caused by mutations in the LA synthase Fe–S cluster recycling factor NFU1 (McCarthy and Booker, 2017). Like in the PCs of our mutant mice, a decrease of respiratory chain complexes I-III in MMDS1 patient fibroblasts was reported, whereas aconitase activity was unaffected (Maio and Rouault, 2015).
The fragmented appearance of mitochondria in Mecr KO primary neurons is consistent with mitochondrial dysfunction before cell death (Cheung et al., 2007; Kim et al., 2007; Tatsuta and Langer, 2008; Westermann, 2010). However, our results were not supportive of a driving role of mitochondrial DNA loss in the loss of mitochondrial function in these cells. We were also unable to detect an indication of ongoing apoptosis in the PCs of these animals as a cause for cell death. It is noteworthy here that a number of previous studies describing neurodegeneration in mouse models could not conclude whether the cell death followed the apoptotic or the necrotic pathway (Sörensen et al., 2001; Quintana et al., 2010).
ROS generation occurs at 11 distinct mitochondrial sites and is frequently enhanced by respiratory chain defects (Wong et al., 2017). ROS are known to mediate neuronal cell death (Valencia and Morán, 2004; Niizuma et al., 2009). Our IHC analysis of the presence of two different oxidative stress markers, 8-isoprostane and nitrotyrosine, did not yield in any evidence for oxidative changes in cerebellar PCs in our mice. Previously, neuronal death without oxidative stress has been described in other mouse models of mitochondrial dysfunction (Sörensen et al., 2001) or mouse neuronal cultures (Kruse et al., 2008). Similar results were reported for cultured mouse fibroblasts (Kruse et al., 2008) or patient fibroblasts (Iuso et al., 2006). However, we cannot rule out that oxidative damage had occurred earlier during the course of PC deterioration, followed by rapid cell death, precluding detection of oxidative damage in the samples available to us, or that such an insult may occur later on in neurons lacking MECR.
Because PCs are the primary neurons responsible for coordination and fine tuning of movements, it is expected that loss or degeneration of PCs would results in ataxia (Girard et al., 2012; Meera et al., 2016), which is also true in mouse models (Sawada et al., 2009; Kageyama et al., 2012; Long et al., 2014; Lucas et al., 2014). In 9- and 11-month-old KO mice, PCs were increasingly scarce, consistent with the progressively impaired mobility and loss of balance. Interestingly, except for differences in body weight gain in both sexes and rearing time in males, controls and PC-specific Mecr KO mice were indistinguishable until 7 months of age, when the KO mice started to deviate progressively from the control mice in deterioration of motor coordination and balance. These observations are in agreement with the mitochondrial dysfunction and loss of continuity of PCs that we detected in 6-month-old KO mice. Vastly disparate ages for onset of motor coordination problems in different mouse models using this same Cre driver construct have been reported previously. For example, Sct KO mice develop symptoms at 2 months of age (Zhang et al., 2014), whereas in Pdss2 KO mice, the defect resulting from inactivation of the trans-prenyl diphosphate in ubiquinone synthase becomes apparent from the age of 9.5 months (Lu et al., 2012). Apart from the latter case, only one other study, concerning a Tfam KO from corticohippocampal region using a CaMKII Cre driver construct (Sörensen et al., 2001) reported a similar delayed phenotype for a Cre-mediated conditional KO in postmitotic neurons as we recorded for our Mecr KO in PCs. Our observation of two Mecr-KO mice with ataxia at least until 2 years of age indicates that PC loss is not fatal, despite marked cerebellar atrophy in these animals. In contrast, mortality has been previously reported for ataxic mouse models (Sawada et al., 2009; Kageyama et al., 2012; Long et al., 2014). The discrepancy between our study and previous reports on the viability of ataxia mouse models involving PC loss may be a reflection of an associated loss of vital function of other neurons leading to death of these mice.
In conclusion, we have generated an in situ mouse model to study the physiological role of mtFAS in postmitotic neurons. We show that loss of MECR leads to deficiency in mitochondrial respiratory activity and changes in mitochondrial structure. The changes in mitochondrial functions resulted in loss of PCs that contributed to ataxia and behavior changes. Our study provides a new model for cerebellar ataxia due to mitochondrial dysfunction and identifies the mtFAS pathway a plausible contributor of autosomal-recessive ataxia disorders in humans. Although our PC-specific KO mouse model cannot accurately recapitulate the MEPAN patient systemic mtFAS defect with residual MECR activity, the unique morphology and distribution of PCs and the reproducible onset and progression of ataxia in these mice provide a convenient and easy to follow phenotype. These mice may therefore serve as an mtFAS defect neurodegeneration model and provide a testbed for the cellular and behavioral study of the effects of treatment using metabolites counteracting the neurodegeneration phenotype.
Note Added in Proof: The seventh author Pekka Poutiainen was incorrectly not included in the Early Release version published September 28, 2018. The author information for this article is now correct.
Footnotes
This work was supported by the Academy of Finland, the Sigrid Jusélius Foundation, the Finnish Cultural Foundation, the European Regional Development Fund project A71429, and Biocenter Finland. We thank Raija Soininen for continuous support at various stages of this project and critical review of this manuscript; The Biocenter Oulu Transgenic Core facility, the Biocenter Oulu EM laboratory, and the Biocenter Oulu Virus Core laboratory, which are all part of Biocenter Finland, for support in generating mice, EM analysis, and lentivirus production, respectively; Dr. Pekka Poutiainen (Department of Clinical Physiology and Medicine, Kuopio University Hospital, Finland) for his contribution in obtaining the PET scans; Juha M. Kerätär for providing the Mecrtm1c strain for the project; Leena Ollitervo, Anna Sofia Kuusisto, Miriam Martens, Jessica Müller, and Belen Sintes Garcia for technical help with histology samples; Anna von Schaewen and Ujjwal Suwal for work on the quantitation of fluorescence image data; and Randy Woltjer (Oregon Health and Science University) for reviewing H&E-stained cerebellar sections. The project was funded by the Academy of Finland, the Sigrid Jusélius Foundation, Finnish Cultural Foundation, the European regional Development Fund project A71429, and Biocenter Finland.
The authors declare no competing financial interests.
References
- Almajan ER, Richter R, Paeger L, Martinelli P, Barth E, Decker T, Larsson NG, Kloppenburg P, Langer T, Rugarli EI (2012) AFG3L2 supports mitochondrial protein synthesis and Purkinje cell survival. J Clin Invest 122:4048–4058. 10.1172/JCI64604 [DOI] [PMC free article] [PubMed] [Google Scholar]
- Angerer H. (2015) Eukaryotic LYR proteins interact with mitochondrial protein complexes. Biology 4:133–150. 10.3390/biology4010133 [DOI] [PMC free article] [PubMed] [Google Scholar]
- Beilschmidt LK, Puccio HM (2014) Mammalian Fe–S cluster biogenesis and its implication in disease. Biochimie 100:48–60. 10.1016/j.biochi.2014.01.009 [DOI] [PubMed] [Google Scholar]
- Brody S, Oh C, Hoja U, Schweizer E (1997) Mitochondrial acyl carrier protein is involved in lipoic acid synthesis in saccharomyces cerevisiae. FEBS Lett 408:217–220. 10.1016/S0014-5793(97)00428-6 [DOI] [PubMed] [Google Scholar]
- Carroll J, Fearnley IM, Shannon RJ, Hirst J, Walker JE (2003) Analysis of the subunit composition of complex I from bovine heart mitochondria. Mol Cell Proteomics 2:117–126. 10.1074/mcp.M300014-MCP200 [DOI] [PubMed] [Google Scholar]
- Cattavarayane S, Palovuori R, Tanjore Ramanathan J, Manninen A (2015) alpha6beta1- and alphaV-integrins are required for long-term self-renewal of murine embryonic stem cells in the absence of LIF. BMC Cell Biol 16:3. 10.1186/s12860-015-0051-y [DOI] [PMC free article] [PubMed] [Google Scholar]
- Chen Z, Leskinen H, Liimatta E, Sormunen RT, Miinalainen IJ, Hassinen IE, Hiltunen JK (2009) Myocardial overexpression of Mecr, a gene of mitochondrial FAS II leads to cardiac dysfunction in mouse. PLoS One 4:e5589. 10.1371/journal.pone.0005589 [DOI] [PMC free article] [PubMed] [Google Scholar]
- Cheung EC, McBride HM, Slack RS (2007) Mitochondrial dynamics in the regulation of neuronal cell death. Apoptosis 12:979–992. 10.1007/s10495-007-0745-5 [DOI] [PubMed] [Google Scholar]
- Cory SA, Van Vranken JG, Brignole EJ, Patra S, Winge DR, Drennan CL, Rutter J, Barondeau DP (2017) Structure of human Fe–S assembly subcomplex reveals unexpected cysteine desulfurase architecture and acyl-ACP-ISD11 interactions. Proc Natl Acad Sci U S A 114:E5325–E5334. 10.1073/pnas.1702849114 [DOI] [PMC free article] [PubMed] [Google Scholar]
- Delatycki MB, Williamson R, Forrest SM (2000) Friedreich ataxia: an overview. J Med Genet 37:1–8. 10.1136/jmg.37.1.1 [DOI] [PMC free article] [PubMed] [Google Scholar]
- Furuya S, Makino A, Hirabayashi Y (1998) An improved method for culturing cerebellar Purkinje cells with differentiated dendrites under a mixed monolayer setting. Brain Res Brain Res Protoc 3:192–198. 10.1016/S1385-299X(98)00040-3 [DOI] [PubMed] [Google Scholar]
- Ghavami S, Hashemi M, Ande SR, Yeganeh B, Xiao W, Eshraghi M, Bus CJ, Kadkhoda K, Wiechec E, Halayko AJ, Los M (2009) Apoptosis and cancer: mutations within caspase genes. J Med Genet 46:497–510. 10.1136/jmg.2009.066944 [DOI] [PubMed] [Google Scholar]
- Girard M, Larivière R, Parfitt DA, Deane EC, Gaudet R, Nossova N, Blondeau F, Prenosil G, Vermeulen EG, Duchen MR, Richter A, Shoubridge EA, Gehring K, McKinney RA, Brais B, Chapple JP, McPherson PS (2012) Mitochondrial dysfunction and Purkinje cell loss in autosomal recessive spastic ataxia of charlevoix-saguenay (ARSACS). Proc Natl Acad Sci U S A 109:1661–1666. 10.1073/pnas.1113166109 [DOI] [PMC free article] [PubMed] [Google Scholar]
- Heimer G, et al. (2016) MECR mutations cause childhood-onset dystonia and optic atrophy, a mitochondrial fatty acid synthesis disorder. Am J Hum Genet 99:1229–1244. 10.1016/j.ajhg.2016.09.021 [DOI] [PMC free article] [PubMed] [Google Scholar]
- Hiltunen JK, Chen Z, Haapalainen AM, Wierenga RK, Kastaniotis AJ (2010) Mitochondrial fatty acid synthesis–an adopted set of enzymes making a pathway of major importance for the cellular metabolism. Prog Lipid Res 49:27–45. 10.1016/j.plipres.2009.08.001 [DOI] [PubMed] [Google Scholar]
- Iuso A, Scacco S, Piccoli C, Bellomo F, Petruzzella V, Trentadue R, Minuto M, Ripoli M, Capitanio N, Zeviani M, Papa S (2006) Dysfunctions of cellular oxidative metabolism in patients with mutations in the NDUFS1 and NDUFS4 genes of complex I. J Biol Chem 281:10374–10380. 10.1074/jbc.M513387200 [DOI] [PubMed] [Google Scholar]
- Johri A, Beal MF (2012) Mitochondrial dysfunction in neurodegenerative diseases. J Pharmacol Exp Ther 342:619–630. 10.1124/jpet.112.192138 [DOI] [PMC free article] [PubMed] [Google Scholar]
- Jung C, Higgins CM, Xu Z (2002) A quantitative histochemical assay for activities of mitochondrial electron transport chain complexes in mouse spinal cord sections. J Neurosci Methods 114:165–172. [DOI] [PubMed] [Google Scholar]
- Kageyama Y, Zhang Z, Roda R, Fukaya M, Wakabayashi J, Wakabayashi N, Kensler TW, Reddy PH, Iijima M, Sesaki H (2012) Mitochondrial division ensures the survival of postmitotic neurons by suppressing oxidative damage. J Cell Biol 197:535–551. 10.1083/jcb.201110034 [DOI] [PMC free article] [PubMed] [Google Scholar]
- Kastaniotis AJ, Autio KJ, Sormunen RT, Hiltunen JK (2004) Htd2p/Yhr067p is a yeast 3-hydroxyacyl-ACP dehydratase essential for mitochondrial function and morphology. Mol Microbiol 53:1407–1421. 10.1111/j.1365-2958.2004.04191.x [DOI] [PubMed] [Google Scholar]
- Kastaniotis AJ, Autio KJ, Kerätär JM, Monteuuis G, Mäkelä AM, Nair RR, Pietikäinen LP, Shvetsova A, Chen Z, Hiltunen JK (2017) Mitochondrial fatty acid synthesis, fatty acids and mitochondrial physiology. Biochim Biophys Acta Mol Cell Biol Lipids 1862:39–48. 10.1016/j.bbalip.2016.08.011 [DOI] [PubMed] [Google Scholar]
- Kim I, Rodriguez-Enriquez S, Lemasters JJ (2007) Selective degradation of mitochondria by mitophagy. Arch Biochem Biophys 462:245–253. 10.1016/j.abb.2007.03.034 [DOI] [PMC free article] [PubMed] [Google Scholar]
- Konzack A, Jakupovic M, Kubaichuk K, Görlach A, Dombrowski F, Miinalainen I, Sormunen R, Kietzmann T (2015) Mitochondrial dysfunction due to lack of manganese superoxide dismutase promotes hepatocarcinogenesis. Antioxid Redox Signal 23:1059–1075. 10.1089/ars.2015.6318 [DOI] [PMC free article] [PubMed] [Google Scholar]
- Kruse SE, Watt WC, Marcinek DJ, Kapur RP, Schenkman KA, Palmiter RD (2008) Mice with mitochondrial complex I deficiency develop a fatal encephalomyopathy. Cell Metab 7:312–320. 10.1016/j.cmet.2008.02.004 [DOI] [PMC free article] [PubMed] [Google Scholar]
- Kursu VA, Pietikäinen LP, Fontanesi F, Aaltonen MJ, Suomi F, Raghavan Nair R, Schonauer MS, Dieckmann CL, Barrientos A, Hiltunen JK, Kastaniotis AJ (2013) Defects in mitochondrial fatty acid synthesis result in failure of multiple aspects of mitochondrial biogenesis in saccharomyces cerevisiae. Mol Microbiol 90:824–840. 10.1111/mmi.12402 [DOI] [PMC free article] [PubMed] [Google Scholar]
- Li JY, Popovic N, Brundin P (2005) The use of the R6 transgenic mouse models of huntington's disease in attempts to develop novel therapeutic strategies. Neurorx 2:447–464. 10.1602/neurorx.2.3.447 [DOI] [PMC free article] [PubMed] [Google Scholar]
- Long C, Grueter CE, Song K, Qin S, Qi X, Kong YM, Shelton JM, Richardson JA, Zhang CL, Bassel-Duby R, Olson EN (2014) Ataxia and Purkinje cell degeneration in mice lacking the CAMTA1 transcription factor. Proc Natl Acad Sci U S A 111:11521–11526. 10.1073/pnas.1411251111 [DOI] [PMC free article] [PubMed] [Google Scholar]
- Lu S, Lu LY, Liu MF, Yuan QJ, Sham MH, Guan XY, Huang JD (2012) Cerebellar defects in Pdss2 conditional knockout mice during embryonic development and in adulthood. Neurobiol Dis 45:219–233. 10.1016/j.nbd.2011.08.006 [DOI] [PubMed] [Google Scholar]
- Lucas EK, Reid CS, McMeekin LJ, Dougherty SE, Floyd CL, Cowell RM (2014) Cerebellar transcriptional alterations with Purkinje cell dysfunction and loss in mice lacking PGC-1alpha. Front Cell Neurosci 8:441. 10.3389/fncel.2014.00441 [DOI] [PMC free article] [PubMed] [Google Scholar]
- Maio N, Rouault TA (2015) Iron-sulfur cluster biogenesis in mammalian cells: new insights into the molecular mechanisms of cluster delivery. Biochim Biophys Acta 1853:1493–1512. 10.1016/j.bbamcr.2014.09.009 [DOI] [PMC free article] [PubMed] [Google Scholar]
- McCarthy EL, Booker SJ (2017) Destruction and reformation of an iron-sulfur cluster during catalysis by lipoyl synthase. Science 358:373–377. 10.1126/science.aan4574 [DOI] [PMC free article] [PubMed] [Google Scholar]
- Meera P, Pulst SM, Otis TS (2016) Cellular and circuit mechanisms underlying spinocerebellar ataxias. J Physiol 594:4653–4660. 10.1113/JP271897 [DOI] [PMC free article] [PubMed] [Google Scholar]
- Miinalainen IJ, Chen ZJ, Torkko JM, Pirilä PL, Sormunen RT, Bergmann U, Qin YM, Hiltunen JK (2003) Characterization of 2-enoyl thioester reductase from mammals. an ortholog of YBR026p/MRF1′p of the yeast mitochondrial fatty acid synthesis type II. J Biol Chem 278:20154–20161. 10.1074/jbc.M302851200 [DOI] [PubMed] [Google Scholar]
- Monteuuis G, Suomi F, Kerätär JM, Masud AJ, Kastaniotis AJ (2017) A conserved mammalian mitochondrial isoform of acetyl-CoA carboxylase ACC1 provides the malonyl-CoA essential for mitochondrial biogenesis in tandem with ACSF3. Biochem J 474:3783–3797. 10.1042/BCJ20170416 [DOI] [PubMed] [Google Scholar]
- Moreira PI, Carvalho C, Zhu X, Smith MA, Perry G (2010) Mitochondrial dysfunction is a trigger of alzheimer's disease pathophysiology. Biochim Biophys Acta 1802:2–10. 10.1016/j.bbadis.2009.10.006 [DOI] [PubMed] [Google Scholar]
- Müller-Höcker J, Schäfer S, Li K (2001) Immunocytochemical localization of mitochondrial single-stranded DNA-binding protein in mitochondria-rich cells of normal and neoplastic human tissue. Appl Immunohistochem Mol Morphol 9:276–280. [DOI] [PubMed] [Google Scholar]
- Nair RR, Kerätär JM, Autio KJ, Masud AJ, Finnilä MA, Autio-Harmainen HI, Miinalainen IJ, Nieminen PA, Hiltunen KJ, Kastaniotis AJ (2017) Genetic modifications of Mecr reveal a role for mitochondrial 2-enoyl-CoA/ACP reductase in placental development in mice. Hum Mol Genet 26:2104–2117. 10.1093/hmg/ddx105 [DOI] [PubMed] [Google Scholar]
- Niizuma K, Endo H, Chan PH (2009) Oxidative stress and mitochondrial dysfunction as determinants of ischemic neuronal death and survival. J Neurochem 109:133–138. 10.1111/j.1471-4159.2009.05897.x [DOI] [PMC free article] [PubMed] [Google Scholar]
- Quintana A, Kruse SE, Kapur RP, Sanz E, Palmiter RD (2010) Proc Natl Acad Sci U S A. 107:10996–11001. 10.1073/pnas.1006214107 [DOI] [PMC free article] [PubMed] [Google Scholar]
- Quintanilla RA, Johnson GV (2009) Role of mitochondrial dysfunction in the pathogenesis of huntington's disease. Brain Res Bull 80:242–247. 10.1016/j.brainresbull.2009.07.010 [DOI] [PMC free article] [PubMed] [Google Scholar]
- Salvesen GS. (2002) Caspases: opening the boxes and interpreting the arrows. Cell Death Differ 9:3–5. 10.1038/sj.cdd.4400963 [DOI] [PubMed] [Google Scholar]
- Sawada K, Kalam Azad A, Sakata-Haga H, Lee NS, Jeong YG, Fukui Y (2009) Striking pattern of Purkinje cell loss in cerebellum of an ataxic mutant mouse, tottering. Acta Neurobiol Exp (Wars) 69:138–145. [DOI] [PubMed] [Google Scholar]
- Slot JW, Geuze HJ (1985) A new method of preparing gold probes for multiple-labeling cytochemistry. Eur J Cell Biol 38:87–93. [PubMed] [Google Scholar]
- Smith S, et al. (2012) Compromised mitochondrial fatty acid synthesis in transgenic mice results in defective protein lipoylation and energy disequilibrium. PLoS One 7:e47196. 10.1371/journal.pone.0047196 [DOI] [PMC free article] [PubMed] [Google Scholar]
- Sörensen L, Ekstrand M, Silva JP, Lindqvist E, Xu B, Rustin P, Olson L, Larsson NG (2001) Late-onset corticohippocampal neurodepletion attributable to catastrophic failure of oxidative phosphorylation in MILON mice. J Neurosci 21:8082–8090. 10.1523/JNEUROSCI.21-20-08082.2001 [DOI] [PMC free article] [PubMed] [Google Scholar]
- Stuible HP, Meier S, Wagner C, Hannappel E, Schweizer E (1998) A novel phosphopantetheine: protein transferase activating yeast mitochondrial acyl carrier protein. J Biol Chem 273:22334–22339. 10.1074/jbc.273.35.22334 [DOI] [PubMed] [Google Scholar]
- Tabata T, Sawada S, Araki K, Bono Y, Furuya S, Kano M (2000) A reliable method for culture of dissociated mouse cerebellar cells enriched for purkinje neurons. J Neurosci Methods 104:45–53. 10.1016/S0165-0270(00)00323-X [DOI] [PubMed] [Google Scholar]
- Tatsuta T, Langer T (2008) Quality control of mitochondria: protection against neurodegeneration and ageing. EMBO J 27:306–314. 10.1038/sj.emboj.7601972 [DOI] [PMC free article] [PubMed] [Google Scholar]
- Valencia A, Morán J (2004) Reactive oxygen species induce different cell death mechanisms in cultured neurons. Free Radic Biol Med 36:1112–1125. 10.1016/j.freeradbiomed.2004.02.013 [DOI] [PubMed] [Google Scholar]
- Van Vranken JG, Jeong MY, Wei P, Chen YC, Gygi SP, Winge DR, Rutter J (2016) The mitochondrial acyl carrier protein (ACP) coordinates mitochondrial fatty acid synthesis with iron sulfur cluster biogenesis. Elife 5:e17828. 10.7554/eLife.17828 [DOI] [PMC free article] [PubMed] [Google Scholar]
- Van Vranken JG, Nowinski SM, Clowers KJ, Jeong MY, Ouyang Y, Berg JA, Gygi JP, Gygi SP, Winge DR, Rutter J (2018) ACP acylation is an acetyl-CoA-dependent modification required for electron transport chain assembly. Mol Cell 71:567–580.e4. 10.1016/j.molcel.2018.06.039 [DOI] [PMC free article] [PubMed] [Google Scholar]
- Westermann B. (2010) Mitochondrial fusion and fission in cell life and death. Nat Rev Mol Cell Biol 11:872–884. 10.1038/nrm3013 [DOI] [PubMed] [Google Scholar]
- Winklhofer KF, Haass C (2010) Mitochondrial dysfunction in parkinson's disease. Biochim Biophys Acta 1802:29–44. 10.1016/j.bbadis.2009.08.013 [DOI] [PubMed] [Google Scholar]
- Wong HS, Dighe PA, Mezera V, Monternier PA, Brand MD (2017) Production of superoxide and hydrogen peroxide from specific mitochondrial sites under different bioenergetic conditions. J Biol Chem 292:16804–16809. 10.1074/jbc.R117.789271 [DOI] [PMC free article] [PubMed] [Google Scholar]
- Zeviani M, Simonati A, Bindoff LA (2012) Ataxia in mitochondrial disorders. Handb Clin Neurol 103:359–372. 10.1016/B978-0-444-51892-7.00022-X [DOI] [PubMed] [Google Scholar]
- Zhang L, Chung SK, Chow BK (2014) The knockout of secretin in cerebellar Purkinje cells impairs mouse motor coordination and motor learning. Neuropsychopharmacology 39:1460–1468. 10.1038/npp.2013.344 [DOI] [PMC free article] [PubMed] [Google Scholar]
- Zhang XM, Ng AH, Tanner JA, Wu WT, Copeland NG, Jenkins NA, Huang JD (2004) Highly restricted expression of cre recombinase in cerebellar Purkinje cells. Genesis 40:45–51. 10.1002/gene.20062 [DOI] [PubMed] [Google Scholar]
- Zhu J, King MS, Yu M, Klipcan L, Leslie AG, Hirst J (2015) Structure of subcomplex Iβ of mammalian respiratory complex I leads to new supernumerary subunit assignments. Proc Natl Acad Sci U S A 112:12087–12092. 10.1073/pnas.1510577112 [DOI] [PMC free article] [PubMed] [Google Scholar]


