

Abstract
Fan cells in layer II of the lateral entorhinal cortex (LEC) form a main component of the projection to the dentate gyrus, CA3 and CA2 of the hippocampal formation. This projection has a counterpart originating from stellate cells in layer II of the medial entorhinal cortex (MEC). Available evidence suggests that the two pathways carry different information, exemplified by a difference in spatial tuning of cells in LEC and MEC. The grid cell, a prominent position-modulated cell type present in MEC, has been postulated to derive its characteristic hexagonal firing pattern from dominant disynaptic inhibitory connections between hippocampal-projecting stellate cells. Given that grid cells have not been described in LEC, we aim to describe the local synaptic connectivity of fan cells, to explore whether the network architecture is similar to that of the MEC stellate cell. Using a combination of in vitro multicell electrophysiological and optogenetic approaches in acute slices from rodents of either sex, we show that excitatory connectivity between fan cells is very sparse. Fan cells connect preferentially with two distinct types of inhibitory interneurons, suggesting disynaptic inhibitory coupling as the main form of communication among fan cells. These principles are similar to those reported for stellate cells in MEC, indicating an overall comparable local circuit architecture of the main hippocampal-projecting cell types in the lateral and medial entorhinal cortex.
SIGNIFICANCE STATEMENT Our data provide the first description of the synaptic microcircuit of hippocampal-projecting layer II cells in the lateral entorhinal cortex. We show that these cells make infrequent monosynaptic connections with each other, and that they preferentially communicate through a disynaptic inhibitory network. This is similar to the microcircuit of hippocampal-projecting stellate cells in layer II of the medial entorhinal cortex, but dissimilar to the connectivity observed in layer 2 of neocortex. In medial entorhinal cortex, the observed network structure has been proposed to underlie the firing pattern of grid cells. This opens the possibility that layer II cells in lateral entorhinal cortex exhibit regular firing patterns in an unexplored domain.
Keywords: hippocampal projecting neuron, intralaminar connectivity, parahippocampal region, principal neuron, reelin-positive neuron
Introduction
The entorhinal cortex (EC) has a pivotal position in the hippocampal-parahippocampal episodic memory system, serving as the main gateway for information entering the hippocampal formation (HF). EC connects to HF through parallel pathways mediated by the lateral (LEC) and medial (MEC) entorhinal subdivisions (Knierim et al., 2014; Cappaert et al., 2015; Knierim, 2015). These input streams point to functionally distinct and potentially complementary roles for LEC and MEC in hippocampal function (Keene et al., 2016), a notion supported by numerous in vivo studies (Fyhn et al., 2004; Hafting et al., 2005; Hargreaves et al., 2005; Van Cauter et al., 2008, 2013; Lu et al., 2013; Tsao et al., 2013). LEC is involved in encoding contextual information (Wilson et al., 2013; Pilkiw et al., 2017), demonstrated by the ability of cell ensembles to represent time across different contexts (Tsao et al., 2018), or by single cells to represent the past or present position of objects (Deshmukh and Knierim, 2011; Tsao et al., 2013). In contrast, MEC contains elements of the brain's navigational circuit, including grid (Hafting et al., 2005), object-vector (Hoydal et al., 2018), head-direction (Sargolini et al., 2006), border (Solstad et al., 2008), and speed cells (Kropff et al., 2015), collectively supplying HF with context-invariant information signaling the animal's trajectory.
Consistent with distinct functional specializations is the discovery of different embryological origins of LEC and MEC. LEC originates from caudal parts of the dorsolateral pallium, whereas MEC derives from the medial pallium (Medina et al., 2017). Hence, these areas might conceivably have developed cells and local circuitries that perform different computations to shape information represented and relayed to HF. The layer II (LII) projection to HF arises mainly from two reelin-positive (RE+) cell types, the MEC stellate cell and the LEC fan cell (Germroth et al., 1989; Varga et al., 2010; Kitamura et al., 2014; Leitner et al., 2016). These cells have different dendritic morphologies and biophysical membrane properties (Canto and Witter, 2012a,b), indicating distinctive integrative capacities of the two cell types.
The connectivity between MEC stellate cells has been emphasized as a plausible mechanism supporting the grid pattern, characterized by multiple firing fields arranged in a hexagonal lattice spanning the entire environment explored by the animal (Hafting et al., 2005). One influential class of models predicts this salient activity pattern to arise through attractor dynamics (Fuhs and Touretzky, 2006; McNaughton et al., 2006; Guanella et al., 2007; Burak and Fiete, 2009), achieved by the prevailing disynaptic inhibitory connectivity of stellate cells (Bonnevie et al., 2013; Couey et al., 2013; Pastoll et al., 2013). A detailed description of the local synaptic circuitry of LEC fan cells is lacking.
If grid activity in MEC LII arises due to inhibitory functional connections between stellate cells, the lack of grid cells in LEC (Hargreaves et al., 2005; Yoganarasimha et al., 2011) implies the presence of a principal cell local network architecture governed by different principles. Hence, fan cells, the likely LEC analog of stellate cells, may depend more on excitatory connectivity. This interpretation is strengthened by their different developmental origins, where LEC appears more different from MEC than the neocortex (Medina et al., 2017), an area with higher probability of local principal cell connectivity in layer 2 than MEC (Lefort et al., 2009; Jouhanneau et al., 2015; Seeman et al., 2018). To test our hypothesis, we did in vitro multicell patch-clamp recordings to probe connectivity between fan cells. Disproving our hypothesis, we report that monosynaptic connectivity between fan cells is sparse, and that they preferentially interact with two of three distinct types of inhibitory interneurons. Using optogenetic methods, we substantiate these findings by demonstrating that fan cells receive predominant disynaptic inhibitory inputs, and limited excitatory inputs, arising from the activation of RE+ LII principal cells. Our data indicate that the microcircuitry of fan cells in LII of LEC shows a network motif similar to that described previously for stellate cells in MEC.
Materials and Methods
Animals
All animals were group housed with up to 5 animals in one cage, kept at a 12:12 h reversed day/night cycle, and had ad libitum access to food and water. Long–Evans rats (postnatal age 23–25 d, n = 2; postnatal age 28–80 d, n = 47) and C57BL/6N mice (postnatal age 42–47 d, n = 4) were used for whole-cell current-clamp recordings. Mice of the transgenic MEC13-53A enhancer strain (postnatal age 84–112 d) were used for whole-cell voltage-clamp recordings (n = 15 mice) and histological assessment of LEC transgene expression (n = 8 mice). All experiments were approved by the local ethics committee and were in accordance with the European Communities Council Directive and the Norwegian Experiments on Animals Act.
Preparation of MEC13–53A mice
Cloning of transgenic constructs and pronuclear injection.
The enhancer sequence (coordinate mouse genome: chr8:49,906,388-49,908,569 in mm9) was cloned from BACs (www.chori.org) and transferred to pENTRtm/D-TOPO vectors by TOPO cloning (Invitrogen, K2400-20). The enhancer was transferred to an injection plasmid by gateway cloning (Invitrogen, 11791-019). The resulting injection plasmid consisted of a putative enhancer followed by a mutated heatshock promoter 68 (HSP68), a tetracycline-controlled transcriptional activation (tTA) gene, a synthetic intron, and a WPRE element. The injection plasmid was linearized by enzyme digestion with XmnI and EcoRV to keep the relevant elements but remove the bacterial elements of the plasmids. Linearized vector of 7.5 K bp was run on a 1% agarose gel and isolated using a Zymoclean Gel DNA Recovery Kit (Zymo Research, D4001). Fertilized egg cells were injected with 1 μl of DNA at concentrations of 1 ng/μl, leading to pups 18 of which were genotypically positive and 6 of which expressed the transgene in the EC (Blankvoort et al., 2018). Pronuclear injections were done in the transgenic mouse facility of the University of Oregon.
Genotyping.
Genotyping was done on ear tissue using a Kapa mouse genotyping kit (Kapa Biosystems, catalog #KK7302). Primer pairs for tTA (5′-GGACAAGTCCAAGGTGATCAAC-3′ and 5′-CTGGTGGTCGAACAGCTCG-3′, 591 bp product) and internal controls (5′-CTAGGCCACAGAATTGAAAGATCT-3′ and 5′-TAGGTGGAAATTCTAGCATCATCC-3′, 324 bp product) were added to the PCR mixture at a final concentration of 10 μm. The PCR was done by an initial step of 4 min at 95°C, then 20 cycles of 1 min at 95°C, 30 s at 70°C reduced by 0.5°C each cycle, and 30 s at 72°C. This was followed by 20 cycles of 30 s at 95°C, 30 s at 60°C, and 30 s at 72°C, then a final 7 min step at 72°C. The products were run on a 1% agarose gel along with positive and negative controls.
Adeno-associated virus (AAV)-TRE-tight-oChIEF-Citrine purification
Creation of pAAV-TRE-tight-WPRE was achieved by replacing the chimeric CMV-promoter/β-globin intron sequence of pAAV-CMV-βglobin-intron-MCS-WPRE (Agilent) by the TRE-tight promoter from pTRE-tight vector (Clontech). Transgene oChIEF-Citrine was PCR amplified from plasmid #50974 (Addgene) and cloned into the plasmid pAAV-TRE-tight-MCS-WPRE, which resulted in pAAV-TRE-tight-oChIEF-Citrine-WPRE. The positive clones were confirmed by restriction digestion analyses and subsequently by DNA sequencing. Endotoxin-free plasmid maxipreps (QIAGEN) were made for AAV preparations. The day before transfection, 7 × 10⁶ AAV 293 cells were seeded in DMEM containing 10% FBS (Thermo Fisher Scientific) and pencillin/streptomycin antibiotics into a 150 mm cell culture plate. Calcium chloride-mediated cotransfection was done with 22.5 μg pAAV-containing the transgene, 22.5 μg pHelper, 11.3 μg pRC, 11.3 μg of either pXR1 or pAAV9 capsid plasmid. After 7 h, the medium was replaced by fresh 10% FBS containing DMEM. The cells were scraped out after 72 h, then centrifuged at 200 × g, and the cell pellet was subjected to lysis using 150 mm NaCl-20 mm Tris, pH 8:0, buffer containing 10% sodium deoxycholate. The lysate was then treated with Benzonase nuclease HC (Millipore) for 45 min at 37°C. Benzonase-treated lysate was centrifuged at 3000 × g for 15 min, and the clear supernatant was then subjected to HiTrap Heparin High Performance (GE Healthcare) affinity column chromatography using a peristaltic pump (McClure C JOVE 2011). The elute from the Heparin column was then concentrated using Amicon Ultra centrifugal filters (Millipore). The titer of the viral stock was determined as ∼107 infectious particles/ml.
Acute slice preparation
Rats or mice of either sex were deeply anesthetized with isoflurane and decapitated. The brain was quickly removed and immersed in cold (0°C) oxygenated (95% O2/5% CO2) ACSF containing 110 mm choline chloride, 2.5 mm KCl, 25 mm d-glucose, 25 mm NaHCO3, 11.5 mm sodium ascorbate, 3 mm sodium pyruvate, 1.25 mm NaH2PO4, 100 mm d-mannitol, 7 mm MgCl2, and 0.5 mm CaCl2, pH 7.4, 430 mOsm. The brain hemispheres were subsequently separated and 400-μm-thick semicoronal slices containing the lateral entorhinal cortex were cut with a vibrating slicer (Leica VT1000S, Leica Biosystems). The slices were cut with an angle of 20° with respect to the coronal plane to optimally preserve neurons and local connections (Tahvildari and Alonso, 2005; Canto and Witter, 2012a). Slices were moved to a holding chamber and incubated at 35°C in oxygenated ASCF containing 126 mm NaCl, 3 mm KCl, 1.2 mm Na2HPO4, 10 mm d-glucose, 26 mm NaHCO3, 3 mm MgCl2, and 0.5 mm CaCl2 for 30 min and then kept at room temperature for at least 30 min before use.
Multicell current-clamp recordings
Cells were visualized using infrared differential interference contrast optics on two different patch-clamp setups, either with a 40×/0.8 NA water-immersion (WI) objective (Olympus BX51WI) or 20×/1.0 NA WI objective (Carl Zeiss Axio Examiner.D1, Carl Zeiss). Groups of LII cells located deeper than 50 μm in the slice were selected for recording. Patch pipettes (3–8 mΩ) were pulled from standard wall borosilicate glass capillaries and filled with intracellular solution containing 120 mm K-gluconate, 10 mm KCl, 10 mm Na2-phosphocreatine, 10 mm HEPES, 4 mm Mg-ATP, 0.3 mm Na-GTP, with pH adjusted to 7.3 and osmolality to 300–305 mOsm. Biocytin-HCl (0.5%, Sigma-Aldrich) was added to the pipette solution for recovery of neuronal morphology. In a subset of experiments, different spectral variants of AlexaFluor dyes (405, 488, 568, 633; Invitrogen, Thermo Fisher Scientific) was included in the individual pipettes instead of biocytin. Chloride reversal potentials were −47.0 mV for the internal solution with biocytin-HCl, and −69.10 mV for the internal solution with AlexaFluor dyes, calculated using the Nernst equation. All recordings were performed at 35°C, and the slices were continuously superfused with oxygenated ACSF containing 126 mm NaCl, 3 mm KCl, 1.2 mm Na2HPO4, 10 mm d-glucose, 26 mm NaHCO3 1.5 mm MgCl2, and 1.6 mm CaCl2.
Data acquisition and analysis
Whole-cell current-clamp recordings with one rig were acquired with two Multiclamp 700 A/B amplifiers (Molecular Devices) with a sampling rate of 10 kHz and digitized with an ITC-1600 A/D board (HEKA Elektronik). Data acquisition was controlled by custom-written protocols in Igor Pro (WaveMetrics). Whole-cell current-clamp recordings on the second rig were collected with an EPC 10 Quadro USB amplifier, controlled by the acquisition software Patchmaster (HEKA Elektronik). Acquired data were low pass Bessel filtered at 4 kHz and digitized at 10 kHz. For all recordings, pipette capacitance was compensated and online bridge adjustments were performed (series resistance: median, 16 mΩ; 25th-75th percentiles, 10–25 mΩ). Membrane potentials were not corrected for the liquid junction potential (15.8 mV for the potassium-based internal solution, calculated using the junction potential calculator (JPCalc) plugin in pCLAMP (Molecular Devices). Synaptic connectivity was tested by inducing spike trains at various frequencies (10, 20, 40, and 70 Hz) sequentially in each individual cell and simultaneously monitoring the membrane potential of the other cells (Couey et al., 2013). Cells were recorded and connectivity tested at their native resting potentials (median, −70.25 mV; 25th-75th percentiles, −73.38 to −67.0 mV), but in rare cases stabilized with negative current to prevent spontaneous firing of action potentials (APs). Possible disynaptic interactions were tested by activating two or three cells simultaneously and recording the membrane potential of the last unstimulated cell. The connectivity protocol was repeated up to 20 times. Possible connections were scrutinized during recording and later during analysis. Connections were accepted if their amplitudes evoked by 70 Hz stimulation were >2.5 times the median of absolute deviations from the median (2.5 × MAD). MAD is defined as follows: MAD = median(|Xi − median(X)|). To be considered a synaptic connection evoked specifically by stimulation of one of the other cells, the membrane potential deflection needed to occur within the time window where the presynaptic cell was active. All cells with resting membrane potential <−55 mV were screened for synaptic connections. Possible postsynaptic responses were analyzed by computing average membrane potential traces from 5 to 20 individual sweeps for each presynaptic stimulation protocol (10, 20, 40, 70 Hz). Because of a low S/N ratio of the small amplitude synaptic potentials in single sweeps, the averages were used to calculate synaptic latency, amplitude, latency to peak, and half-width. Postsynaptic potential (PSP) amplitude was extracted from the deflection in response to the first AP in the 10 Hz presynaptic train (single stimulus), as well as the peak of the postsynaptic membrane deflection following a presynaptic 70 Hz AP train. The amplitude was defined as the potential difference between PSP peak and baseline potential (baseline measured as the average potential of a 50 ms interval immediately before the onset of presynaptic stimulation). PSP latency was calculated from the first PSP in response to 10 Hz presynaptic stimulation, and defined as the time interval between the peak of the averaged first presynaptic AP to the onset of PSP. The onset of PSP was defined as the point where the PSP had reached 15% amplitude. Conducting the PSP analyses on the average trace precluded an investigation of the variability in onset times between trials, a feature important to assess monosynapticity (Feldmeyer et al., 1999; Koelbl et al., 2015). Therefore, we defined PSPs with latencies <3 ms evoked in pairs of excitatory cells as presumed monosynaptic (Peng et al., 2017). All connections in pairs of excitatory cells with longer latencies were classified as putative polysynaptic connections. In synaptically coupled cell pairs in which the shape of the presynaptic AP was distorted due to high (>40 mΩ) access resistance, the connection was defined as unclassifiable. PSP half-width was defined as the time difference between rising phase and falling phase of the PSP measured at 50% PSP amplitude. PSP latency to peak represented the time difference between peak of the presynaptic AP and the peak of the PSP. Intrinsic membrane properties were measured from membrane voltage responses to step injections of hyperpolarizing and depolarizing current (500 ms duration, −400 pA to 500 pA, 100 pA increments, 3 s interpulse interval). Relevant intrinsic membrane properties were calculated for cells with series resistance <25 mΩ, and included AP half-width, maximum AP firing rate, sag ratio, rebound potential, and input resistance. AP half-width was defined as the time difference between the rise and decay phase measured at 50% amplitude of the first elicited AP. AP amplitude was calculated as the difference in voltage between the AP peak and threshold, defined as the point where the voltage strongly accelerates from rest (Sekerli et al., 2004). The maximum AP firing rate observed during depolarizing current step stimuli (100–500 pA) was defined as the maximum AP rate of the cell. The sag ratio was calculated from the −300 pA current sweep as the ratio between steady state and maximum membrane voltage deflection. Rebound potential was defined as the difference between baseline and the maximal depolarizing voltage deflection immediately following the strongest hyperpolarizing current sweep. Input resistance was estimated by taking the voltage deflection between baseline and steady state during the weakest hyperpolarizing current, divided by the injected current (Ohm's law: R = V/I). Data analysis was performed in Igor Pro and using custom written scripts in MATLAB (The MathWorks). Recorded interneurons were categorized into three main groups. This classification was performed by doing a k-means cluster analysis in MATLAB, using input resistance, sag ratio, maximum AP rate, AP half-width, and rebound potential as input parameters. All input values were standardized using the z score function in MATLAB. The number of predefined clusters were set to 3 (k = 3) after inspection of the elbow plot, showing the relationship between the sum of squared errors and the number of clusters (k).
Surgery
Mice of the MEC13-53A enhancer strain expressing the tTA system in RE+ cells in LII of the EC were used for the optogenetic experiments (Blankvoort et al., 2018). A total of 23 mice were injected with tTA-dependent AAV viruses (AAV2/9-TRE-tight-oChIEF-Citrine was used for DG/CA3 injections, AAV2/1-TRE-tight-oChIEF-Citrine was used for LEC injections, and control animals for histology were injected with AAV2/1-tetO GFP). The animals were anesthetized with isoflurane in an induction chamber (4%, Nycomed, airflow 1 L/min), after which they were moved to a surgical mask on a stereotactic frame (Kopf Instruments). The animals were placed on a heating pad (37°C) to maintain stable body temperature throughout the surgery. The dorsal surface of the head was shaved with an electrical shaver, and eye ointment was applied to the eyes of the animal to protect the corneas from drying out. The animals were injected subcutaneously with buprenorphine hydrochloride (0.1 mg/kg, Temgesic, Indivior), meloxicam (1 mg/kg, Metacam Boehringer Ingelheim Vetmedica), and bupivacaine hydrochloride (Marcain 1 mg/kg, Astra Zeneca), the latter at the incision site. The head was fixed to the stereotaxic frame with ear bars, and the skin overlying the scull at the incision site was disinfected with ethanol (70%) and iodide before a rostrocaudal incision was made. Anterior–posterior coordinates were measured from bregma or the posterior transverse sinus, mediolateral coordinates were measured from the mid-sagittal sinus, and dorsoventral coordinates were measured from the surface of the brain. A craniotomy was made around the approximate coordinate for the injection, and precise measurements were made with the glass capillary used for the virus injection. Viruses were injected with a nanoliter injector (Nanoliter 2010, World Precision Instruments) controlled by a microsyringe pump controller (Micro4 pump, World Precision Instruments); 400–500 nl of virus was injected with a speed of 40 nl/min. After completion of the injection, we waited 10 min to give the virus time to diffuse before retracting the capillary. Finally, the wound was rinsed and the skin was sutured. The animals were left to recover in a heating chamber, before being returned to their home cage, where their health was checked daily.
Whole-cell voltage-clamp recordings
After 2 weeks, MEC13-53A mice that had undergone surgery were killed and acute 400 μm semicoronal slices were prepared as described above (see Acute slice preparation). Experimental conditions were the same as for whole-cell current-clamp recordings, except here LII principal cells were recorded in whole-cell voltage-clamp mode with the following intracellular solution: 117 mm cesium gluconate, 13 mm CsCl, 2 mm MgCl2, 10 mm HEPES, 10 mm Na2-phosphocreatine, 0.3 mm Na-GTP, 4 mm Mg-ATP, and 5 mm QX314-Cl. Biocytin (Iris Biotech) was added at a concentration of 5 mg/ml (0.5%). Recordings were performed with an EPC 10 Quadro USB amplifier, controlled by the acquisition software Patchmaster. Acquired data were low pass Bessel filtered at 4 kHz and digitized at 10 kHz. Only recordings with series resistance ≤25 mΩ were included (median, 18 mΩ; 25th-75th percentiles, 13–22 mΩ). Series resistance was continually monitored and compensated. Series resistance compensation was performed by increasing the amount of compensation until oscillations were observed in the current trace, and then reduced and maintained at a level just below this point (65%–85% compensation). Remaining uncompensated series resistance was estimated to produce an error in the holding voltage of usually <1 mV (median, 0.45 mV; 25th-75th percentiles, 0.26–0.73 mV). In all experiments, EPSCs or IPSCs were recorded by clamping the cell potential near the reversal potential for excitatory currents (Eexc ≈ 0 mV) or inhibitory, chloride-mediated currents (ECl = −49 mV), respectively. Recordings were corrected for the liquid junction potential (12.1 mV for the cesium-based internal solution, calculated using the junction potential calculator JPCalc plugin in pCLAMP, Molecular Devices; the reversal potentials were subsequently confirmed experimentally). In several experiments, bath application of bicuculline (10 μm, Sigma-Aldrich) or combined DNQX (10 μm, Tocris Bioscience) and APV (50 μm, Tocris Bioscience) was used to block GABAergic or glutamatergic synaptic transmission, respectively.
Laser scanning photostimulation and voltage-clamp data analysis
Photostimulation of oChIEF+ fibers was performed with a 473 nm laser controlled by a UGA-42 GEO point scanning system (Rapp OptoElectronic), and delivered through a 20×/1.0 NA WI objective (Carl Zeiss Axio Examiner.D1). Laser pulses had a beam diameter of 35 μm and a duration of 1 ms. The tissue was illuminated with individual pulses at a rate of 1 Hz in a 4 × 5 grid pattern. Laser intensity (1.5–5.0 mW) was adjusted for each recording to evoke small, repeatable inward currents (EPSCs), and the same laser pulses were used to evoke both monosynaptic EPSCs and disynaptic IPSCs. Current traces from individual stimulation spots were averaged over 5–15 individual sweeps to create an average response for each point in the 4 × 5 grid. Deflections of the average current trace exceeding 10 SDs (±10 SDs) of the baseline were classified as synaptic responses. Deflections that did not meet our inclusion criterion were invariably <10 pA in amplitude. Postsynaptic current amplitudes were calculated as the difference between the peak of the evoked synaptic current and the baseline current measured before stimulus onset. Postsynaptic current latency was defined as the time interval between light onset and the point where the current trace exceeded 10% amplitude. Data analysis was performed using custom-written scripts in MATLAB.
Histology
After electrophysiological recordings, the 400-μm-thick brain slices were put in 4% PFA (pH 7.4, Merck Chemicals) for 48 h at 4°C. Slices containing cells filled with AlexaFluor dyes were dehydrated after the fixation (see details below) and prepared for confocal microscopy. Slices containing biocytin-filled cells were stained with streptavidin conjugated to a fluorescent tag (see details below). A selection of slices from current-clamp experiments were stained with antibodies against RE, and some of the slices containing fast spiking (FS) cells were stained with antibodies against parvalbumin (PV; see Immunohistochemistry for complete protocols). All slices from optogenetic experiments were stained with antibodies against RE and GFP.
To confirm the specificity of transgenic labeling and assess the overlap with RE+ cells in EC LII, 4 transgenic MEC13-53A mice were injected with AAV-tetO-GFP and another 4 with AAV-TRE-tight-oChIEF-Citrine. Two weeks after injection, these animals were anesthetized with isoflurane before being killed with a lethal intraperitoneal injection of pentobarbital (100 mg/kg, Apotekerforeningen). Animals were transcardially perfused using a peristaltic pump (World Precision Instruments), first with Ringer's solution (0.85% NaCl, 0.025% KCl, 0.02% NaHCO3) and subsequently with freshly prepared 4% PFA. The brains were removed from the skull, postfixed in PFA overnight, and put in a cryo-protective solution containing 20% glycerol, 2% DMSO diluted in 0.125 m PB. A freezing microtome was used to cut the brains into 40-μm-thick sections, in four equally spaced series. One series from each brain was immunostained against GFP and RE (see details below). After staining the sections were mounted in Tris-HCl on SuperfrostPlus microscope slides (Thermo Fisher Scientific), cleared in toluene (VWR Chemicals), and coverslipped in a mixture of toluene and entellan (Merck Chemicals).
Immunohistochemistry
RE and GFP.
Thick (400 μm) slices from electrophysiological recordings selected for immunohistochemical staining were first washed 4 × 15 min in 0.125 m PB at room temperature, before going through an antigen retrieval process, in which the slices were incubated for 1 h at 60°C in PB. After this, the sections were permeabilized 2 × 10 min in PB + 0.5% Triton X-100 (PBT; Merck Chemicals) and preincubated in a blocking medium containing PBT and 5% normal goat serum (Abcam catalog #ab7481, RRID:AB_2716553) for 90 min at room temperature. After this, the tissue was incubated with primary antibodies, chicken anti-GFP 1:400, and/or mouse anti-RE 1:800 (anti-GFP: Abcam catalog #ab13970, RRID:AB_300798, recombinant full-length protein corresponding to GFP as the immunogen; anti-RE: Millipore catalog #MAB5364, RRID:AB_2179313, recombinant RE amino acids 164–496 clone G10 as the immunogen), and left on a stirrer for 72 h at 4°C. After this, the sections were washed 4 × 15 min in PBT at room temperature and incubated in secondary antibody 1:400 (goat anti-chicken AlexaFluor-488, Thermo Fisher Scientific catalog #A-11039, RRID:AB_2534096, and goat anti-mouse AlexaFluor-546, Thermo Fisher Scientific catalog #A-11003, RRID:AB_2534071) overnight at 4°C. Thick sections containing cells filled with biocytin were also stained with streptavidin conjugated to a fluorescent tag (1:600; AlexaFluor-488/633, Thermo Fisher Scientific catalog #S32354, RRID:AB_2315383/Thermo Fisher Scientific catalog #S-21375, RRID:AB_2313500) during the secondary antibody incubation. After secondary antibody incubation, all sections were washed 4 × 15 min in PB at room temperature before being dehydrated in increasing ethanol concentrations (30%, 50%, 70%, 90%, 100%, 100%, 10 min each) at room temperature before incubation in a 1:1 mixture of 100% ethanol and methyl salicylate (VWR Chemicals); this rendered the slices completely transparent. Finally, slices were stored in methyl salicylate. Staining against GFP and RE was performed simultaneously in sections where both antigens were present. Thin (40 μm) sections from MEC13–53A mice used for controls were stained according to the protocol described above, but the antibody incubations were shortened. The primary antibody incubation lasted 48 h at 4°C and the secondary antibody 3 h in room temperature.
PV.
Slices selected for PV staining were first washed 4 × 15 min in PB at room temperature, before being permeabilized 4 × 15 min in PB with 1% Triton X-100 at room temperature. The slices were preincubated in PB + 1% Triton X-100 and 10% normal goat serum at room temperature, before being incubated in primary antibody, rabbit anti-PV 1:1000 (Swant catalog #PV 25, RRID:AB_10000344/Swant catalog #PV27, RRID:AB_2631173, recombinant rat PV as the immunogen), on a stirrer for 24 h at 4°C. Next, the slices were washed 4 × 15 min in PB at room temperature and incubated in secondary antibody, goat anti-rabbit AlexaFluor-633 1:400 (Thermo Fisher Scientific catalog #A-31576, RRID:AB_2536186). Finally, slices were dehydrated and cleared in methyl salicylate.
Laser scanning confocal microscopy
Thick 400 μm slices from patch-clamp recordings were imaged with a laser scanning confocal microscope (Meta 510/LSM 880, Carl Zeiss). The slices were mounted in custom-made metal well slides with methyl salicylate and coverslipped. AlexaFluor-405 was excited with a 405 diode laser (emission: BP 420–480/410–483), AlexaFluor-488 and GFP were excited by the 488 line of an Argon laser (emission: BP 505–550/490–543), AlexaFluor-546 by a DPSS 568 laser line (emission: BP 575–615 IR/570–623), and AlexaFluor-633 by a HeNe 633 laser line (emission: LP 650/635–735). The main beam splitter for the Carl Zeiss Meta 510 was an HFT 405/488/561/633/KP 725 and for the LSM 880 an MBS 488/561/633. First, overview images of the tissue were taken with low magnification (Plan-Apochromat 10×, NA 0.45 and Plan-Apochromat 20×, NA 0.8) to get the overall morphology of the cells and to confirm their location in LII of LEC. After this, the slices were imaged with high magnification (Plan-Apochromat 40× oil, NA 1.3 and Plan-Apochromat 63× oil, NA 1.4) to perform morphological analyses of each cell. All images were acquired with 8 bit depth. Both overview images and high-magnification images were obtained as z stacks that included the whole extent of each recorded cell to recover the full cell morphology. For double-staining experiments, confocal images through the soma of each cell were taken to determine overlap of staining. Images for figures were exported to JPG files using the ZEN Black and Blue software belonging to the confocal microscopes, and the contrast and brightness of the images were adjusted in Photoshop (Adobe Systems). 3D reconstructions of cells were made in the reconstruction software AMIRA (FEI, Thermo Fisher Scientific) using the custom skeleton toolbox (Schmitt et al., 2004; Evers et al., 2005).
Fluorescent slide scanner images
Mounted 40 μm thin sections were imaged using an Axio ScanZ.1 fluorescent scanner, equipped with a 20× objective, Colibri.2 LED light source, and a quadruple emission filter (Plan-Apochromat 20×, NA 0.8, excitation 488/546, emission 405/488/546/633, Carl Zeiss). Images for figures were exported to JPG files using the ZEN Blue software belonging to the scanner system, and contrast and brightness of the images were adjusted in Photoshop (Adobe Systems).
Morphological analysis of LEC LII recorded cells
Morphological classification of the principal cells recorded in our study was done by visually inspecting z stacks and projection views of raw images acquired by confocal microscopy, at 20×, 40×, or 63× magnification. The morphology of each neuron was evaluated independently by 2 people and classified in accordance with previous descriptions of LEC LII principal cells (Tahvildari and Alonso, 2005; Canto and Witter, 2012a). Fan cells were recognized by a large, round soma, an extensive dendritic tree fanning toward the pial surface, and a lack of or rudimentary, basal dendritic tree. Multipolar cells were large cells with a round soma, with dendrites that radiated in all directions. Pyramidal cells had a triangular soma oriented perpendicular to the pial surface and a large apical dendrite reaching toward the pial surface before splitting into multiple branches. Pyramidal cells had basal dendritic trees of varying extents. Oblique pyramidal cells had pyramidal cell morphology but were tilted ∼45° to the pial surface such that the primary apical dendrites extended at an angle to the pial surface. If we were unable to determine the morphology of a principal neuron, it was excluded from the dataset.
In the few cases where the principal cell main axon was cut closer than 100 μm from the soma, possible synaptic connections arising from the activity of this cell were not included for further analysis. The intersomatic distance of the recorded cells was measured as the Euclidian distance between the cell bodies.
Experimental design and statistical analyses
For our experiments, we used slices from 49 rats and 4 mice for whole-cell current-clamp recordings, as well as 15 transgenic MEC13-53A enhancer strain mice for whole-cell voltage-clamp recordings. Eight transgenic animals were also used to control the specificity of the transgene expression of the MEC13-53A mouse line. The number of slices and cells recorded from each animal varied. All recordings were made in LII of the dorsolateral LEC close to the rhinal fissure. All statistical analyses were performed using SPSS Statistics 25 (IBM). Data were tested for normality using Q-Q plots, distribution histograms, and the Shapiro–Wilk test before conducting statistical tests. All of the tested data were non-normally distributed, and some datasets were too small to perform a reliable test for normality and homogeneity of variance. We used the Mann–Whitney U test when comparing variables between two groups; and for comparisons of multiple measures, we performed a Kruskal–Wallis H test. Data were considered significant at p ≤ 0.05. Median and 25th–75th percentiles are reported for all data distributions.
Results
Polysynaptic connectivity between fan cells in layer II of LEC
To probe the synaptic connectivity of LII principal cells, we performed simultaneous whole-cell current-clamp recordings from up to four cells located in dorsolateral LEC in acute semicoronal slices. Groups of putative principal cells (intersomatic distance; median, 42.95 μm; 25th–75th percentiles, 29.23–61.04 μm) were selected for recording. Our recordings included all four main principal cell types in LII of LEC, defined by somatodendritic morphology acquired by post hoc visualization of the recorded cells. There are conflicting reports about the correlation between morphological principal cell type identity and electrophysiological properties in LEC LII (Tahvildari and Alonso, 2005; Canto and Witter, 2012a; Leitner et al., 2016). This potential conflict likely reflects two possible sampling variations. One could be a variability in intrinsic membrane properties of cells positioned differently along the medial to lateral extent of the LEC (Canto and Witter, 2012a). The other might reflect the chemical nature of the neuron, where intrinsic membrane properties differ between RE+ cells and calbindin+ cells, but not between different morphological classes of RE+ principal cells (Leitner et al., 2016). Because we recorded mainly from RE+ neurons, we chose to use dendritic features to determine the principal cell type. To describe the local connectivity between the different groups of principal cells accurately, recorded cells with incompletely recovered morphologies were excluded. The dataset contains recordings from 292 principal cells from 48 Long–Evans rats and 15 principal cells from 4 C57BL/6N mice. We tested in total 551 principal cell to principal cell connections, derived from 517 connections in the Long–Evans dataset and 34 connections in the C57BL/6N dataset.
Most recorded principal cells (n = 189 of 307) had morphologies typical of fan cells (Fig. 1A). These cells usually fired late and few spikes during weak depolarizing current steps and showed spike frequency adaptation during stronger depolarizing stimuli (Fig. 1B). In all experiments, we evoked APs by injecting short depolarizing current pulses sequentially in each recorded cell while observing the resting membrane potentials of the other cells to screen for synaptic connections (Fig. 1C). We observed a diversity of postsynaptic potentials in individual fan cells upon activation of neighboring fan cells. A single fan cell pair (n = 1 of 215 or 0.5%) was presumably monosynaptically connected through a short-latency depolarizing connection (latency < 3 ms), but depolarizing postsynaptic potentials of longer latencies were observed more frequently (n = 4 of 215, or 1.9%; Fig. 1C,D). We also encountered hyperpolarizing potentials (n = 7 of 215, or 3.3%) of variable latencies in fan cells when activating another nearby fan cell at high frequencies (40–70 Hz; Fig. 1E,F), or when activating multiple fan cells simultaneously. We interpret these potentials as disynaptic IPSPs arising from the activation of intermediate inhibitory interneurons. In addition, one connection between fan cells could not with certainty be categorized as monosynaptic or polysynaptic, and was thus marked as unclassifiable. Amplitudes of fan to fan postsynaptic potentials were invariably <1 mV following 10 Hz or 70 Hz presynaptic stimulation (Fig. 1G). Together, our recordings indicate that putative disynaptic connectivity is the preferred mode of communication between fan cells.
Figure 1.

Polysynaptic connectivity between fan cells. A, Reconstruction of three LII fan cells (black, magenta, and blue) and one LII nFS cell (green) recorded simultaneously in an acute semicoronal slice through LEC. Scale bar, 20 μm. B, Electrophysiological profiles of the cells in A resulting from hyperpolarizing and depolarizing current steps. The three fan cells all show similar characteristic responses that differ from responses of the nFS cell. Traces are color coded according to the color of the cells in A. C, Average membrane potential traces showing a single depolarizing postsynaptic potential in the blue fan cell arising from an AP in the magenta fan cell (second panel). Average membrane potential is indicated for each cell. The connectivity protocol is illustrated with dashed and solid lines indicating unconnected and connected cells, respectively. Traces are color coded referring to the cells in A. D, Enlarged time scale of the connection in C. Average trace (blue) superimposed on individual traces (gray) showing a long delay between the presynaptic spike (magenta) and the onset of the postsynaptic potential. Dotted line indicates the peak of the presynaptic AP. E, Fan cells are connected with neighboring fan cells through disynaptic inhibitory connections. Shown is a recorded cluster (different from the cluster shown in A) containing three fan cells (cells 1, 2, and 4) and one pyramidal cell (cell 3). Brief IPSPs were detected in fan cell 2 (black) and fan cell 4 (black) in response to a presynaptic 70 Hz AP train in fan cell 1 (magenta). Average traces (black) are superimposed on individual traces (gray). Average membrane potential is indicated for each cell. Cells were recorded and filled with K-gluconate containing different spectral variants of AlexaFluor dyes. F, Fan cells are interconnected through slow disynaptic inhibitory connections. Displayed is a cluster of four fan cells (cells 1, 2, 3, and 4). Long-latency, slow IPSPs were detected in fan cell 2 (black) and fan cell 3 (black) in response to a presynaptic 70 Hz AP train in fan cell 1 (magenta). Average traces (black) are superimposed on individual traces (gray). Average membrane potential is indicated for each cell. Cells were recorded and filled with K-gluconate internal solution containing biocytin. G, Postsynaptic potential amplitudes recorded in pairs of fan cells. Amplitudes are shown in response to single stimuli (10 Hz, left) and high-frequency presynaptic stimulation (70 Hz, right).
Our multicell recordings routinely contained one or more of the other LII principal cell types, allowing us to explore the number and amplitudes of synaptic connections of fan cells with these cells (Fig. 2A). Presumed monosynaptic connections were detected between fan cells and pyramidal cells (fan to pyramidal: n = 2 of 29, or 6.9%; pyramidal to fan: n = 1 of 31, or 3.2%) and a long-latency potential, putative polysynaptic, was found from a multiform to a fan cell (n = 1 of 28, or 3.6%). Finally, we tested the interconnectivity of the other principal cell types (Fig. 2B). Presumed monosynaptic connectivity was found between cells belonging to the same principal cell class (multiform cells: n = 1 of 22, or 4.5%; pyramidal cells: n = 1 of 34, or 2.9%; oblique pyramidal cells: n = 1 of 14, or 7.1%); and on a single occasion, a long-latency depolarizing potential was detected in a pair of simultaneously recorded multiform cells (n = 1 of 22, or 4.5%). Furthermore, presumed monosynaptic connections were present from pyramidal to multiform cells (n = 2 of 18, or 11.1%), and onto oblique pyramidal cells from a multiform (n = 1 of 9, or 11.1%) or a pyramidal cell (n = 1 of 14, or 7.1%).
Figure 2.
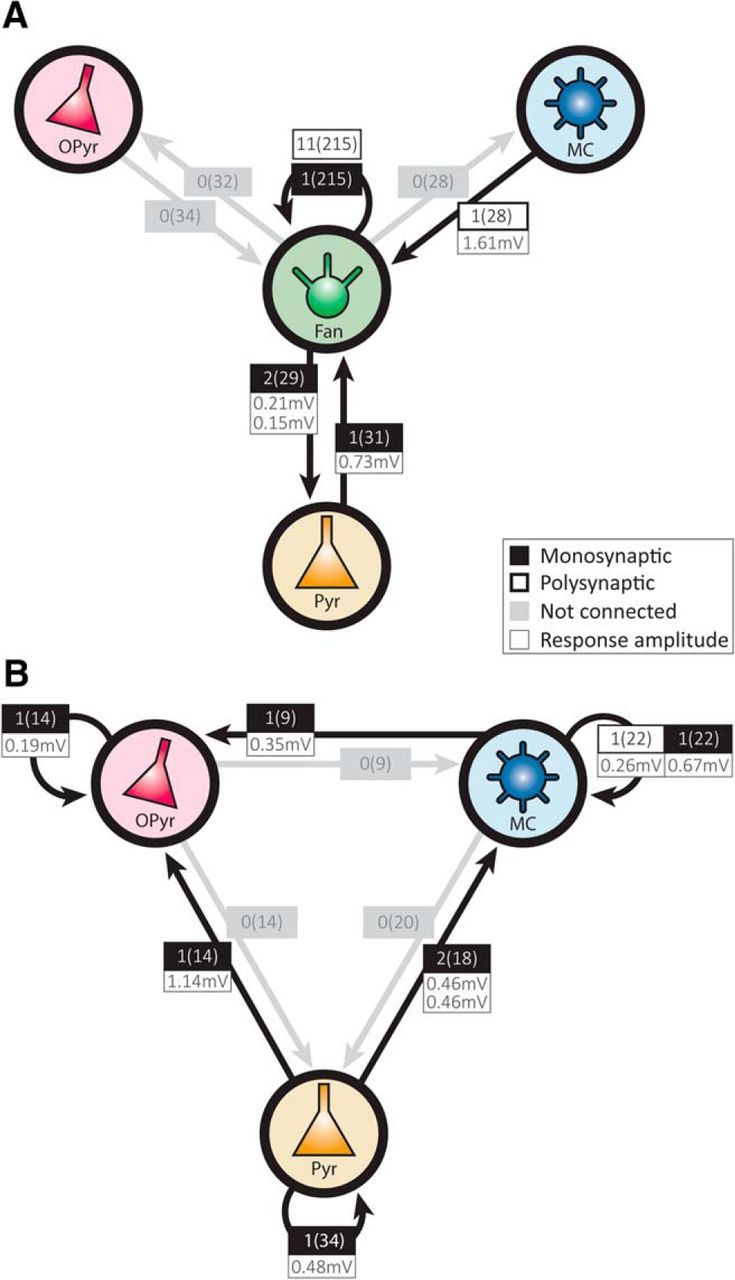
Connectivity between principal cells in LII of LEC. A, Connectivity between fan cells, and between fan cells and the other classes of principal cells in LII of LEC. Boxes represent the number of observed connections of the number of tested connections, as well as postsynaptic potential amplitudes (in millivolts) following 70 Hz presynaptic stimulation. Amplitudes of postsynaptic responses in fan-to-fan connections are shown in Figure 1G. B, Connectivity and average amplitudes of postsynaptic potentials following 70 Hz stimulation between multiform, pyramidal, and oblique pyramidal cells.
Three main groups of interneurons in layer II of LEC
Noticing that long-latency synaptic events sometimes occurred when recording from pairs of fan cells, we next aimed to explore the connectivity between principal cells and inhibitory interneurons in LEC LII. We recorded small-sized somata of putative interneurons situated in close proximity to simultaneously recorded principal cells. Interneurons were distinguishable from principal cells by their electrophysiological properties, particularly by their larger spike afterhyperpolarizations and higher firing rates (Kawaguchi et al., 1987; Jones and Bühl, 1993; Gentet et al., 2010). Morphological recovery of the recorded cells revealed that these cells were typical interneurons with extensive local axonal trees and very low dendritic spine densities, or absence of spines. We used a k-means cluster analysis to classify LEC LII interneurons into FS, non-FS cells (nFS), and low threshold spiking cells (LTS) based on electrophysiological properties (Fig. 3).
Figure 3.

Three main groups of interneurons in LII of LEC. A, Examples of electrophysiological profiles from an FS cell (red), an nFS cell (blue), and an LTS cell (yellow) in response to depolarizing and hyperpolarizing current step injections. Example traces show that the three cell classes typically display different firing properties after depolarizing current injections (two top traces) and that LTS cells have a characteristic sag potential and rebound spikes following a hyperpolarizing current step (third trace from the top). Bottom, Injected currents. For electrophysiological properties of recorded interneurons, see Table 1. B, Examples of dendritic morphology from the three interneuron classes. Scale bars: FS cells, 20 μm; nFS/LTS cells, 10 μm. C, Maximum AP firing rate (Hz) plotted against AP half-width (ms), showing that FS cells have shorter spikes and high firing rates compared with nFS and LTS cells. D, Rebound potential (mV) plotted against sag ratio shows that these two features differentiate nFS cells from LTS cells.
FS cells were the most frequently encountered interneuron type in our data (n = 29 of 61; Fig. 3A,B). They had high maximum firing rates and short AP half-widths, two features that distinguished them from the two other interneuron classes (Fig. 3A–C; Table 1; p < 0.0001, Kruskal–Wallis H test). A selection of FS cells were tested immunohistochemically, and a subset of these (n = 7 of 17, or 41.2%) stained positive for the calcium-binding protein PV (Fig. 4), a common marker for FS cells (Hu et al., 2014). LTS cells (n = 13 of 61) could be separated from nFS cells (n = 19 of 61) based on high input resistance, together with their tendencies to show sag potentials and large rebound potentials that occasionally reached firing threshold after hyperpolarizing current steps (Fig. 3A,D; Table 1, p < 0.0001, Kruskal–Wallis H test).
Table 1.
Intrinsic electrophysiological properties of three distinct classes of LEC interneuronsa
| FS cells (n = 29) | nFS cells (n = 19) | LTS cells n = 13 | p (Kruskal–Wallis) H test | |
|---|---|---|---|---|
| AP half-width (ms) | 0.75 | 1.10 | 1.15 | p < 0.0001 |
| 0.70–0.80 | 0.95–1.20 | 1.00–1.20 | H(2) = 42.56 | |
| (15.48) | (44.37) | (46.08) | ||
| Maximum AP rate (Hz) | 140.00 | 54.00 | 66.00 | p < 0.0001 |
| 127.00–154.00 | 44.00–64.00 | 41.00–81.00 | H(2) = 45.53 | |
| (47.00) | (14.50) | (19.42) | ||
| Sag ratio | 0.99 | 0.98 | 0.91 | p < 0.0001 |
| 0.98–0.99 | 0.98–0.99 | 0.82–0.94 | H(2) = 30.41 | |
| (38.47) | (36.03) | (7.00) | ||
| Rebound potential (mV) | 1.73 | 1.31 | 12.95 | p < 0.0001 |
| 1.13–3.17 | 0.54–3.1 | 10.75–17.16 | H(2) = 30.45 | |
| (25.91) | (22.39) | (54.92) | ||
| Input resistance (mΩ) | 144.90 | 158.54 | 262.24 | p = 0.0005 |
| 120.29–181.97 | 126.97–199.22 | 178.32–281.77 | H(2) = 15.21 | |
| (25.03) | (28.63) | (47.77) |
aValues are given as median and 25th-75th percentiles, and statistical differences between the groups are given as p values from the Kruskal–Wallis H test.
Figure 4.

Immunoreactivity of FS cells to the calcium-binding protein PV. A, Whole-cell cluster recording containing a fan cell, multiform cell, and an FS interneuron. Scale bar, 50 μm. B, Reconstruction of the recorded FS cell in A. Scale bar, 40 μm. C, Electrophysiological profile of the cell in A and B shows an FS phenotype. D, Confocal images show the biocytin-filled cell body (left) of the cell in A and B, immunostaining to PV (middle), and overlap between the biocytin-filled soma and the PV signal (right). Scale bar, 20 μm.
Fan cells receive extensive intralaminar inputs from FS and nFS inhibitory cells
After establishing that LEC LII contains FS, nFS, and LTS cells, we explored their connectivity with fan cells (Fig. 5). We found robust connectivity onto fan cells from nearby FS (Fig. 5A–C) and nFS cells (Fig. 5D–F). The most prevalent connectivity was from FS cells to fan cells (n = 17 of 28, or 60.7%, Fig. 5A–C,H), and connections from fan cells to FS cells were also common (n = 5 of 26, or 19.2%; Fig. 5G,H). Fan cells were frequently targeted by nFS cells (n = 6 of 21, or 28.6%; Fig. 5D–F,H), but connectivity in the opposite direction was sparse (n = 1 of 18, or 5.6%; Fig. 5H). We found one reciprocal connection in LTS and fan cell pairs (LTS to fan, n = 1 of 11, or 9.1%; fan to LTS, n = 1 of 7, or 14.3%; Fig. 5H).
Figure 5.

Fan cells receive extensive intralaminar inputs from FS and nFS interneurons. A, Reconstructed cluster with three fan cells (black) and an FS cell (red). Scale bar, 20 μm. Inset, Position of the cluster in dorsal LEC LII. Scale bar, 50 μm. Rf, Rhinal fissure. B, Electrophysiological profiles of the cells in A. C, Responses to elicited APs in the four recorded cells (stimulation represented along the diagonal from the top trace in the first panel) showing that the FS cell elicits a response in all three fan cells, but that neither of the fan cells produced a response in the other recorded cells. In some cases, small instantaneous deflections that are artifacts time-locked to the presynaptic current injections can be seen riding on top of the recorded membrane voltage traces (e.g., trace in column 1, row 2). D, Same as in A, with two fan cells (black), one nFS cell (blue), and one oblique pyramidal cell (Opy, gray). Scale bars: 25 μm; inset, 100 μm. E, Electrophysiological profiles of the cells in D. F, Same as in C for cells in D and E. nFS cell was presynaptic to all of the other cells, but no other connections were detected. G, Connectivity from fan cells onto FS cells. Shown are recorded FS postsynaptic potentials in response to a train of 10 APs (10 Hz, top) and a train of 15 + 1 APs (70 Hz, bottom) elicited in a presynaptic fan cell. The average postsynaptic trace (red) is superimposed on individual sweeps (gray). Right, Average synaptic amplitudes following 10 Hz and 70 Hz stimulation in all FS cells receiving input from fan cells (n = 5). H, Summary histogram and diagram of connection probabilities. Boxes represent the number of found connections out of the number of tested connections.
We also tested the connectivity of the three interneuron classes with the other principal cell types in LII of LEC (Fig. 6). FS cells had connections to pyramidal (n = 3 of 11, or 27.3%), oblique pyramidal (n = 4 of 8, or 50%), and multiform cells (n = 2 of 6, or 33.3%), and received connections from pyramidal (n = 1 of 11, or 9.1%), oblique pyramidal (n = 1 of 7, or 14.3%), and multiform cells (n = 1 of 6, or 16.7%). Cells of the nFS class had connections onto pyramidal cells (n = 1 of 5, or 20%) and oblique pyramidal cells (n = 4 of 8, or 50%), and connections from pyramidal and oblique pyramidal cells onto nFS cells were also frequent (n = 2 of 5, or 40% and n = 3 of 5, or 60%, respectively). LTS cells was the interneuron group that had the sparsest connectivity with principal cells. We did not find connections from LTS cells to multiform, oblique pyramidal, or pyramidal cells but detected a single connection onto an LTS cell from an oblique pyramidal cell (n = 1 of 7, or 14.3%).
Figure 6.

Summary of connectivity between interneurons and nonfan principal cells. A, Paired recording from an FS cell and a multiform cell (MC; top), cell reconstructions (red represents FS cell; black represents multiform cell; middle) and summary diagram of connectivity between MCs and all classes of interneurons (INs) (bottom). Red and black traces represent membrane potential recordings from FS and principal cells, respectively. Diagram shows an example recording of a unidirectional FS to MC connection after evoking 10 Hz spike trains in the recorded cells. Scale bars (reconstructed neurons), 40 μm. B, Same as in A for oblique pyramidal cells (Opy). The example recording shows a reciprocal connection between the FS and Opy cell. C, Same as in A for pyramidal cells (Pyr). The example recording shows a reciprocal connection between the FS and Pyr cell.
Fan cells receive different types of inhibition from FS and nFS cells
We noticed that stimulation of FS and nFS cells led to IPSPs in fan cells varying in strength, temporal dynamic, and polarity. Driving FS cells usually induced short-latency (median, 2.10 ms; 25th–75th percentiles, 1.55–2.60 ms) IPSPs in fan cells at all stimulation frequencies (n = 14 of 17 connections; Fig. 7A), whereas driving nFS cells resulted in small, slow IPSPs that were usually only evident at high-frequency stimulation (n = 4 of 6 connections; Fig. 7A). High-frequency activation (70 Hz) of FS cells produced fast, transient responses compared with those evoked by nFS cell stimulation (latency to peak; FS, median, 136.00 ms; 25th-75th percentiles, 102.6–175.45 ms and nFS, median, 394.25 ms; 25th-75th percentiles, 225.15–601.38 ms; Mann–Whitney U test, U = 2.00 p = 0.000079; Fig. 7B; half-width; FS median, 241.90 ms; 25th-75th percentiles, 221.20–296.00 ms and nFS, median, 470.7 ms; 25th-75th percentiles, 271.53–667.48 ms; Mann–Whitney U test; U = 15.00, p = 0.01; Fig. 7C). Furthermore, larger IPSP amplitudes were observed in postsynaptic fan cells following FS stimulation than after nFS stimulation (70 Hz stimulation; FS, median, 2.0 mV; 25th-75th percentiles, 0.63–3.75 mV and nFS, median, 0.44 mV; 25th-75th percentiles, 0.36–0.82 mV; Mann–Whitney U test, U = 15.5, p = 0.01; Fig. 7D). Interestingly, the IPSPs evoked by FS cell activity differed in polarity from IPSPs derived from nFS cell stimulation. In all cases, FS cell stimulation led to depolarizing rather than hyperpolarizing events in the postsynaptic fan cell (Fig. 7A). This depolarizing effect could be explained by the reversal potential for chloride, which for our biocytin containing internal solution was −47.0 mV, and thus more depolarized than the resting membrane potential of the fan cells (−70.3 mV, −72.6 to −68.0 mV in FS cell recordings and −70.0 mV, −71.5 to −66.5 mV in nFS cell recordings; median, 25th-75th percentiles). Application of the GABAA antagonist bicuculline abolished FS-induced IPSPs in all tested cases (n = 5), and the IPSPs were partially recovered after bicuculline removal, confirming that they were GABAA-dependent responses (Fig. 7E). Activation of nFS cells produced slow, lasting hyperpolarizing events, sometimes preceded by a brief depolarizing event. Given the depolarized chloride reversal potential in our experiments, this biphasic response likely stems from different ionic mechanisms, potentially from GABAA- and GABAB-mediated currents (Nicoll et al., 1990). We encountered connections between nFS cells and fan cells only sporadically, and could test these connections pharmacologically on a single occasion only. In this case, the IPSP was partially sensitive to bicuculline. More specifically, the fast depolarizing potential was blocked, whereas the slower hyperpolarizing component was less affected (Fig. 7F). Together, our data indicate that FS and nFS cells exert two different inhibitory effects on fan cells in LII of LEC.
Figure 7.

Fan cells receive different types of inhibition from FS and nFS cells. A, IPSPs in fan cells evoked by increasing stimulation frequencies of FS (left) and nFS cells (right) cells. Increasing AP frequency in FS cells results in larger IPSPs in postsynaptic fan cells, whereas the nFS cell elicits IPSPs in the fan cell only during high-intensity stimulation. Average traces (black) are superimposed on the individual traces (gray). Dashed lines indicate average resting potentials of recorded fan cells (left, −71.0 mV; right, −66.5 mV). B, Shorter IPSP latency to peak after FS cell compared with nFS cell stimulation (Mann–Whitney U test, U = 2.00, p = 0.000079). Box represents median (red line) and interquartile range. Whiskers indicate minimum/maximum values, *p < 0.05. C, Same as in B, but for IPSP half-width (Mann–Whitney U test, U = 15.00, p = 0.01). D, Same as in B, but for absolute IPSP amplitude (mV) at 70 Hz stimulation (Mann–Whitney U test, U = 15.5, p = 0.01). E, Reversible block of FS to fan cell connections by the GABAA antagonist bicuculline. Left, Electrophysiological profiles of an FS and a fan cell. Right, Stimulation (top) and IPSPs (bottom) before (black), during (blue), and after bicuculline (yellow) treatment. F, Same as in E for an nFS cell, showing that the IPSP after nFS stimulation is partially abolished by bicuculline.
All classes of layer II principal cells project to the dentate gyrus and CA3
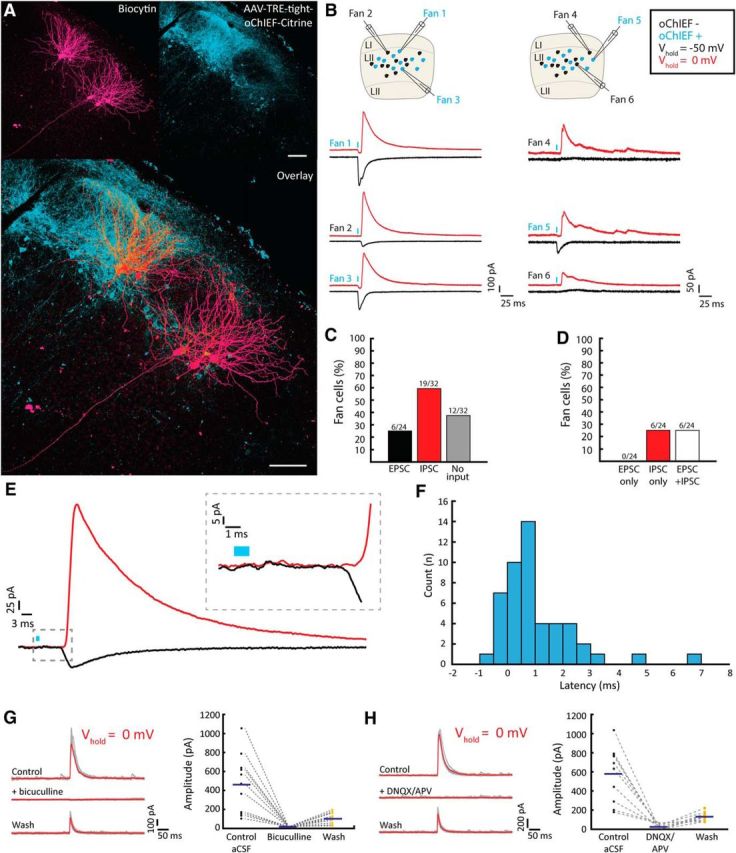
In consideration of the low number of connections found in our multicell recordings, we aimed to optimize the detection of synaptic connections by introducing an oChIEF variant of the light-activating protein channelrhodopsin2 exclusively in EC LII excitatory RE+ cells. To this end, we used the MEC13–53A mouse line, which carries the tTA factor in a subpopulation of RE+ cells (Blankvoort et al., 2018) and injected a tTA-dependent AAV carrying a fused oChIEF-citrine protein (AAV2/9-TRE-tight-oChIEF-Citrine) into the dorsal DG/CA3. This led to specific retrograde labeling of LII DG/CA3-projecting cells dorsally in EC (Fig. 8A). We first performed whole-cell recordings in acute semicoronal slices to characterize the DG/CA3-projecting transgenic cell population. Fluorescent cells were patched and voltage-clamped at −50 mV during photostimulation with brief light pulses (473 nm light, 1 ms duration). Post hoc morphological recovery of the recorded cells revealed that DG/CA3-projecting cells encompass fan (n = 10 of 20), multiform (n = 6 of 20), pyramidal (n = 2 of 20), and oblique pyramidal cells (n = 2 of 20) (Fig. 8B,C). This observation is supported by immunohistochemical data from the rat, showing that RE+ neurons are found within all classes of principal cells in LEC LII (Fjeld, 2015). RE has previously been shown to be a reliable marker for DG/CA3-projecting cells in both MEC and LEC (Varga et al., 2010; Leitner et al., 2016). oChIEF-expressing cells displayed inward currents with submillisecond onset latency (median, 0.44 ms; 25th–75th percentiles, 0.38–0.46 ms; Fig. 8C,D). Inward current amplitudes were variable across cells (median, −211.1 pA; 25th–75th percentiles, −477.6 to −90.5 pA), but all occurred with negligible delay following laser stimulation (Fig. 8C–E). Short latency currents were resistant to glutamatergic (DNQX + APV, n = 6 cells from three animals) and GABAergic (bicuculline, n = 6 from three animals) synaptic blockers (data not shown), indicating that they were direct photocurrents resulting from oChIEF activation. Our findings demonstrate that RE+ cells are present within all morphological classes of LII principal cells. Moreover, all morphological groups are present in the DG/CA3-projecting population of LEC LII cells, though with a preferential origin from fan cells.
Figure 8.

All excitatory cell types in LEC LII project to dentate gyrus/CA3 of the hippocampal formation. A, Retrograde labeling is limited to LII excitatory cells after virus injection into dentate gyrus/CA3 of the MEC13–53A mouse line. Scale bar, 200 μm. Insets, mCitrine signal of retrogradely labeled cells colocalize with RE-immunoreactive cells in superficial LII. Scale bar, 20 μm. B, Example cell reconstructions of recorded fan, multiform, and pyramidal cells that express oChIEF and RE. Immunostaining for RE (yellow; left), citrine/GFP (green, middle), and biocytin-filled somata (cyan, right) are shown in the bottom panels for all cells. Scale bars, 20 μm. C, oChIEF-mediated photocurrents recorded from the different LEC LII principal cell types. The fan, multiform, and pyramidal cells correspond to the cells shown in B. All cells were voltage-clamped at −50 mV. D, oChIEF-expressing cells (n = 20) show fast activation after exposure to blue light. E, Average photocurrent amplitudes of oChIEF-expressing cells (n = 18).
The network of layer II RE-immunoreactive cells is dominated by disynaptic inhibition
After the morphological characterization of DG/CA3-projecting cells, we next set out to map the local functional connectivity of these cells onto neighboring fan cells using an optogenetic approach. As MEC LII RE+ cells also project to the DG/CA3, we first wanted to check whether projections from these cells were inducing activity in LII of LEC. To test this, we injected the retrograde AAV2/9-TRE-tight-oChIEF-Citrine directly into LEC. This approach revealed a near complete lack of virally transduced MEC cells, demonstrating that transgenically labeled LII MEC cells do not project to LEC (Fig. 9). Hence, AAV2/9-TRE-tight-oChIEF-Citrine delivery into dorsal DG/CA3 enabled optogenetic manipulation restricted to local LEC LII circuitry.
Figure 9.

RE+ cells in MEC do not contribute to the activation of RE cells in LEC. A, Injection of retrograde AAV virus in LEC yields strong viral expression in LEC LII. B, Very sparse viral expression is seen in MEC following LEC retrograde virus injection. C, Fibers are almost exclusively present in the outer molecular layer (oML) of the dentate gyrus, which contains the projections from LEC. The middle molecular layer (mML), which is known to receive the projections of the MEC, is virtually without labeled axonal fibers. iML, Inner molecular layer.
Following such injections into the DG/CA3, we targeted large cell bodies in LEC LII that did not express oChIEF but were located near citrine-labeled fibers to investigate the connectivity of LEC LII cells (Fig. 10A,B). During laser scanning photostimulation of surrounding oChIEF-expressing fibers, recorded fan cells (n = 33 of 56) were alternately voltage-clamped at potentials close to the excitatory or inhibitory reversal potentials (∼0 mV or ∼−49 mV, respectively) to isolate EPSCs and IPSCs, respectively. These experiments revealed that fan cells receive strong inhibitory input (outward currents; Fig. 10B–D) derived from the activity of nearby LEC LII excitatory cells, and that this inhibition occasionally is accompanied by excitatory events (inward currents; Fig. 10B–D). These currents had considerably longer latencies than those observed in oChIEF-expressing cells, indicating that they derived from synaptic activity (inward current, 8.45 ms, 7.84–9.23 ms; outward current, 9.32 ms, 8.28–10.19 ms; median, 25th–75th percentiles). Inhibitory events were detected in more than half (n = 19 of 32, or 59%) of all recorded fan cells (Fig. 10C). We did not record fan cells that exclusively got excitatory inputs, but fan cells (n = 6 of 24, or 25%) that solely displayed inhibitory currents in response to photostimulation were present (Fig. 10B,D).
Figure 10.
Optogenetic stimulation of LII RE cells reveals a network dominated by inhibition. A, Fan cells (magenta) situated near retrogradely labeled oChIEF+ cells (cyan). Scale bar, 100 μm. B, Voltage-clamp recordings of the cells in A during illumination of oChIEF+ cells. Left and right, Example traces from the corresponding left and right fan cell clusters in A, respectively. In the schematics, cyan and black cells represent oChIEF+ cells and oChIEF− fan cells, respectively. C, Distribution of synaptic inputs onto fan cells after AAV injection in the DG/CA3. D, Individual fan cells show inhibition or combined inhibition excitation, but not pure excitation, assessed following AAV injection in the DG/CA3. E, Example average traces of outward (red) and inward (black) currents evoked from a single stimulation spot. Inset, Magnified view of the onset of postsynaptic currents, revealing a latency between outward and inward currents. F, Histogram showing average latency between EPSC and IPSC measured from currents evoked at the same laser stimulation position. G, Outward currents recorded following AAV injection into LEC are reversibly blocked by adding bicuculline, and partially restored upon washout. Left, Voltage-clamp traces. Average traces (red) are superimposed on the individual traces (gray). Right, Average current amplitudes before, during, and after bicuculline (n = 11 cells from 5 animals). Individual data points are plotted together with population average amplitude (blue line). H, Same as in G, but with the addition of DNQX/APV (n = 10 cells from four animals) instead of bicuculline.
Given that we did not observe any putative GABAergic cells among the recorded oChIEF-expressing cells (Fig. 9A,B), the outward currents observed in our data were likely disynaptic inhibitory events driven by the concurrent activation of oChIEF excitatory fibers. In line with a disynaptic coupling, we observed in fan cells receiving convergent excitatory and inhibitory input (n = 6) a short, but frequent, delayed onset for IPSCs relative to EPSCs evoked from the same laser stimulation spot (Fig. 10E,F). To prepare for a pharmacological test of these inhibitory connections, we sought to increase the efficacy of optogenetic stimulation by injecting AAV2/1-TRE-tight-oChIEF-Citrine directly into the LEC (Fig. 8). In these experiments, we confirmed the disynaptic inhibitory nature by demonstrating that outward currents could be reversibly blocked by bath application of either bicuculline (n = 11 cells from 5 animals; Fig. 10G) or DNQX/APV (n = 10 cells from four animals; Fig. 10H).
We occasionally recorded from other principal cell types in LII after virus injection in the DG/CA3. Our findings show that multiform (n = 10 of 17), oblique pyramidal (n = 2 of 2), and pyramidal cells (n = 2 of 4) all receive local inhibitory input when driving other RE+ LII excitatory cells. Excitatory inputs to multiform (n = 5 of 12) and pyramidal cells (n = 1 of 2) were also present, whereas oblique pyramidal cells were incompletely tested for excitatory connectivity.
Collectively, our voltage-clamp data confirm that fan cells receive sparse excitatory inputs from surrounding LII RE+ excitatory cells, which mainly include fan cells but also pyramidal, oblique pyramidal, and multiform cells. However, the prevailing local input to fan cells is disynaptic inhibition, which is observed more frequently than excitatory inputs. This demonstrates that the RE+ principal cell circuit in LEC LII is dominated by local recurrent inhibition.
Discussion
Our data collected from a combination of optogenetic stimulation experiments and multicell recordings point to sparse excitatory connectivity in the local network of fan cells. Several studies have recently emphasized low or nearly absent excitatory connectivity between pairs of stellate cells and between pairs of pyramidal cells in LII of MEC (Dhillon and Jones, 2000; Couey et al., 2013; Pastoll et al., 2013; Fuchs et al., 2016; Winterer et al., 2017), and between pyramidal cells in the superficial layers of the presubiculum (Peng et al., 2017). These observations collectively indicate that sparse excitatory connectivity is a recurring feature in LII of the parahippocampal region, present within at least four cell populations across MEC, LEC, and the presubiculum. This is in contrast to previous reports of higher connectivity among pyramidal cells in LIII (between 5% and 10%) and LV (∼12%) of MEC (Dhillon and Jones, 2000; Winterer et al., 2017). Furthermore, data on micronetworks in L2 of primary sensory cortices show a higher probability of connectivity between principal cells (∼9%) (Lefort et al., 2009; Jouhanneau et al., 2015; Seeman et al., 2018).
Putative disynaptic connections were encountered more frequently than monosynaptic connections in our simultaneous recordings of fan cells. In line with this observation, optogenetic activation of LEC LII excitatory cells routinely elicited disynaptic inhibitory events in a majority of the recorded fan cells, suggesting a strong indirect functional connection mediated by interneurons. This is similar to MEC stellate cells where local excitatory connections primarily target neighboring interneurons, leading stellate cells to interact primarily through the activity of these cells (Couey et al., 2013). Although such couplings have not been unequivocally demonstrated for pyramidal cells in MEC and the presubiculum, their prevalent connectivity with local inhibitory cells suggests that similar functional interactions also apply to these cell groups (Fuchs et al., 2016; Peng et al., 2017; Nassar et al., 2018). Hence, our data point to a fan cell local circuit architecture with a similar fundamental wiring motif as the MEC stellate cell, and possibly pyramidal cells in MEC and the presubiculum. Even though inhibitory disynaptic connectivity seems widespread both for MEC stellate and LEC fan cells, the underlying interneuron networks accountable for this inhibition might involve different cell types and modes of action. Our data suggest an important role for FS interneurons in mediating communication within the fan cell network through quick and robust presumed perisomatic inhibition. This input is accompanied by slow, but sustained, inhibitory synaptic inputs provided by nFS cells, similar in nature to inhibitory inputs targeting distal dendritic compartments (Miles et al., 1996; Silberberg and Markram, 2007). Similar to fan cells, MEC stellate cells are primarily targeted by FS interneurons (Couey et al., 2013; Pastoll et al., 2013; Fuchs et al., 2016). However, stellate cells receive additional inhibition mainly from LTS cells, and not from nFS cells (Fuchs et al., 2016), pointing to a potential important difference in inhibitory inputs between fan and stellate cells.
Although we now know that LEC and MEC develop from different parts of the pallium (Medina et al., 2017), fan cells and stellate cells have been considered counterparts in LII of LEC and MEC, respectively, because both are the dominant cell type contributing massively to the projections to DG, CA3, and CA2, and share morphological and immunohistochemical features (Germroth et al., 1989; Tahvildari and Alonso, 2005; Fuchs et al., 2016; Leitner et al., 2016). Our data add to the similarities between these cell types by showing that fan cells are interconnected in a circuit that shares the inhibitory motif characteristic of the MEC stellate cell network (Couey et al., 2013). Notwithstanding the observed differences in inhibitory components participating in the two respective networks, the overall similar coupling of these cell types has important implications for our understanding of ongoing computations underlying EC physiology. More specifically, although there are alternative models for the generation of the grid pattern (Witter and Moser, 2006; Burgess et al., 2007; Kropff and Treves, 2008; Islam and Yamaguchi, 2009; Naumann et al., 2016), an inhibition-dominated continuous attractor network receiving velocity-modulated head-direction inputs has been proposed to be sufficient to generate grid cell firing when navigating in space (Bonnevie et al., 2013; Couey et al., 2013; Pastoll et al., 2013). Support for this premise is present in the networks of MEC and presubiculum, two regions where principal cells are embedded in an inhibition-dominated network (Couey et al., 2013; Peng et al., 2017; Nassar et al., 2018) and contain grid cells (Hafting et al., 2005; Boccara et al., 2010). Our data show that a comparable network structure exists in an adjacent area where grid cells have not been described (Hargreaves et al., 2005). It is thus conceivable that, given the appropriate afferent input, neurons in LII of LEC will show hexagonal, or at least regularly repeating, firing patterns, along dimensions defined by their inputs. In contrast to the pure spatial representation observed in MEC, periodic patterns might arise in LEC to represent complex features of experience (Tsao et al., 2013, 2018; Knierim et al., 2014; Constantinescu et al., 2016).
Footnotes
This work was supported by Research Council of Norway Grant 227769, the Kavli Foundation, the Centre of Excellence scheme of the Research Council of Norway-Centre for Neural Computation Grant 223262, and the National Infrastructure scheme of the Research Council of Norway-NORBRAIN Grant 197467. We thank Pål Kvello for contributing to the initial part of the project; Paulo Girao for MATLAB programming; Maximiliano J. Nigro for stimulating discussions; Edvard I. Moser for helpful comments; and Jørgen Sugar and Øyvind W. Simonsen for commenting and proofreading the semifinal draft of the manuscript.
The authors declare no competing financial interests.
References
- Blankvoort S, Witter MP, Noonan J, Cotney J, Kentros C (2018) Marked diversity of unique cortical enhancers enables neuron-specific tools by enhancer-driven gene expression. Curr Biol 28:2103–2114.e5. 10.1016/j.cub.2018.05.015 [DOI] [PMC free article] [PubMed] [Google Scholar]
- Boccara CN, Sargolini F, Thoresen VH, Solstad T, Witter MP, Moser EI, Moser MB (2010) Grid cells in pre- and parasubiculum. Nat Neurosci 13:987–994. 10.1038/nn.2602 [DOI] [PubMed] [Google Scholar]
- Bonnevie T, Dunn B, Fyhn M, Hafting T, Derdikman D, Kubie JL, Roudi Y, Moser EI, Moser MB (2013) Grid cells require excitatory drive from the hippocampus. Nat Neurosci 16:309–317. 10.1038/nn.3311 [DOI] [PubMed] [Google Scholar]
- Burak Y, Fiete IR (2009) Accurate path integration in continuous attractor network models of grid cells. PLoS Comput Biol 5:e1000291. 10.1371/journal.pcbi.1000291 [DOI] [PMC free article] [PubMed] [Google Scholar]
- Burgess N, Barry C, O'Keefe J (2007) An oscillatory interference model of grid cell firing. Hippocampus 17:801–812. 10.1002/hipo.20327 [DOI] [PMC free article] [PubMed] [Google Scholar]
- Canto CB, Witter MP (2012a) Cellular properties of principal neurons in the rat entorhinal cortex: I. The lateral entorhinal cortex. Hippocampus 22:1256–1276. 10.1002/hipo.20997 [DOI] [PubMed] [Google Scholar]
- Canto CB, Witter MP (2012b) Cellular properties of principal neurons in the rat entorhinal cortex: II. The medial entorhinal cortex. Hippocampus 22:1277–1299. 10.1002/hipo.20993 [DOI] [PubMed] [Google Scholar]
- Cappaert NL, Van Strien NM, Witter MP (2015) Hippocampal formation. In: The rat nervous system, Ed 4 (Paxinos G, ed), pp 511–573. San Diego, CA: Academic. [Google Scholar]
- Constantinescu AO, O'Reilly JX, Behrens TE (2016) Organizing conceptual knowledge in humans with a gridlike code. Science 352:1464–1468. 10.1126/science.aaf0941 [DOI] [PMC free article] [PubMed] [Google Scholar]
- Couey JJ, Witoelar A, Zhang SJ, Zheng K, Ye J, Dunn B, Czajkowski R, Moser MB, Moser EI, Roudi Y, Witter MP (2013) Recurrent inhibitory circuitry as a mechanism for grid formation. Nat Neurosci 16:318–324. 10.1038/nn.3310 [DOI] [PubMed] [Google Scholar]
- Deshmukh SS, Knierim JJ (2011) Representation of non-spatial and spatial information in the lateral entorhinal cortex. Front Behav Neurosci 5:69. 10.3389/fnbeh.2011.00069 [DOI] [PMC free article] [PubMed] [Google Scholar]
- Dhillon A, Jones RS (2000) Laminar differences in recurrent excitatory transmission in the rat entorhinal cortex in vitro. Neuroscience 99:413–422. 10.1016/S0306-4522(00)00225-6 [DOI] [PubMed] [Google Scholar]
- Evers JF, Schmitt S, Sibila M, Duch C (2005) Progress in functional neuroanatomy: precise automatic geometric reconstruction of neuronal morphology from confocal image stacks. J Neurophysiol 93:2331–2342. 10.1152/jn.00761.2004 [DOI] [PubMed] [Google Scholar]
- Feldmeyer D, Egger V, Lubke J, Sakmann B (1999) Reliable synaptic connections between pairs of excitatory layer 4 neurones within a single ‘barrel’ of developing rat somatosensory cortex. J Physiol 521:169–190. 10.1111/j.1469-7793.1999.00169.x [DOI] [PMC free article] [PubMed] [Google Scholar]
- Fjeld G. (2015) Immunohistochemical and electrophysiological characterization of principal cells in layer II of the lateral entorhinal cortex, p 91 Master's thesis Department of Neuroscience, NTNU Norwegian University of Science and Technology, Trondheim, Norway. [Google Scholar]
- Fuchs EC, Neitz A, Pinna R, Melzer S, Caputi A, Monyer H (2016) Local and distant input controlling excitation in layer II of the medial entorhinal cortex. Neuron 89:194–208. 10.1016/j.neuron.2015.11.029 [DOI] [PMC free article] [PubMed] [Google Scholar]
- Fuhs MC, Touretzky DS (2006) A spin glass model of path integration in rat medial entorhinal cortex. J Neurosci 26:4266–4276. 10.1523/JNEUROSCI.4353-05.2006 [DOI] [PMC free article] [PubMed] [Google Scholar]
- Fyhn M, Molden S, Witter MP, Moser EI, Moser MB (2004) Spatial representation in the entorhinal cortex. Science 305:1258–1264. 10.1126/science.1099901 [DOI] [PubMed] [Google Scholar]
- Gentet LJ, Avermann M, Matyas F, Staiger JF, Petersen CC (2010) Membrane potential dynamics of GABAergic neurons in the barrel cortex of behaving mice. Neuron 65:422–435. 10.1016/j.neuron.2010.01.006 [DOI] [PubMed] [Google Scholar]
- Germroth P, Schwerdtfeger WK, Bühl EH (1989) Morphology of identified entorhinal neurons projecting to the hippocampus: a light microscopical study combining retrograde tracing and intracellular injection. Neuroscience 30:683–691. 10.1016/0306-4522(89)90161-9 [DOI] [PubMed] [Google Scholar]
- Guanella A, Kiper D, Verschure P (2007) A model of grid cells based on a twisted torus topology. Int J Neural Syst 17:231–240. 10.1142/S0129065707001093 [DOI] [PubMed] [Google Scholar]
- Hafting T, Fyhn M, Molden S, Moser MB, Moser EI (2005) Microstructure of a spatial map in the entorhinal cortex. Nature 436:801–806. 10.1038/nature03721 [DOI] [PubMed] [Google Scholar]
- Hargreaves EL, Rao G, Lee I, Knierim JJ (2005) Major dissociation between medial and lateral entorhinal input to dorsal hippocampus. Science 308:1792–1794. 10.1126/science.1110449 [DOI] [PubMed] [Google Scholar]
- Hoydal OA, Skytøen ER, Moser MB, Moser EI (2018) Object-vector coding in the medial entorhinal cortex. bioRxiv. Advance online publication. Retrived Mar 8, 2018 10.1101/286286. [DOI] [PubMed] [Google Scholar]
- Hu H, Gan J, Jonas P (2014) Interneurons: fast-spiking, parvalbumin(+) GABAergic interneurons: from cellular design to microcircuit function. Science 345:1255263. 10.1126/science.1255263 [DOI] [PubMed] [Google Scholar]
- Islam T, Yamaguchi Y (2009) Representation of an environmental space by grid fields: a study with a computational model of the grid cell based on a column structure. In: International Joint Conference on Neural Networks, pp 1357–1364. Atlanta, Georgia: IEEE. [Google Scholar]
- Jones RS, Bühl EH (1993) Basket-like interneurones in layer II of the entorhinal cortex exhibit a powerful NMDA-mediated synaptic excitation. Neurosci Lett 149:35–39. 10.1016/0304-3940(93)90341-H [DOI] [PubMed] [Google Scholar]
- Jouhanneau JS, Kremkow J, Dorrn AL, Poulet JF (2015) In vivo monosynaptic excitatory transmission between layer 2 cortical pyramidal neurons. Cell Rep 13:2098–2106. 10.1016/j.celrep.2015.11.011 [DOI] [PMC free article] [PubMed] [Google Scholar]
- Kawaguchi Y, Katsumaru H, Kosaka T, Heizmann CW, Hama K (1987) Fast spiking cells in rat hippocampus (CA1 region) contain the calcium-binding protein parvalbumin. Brain Res 416:369–374. 10.1016/0006-8993(87)90921-8 [DOI] [PubMed] [Google Scholar]
- Keene CS, Bladon J, McKenzie S, Liu CD, O'Keefe J, Eichenbaum H (2016) Complementary functional organization of neuronal activity patterns in the perirhinal, lateral entorhinal, and medial entorhinal cortices. J Neurosci 36:3660–3675. 10.1523/JNEUROSCI.4368-15.2016 [DOI] [PMC free article] [PubMed] [Google Scholar]
- Kitamura T, Pignatelli M, Suh J, Kohara K, Yoshiki A, Abe K, Tonegawa S (2014) Island cells control temporal association memory. Science 343:896–901. 10.1126/science.1244634 [DOI] [PMC free article] [PubMed] [Google Scholar]
- Knierim JJ. (2015) From the GPS to HM: place cells, grid cells, and memory. Hippocampus 25:719–725. 10.1002/hipo.22453 [DOI] [PubMed] [Google Scholar]
- Knierim JJ, Neunuebel JP, Deshmukh SS (2014) Functional correlates of the lateral and medial entorhinal cortex: objects, path integration and local-global reference frames. Philos Trans R Soc Lond B Biol Sci 369:20130369. 10.1098/rstb.2013.0369 [DOI] [PMC free article] [PubMed] [Google Scholar]
- Koelbl C, Helmstaedter M, Lübke J, Feldmeyer D (2015) A barrel-related interneuron in layer 4 of rat somatosensory cortex with a high intrabarrel connectivity. Cereb Cortex 25:713–725. 10.1093/cercor/bht263 [DOI] [PMC free article] [PubMed] [Google Scholar]
- Kropff E, Treves A (2008) The emergence of grid cells: intelligent design or just adaptation? Hippocampus 18:1256–1269. 10.1002/hipo.20520 [DOI] [PubMed] [Google Scholar]
- Kropff E, Carmichael JE, Moser MB, Moser EI (2015) Speed cells in the medial entorhinal cortex. Nature 523:419–424. 10.1038/nature14622 [DOI] [PubMed] [Google Scholar]
- Lefort S, Tomm C, Floyd Sarria JC, Petersen CC (2009) The excitatory neuronal network of the C2 barrel column in mouse primary somatosensory cortex. Neuron 61:301–316. 10.1016/j.neuron.2008.12.020 [DOI] [PubMed] [Google Scholar]
- Leitner FC, Melzer S, Lütcke H, Pinna R, Seeburg PH, Helmchen F, Monyer H (2016) Spatially segregated feedforward and feedback neurons support differential odor processing in the lateral entorhinal cortex. Nat Neurosci 19:935–944. 10.1038/nn.4303 [DOI] [PubMed] [Google Scholar]
- Lu L, Leutgeb JK, Tsao A, Henriksen EJ, Leutgeb S, Barnes CA, Witter MP, Moser MB, Moser EI (2013) Impaired hippocampal rate coding after lesions of the lateral entorhinal cortex. Nat Neurosci 16:1085–1093. 10.1038/nn.3462 [DOI] [PubMed] [Google Scholar]
- McNaughton BL, Battaglia FP, Jensen O, Moser EI, Moser MB (2006) Path integration and the neural basis of the ‘cognitive map.’ Nat Rev Neurosci 7:663–678. 10.1038/nrn1932 [DOI] [PubMed] [Google Scholar]
- Medina L, Abellán A, Desfilis E (2017) Contribution of genoarchitecture to understanding hippocampal evolution and development. Brain Behav Evol 90:25–40. 10.1159/000477558 [DOI] [PubMed] [Google Scholar]
- Miles R, Tóth K, Gulyás AI, Hájos N, Freund TF (1996) Differences between somatic and dendritic inhibition in the hippocampus. Neuron 16:815–823. 10.1016/S0896-6273(00)80101-4 [DOI] [PubMed] [Google Scholar]
- Nassar M, Simonnet J, Huang LW, Mathon B, Cohen I, Bendels MH, Beraneck M, Miles R, Fricker D (2018) Anterior thalamic excitation and feed-forward inhibition of presubicular neurons projecting to medial entorhinal cortex. J Neurosci 38:6411–6425. 10.1523/JNEUROSCI.0014-18.2018 [DOI] [PMC free article] [PubMed] [Google Scholar]
- Naumann RK, Ray S, Prokop S, Las L, Heppner FL, Brecht M (2016) Conserved size and periodicity of pyramidal patches in layer 2 of medial/caudal entorhinal cortex. J Comp Neurol 524:783–806. 10.1002/cne.23865 [DOI] [PMC free article] [PubMed] [Google Scholar]
- Nicoll RA, Malenka RC, Kauer JA (1990) Functional comparison of neurotransmitter receptor subtypes in mammalian central nervous system. Physiol Rev 70:513–565. 10.1152/physrev.1990.70.2.513 [DOI] [PubMed] [Google Scholar]
- Pastoll H, Solanka L, van Rossum MC, Nolan MF (2013) Feedback inhibition enables theta-nested gamma oscillations and grid firing fields. Neuron 77:141–154. 10.1016/j.neuron.2012.11.032 [DOI] [PubMed] [Google Scholar]
- Peng Y, Barreda Tomás FJ, Klisch C, Vida I, Geiger JRP (2017) Layer-specific organization of local excitatory and inhibitory synaptic connectivity in the rat presubiculum. Cereb Cortex 27:2435–2452. 10.1093/cercor/bhx049 [DOI] [PMC free article] [PubMed] [Google Scholar]
- Pilkiw M, Insel N, Cui Y, Finney C, Morrissey MD, Takehara-Nishiuchi K (2017) Phasic and tonic neuron ensemble codes for stimulus-environment conjunctions in the lateral entorhinal cortex. Elife 6:e28611. 10.7554/eLife.28611 [DOI] [PMC free article] [PubMed] [Google Scholar]
- Sargolini F, Fyhn M, Hafting T, McNaughton BL, Witter MP, Moser MB, Moser EI (2006) Conjunctive representation of position, direction, and velocity in entorhinal cortex. Science 312:758–762. 10.1126/science.1125572 [DOI] [PubMed] [Google Scholar]
- Schmitt S, Evers JF, Duch C, Scholz M, Obermayer K (2004) New methods for the computer-assisted 3-D reconstruction of neurons from confocal image stacks. Neuroimage 23:1283–1298. 10.1016/j.neuroimage.2004.06.047 [DOI] [PubMed] [Google Scholar]
- Seeman SC, Campagnola L, Davoudian PA, Hoggarth A, Hage TA, Bosma-Moody A, Baker CA, Lee JH, Mihalas S, Teeter C, Ko AL, Ojemann JG, Gwinn RP, Silbergeld DL, Cobbs C, Phillips J, Lein Ed, Murphy G, Koch C, Zeng H, et al. (2018) Sparse recurrent excitatory connectivity in the microcircuit of the adult mouse and human cortex. bioRxiv. Advance online publication. Retrived May 28, 2018 10.1101/292706 [DOI] [PMC free article] [PubMed] [Google Scholar]
- Sekerli M, Del Negro CA, Lee RH, Butera RJ (2004) Estimating action potential thresholds from neuronal time-series: new metrics and evaluation of methodologies. IEEE Trans Biomed Eng 51:1665–1672. 10.1109/TBME.2004.827531 [DOI] [PubMed] [Google Scholar]
- Silberberg G, Markram H (2007) Disynaptic inhibition between neocortical pyramidal cells mediated by Martinotti cells. Neuron 53:735–746. 10.1016/j.neuron.2007.02.012 [DOI] [PubMed] [Google Scholar]
- Solstad T, Boccara CN, Kropff E, Moser MB, Moser EI (2008) Representation of geometric borders in the entorhinal cortex. Science 322:1865–1868. 10.1126/science.1166466 [DOI] [PubMed] [Google Scholar]
- Tahvildari B, Alonso A (2005) Morphological and electrophysiological properties of lateral entorhinal cortex layers II and III principal neurons. J Comp Neurol 491:123–140. 10.1002/cne.20706 [DOI] [PubMed] [Google Scholar]
- Tsao A, Moser MB, Moser EI (2013) Traces of experience in the lateral entorhinal cortex. Curr Biol 23:399–405. 10.1016/j.cub.2013.01.036 [DOI] [PubMed] [Google Scholar]
- Tsao A, Sugar J, Lu L, Wang C, Knierim JJ, Moser MB, Moser EI (2018) Integrating time from experience in the lateral entorhinal cortex. Nature 561:57–62. 10.1038/s41586-018-0459-6 [DOI] [PubMed] [Google Scholar]
- Van Cauter T, Poucet B, Save E (2008) Unstable CA1 place cell representation in rats with entorhinal cortex lesions. Eur J Neurosci 27:1933–1946. 10.1111/j.1460-9568.2008.06158.x [DOI] [PubMed] [Google Scholar]
- Van Cauter T, Camon J, Alvernhe A, Elduayen C, Sargolini F, Save E (2013) Distinct roles of medial and lateral entorhinal cortex in spatial cognition. Cereb Cortex 23:451–459. 10.1093/cercor/bhs033 [DOI] [PubMed] [Google Scholar]
- Varga C, Lee SY, Soltesz I (2010) Target-selective GABAergic control of entorhinal cortex output. Nat Neurosci 13:822–824. 10.1038/nn.2570 [DOI] [PMC free article] [PubMed] [Google Scholar]
- Wilson DI, Langston RF, Schlesiger MI, Wagner M, Watanabe S, Ainge JA (2013) Lateral entorhinal cortex is critical for novel object-context recognition. Hippocampus 23:352–366. 10.1002/hipo.22095 [DOI] [PMC free article] [PubMed] [Google Scholar]
- Winterer J, Maier N, Wozny C, Beed P, Breustedt J, Evangelista R, Peng Y, D'Albis T, Kempter R, Schmitz D (2017) Excitatory microcircuits within superficial layers of the medial entorhinal cortex. Cell Rep 19:1110–1116. 10.1016/j.celrep.2017.04.041 [DOI] [PubMed] [Google Scholar]
- Witter MP, Moser EI (2006) Spatial representation and the architecture of the entorhinal cortex. Trends Neurosci 29:671–678. 10.1016/j.tins.2006.10.003 [DOI] [PubMed] [Google Scholar]
- Yoganarasimha D, Rao G, Knierim JJ (2011) Lateral entorhinal neurons are not spatially selective in cue-rich environments. Hippocampus 21:1363–1374. 10.1002/hipo.20839 [DOI] [PMC free article] [PubMed] [Google Scholar]