Abstract
Neurons in multiple brain regions fire trains of action potentials anticipating specific movements, but this “preparatory activity” has not been systematically compared across behavioral tasks. We compared preparatory activity in auditory and tactile delayed-response tasks in male mice. Skilled, directional licking was the motor output. The anterior lateral motor cortex (ALM) is necessary for motor planning in both tasks. Multiple features of ALM preparatory activity during the delay epoch were similar across tasks. First, most neurons showed direction-selective activity and spatially intermingled neurons were selective for either movement direction. Second, many cells showed mixed coding of sensory stimulus and licking direction, with a bias toward licking direction. Third, delay activity was monotonic and low-dimensional. Fourth, pairs of neurons with similar direction selectivity showed high spike-count correlations. Our study forms the foundation to analyze the neural circuit mechanisms underlying preparatory activity in a genetically tractable model organism.
SIGNIFICANCE STATEMENT Short-term memories link events separated in time. Neurons in the frontal cortex fire trains of action potentials anticipating specific movements, often seconds before the movement. This “preparatory activity” has been observed in multiple brain regions, but has rarely been compared systematically across behavioral tasks in the same brain region. To identify common features of preparatory activity, we developed and compared preparatory activity in auditory and tactile delayed-response tasks in mice. The same cortical area is necessary for both tasks. Multiple features of preparatory activity, measured with high-density silicon probes, were similar across tasks. We find that preparatory activity is low-dimensional and monotonic. Our study forms a foundation for analyzing the circuit mechanisms underlying preparatory activity in a genetically tractable model organism.
Keywords: motor planning, premotor cortex, preparatory activity, short-term memory
Introduction
Motor planning links past events to future movements. Neurons in the frontal and parietal cortex and related brain regions show persistent or ramping changes in spike rate during different types of short-term memory, including motor planning (Fuster and Alexander, 1971; Kubota and Niki, 1971; Bruce and Goldberg, 1985; Miyashita, 1988; Funahashi et al., 1989; Riehle and Requin, 1989; Goldman-Rakic, 1995; Romo et al., 1999; Maimon and Assad, 2006; Erlich et al., 2011; Ames et al., 2014; Liu et al., 2014; Murakami et al., 2014; Guo et al., 2014a). Neural correlates of motor planning, referred to here as “preparatory activity,” anticipate movements and have selectivity for specific movements (such as saccade location, or movement direction of the hand, wrist, or tongue).
In nonhuman primates, preparatory activity has been detected in the primary motor cortex (Tanji and Evarts, 1976; Riehle and Requin, 1989; Alexander and Crutcher, 1990), the premotor or supplemental motor cortex (Riehle and Requin, 1989; Alexander and Crutcher, 1990; Churchland et al., 2010), the frontal eye field (FEF; Bruce and Goldberg, 1985; Hanes and Schall, 1996), the parietal cortex (Gnadt and Andersen, 1988; Maimon and Assad, 2006), the striatum (Alexander and Crutcher, 1990; Ding and Gold, 2010), the superior colliculus (Wurtz and Goldberg, 1972), the motor-related thalamus (Tanaka, 2007), and the cerebellum (Ohmae et al., 2017). Within each of these brain regions, neurons show activity patterns with diverse dynamics. A subset of these neurons ramps in anticipation of movement onset (Bruce and Goldberg, 1985; Funahashi et al., 1989; Riehle and Requin, 1989).
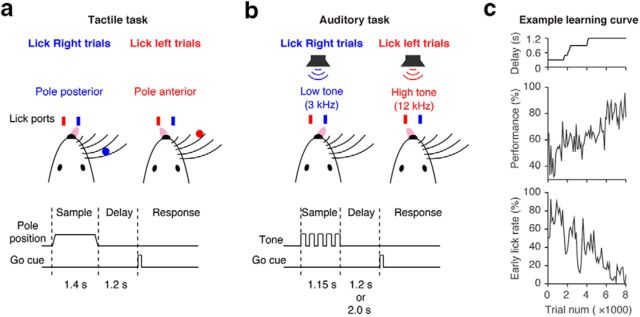
Motor planning has also been studied in rodents (Erlich et al., 2011), including mice performing a delayed-response task (Guo et al., 2014a). An instruction informs the type of action to be performed. A go cue determines the timing of the action. The instruction and go cue are separated by a delay epoch. In mice performing a tactile delayed-response licking task (Guo et al., 2014a; Fig. 1a), a large proportion of neurons in the anterior lateral motor cortex (ALM) exhibit preparatory activity that predicts directional licking (Guo et al., 2014a; Chen et al., 2017). Optogenetic manipulations have provided evidence that preparatory activity in the ALM underlies motor planning (Guo et al., 2014a; Li et al., 2015, 2016; Svoboda and Li, 2017).
Figure 1.
Behavioral tasks. a, Schematic, tactile task. During the delay epoch, an object is presented within reach of the whiskers in one of two locations. Mice report the location of the object by directional licking. b, Schematic, auditory task. Mice discriminate the frequency of tones presented during the sample epoch. c, Example learning curve, auditory task. The delay duration was gradually increased (top). Behavioral performance improved with training, while early lick rates decreased (middle and bottom).
Simultaneous recordings of multiple neurons have provided a comprehensive description of the population dynamics underlying motor planning. Over time, populations of neurons trace out a trajectory in activity space, where each neuron corresponds to a dimension of activity space. These activity trajectories occupy a low-dimensional manifold (Gao and Ganguli, 2015). The detailed structure of the activity trajectories during motor planning predicts parameters of the future movements (Shenoy et al., 2013; Li et al., 2016). The endpoints of trajectories could reflect optimal “initial conditions” for specific planned movements (Churchland et al., 2006).
Here we explored the dynamics of populations of ALM neurons in several types of delayed-response tasks in mice. In addition to preparatory activity, the ALM also shows sensory coding (Chen et al., 2017). An open question is whether ALM dynamics depend on sensory modality. To identify task-invariant features of the dynamics underlying motor planning, we developed an auditory delayed-response task and compared it to a previously reported tactile delayed-response task (Guo et al., 2014a). We found that the ALM is required for motor planning independent of the sensory modality. ALM neurons showed direction-selective ramping activity for both tasks. Many features of ALM activity were similar across the tasks, including direction selectivity, the properties of ramping activity, the dimensionality of the neural dynamics, and the spike-count correlations across neurons.
Materials and Methods
Mice.
This study is based on 27 mice (age, older than post-natal day 60; male only). We used four transgenic mouse lines: PV-IRES-cre (RRID:IMSR_JAX:008069; Hippenmeyer et al., 2005), Olig3-cre (Vue et al., 2009), Ai32 [Rosa-CAG-LSL-ChR2(H134R)-EYFP-WPRE, RRID:IMSR_JAX:012569; Madisen et al., 2012], VGAT-ChR2-EYFP (RRID:IMSR_JAX:014548; Zhao et al., 2011). Eight PV-ires-cre × Ai32 mice were used for behavioral experiments (Fig. 2). Nineteen mice were used for recordings. Some of these mice were in addition used for optogenetic experiments not described in this paper (Inagaki et al., 2017). Because optogenetic manipulations in one trial did not affect performance and spike rate in the next trial (see Tables 2, 3), we pooled data from these different experiments after excluding trials with optogenetic stimulation.
Figure 2.
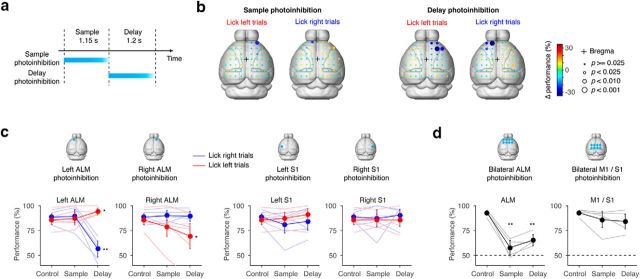
ALM is required for motor-planning. a, Schematic, photoinhibition of the ALM either during the sample epoch or the delay epoch. Cortical regions were photoinhibited for 1.2 s starting at the onset of the sample or delay epochs (relevant to b–d). The photostimulus was ramped down over the last 200 ms to avoid rebound activity (Guo et al., 2014a). b, Spatial maps of behavioral effects caused by photoinhibition during the sample epoch (left) and the delay epoch (right). Performance compared with the control condition (Δperformance) is shown in color code. Spot sizes indicate p values based on hierarchical bootstrap (see Materials and Methods). p values <0.001 were significant even after correction for multiple comparisons (Benjamini–Hochberg procedure). Data based on three animals, 104 sessions; 50,594 trials (75.1 ± 9.5 stimulation trials per spot, mean ± SD) for the sample photoinhibition; 50,585 trials (101.2 ± 10.8 stimulation trials per spot, mean ± SD) for the delay photoinhibition. Control performance was 83.0 ± 4.0% (mean ± SD) for lick right trials, 85.1 ± 0.9% (mean ± SD) for lick left trials. c, Behavioral effects of unilateral ALM photoinhibition. Top, Locations of photoinhibition. Bottom, Behavioral performance. Thick lines, Grand mean performance (n = 5 animals); thin lines, mean performance for each animal. Error bar, SEM based on hierarchical bootstrap (see Materials and Methods); Sample, Trials with photoinhibition in the sample epoch; Delay, trials with photoinhibition in the delay epoch. The whisker representation area of the primary somatosensory cortex (S1) was photoinhibited as a control (see Materials and Methods for coordinates). Data based on five animals, 47 sessions, 12,556 control trials, and 3385 stimulation trials in total. p values are based on hierarchical bootstrap. **p < 0.001; *p < 0.05 (both without correction for multiple comparisons. Only ** have p < 0.05 after Bonferroni correction). d follows the same format. See Table 4 for p values. d, Behavioral effects of bilateral ALM photoinhibition. Eight spots surrounding the ALM in both hemispheres were photoinhibited (see Materials and Methods). M1 was inhibited as a control (see Materials and Methods for coordinate). Data based on four animals, 40 sessions, 6096 control trials, and 1125 stimulation trials in total. From left to right, p values < 0.0001, 0.0001, and p = 0.0767, 0.0736 (hierarchical bootstrap, 10,000 iterations, without correction for multiple comparison).
Table 2.
Performance explained by previous trial types
| Tactile task (delay 1.2 s) | Auditory task (delay 1.2 s) | Auditory task (delay 2.0 s) | |
|---|---|---|---|
| Intercept | 1.38; p = 2.47e−118 | 1.91; p = 6.68e−88 | 1.68; p = 1.03e−60 |
| Direction of previous trial (same direction, 1; not same, 0) | −0.0763; p = 0.145 | 0.349; p = 0.000132 | −0.152; p = 0.0652 |
| Performance of previous trial (correct, 1; incorrect, 0) | 0.194; p = 0.00109 | 0.465; p = 4.61e−6 | 0.500; p = 1.63e−7 |
| Optogenetic manipulation in previous trial (yes, 1; no, 0) | 0.0586; p = 0.359 | 0.216; p = 0.070 | −0.137; p = 0.101 |
| Variance explained | 0.14% | 0.57% | 0.67% |
| Variance explained by regression with interactions | 0.17% | 0.59% | 0.68% |
| Number of trials analyzed | 9952 | 7212 | 5191 |
Coefficients and variance explained of a logistic regression as follows: logit(Outcome) ∼ 1 + Prev_dir + Prev_correct + Stim. Outcome, Performance of current trial (correct, 1; incorrect, 0); Prev_dir, direction of previous trial; Prev_correct, performance of previous trials; Stim, optogenetic manipulation in previous trial.
Table 3.
Variance of spike rate explained by previous trial types
| Tactile task (delay 1.2 s) | Auditory task (delay 1.2 s) | Auditory task (delay 2.0 s) | |
|---|---|---|---|
| Direction | 0.44% (1.9 e−3 ∼ 3.9%) | 0.30% (3.2 e−5 ∼ 4.1%) | 0.41% (6.4 e−4 ∼ 6.2%) |
| Performance | 0.74% (2.3 e−3 ∼ 9.7%) | 0.36% (3.3 e−4 % ∼ 7.8%) | 0.80% (9.0 e−4 ∼ 12.5%) |
| Optogenetic manipulation | 0.17% (5.1 e−4 ∼ 2.2%) | 0.031% (0 ∼ 2.4%) | 0.21% (3.7 e−4 ∼ 2.6%) |
| All variance together (sum of top 3 rows and interactions) | 2.2% (0.48 ∼ 16.9%) | 1.2% (0.34 ∼ 14.3%) | 2.2% (0.59 ∼ 17.8%) |
Variance of spike rates in the presample epoch explained by previous trial. We performed multifactor two-way ANOVA to test whether direction, performance, optogenetic manipulation, and their interactions affected the spike rate in each pyramidal cell. The median (top) and 95% range (bottom, 2.5 ∼ 97.5%) of the variance explained are shown in the table. The remaining variance is unexplained by previous trial type. Consistent with the effect of previous trials on behavior (Table 2), performance of the previous trial affected the spike rates the most, while the optogenetic manipulation affected the spike rates the least.
All procedures were in accordance with protocols approved by the Janelia Institutional Animal Care and Use Committee. Detailed information on water restriction, surgical procedures, and behavior have been published (Guo et al., 2014b). All surgical procedures were carried out aseptically under 1–2% isoflurane anesthesia. Buprenorphine HCl (0.1 mg/kg, intraperitoneal injection; Bedford Laboratories) was used for postoperative analgesia. Ketoprofen (5 mg/kg, subcutaneous injection; Fort Dodge Animal Health) was used at the time of surgery and postoperatively to reduce inflammation. After the surgery, mice were allowed ad libitum access to water for ≥3 d before start of water restriction. Mice were housed in a 12:12 reverse light/dark cycle and behaviorally tested during the dark phase. A typical behavioral session lasted 1–2 h and mice obtained all of their water in the behavior apparatus (∼1 ml per day; 0.3 ml was supplemented if mice drank <0.5 ml). On other days mice received 1 ml of water per day. Mice were implanted with a titanium headpost. For ALM photoinhibition, mice were implanted with a clear-skull cap (Guo et al., 2014a). Craniotomies for recordings were made after behavioral training.
Behavior.
For the tactile task, at the beginning of each trial, a metal pole (diameter, 0.9 mm) moved within reach of the whiskers (0.2 s travel time) for 1.0 s, after which it was retracted (0.2 s retraction time; Fig. 1a). The sample epoch (1.4 s total) was the time from onset of the pole movement to completion of the pole retraction (Fig. 1a). The delay epoch lasted for another 1.2 s after completion of pole retraction. An auditory go cue separated the delay and the response epochs (pure tone, 3.4 kHz, 0.1 s).
For the auditory task (Fig. 1b), at the beginning of each trial, five repetitive tones were presented at one of two frequencies: 3 or 12 kHz. Each tone was played for 150 ms with 100 ms between tones. The sample epoch (1.15 s total) was the time from onset of the first tone to completion of the last tone (Fig. 1b). The delay epoch lasted for another 1.2 or 2.0 s after completion of the last tone. An auditory go cue with intermediate frequency (carrier frequency of 6 kHz, with 360 Hz modulating frequency to make it distinct from instruction tones) separated the delay and the response epochs (0.1 s). To compensate the sound intensity for the tuning of the auditory system of C57BL/6 mice (Taberner and Liberman, 2005), the sound pressure was 80, 70, and 60 dB for 3, 6, and 12 kHz sound, respectively. These frequencies are relatively invulnerable to the hearing loss experienced by C57BL/6 mice (Ison et al., 2007).
In both tasks, a two-spout lickport (4.5 mm between spouts) was used to record licking events and deliver water rewards. After the go cue, licking the correct lickport produced a water reward (∼2 μl); licking the incorrect lickport triggered a timeout (0–5 s). Licking early during the trial (“lick early” trials) triggered a timeout (1 s). Trials in which mice did not lick within 1.5 s after the go cue (“no response” trials) were rare and typically occurred at the end of behavioral sessions. No response trials and lick early trials were excluded from analyses. For training, we started with short delay (0 s for the tactile task, 0.3 s for the auditory task) and gradually increased the delay duration (Fig. 1c).
Photoinhibition.
Photoinhibition was deployed on 33–50% (Fig. 2b) or 25% (Fig. 2c,d) of behavioral trials. To prevent mice from distinguishing photoinhibition trials from control trials using visual cues, a “masking flash” (40 × 1 ms pulses at 10 Hz) was delivered using 470 nm LEDs (Luxeon Star) near the eyes of the mice throughout the trial. Photostimuli from a 473 nm laser (Laser Quantum) were controlled by an acousto-optical modulator (Quanta Tech) and a shutter (Vincent Associates).
Photoinhibition of the ALM was performed through a clear-skull cap (beam diameter at the skull: 400 μm at 4 σ; Guo et al., 2014a). The light transmission through the intact skull is 50% (Guo et al., 2014a). We stimulated parvalbumin (PV)-positive interneurons expressing channelrhodopsin-2 (ChR2) in PV-IRES-Cre mice crossed to Ai32 reporter mice (Fig. 2). Behavioral and electrophysiological experiments showed that photoinhibition in the PV-IRES-Cre × Ai32 mice was indistinguishable from that of the VGAT-ChR2-EYFP mice (Guo et al., 2017). Photoinhibition silences a cortical area of 1 mm radius (at half-maximum) through all cortical layers (Guo et al., 2014a).
To silence the cortex unilaterally during the sample or delay epoch (Fig. 2b,c), we photostimulated for 1.2 s, including the 200 ms ramp, starting at the beginning of the sample or delay epoch. We used 40 Hz photostimulation with a sinusoidal temporal profile (1.5 mW average power) and a 200 ms linear ramp during laser offset (this reduced rebound neuronal activity). We used scanning Galvo mirrors to inactivate different locations of the cortex. For the screen (Fig. 2a), photoinhibition location was randomly selected for each trial. For Figure 2c, we photoinhibited the ALM (relative to bregma: anterior, 2.5 mm; lateral, 1.5 mm) or S1 (relative to bregma: posterior, 1.5 mm; lateral, 3.5 mm).
To silence the ALM bilaterally (Fig. 2d), we photostimulated four spots centering the ALM or M1 (relative to bregma: anterior, 0 mm; lateral, 1.5 mm) in each hemisphere with 1 mm spacing (total, eight spots) using scanning Galvo mirrors. We photoinhibited each spot sequentially, with 5 ms per step. We photostimulated with constant laser power with the 200 ms ramp at the end. Mean laser power was 1.5 mW per spot.
Behavioral data analysis.
Behavioral performance was the fraction of correct trials, excluding trials where mice violated the delay epoch (lick early trials) and trials without response (no response trials). Early lick rate was the fraction of lick early trials, excluding no response trials.
For statistics (Fig. 2), we performed hierarchical bootstrapping: first, we randomly selected animals with replacement; second, we randomly selected sessions within an animal with replacement; and finally, we randomly selected trials within the session with replacement (Efron and Tibshirani, 1994; van der Leeden, 2008; Aarts et al., 2014; Guo et al., 2014a). For each photoinhibition condition, we counted the number of bootstrap trials that have lower performance than control trials. If <2.5% or >97.5% trials were higher, we concluded that the stimulation resulted in significant effect (α = 0.05).
Extracellular electrophysiology.
A small craniotomy (diameter, 0.5 mm) was made over the left ALM hemisphere 1 d before the recording session. Extracellular spikes were recorded using Janelia silicon probes with two shanks (250 μm between shanks; part #A2x32-8 mm-25-250-165). The 64-channel voltage signals were multiplexed, recorded on a PCI6133 board (National Instruments) and digitized at 400 kHz (14 bit). The signals were demultiplexed into the 64 voltage traces sampled at 25 kHz and stored for off-line analysis. One to five recording sessions were obtained per craniotomy. Recording depth was inferred from manipulator readings (Table 1). The craniotomy was filled with cortex buffer (125 mm NaCl, 5 mm KCl, 10 mm glucose, 10 mm HEPES, 2 mm MgSO4, 2 mm CaCl2; pH adjusted to 7.4). The tissue was allowed to settle for ≥5 min before the recording started.
Table 1.
Summary of units and performance
| Tactile task (delay 1.2 s) | Auditory task (delay 1.2 s) | Auditory task (delay 2.0 s) | |
|---|---|---|---|
| Mice | 7 | 6 | 6 |
| Recording sessions | 30 | 37 | 20 |
| Recording sessions for session-based analysisa | 19 | 31 | 20 |
| Units | 566 | 639 | 755 |
| Putative pyramidal cells | 471 | 539 | 667 |
| Putative FS neurons | 77 | 85 | 74 |
| Selective pyramidal cells (Fig. 5a–c) | 431 (91.5% of pyramidal cells) | 478 (88.7% of pyramidal cells) | 618 (92.7% of pyramidal cells) |
| Delay-selective cells Fig. 6a–c, top, middle) | 324 (68.8% of pyramidal cells) | 340 (63.1% of pyramidal cells) | 422 (63.3% of pyramidal cells) |
| Behavioral performanceb | |||
| Mean ± SD | 80.3 ± 10.1% | 91.4 ± 7.0% | 87.2 ± 8.4% |
| Range | 60.3–93.4% | 69.2–99.7% | 73.6–98.7% |
| Early lick rateb | 5.7 ± 5.1% (mean ± SD) | 9.5 ± 9.4% (mean ± SD) | 5.4 ± 3.5% (mean ± SD) |
| Reaction timec | 264 ± 109 ms (mean ± SD) | 257 ± 99 ms (mean ± SD) | 327 ± 101 ms (mean ± SD) |
| Trialsb | 357 ± 71 (mean ± SD) | 343 ± 132 (mean ± SD) | 307 ± 55 (mean ± SD) |
| Recording depth | 397–985 μm (5–95 percentile) | 389–946 μm (5–95 percentile) | 365–984 μm (5–95 percentile) |
aFor session-based analysis (Figs. 15,16), recording sessions with >5 simultaneously recorded pyramidal cells were analyzed.
bBehavioral performance, early lick rates, reaction time, and trial number were calculated based on behavioral sessions. In some cases (8 sessions in auditory tasks with 1.2 s delay), we moved the recording probes within a behavioral session to record units from different depths. In this case we scored two recording sessions per behavioral session.
cReaction time was not significantly different among task types. p value without Bonferroni correction for multiple comparison: 0.9670 for comparison between tactile task and auditory task (1.2 s delay); 0.0415 for comparison between tactile task and auditory task (2.0 s delay), based on Mann-Whitney U test.
Extracellular recording data analysis.
The extracellular recording traces were bandpass filtered (300–6000 Hz). Events that exceeded an amplitude threshold (4 SDs above the background) were sorted using JRclust (Jun et al., 2017b).
Units were classified based on spike width. Spike widths were computed as the trough-to-peak interval in the mean spike waveform. Units with width <0.35 ms were classified as putative fast-spiking GABAergic interneurons (FS neurons), and units with width >0.5 ms as putative pyramidal neurons. Units with intermediate spike widths (0.35–0.5 ms) were excluded from our analyses. This scheme was verified by optogenetic tagging of PV-positive neurons (data not shown; Guo et al., 2014a). See Table 1 for number of sessions and units. Only putative pyramidal neurons were analyzed for all the figures, except Figure 9.
Figure 9.
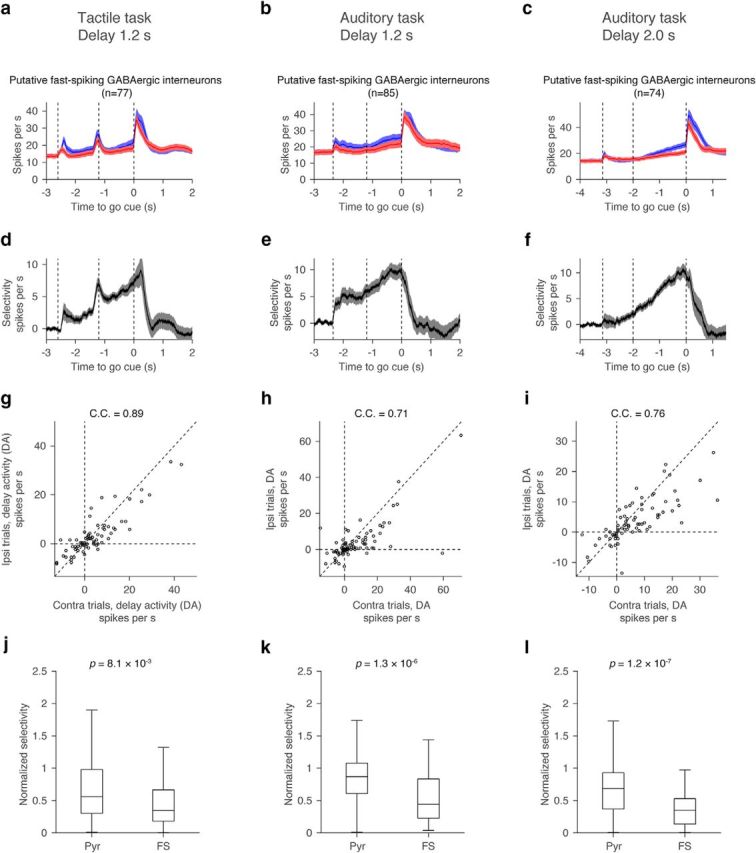
Selectivity of putative FS neurons. a–c, Grand mean PSTH for all FS neurons. Shadow, SEM (bootstrap). d–f, Grand mean selectivity of FS neurons with significant delay selectivity. Shadow, SEM (bootstrap). g–i, Distribution of contralateral and ipsilateral DA for all FS neurons. Each circle corresponds to each cell. C.C., Correlation coefficient of contralateral and ipsilateral DA. Diagonal dashed line, Line with slope 1. j–l, Normalized selectivity of putative pyramidal neurons (pyr) and FS neurons. For these figures, normalized selectivity was measured for neurons with positive DA (DAcontra + DAipsi > 0). Central line in the box plot is the median. Top and bottom edges are 75 and 25 percentage points, respectively. The whiskers show the lowest datum within 1.5 interquartile range (IQR) of the lower quartile, and the highest datum within 1.5 IQR of the upper quartile. P values, Mann–Whitney U test.
Neurons were tested for trial-type selectivity during the sample, delay, and response epochs by comparing spike counts during contralateral trials (contra trials) and ipsilateral trials (ipsi trials) in each epoch (Mann–Whitney U test, p < 0.05; see Fig. 5). To compute “contra-selectivity” for each neuron, we calculated spike-rate difference between the contra and ipsi trials (SRt,contra − SRt,ipsi, where SR denotes spike rate at each time point t in each trial type; Fig. 3a). To compute “normalized contra-selectivity” we normalized the contra-selectivity by the peak value for each neuron (see Fig. 5a–c).
Figure 5.
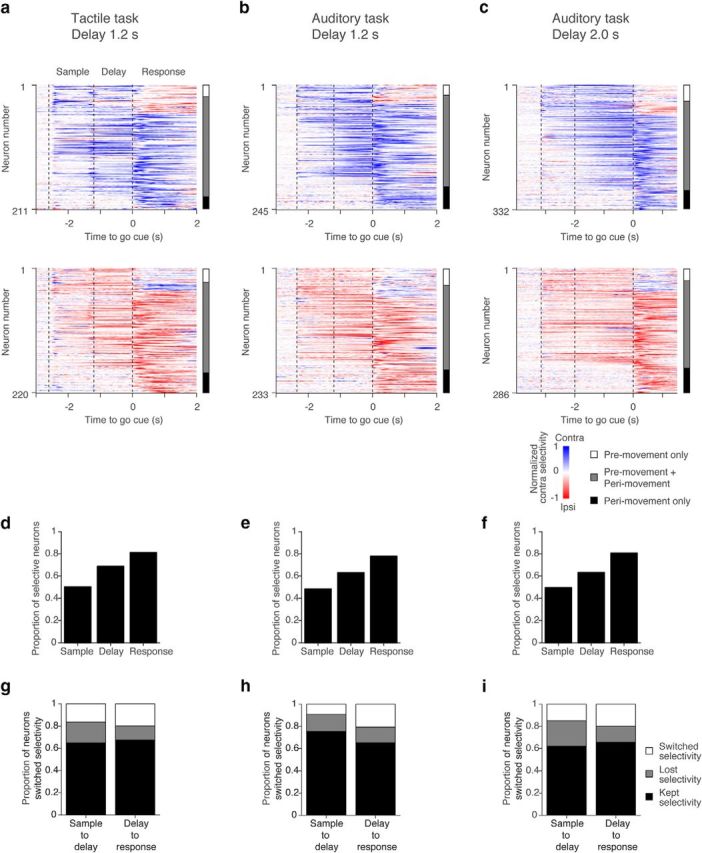
Selectivity in ALM. a–c, ALM population selectivity. Top, Cells with higher spike counts across all trial epochs in the contra trials. Bottom, Cells with higher spike counts in the ipsi trials. Each row represents contralateral selectivity normalized by the peak selectivity of individual neurons (blue, contralateral; red, ipsilateral). Vertical bars on the right. White, Neurons with premovement (sample or delay epoch) selectivity only; gray, both premovement and perimovement (response epoch) selectivity; black, perimovement selectivity. d–f, Proportion of neurons with selectivity in each epoch. g–i, Proportion of neurons that kept, lost, or switched selectivity between epochs.
Figure 3.
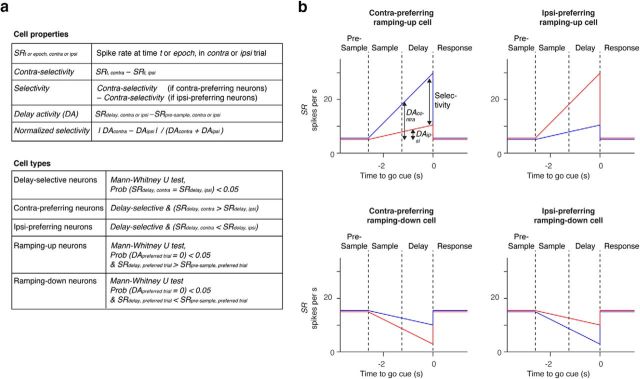
Classification of neural activity patterns. a, Parameters used to classify activity patterns. b, Schematics illustrating activity patterns. Blue, Spike rates in contra trials. Red, Spike rates in ipsi trials.
Neurons with selectivity during the delay epoch were further classified as “contra-preferring” or “ipsi-preferring,” based on their mean spike rate during the delay epoch (Figs. 3a, 6). Selectivity is the absolute spike-rate difference between the two trial types (Fig. 3a; see Fig. 6d–f). We defined “delay activity” (DA) as the difference of spike rate between the baseline presample epoch and the delay epoch in each neuron (SRdelay,contra or ipsi − SRpre-sample,contra or ipsi; Figs. 3a, 7–9). We refer to neurons with increasing DA in the preferred direction as ramping-up cells, and neurons with decreasing DA in the preferred direction as ramping-down cells (Mann–Whitney U test, p < 0.05; Figs. 3a, 7).
Figure 6.
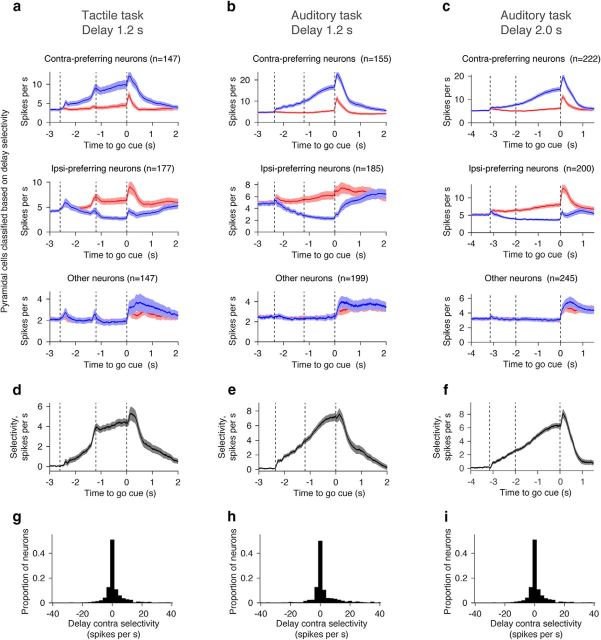
Selectivity and mean PSTH. a–c, Grand mean PSTH for cells with different types of delay selectivity. Shadow, SEM (bootstrap). d–f, Grand mean selectivity for cells with significant delay selectivity (see Materials and Methods). Shadow, SEM (bootstrap). g–i, Distribution of delay contralateral selectivity. Bin size, 2.5 spikes per second.
Figure 7.
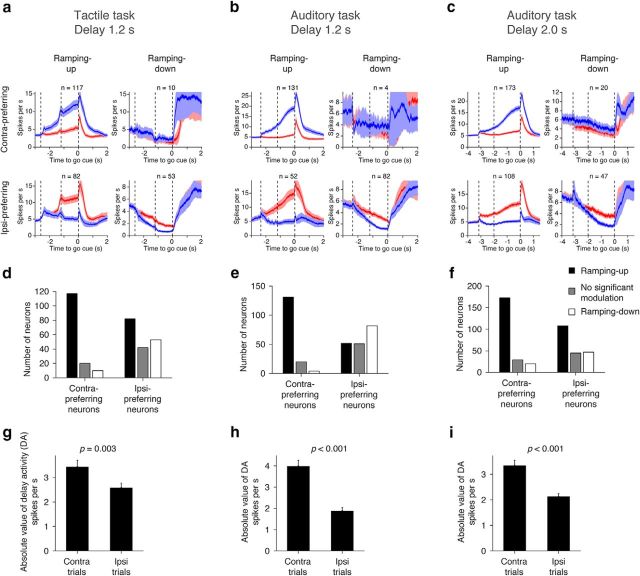
Selectivity and ramping. a–c, Grand mean PSTH of contra-preferring and ipsi-preferring cells with different ramping directions. Ramping up/down was tested in the preferred direction (Mann–Whitney U test, p < 0.05). Shadow, SEM (bootstrap). d–f, Numbers of neurons with different ramping directions. g–i, Comparison of the absolute value of DA (see Materials and Methods) between the contra and ipsi trials. Mean ± SEM (bootstrap) is shown in the bar graph. All putative pyramidal cells were included. P value is based on bootstrap with 1000 iterations testing a null hypothesis that contralateral DA is lower than ipsilateral DA.
For the peristimulus time histograms (PSTHs), only correct trials were included, unless specified (see Fig. 11e–h). Spikes were averaged over 100 ms with 1 ms steps. Bootstrapping was used to estimate SEM.
Figure 11.
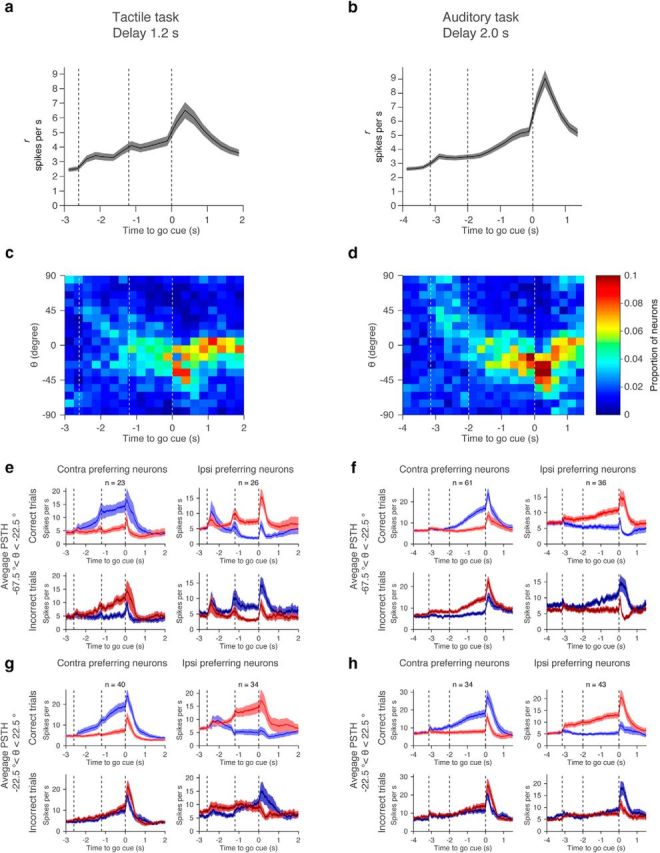
Coding of selectivity over time. a, b, Amplitude of selectivity (r) over time. Mean and SEM (1000 permutations). c, d, Histogram of θ over time. Bin size: 10° for θ and 250 ms for time. Mean of 1000 permutation. To calculate θ, we selected cells with r > 2 (Fig. 10a,b). Because of the ramping, the number of analyzed neurons increased during the delay epoch. e, f, Grand mean PSTH of cells coding motor output (−67.5° < θ < −22.5°). Shadow, SEM (bootstrap). g, h, Grand mean PSTH of cells with mixed-selectivity coding (−22.5° < θ < 22.5°). Shadow, SEM (bootstrap).
Analysis of selectivity.
To test what cells are coding (sensory input and/or movement), we compared selectivity in the correct trials and incorrect trials (see Figs. 10, 11). We defined r and θ as follows:
 |
We analyzed neurons with >10 incorrect trials for each trial type [incorrect lick-right (IR) and incorrect lick-left (IL) trials]. Cells with r < 2 were excluded from the analysis of θ. The SEMs (bootstrap) of the angle measurement were 17.4° and 18.3° for the tactile task and auditory task, respectively.
Figure 10.
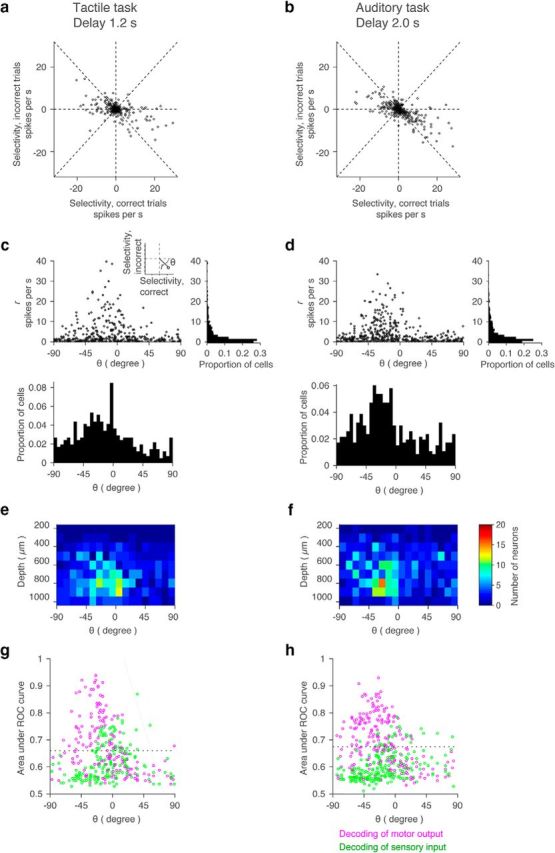
Coding during the delay epoch. a, b, Relationship between selectivity in correct and incorrect trials. We analyzed cells with >10 incorrect trials for each trial type (IR and IL trials). Each point corresponds to each cell. Dashed lines: horizontal, vertical, and lines with slope 1 and −1. c, d, Scatter plot and histogram of polar coordinates (r and θ) in a and b. Inset, The definition of r and θ. Bin size: 5° for θ, 1 spike per second for r. e, f, Distribution of θ across cortical depth. Bin size: 10° for θ, 100 μm for depth. g, h, Decoding of motor and sensory information using ROC (see Materials and Methods). θ And area under ROC curve for motor output (magenta) and sensory input (green) are shown for each cell. Dashed line, 95% confident interval of shuffled data (see Materials and Methods). Cells that have proportion correct higher than the dashed line were judged as cells decoding sensory or motor information.
Receiver operating characteristic analysis.
For receiver operating characteristic (ROC) analysis, we analyzed neurons with >10 incorrect trials for each trial type (IR and IL trials; see Fig. 10g,h). For each cell, we randomly subsampled 10 trials each of correct lick right (CR) trials, correct lick left (CL) trials, IR trials, and IL trials. To decode sensory input, we pooled CR and IR trials, and CL and IL trials. We computed an ROC curve for each neuron and calculated the area under the curve (see Fig. 10g,h). To decode motor output, we pooled CR and IL trials, and CL and IR trials. The area under the curve <0.5 was subtracted from 1. Chance level performance was calculated by shuffling trial types (CR, CL, IR, and IL). This permutation was repeated 1000 times for each cell to determine 95% confidence interval.
Toy models.
We modeled 50 neurons for each scenario (see Fig. 12). For the scenario in which each neuron shows ramping activity (see Fig. 12a), the spike rate of each neuron linearly ramps from 0 to maximum rates ranging from 0.6 to 30 Hz (uniform distribution). For the scenario in which each neuron shows bump-like activity (see Fig. 12b), the nth neuron follows the activity pattern (fn): fn = (n + 1)gn, where gn = and τ denotes the time constant of each neuron (25 ms). These activity patterns result from a cascade of linear filters as follows: ; with an input pulse at time t = 0 [δ(t)] to the first filter as follows: .
Figure 12.
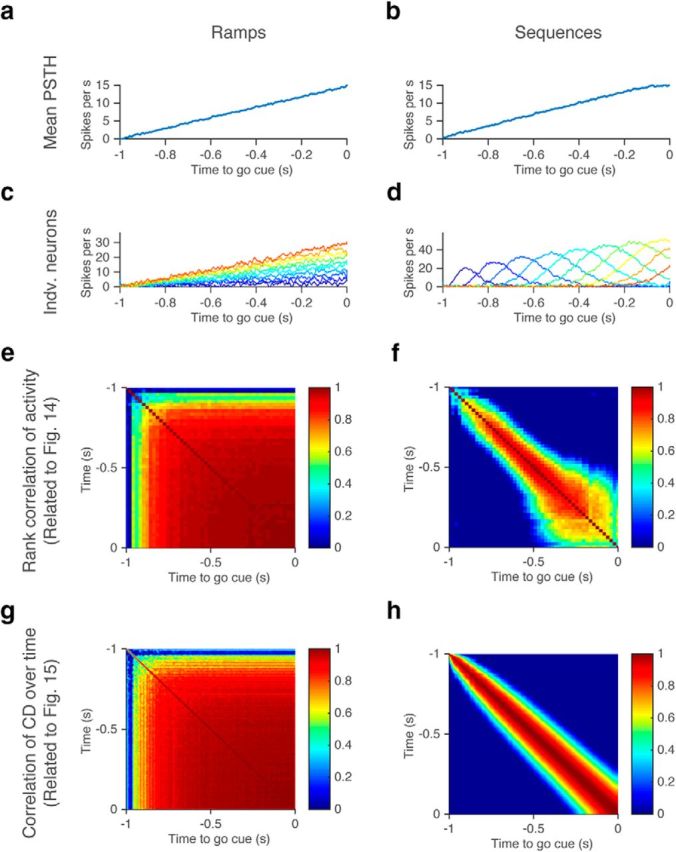
Two possible models producing ramping activity on average. a, b, Mean PSTH of all modeled cells in c and d. c, d, PSTH of individual modeled cells with ramping (c) or with bumps at different timing (d; see Materials and Methods). Eleven of 50 modeled cells are shown. e, f, Rank correlation of neural activities over time (Fig. 14). g, h, Stability of CD over time (Fig. 15).
The multiplication by n + 1 ensures ramping across neurons (modified from Goldman, 2009, Fig. 1). In both cases, we added Gaussian noise (σ = 3 spikes per second), and averaged over 10 ms (see Fig. 12c,d). We calculated rank correlation, and stability of the coding direction (CD; see Fig. 12e–h) in the same way as for the data (see below).
Peak analysis.
For each neuron with delay selectivity, we randomly selected half of the contra trials to calculate mean spike rate (as in other analyses, spike rates were averaged over 100 ms; see Fig. 13). We identified the time point with maximum spike rate during the delay epoch. Similarly, we calculated the mean spike rate for the remaining trials and identified the peak timing. We repeated this procedure 1000 times. Density of peak locations between two halves of trials is shown in pseudocolor (see Fig. 13g–i). As a control, we shuffled timing of spikes in each trial within the delay epoch. After shuffling, we followed the same procedures described above. This procedure was repeated 1000 times. Results of analyzing ipsi trials were similar (data not shown). Results of analyzing all pyramidal neurons were similar, too (data not shown).
Figure 13.
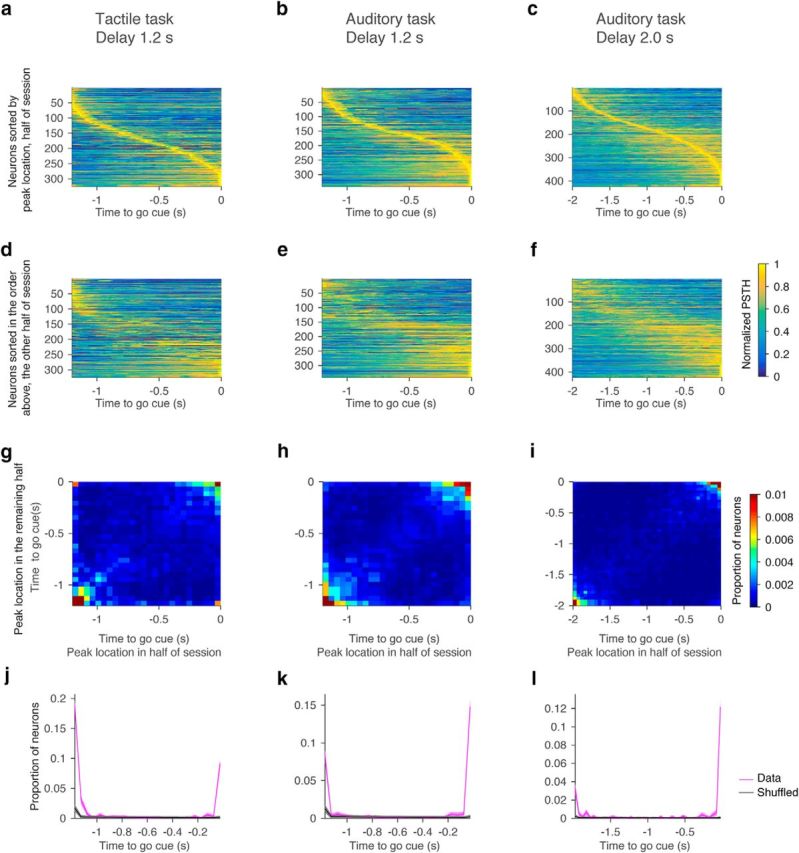
Activity peaks are at the beginning or end of the delay epoch. a–c, Location of activity peaks in randomly selected half of trials. Neurons were sorted by the activity peak location. Each row, PSTH of each cell normalized by its peak (colormap). d–f, Location of activity peaks in the remaining half of trials. Neurons were sorted in the same order as in a–c. g–i, Heatmaps indicating the density of peaks in the randomly selected half of trials and in the rest of trials (see Materials and Methods). Bin size, 50 ms. j–l, Proportion of neurons with peak at each time point (magenta). This corresponds to proportion of neurons on the positive diagonal axis in g–i. Black, Chance level (Materials and Methods). Shadow, SEM (bootstrap).
Population vector analysis.
For the session-based analysis (see Figs. 15, 16), recording sessions with >5 simultaneously recorded pyramidal cells were analyzed. To calculate CD for a population of n simultaneously recorded neurons, we found an n × 1 vector maximally distinguishing two trial types (contra and ipsi trials), in the n dimensional activity space. To compare CD over time (see Fig. 15i–k), we calculated average spike rates in contra and ipsi trials separately for each neuron. Then, and are n × 1 vectors of average spike rates at a time point t (10 ms step). The difference in the mean spike-rate vector, →t = was divided by its own norm, which defines the CD at the time point. Pearson's correlations between CDs across time points are shown in Figure 15i–k.
Figure 15.
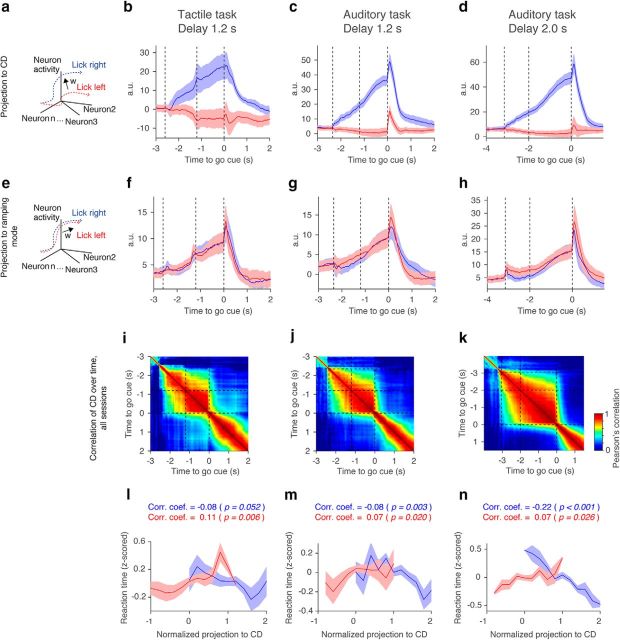
Stability of the CD. a, Definition of CD as the direction that best differentiates trial-type-related activity. b–d, Projection to the CD. Shadow, SEM (bootstrap). e, The RM is the first SVD mode capturing the largest remaining variance not explained by CD (see Materials and Methods). It captures nonselective ramping as shown in f–h. f–h, Projection to the RM. Shadow, SEM (bootstrap). i–k, Stability of CD. CD was calculated at each time point and compared with CD calculated at a different time point using Pearson's correlation (see Materials and Methods). l–n, Relationship between normalized CD and reaction time (see Materials and Methods). Trials from all sessions were pooled and binned (see Materials and Methods). Lower values correspond to faster reaction times. Normalized projection to CD; 0, corresponds to median activity on ipsi trials; 1, same for contra trials. Note that the projection to the CD and the reaction time show negative correlations in contra trials but positive correlations in ipsi trials. p, Probability that correlation coefficient is significantly different from 0 (hierarchical bootstrap).
Figure 16.
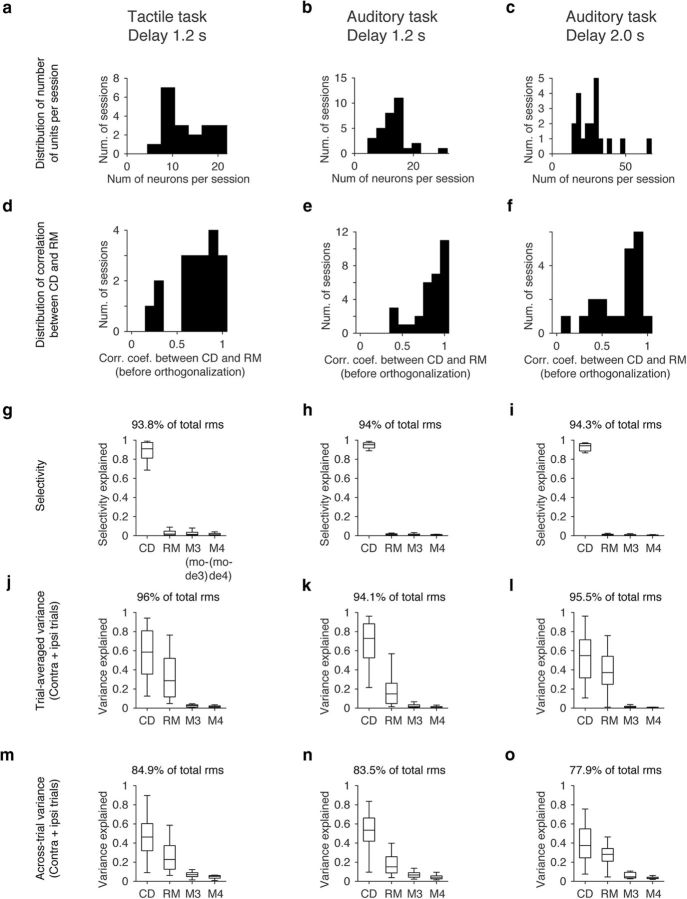
Variance explained by each mode. a–c, Distribution of number of putative pyramidal neurons simultaneously recorded. Because we used probes with fewer dead sites in the auditory task with 2.0 s delay, the yield was better. d–f, Distribution of correlation coefficient between CD and RM (before orthogonalization to CD) weights. Bin size, 0.1. g–i, Selectivity explained by CD, RM, and remaining top two SVD modes (M3 and M4; see Materials and Methods). Sum of four modes are shown on top (mean across sessions). Central line in the box plot is the median. Top and bottom edges are the 75 and 25 percentage points, respectively. The whiskers show the lowest datum within 1.5 interquartile range (IQR) of the lower quartile, and the highest datum within 1.5 IQR of the upper quartile. j–o follow the same format. j–l, Trial-average variance explained by each mode (see Materials and Methods). m–o, Across-trial variance explained by each mode (see Materials and Methods).
Since correlation of CDs was high during the delay epoch, for other figures (see Figs. 15b–d, 16) we averaged →t during the last 600 ms of the delay epoch and normalized by its own norm to obtain the CD. We calculated the CD based on randomly selected half of trials. To obtain trajectories along the CD, we projected the spike rate in the remaining trials to the CD as an inner product (see Fig. 15b–d). To calculate the “selectivity explained” (see Fig. 16g–i), we first calculated the total selectivity as a square sum of the selectivity across neurons (square sum of n × 1 vector). Then we calculated the square of selectivity of the projection along the CD, and divided it by the total selectivity. Here, selectivity was calculated based on the last 600 ms of the delay epoch. To calculate the “trial-average variance” (see Fig. 16j–l), we first calculated the total variance as a square sum of the mean DA (the last 600 ms of the delay epoch) across neurons in each trial type (contra and ipsi trial; square sum of n × 2 matrix). Then we calculated the square sum of the mean DA in projection along the CD. We divided this value by the total variance. To calculate “across-trial variance” (see Fig. 16m–o), we first calculated the total variance as a square sum of the DA (the last 600 ms of the delay epoch) across neurons and across trials (square sum of n × trial-number matrix). Then we calculated the square sum of the DA in projection along the CD across trials. We divided this value by the total variance. For decoding of future licking direction based on the CD, we adopted previous schemes (Li et al., 2016). To analyze the relationship between activity along the CD and reaction times (see Fig. 15l–n), projection along the CD was normalized: we calculated the median of each distribution (contralateral and ipsilateral) in correct trials. The projection along the CD was normalized by the difference of these two medians (ipsilateral peak at 0; contralateral peak at 1). We normalized the reaction time by calculating the z score per session. After pooling all trials across sessions, we calculated the correlation coefficient between the normalized projection along the CD and the normalized reaction time. To plot Fig. 15l–n, trials were binned every 0.2 (the projection along the CD, a.u.). Bins with <50 trials were excluded from the plots.
To find modes explaining the remaining activity variance [ramping mode (RM), mode 3 (M3), and mode 4 (M4)], we first found eigenvectors of the population activity matrix using singular value decomposition (SVD) at each time point and averaged over the last 600 ms of the delay epoch. The data for SVD at each time point was n × trial-number matrix. We analyzed the first three eigenvectors from the SVD. All these vectors were rotated using the Gram–Schmidt process to be orthogonal to the CD and to each other. Since the projection to the first vector resulted in nonselective ramping activity (see Fig. 15f–h), we referred to this vector as an RM. The other two vectors are M3 and M4.
Spike-count correlation.
To calculate spike-count correlation among neurons, we first calculated DA vector () of each neuron in contra trials (see Figs. 17, 18). is trial number × 1 vector, consisting of the DA in each trial. Then we calculated Pearson's correlation between vectors of different neurons recorded in the same session. Neurons were classified into four classes: contralateral ramping-up neurons, ipsilateral ramping-up neurons, ramping-down neurons (contralateral ramping-down neurons were excluded from analysis because there were so few such neurons; see Fig. 7), and all the other neurons. As a control, we shuffled the trial label in each neuron independently to remove across-cell correlation without affecting the mean spike rate of each neuron. To calculate p value, we performed the Mann–Whitney U test (two-sided) comparing spike-count correlations of the data and the shuffled data.
Figure 17.
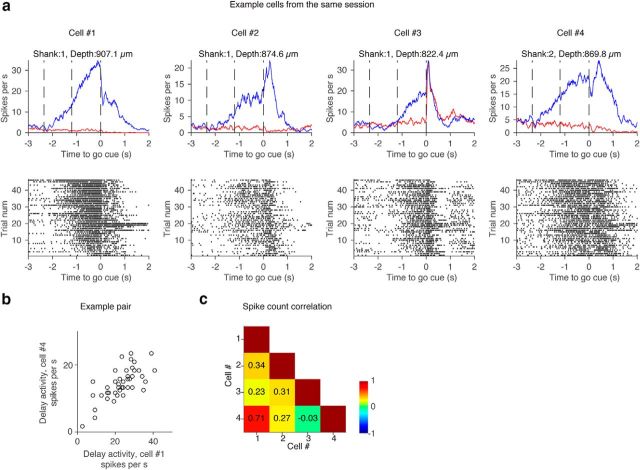
Example spike-count correlation. a, Top, Grand mean PSTH of ramping-up cells from the same session. Shank and the depth of each cell are shown. Bottom, Spike raster in contra trials. Contra trials in all cells were sorted based on the rank order of spike count during the delay epoch in Cell 1. b, Relationship of contralateral DA in two example cells. Each circle represents a trial. c, Spike-count correlation in contra trials calculated for all combinations of example cells. Grid color represents the value of spike-count correlation (color bar).
Figure 18.
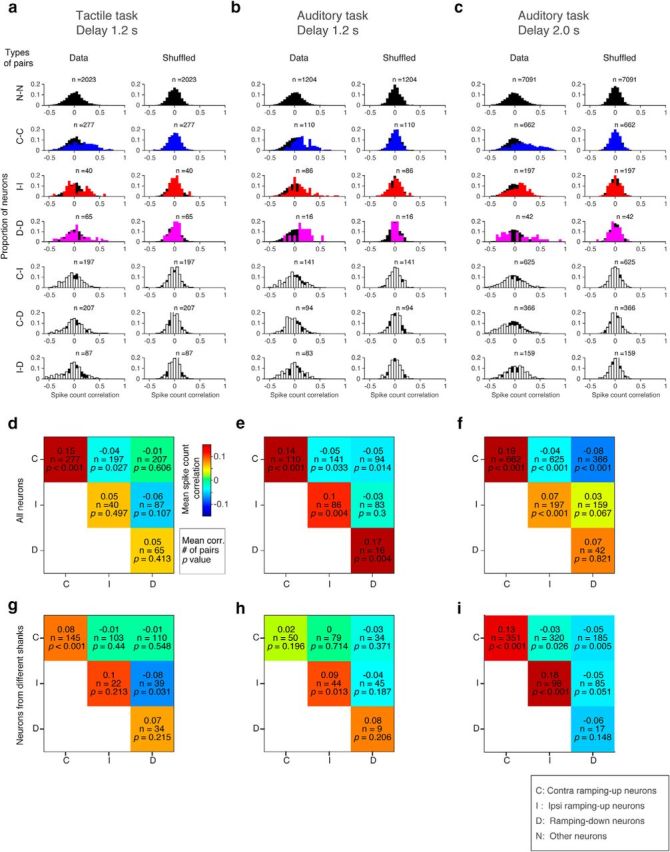
Spike-count correlation. a–c, Distribution of spike-count correlation between different subtypes of neurons in contra trials (left). Distribution is overlaid on top of the distribution of nonselective cells (black) for comparison. As a control, trials were shuffled for each neuron. Spike-count correlation of the shuffled data is shown in the same format (right). C, Contra-preferring ramping-up cells; I, ipsi-preferring ramping-up cells; D, ipsi-preferring ramping-down cells; N, other cells. Numbers of pairs are shown on top of the histogram. d–f, Mean spike-count correlation between different subtypes of neurons in contra trials. Spike-count correlation is shown in pseudocolor (colormap: red, positive; blue, negative). Numbers of samples and p values (see Materials and Methods) are shown below the noise correlation in each grid. g–i, Mean noise correlation between different subtypes of neurons from different shanks.
Statistics and data.
The sample sizes are similar to sample sizes used in the field (more than a few hundred units per task). No statistical methods were used to determine sample size. We did not exclude any animal for data analysis. Trial types were randomly determined by a computer program during the experiment. During spike sorting, experimenters could not tell the trial type, so experimenters were blind to conditions. All bootstrapping was done over 1000 iterations, unless otherwise described. Datasets will be shared at CRCNS.ORG in the NWB (Neurodata without Borders) format https://www.nwb.org/.
Results
Task design
We developed an auditory delayed-response task for head-fixed mice and compared behavior and neural dynamics to the tactile delayed-response task (Fig. 1, compare a, b). In the auditory task, the instruction was five tones played at one of two frequencies (3 or 12 kHz). In the tactile task, the instruction was a pole presented to either anterior or posterior location within reach of the whiskers. The instruction stimuli were presented during the sample epoch, which was followed by a delay epoch (1.2 or 2.0 s). The delay epoch was terminated by a brief (0.1 s) go cue (6 kHz for the sound task, 3.4 kHz for the tactile task). During the response epoch animals reported the instruction by licking either the right or left lick port. Premature licking responses resulted in a timeout (early lick). Individual mice were trained for specific tasks (Guo et al., 2014b). Criterion performance was 80% correct trials with early-lick rate <20% (Fig. 1c). Performance during recording was 86.1 ± 9.8% (mean ± SD) with 7.0 ± 6.9% (mean ± SD) early-lick rate (Table 1). No mice were excluded based on behavioral performance.
We used logistic regression to test for correlations in behavioral performance across trials. We tested the effects of licking direction, performance (correct or incorrect), and optogenetic manipulation. Although there were significant effects of previous trials, the total variance explained by previous trials was <1% in all cases (Table 2). Previous trials also had only minor effects on spike rates during the baseline period before the sample epoch (presample epoch; median of variance explained <2.2% in all tasks; Table 3). We therefore treated trials as independent.
The ALM is required for motor planning
The ALM (relative to bregma: anterior, 2.5 mm; lateral 1.5 mm; Komiyama et al., 2010) is required for motor planning in the tactile delayed-response task (Guo et al., 2014a). To identify the dorsal neocortical regions required for motor planning in the auditory delayed-response task, we performed an inactivation screen (Guo et al., 2014a). Small parts of the cortex (approximate radius, 1 mm; Guo et al., 2014a) were “photoinhibited” by photostimulating ChR2 expressed in PV-positive interneurons [PV-ires-cre (Hippenmeyer et al., 2005) × Ai32 (Madisen et al., 2012) animals]. We photoinhibited 48 sites during the sample or delay epochs (Fig. 2a). Photoinhibiting the anterior frontal cortex unilaterally during the delay epoch biased future licking responses in the ipsilateral direction (Fig. 2b). The cortical area that caused a directional bias when silenced is indistinguishable from the ALM (Guo et al., 2014a). We did not detect any dorsal cortical region as required during the sample epoch. We confirmed the involvement of the ALM in five additional mice (Fig. 2c; Table 4). Moreover, bilateral inactivation of the ALM during the sample or delay epoch resulted in near chance-level performance (Fig. 2d; Li et al., 2016). Bilateral inactivation in nearby cortical regions (posterior to the ALM by 2 mm) did not affect performance. The fact that even sample epoch inactivation resulted in chance-level performance implies that other brain regions cannot rescue motor planning after ALM silencing. Finally, bilateral silencing during the first or second half of the 2 s delay epoch produced chance-level performance (Inagaki et al., 2017). Altogether, the ALM is necessary for motor planning in a delayed-response licking task regardless of sensory modality and delay duration.
Table 4.
p values in Fig. 2c
| Photoinhibition location | Left ALM |
Right ALM |
Left S1 |
Right S1 |
||||
|---|---|---|---|---|---|---|---|---|
| Epoch | Sample | Delay | Sample | Delay | Sample | Delay | Sample | Delay |
| Lick left trials | 0.3440 | 0.0196 | 0.1116 | 0.0147 | 0.3170 | 0.0786 | 0.5244 | 0.5369 |
| Lick right trials | 0.6489 | <0.0001 | 0.3057 | 0.4130 | 0.1064 | 0.3061 | 0.4802 | 0.3036 |
p values are based on hierarchical bootstrap, 10,000 iterations, without correction for multiple comparison (see Materials and Methods).
DA in the ALM
We recorded single units from the ALM using high-density silicon probes (Table 1; Fig. 3, 4). All recordings were performed in the left ALM. Therefore, contralateral and ipsilateral directions refer to right and left licking, respectively. Correct lick right or left trials are referred to as contra trials (blue) or ipsi trials (red), respectively. We classified units into regular-spiking and fast-spiking neurons units based on their spike widths (see Materials and Methods; Guo et al., 2014a). Here we focus on regular spiking units, or putative pyramidal neurons, unless otherwise described.
Figure 4.
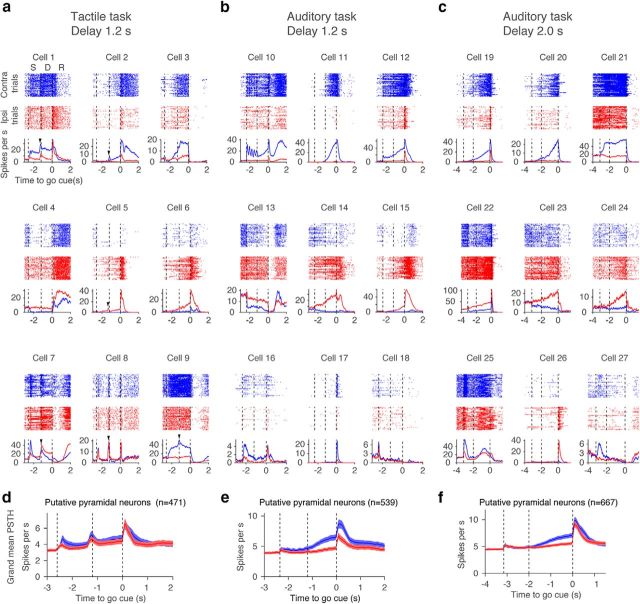
Example neurons in the ALM. a–c, Nine example ALM neurons for each task type. Top, Spike rasters. Bottom, PSTH. Blue, correct lick right trials (Contra trials); red, correct lick left trials (Ipsi trials). Randomly selected 50 trials are shown per trial type. Dashed lines separate behavioral epochs. S, Sample epoch; D, delay epoch; R, response epoch. Time is relative to the go cue. Arrowheads indicate phasic activity at the beginning of the delay epoch. d–f, Grand mean PSTH for all pyramidal cells. Shadow, SEM (bootstrap).
Most putative pyramidal neurons (88%; Table 1) showed significant selectivity (trial-type difference in spike count, Mann–Whitney U test, p < 0.05) in ≥1 of the three epochs (sample, delay, response epochs; Fig. 5a–f). Proportions of selective neurons were lowest during the sample epoch, and highest during the response epoch (Fig. 5d–f). Most selective cells showed both “premovement” and “perimovement” selectivity (Fig. 5a–c, bar). Some cells switched the sign of their selectivity between epochs (<20% under all conditions; Fig. 5g–i).
Sample epoch activity differed across the behavioral tasks (Fig. 4a–c). In the tactile task, many neurons showed a phasic signal at the transition from sample to delay epoch (Fig. 4a, arrowheads). The grand mean spike rate of putative pyramidal neurons also showed this phasic response (Fig. 4d). This response is likely caused by a transient increase in whisker movement and touch input at the end of the sample epoch (Guo et al., 2014a; Chen et al., 2017). In contrast, in the auditory task, some neurons showed spike-rate changes that were phase-locked to the five repeated presentations of the tones (Fig. 4b, Cell 10).
During the delay epoch, neural dynamics were diverse within a task (Fig. 4a–c), but the types of dynamics were similar across tasks (Fig. 4a–c). Many cells showed ramping-up activity during the delay epoch on contra trials (Fig. 4a–c, Cells 2, 11, 12, 19, and 20) or ipsi trials (Cells 5, 6, 14, 15, 23, and 24). Other cells showed ramping-down or suppression during the delay epoch, mainly in contra trials (Cells 4, 13, 14, and 23). Some nonselective cells showed small changes in activity during the delay epoch (Cells 18 and 27). In the rest of this paper we focus on delay epoch activity, because this activity is necessary for motor planning (Fig. 2).
More than 63% of pyramidal cells showed significant selectivity during the delay epoch (Table 1, delay-selective cells; Figs. 3a, 6a–c). We refer to cells with significantly higher spike rate (SR) during the delay epoch of the contra trials as “contra-preferring neurons” and vice versa (Mann–Whitney U test, p < 0.05; Fig. 3a). In all tasks, contra-preferring neurons and ipsi-preferring neurons were spatially intermingled within a hemisphere (Fig. 6a–c, compare top, middle), which is consistent with previous reports about the ALM, other brain regions, and other species (Funahashi et al., 1989; Erlich et al., 2011; Li et al., 2015). Although we classified cells into three classes, the distribution of selectivity was continuous (Fig. 6g–i). The selectivity of contra-preferring or ipsi-preferring cells ramped to the beginning of the response epoch (Fig. 6d–f). On average, contra-preferring neurons ramped up during the contra trials, with little modulation during the ipsi trials (Fig. 6a–c, top). In contrast, ipsi-preferring neurons ramped down during the contra trials with modest modulation during the ipsi trials (Fig. 6a–c, middle).
Compared with the presample baseline, ramping-up cells have higher spike rates and ramping-down cells have lower spike rates during the delay epoch in the preferred trial type (Mann–Whitney U test, p < 0.05; Fig. 3a,b). Contra-preferring neurons were mostly ramping-up cells during the delay epoch (Fig. 7a–f). In contrast, ipsi-preferring neurons were either ramping up or down (Fig. 7a–c). The latter were classified as ipsi-preferring because the ramping-down was stronger in contra trials. Because of this asymmetry, overall there were more contralateral ramping-up cells than ipsilateral ramping-up cells for all tasks (Fig. 7d–f).
We next characterized lateralization of selectivity. We defined DA as the spike-rate difference between the presample baseline epoch and the delay epoch (SRdelay − SRpresample)trial type, where “trial type” is either contralateral or ipsilateral, and SR denotes mean spike rate during the delay or presample epoch in each trial type (Fig. 3a). The absolute value of the DA was higher on contra trials compared with ipsi trials (Fig. 7g–i), as were the number of contralateral ramping-up neurons. This accounts for the contralateral bias in the grand mean PSTH (Fig. 4e–f). In contrast, ramping-up and ramping-down cells in the tactile task canceled each other and the grand mean PSTH was similar for the two trial types (Fig. 4d). The contralateral selectivity in the auditory task is similar to activity in the prefrontal cortex of primates during memory-guided saccade tasks (Funahashi et al., 1989).
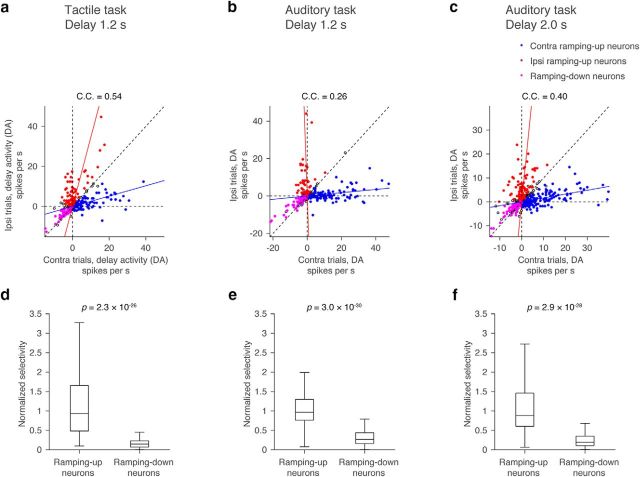
What is the relationship of DA across trial types? On average, the contra-selective ramping-up cells did not decrease spike rates in ipsi trials (Fig. 7a–c). In contrast, DA also increased slightly in the ipsi trials (Fig. 8a–c, blue lines, regression). Similarly, the ipsi-selective ramping-up cells showed only a slight activity change during the contra trials (Figs. 7a–c, 8a–c, red lines). Therefore, DA in ramping-up cells were nearly independent between the two trial types: cells that ramped up in the preferred trials had only weak increase in the nonpreferred trials.
Figure 8.
Relationship of DA in contra and ipsi trials. a–c, Distribution of contralateral and ipsilateral DA of all putative pyramidal neurons. Each circle corresponds to one neuron. Contralateral ramping-up cells, ipsilateral ramping-up cells, and ramping-down cells (both contralateral and ipsilateral ramping-down cells) are shown as filled circles in different colors. Other cells are shown as open circles. Line represents linear regressions (blue, contralateral ramping-up cells; red, ipsilateral ramping-up cells). C.C., Correlation coefficient of contralateral and ipsilateral DA based on all cells. Diagonal dotted line, Line with slope 1. d–f, Normalized selectivity (see Materials and Methods) of ramping-up neurons (both contralateral and ipsilateral ramping-up neurons) and ramping-down neurons (both contralateral and ipsilateral ramping-down neurons). Central line in the box plot is the median. Top and bottom edges are the 75 and 25 percentage points, respectively. The whiskers show the lowest datum within 1.5 interquartile range (IQR) of the lower quartile, and the highest datum within 1.5 IQR of the upper quartile. P values, Mann–Whitney U test.
In contrast to the near orthogonal DA of ramping-up cells, both contralateral and ipsilateral ramping-down cells ramped down for both movement directions (Figs. 7a–c, 8a–c, magenta). We defined the normalized selectivity as |DAcontra − DAipsi|/(DAcontra + DAipsi) (Fig. 3a). Weaker normalized selectivity of the ramping-down cells compared with the ramping-up cells (Fig. 8d–f) is consistent with recordings in the prefrontal cortex in nonhuman primates (Funahashi et al., 1989).
Putative FS neurons (Guo et al., 2014a) had weaker normalized selectivity than putative pyramidal cells (Fig. 9g–l), mainly because of their high baseline spike rates (Fig. 9a–f). Correlations between contralateral and ipsilateral DA were relatively high in FS neurons (compare Figs. 8a–c, 9g–i). Altogether, both ramping-down cells and FS neurons showed similar activities between the two trial types. These findings are consistent with a circuit in which FS neurons pool activity from local pyramidal neurons (Kerlin et al., 2010) and inhibit the ramping-down cells.
Preparatory activity in the ALM
Does DA maintain information about the sensory input, or is it related to future movements, as required for preparatory activity? Calcium imaging and extracellular recordings have reported ALM neurons with preparatory activity in the tactile task (Guo et al., 2014a; Chen et al., 2017). To confirm this finding in the auditory task, we analyzed incorrect trials. Since incorrect trials were rare in the cohort of mice trained on the auditory task with 1.2 s delay (performance, 91.4%), we compared the tactile task and the auditory task with 2.0 s delay (performance, 80.3 and 87.2%, respectively). We analyzed neurons with delay selectivity that were recorded in sessions with ≥10 incorrect trials for both trial types (IR and IL trials; tactile task, 412 cells; auditory task, 465 cells).
For each cell we compared selectivity during the second half of the delay epoch in correct and incorrect trials (Fig. 10a,b). Cells on the line with slope 1 (θ = 45°) have the same selectivity in both correct and incorrect trials, indicating coding of the sensory stimulus (instruction). Cells on the line with slope −1 (θ = −45°) switch selectivity for correct and incorrect trials, indicating preparatory activity. Most cells had negative slopes (θ < 0°), consistent with preparatory activity (Fig. 10c,d). Yet, θ was widely distributed, and the distributions were not centered on −45° (Fig. 10c,d). Cells with slopes between 1 and −1 (−45° < θ < 45°) conjunctively code for sensory and motor information. Alternatively, these neurons may have lower selectivity in incorrect trials because of weaker perceived sensory input, attention, arousal, or confidence in incorrect trials (Kepecs et al., 2008). We did not detect a relationship between the distribution of θ and recording depth (Fig. 10e,f).
Consistent with the polar coordinate analysis (Fig. 10a–d), many ALM neurons decoded movement direction on a trial-by-trial basis (area under ROC curve higher than the chance level; 85 cells for the tactile task; 117 cells for the auditory task; Fig. 10g,h, magenta above dashed line). In contrast, decoding of sensory information was relatively poor (45 cells for the tactile task; 24 cells for the auditory task; Fig. 10g,h, green above dashed line).
How does coding change over time within a trial? We measured θ throughout the trial. In both tasks, some cells coded for sensory information during the sample epoch (Fig. 11a–d; θ = 45°). During the delay epoch, the number of neurons with −θ gradually increased and peaked after the go cue. The distribution of θ was broad and did not have a peak at −45°. This analysis confirmed that throughout the delay epoch, many cells show mixed coding with a bias toward preparatory activity.
Cells with preparatory activity (−67.5° < θ < −22.5°) ramped from the sample epoch to the end of the delay epoch (Fig. 11e,f). Their selectivity flips between correct and incorrect trials, consistent with coding for motor planning (Fig. 11e,f). Activity of mixed-selectivity neurons (−22.5° < θ < 22.5°) can be similar to preparatory cells in correct trials, but different in the incorrect trials (Fig. 11 compare g,h, top, e,f, top). This analysis confirms that preparatory activity can only be detected with reference to incorrect trials.
DA is monotonic and low-dimensional
So far we have shown that activity, averaged across cells, ramps during the delay epoch. This does not imply that each neuron also ramps (Fig. 12c). For instance, each neuron could have nonmonotonic activity peaking at different times in the trial, producing ramping on average (Fig. 12d; Goldman, 2009). Such sequences have been reported during motor planning and other kinds of short-term memory in the premotor cortex, the mPFC, the posterior parietal cortex, and the hippocampus of rodents (Harvey et al., 2012; Buzsáki and Moser, 2013; Murakami et al., 2014; Schmitt et al., 2017).
We performed four analyses to distinguish between these two scenarios (Fig. 12, compare a, b). First, we tested whether activity peaks are at the beginning or at the end of the delay epoch, as expected for ramping-down and ramping-up neurons. Alternatively, activity peaks could tile the entire delay epoch. For each delay-selective neuron, we selected a random set of trials and identified the peak in the average spike rate. The peaks tiled the delay epoch (Fig. 13a–c). We next calculated the mean spike rate based on the second half of trials and ordered them based on the rank order derived from the first half. The sequence of peaks disappeared, indicating that activity peaks were spurious (Fig. 13d–f). We repeated this analysis with 1000 permutations (Fig. 13g–l). The density of peaks was higher than chance level only at the beginning and at the end of the delay epoch; that is, at the transition points between epochs (Fig. 13j–l). The cells with peaks at the beginning correspond to ramping-down cells and the cells with peaks at the end correspond to ramping-up cells. This analysis indicates that ALM cells are ramping.
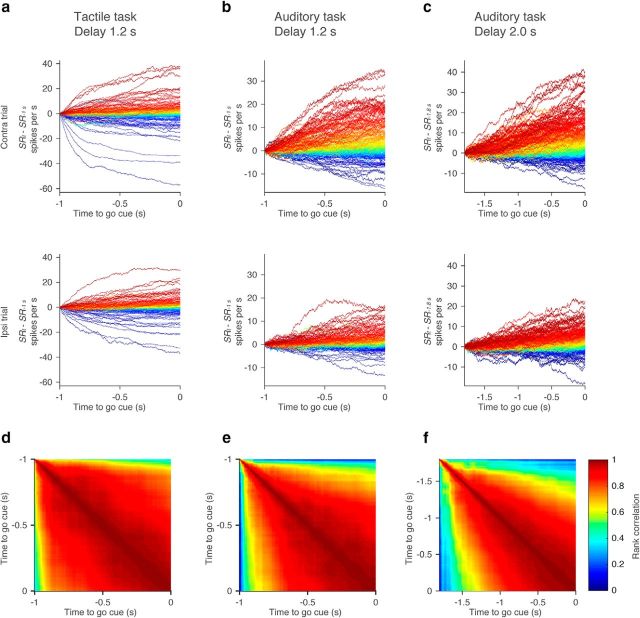
Second, if individual neurons ramp, their rank order should be approximately constant across time (Fig. 12c), and the Spearman's rank correlation should be high (Fig. 12e). In contrast, if individual neurons are part of sequences, the rank correlation should be low across time (Fig. 12f). To exclude contributions of phasic activity at the transitions between sample and delay epochs, we analyzed the last 1.0 s of the 1.2 s delay (Fig. 14a,b), and the last 1.8 s of the 2.0 s delay (Fig. 14c). We plotted the spike-rate change (SRt − SR−1 s for the 1.2 s delay, and SRt − SR−1.8 s for the 2 s delay) for all delay-selective neurons throughout this period (Fig. 14a–c). Each line represents spike-rate change for one neuron. As noted above (Fig. 7g–i), ramping amplitudes were larger for contra trials than for ipsi trials. Moreover, the Spearman's rank correlation of spike-rate change was high throughout the delay epoch (Fig. 14d–f). This implies that most cells with delay selectivity follow a similar time course during the delay epoch and differ in terms of sign and amplitude. This is consistent with ALM ramping down or up during the delay epoch.
Figure 14.
Rank correlation of DA. a–c, Change in spike rate (averaged over 100 ms) during the delay epoch in the contra trials (top) and ipsi trials (bottom). All cells with delay selectivity are shown. Each line, Individual neuron. Lines were color coded according to rank order of change in spike rate at the end of the delay epoch. d–f, Rank correlation of change in spike rate between different time points.
Third, we analyzed the stability of decoders of trial types. The decoder is the direction in activity space that best distinguishes trial types (CD; Li et al., 2016). CD is a vector defined in n-dimensional space, where n is the number of simultaneously recorded units (Fig. 15a). The CD should be stable for ramping activity because overlapping sets of neurons decode trial types throughout the delay epoch (Fig. 12g). In contrast, CD should be unstable for sequences because different sets of neurons decode trial types at different time points (Fig. 12h).
We analyzed simultaneously recorded ALM neurons (Fig. 16a–c; Table 1). We estimated CD based on the spike-rate difference between two trial types at each time point (Fig. 15a; see Materials and Methods). The projection of ALM activity to the CD showed selective ramping (Fig. 15b–d). We could decode future licking direction on a trial-by-trial basis based on activity projected along the CD at the end of the delay epoch (78.5 ± 11.1% for the tactile task; 83.3 ± 9.8% for the auditory task with the 1.2 s delay; and 83.9 ± 5.7% for the auditory task with the 2.0 s delay). Furthermore, activity along the CD was correlated with reaction time (Fig. 15; l − n), implying that activity along the CD anticipates movements across tasks (consistent with the tactile task; Li et al., 2016). The CD explained >90% of variance of the selectivity (Fig. 16g–i; see Materials and Methods). Moreover, the CD was stable throughout the delay epoch (Fig. 15i–k). This implies that the same set of neurons code trial-type differences throughout the delay epoch, consistent with ramping activity, but inconsistent with sequences (Fig. 12).
Fourth, we analyzed the remaining variance in activity in the ALM. We performed SVD of simultaneously recorded ALM neurons. The first SVD component and CD showed high correlation (Fig. 16d–f); this is consistent with our finding that highly active neurons are selective (Fig. 8). Next, we orthogonalized the SVD vectors to the CD. The projection of ALM activity to the orthogonalized first SVD component showed nonselective ramping (Fig. 15e–h; RM). CD and RM together explained >80% of trial-averaged activity variance during the delay epoch (Fig. 16j–l; see Materials and Methods). Over 60% of across-trial variance was also explained by these two modes (Fig. 16m–o; see Materials and Methods). The projections of ALM activity onto either CD or RM were ramping. This implies that, together with the variance measurements, most activity in the ALM can be explained as a weighted sum of selective ramping (CD) and nonselective ramping (RM). These analyses reveal that ALM activity is monotonic (ramping) and low-dimensional (two dimensions capturing >80% of activity variance), independent of the task structure.
Neurons with similar response show high spike-count correlation
The low dimensionality of the across-trial variance suggests that spike rates are correlated across neurons on a trial-by-trial level (spike-count correlation or noise correlation). Indeed, pairs of simultaneously recorded ramping-up cells showed similar activity patterns on a trial-by-trial basis (Fig. 17a). The onset and amplitude of ramping varied across trials within a cell, but was correlated among cells within a trial (Fig. 17a).
For each cell we defined a vector representing DA in each trial (). The length of is the number of trials. To calculate spike-count correlation, we measured the correlation between pairs of neurons as the Pearson's correlation of and . The example pairs of contralateral ramping-up cells showed high correlation of (Fig. 17b,c).
We computed the correlation for all simultaneously recorded pairs. We classified cells into four major categories (following Fig. 7): contralateral ramping-up, ipsilateral ramping-up, ipsilateral ramping-down (or just “ramping-down” as contralateral ramping-down was rare) cells, and the others. Distributions of spike-count correlations in contra trials between different types of cell pairs are shown (Fig. 18a–c, left column). The pairs between the same categories had positive correlation, whereas the pairs between different categories had correlation near 0 or slightly <0, for all tasks. Spike-count correlations in ipsi trials were similar (data not shown).
As a control, we shuffled trial labels within the same trial type and calculated the spike-count correlation (Fig. 18a–c, right column). This procedure destroyed across-trial correlation among neurons without changing the mean PSTH of individual neurons. Comparison of the data with shuffled controls (Fig. 18a–c, right column) provides a probability for the measured correlation to be higher than chance level (Fig. 18d–f, p values, Mann–Whitney U test).
This measure confirms that spike-count correlations are significantly high between neurons within categories. Correlations across categories are in some cases negative (Fig. 18d–f). The results were similar even when we computed the correlation for pairs from different shanks (shank interval: 250 μm; Fig. 18g–i). High spike-count correlation among cells with the same coding preference is consistent with data from FEFs of primates during motor planning (Constantinidis and Goldman-Rakic, 2002).
Discussion
We compared three different delayed-response tasks to identify common features of neural activity underlying motor planning. In all cases the ALM was necessary for motor planning (Fig. 2). Although there was heterogeneity in the dynamics across individual ALM neurons (Fig. 4), most features of the dynamics during the delay epoch were similar across tasks and similar to findings in nonhuman primates and rats. First, most ALM neurons showed significant selectivity during the delay epoch (Figs. 5, 6; Bruce and Goldberg, 1985; Funahashi et al., 1989; Riehle and Requin, 1989). Second, intermingled neurons were selective for either contralateral or ipsilateral movements (Figs. 5, 6; Bruce and Goldberg, 1985; Funahashi et al., 1989; Riehle and Requin, 1989; Erlich et al., 2011). Third, the ramping dynamics of contra-selective and ipsi-selective neurons were different (Figs. 7, 8; Funahashi et al., 1989; Erlich et al., 2011). The proportion of ramping-up cells and absolute value of DA were higher for contra-selective neurons than for ipsi-preferring neurons. Fourth, many cells showed mixed coding, with a bias toward preparatory activity (Figs. 10, 11; Erlich et al., 2011; Guo et al., 2014a; Chen et al., 2017). Fifth, the amplitude of ramping activity was similar, independent of the delay durations (Fig. 6; Funahashi et al., 1989; Komura et al., 2001), suggesting that the rate of ramping is determined by the timing of the action (Janssen and Shadlen, 2005; Tanaka, 2007). Sixth, ALM activity was monotonic and low-dimensional (Figs. 13–16; Gao and Ganguli, 2015; Murray et al., 2017). Seventh, spike-count correlations were high among cells with the same coding preference (Figs. 17, 18; Constantinidis and Goldman-Rakic, 2002). These findings suggest that features of motor planning are common across tasks with different instruction cues and actions and also across multiple species. Moreover, similar neural circuit mechanisms likely mediate motor planning independent of sensory modalities and actions.
Recent advances in neurophysiological recording methods (high-density silicon probe recordings and calcium imaging) enable us to monitor tens to hundreds of neurons simultaneously (Sofroniew et al., 2016; Jun et al., 2017a). Such population recordings provide information not available from single-cell recording (Cunningham and Yu, 2014). First, since neural activity (and calcium response caused by spikes) is highly variable, trial averaging is often necessary to infer the coding of neurons, often preventing analysis of single trials. Large-scale recordings allow population averaging and provide the statistical power to analyze circuit activity at the level of single trials. This is critical for understanding the relationship between neuronal activity and behavior. For example, population analysis in the premotor cortex allows prediction of movement direction (Li et al., 2016) and action timing (Churchland et al., 2010; Li et al., 2016). Second, information encoded in the correlation structure of network activity is not interpretable by monitoring single neurons. Dimensionality reduction methods allow us to extract the “modes” coding for the variable of interest, such as licking direction (Li et al., 2016). Based on dimensionality reduction, we found that >80% of activity during the delay epoch was explained by two modes. The low dimensionality may be due to simplicity of the task (Gao and Ganguli, 2015). Testing how the dimensionality changes in tasks with more behavioral choices is an important goal for the future.
Sequentially activated neurons during motor planning and other kinds of short-term memory tasks have been reported in the premotor cortex, the mPFC, the posterior parietal cortex, and the hippocampus of rodents (Harvey et al., 2012; Buzsáki and Moser, 2013; Murakami et al., 2014; Schmitt et al., 2017). These observations may provide support for theoretical models explaining persistent activity with feedforward or recurrent networks that effectively extend network time constants (Kleinfeld, 1986; Sompolinsky and Kanter, 1986; Koch and Segev, 1998; Goldman, 2009; Hopfield, 2010; Itskov et al., 2011; Rajan et al., 2016). Because these models predict sequential activity, this mechanism is not a parsimonious explanation for preparatory activity in the ALM. Similar temporally stable persistent activity has been reported in primate PFCs (Murray et al., 2017). Our studies do not distinguish between network mechanisms relying on stepping versus ramping at the level of single trials (Latimer et al., 2015).
Multiple pyramidal cell types have been reported in the ALM based on gene expression profile and anatomical properties, such as long-range axonal projection (Shepherd, 2013). These diverse defined cell types are likely to show different activity patterns due to distinct anatomical connections and intrinsic properties. For example, pyramidal tract neurons that project out of the cortex show stronger contralaterality compared with the intratelencephalic neurons that project to other cortical areas (Li et al., 2015). Cell-type-specific recordings to test how the features of DA differ among cell types is another important goal for the future.
High spike-count correlations among neurons sharing the same coding preference indicate that such neurons have strong functional connections or receive the same inputs. The strong functional connection can be mediated by local recurrent connections. Alternatively, it can be mediated by a strong long-range excitatory loop between the ALM and the thalamus (thalamocortical loop; Guo et al., 2017). Such functional network structures by themselves are not sufficient to reveal the possible mechanisms underlying motor planning, as the same network structure can result for instance in an integrator network or in attractor networks (Miller, 2016). To further nail down the mechanism of motor planning, optogenetic perturbations are necessary to identify the circuit mechanisms of preparatory activity. Motor planning in mice, which is similar to that in nonhuman primates, enables us to interrogate the circuits to unveil the underlying mechanism.
Footnotes
This work was supported by the Howard Hughes Medical Institute. H.K.I. is a Helen Hay Whitney Foundation postdoctoral fellow. We thank Nuo Li, Tim Wang, Liu Liu, and Arseny Finkelstein for comments on the manuscript; Tim Harris, Brian Barbarits, Jun Jaeyoon James, and Wei-Lung Sun for help with silicon probe recordings and spike sorting; and Lorenzo Fontolan and Shaul Druckmann for discussions.
The authors declare no competing interests.
References
- Aarts E, Verhage M, Veenvliet JV, Dolan CV, van der Sluis S (2014) A solution to dependency: using multilevel analysis to accommodate nested data. Nat Neurosci 17:491–496. 10.1038/nn.3648 [DOI] [PubMed] [Google Scholar]
- Alexander GE, Crutcher MD (1990) Preparation for movement: neural representations of intended direction in three motor areas of the monkey. J Neurophysiol 64:133–150. 10.1152/jn.1990.64.1.133 [DOI] [PubMed] [Google Scholar]
- Ames KC, Ryu SI, Shenoy KV (2014) Neural dynamics of reaching following incorrect or absent motor preparation. Neuron 81:438–451. 10.1016/j.neuron.2013.11.003 [DOI] [PMC free article] [PubMed] [Google Scholar]
- Bruce CJ, Goldberg ME (1985) Primate frontal eye fields. I. single neurons discharging before saccades. J Neurophysiol 53:603–635. 10.1152/jn.1985.53.3.603 [DOI] [PubMed] [Google Scholar]
- Buzsáki G, Moser EI (2013) Memory, navigation and theta rhythm in the hippocampal-entorhinal system. Nat Neurosci 16:130–138. 10.1038/nn.3304 [DOI] [PMC free article] [PubMed] [Google Scholar]
- Chen TW, Li N, Daie K, Svoboda K (2017) A map of anticipatory activity in mouse motor cortex. Neuron 94:866–879.e4. 10.1016/j.neuron.2017.05.005 [DOI] [PubMed] [Google Scholar]
- Churchland MM, Yu BM, Ryu SI, Santhanam G, Shenoy KV (2006) Neural variability in premotor cortex provides a signature of motor preparation. J Neurosci 26:3697–3712. 10.1523/JNEUROSCI.3762-05.2006 [DOI] [PMC free article] [PubMed] [Google Scholar]
- Churchland MM, Cunningham JP, Kaufman MT, Ryu SI, Shenoy KV (2010) Cortical preparatory activity: representation of movement or first cog in a dynamical machine? Neuron 68:387–400. 10.1016/j.neuron.2010.09.015 [DOI] [PMC free article] [PubMed] [Google Scholar]
- Constantinidis C, Goldman-Rakic PS (2002) Correlated discharges among putative pyramidal neurons and interneurons in the primate prefrontal cortex. J Neurophysiol 88:3487–3497. 10.1152/jn.00188.2002 [DOI] [PubMed] [Google Scholar]
- Cunningham JP, Yu BM (2014) Dimensionality reduction for large-scale neural recordings. Nat Neurosci 17:1500–1509. 10.1038/nn.3776 [DOI] [PMC free article] [PubMed] [Google Scholar]
- Ding L, Gold JI (2010) Caudate encodes multiple computations for perceptual decisions. J Neurosci 30:15747–15759. 10.1523/JNEUROSCI.2894-10.2010 [DOI] [PMC free article] [PubMed] [Google Scholar]
- Efron B, Tibshirani R (1994) An introduction to the bootstrap, first edition. Boca Raton, FL: Chapman and Hall/CRC. [Google Scholar]
- Erlich JC, Bialek M, Brody CD (2011) A cortical substrate for memory-guided orienting in the rat. Neuron 72:330–343. 10.1016/j.neuron.2011.07.010 [DOI] [PMC free article] [PubMed] [Google Scholar]
- Funahashi S, Bruce CJ, Goldman-Rakic PS (1989) Mnemonic coding of visual space in the monkey's dorsolateral prefrontal cortex. J Neurophysiol 61:331–349. 10.1152/jn.1989.61.2.331 [DOI] [PubMed] [Google Scholar]
- Fuster JM, Alexander GE (1971) Neuron activity related to short-term memory. Science 173:652–654. 10.1126/science.173.3997.652 [DOI] [PubMed] [Google Scholar]
- Gao P, Ganguli S (2015) On simplicity and complexity in the brave new world of large-scale neuroscience. Curr Opin Neurobiol 32:148–155. 10.1016/j.conb.2015.04.003 [DOI] [PubMed] [Google Scholar]
- Gnadt JW, Andersen RA (1988) Memory related motor planning activity in posterior parietal cortex of macaque. Exp Brain Res 70:216–220. [DOI] [PubMed] [Google Scholar]
- Goldman MS. (2009) Memory without feedback in a neural network. Neuron 61:621–634. 10.1016/j.neuron.2008.12.012 [DOI] [PMC free article] [PubMed] [Google Scholar]
- Goldman-Rakic PS. (1995) Cellular basis of working memory. Neuron 14:477–485. 10.1016/0896-6273(95)90304-6 [DOI] [PubMed] [Google Scholar]
- Guo ZV, Li N, Huber D, Ophir E, Gutnisky D, Ting JT, Feng G, Svoboda K (2014a) Flow of cortical activity underlying a tactile decision in mice. Neuron 81:179–194. 10.1016/j.neuron.2013.10.020 [DOI] [PMC free article] [PubMed] [Google Scholar]
- Guo ZV, Hires SA, Li N, O'Connor DH, Komiyama T, Ophir E, Huber D, Bonardi C, Morandell K, Gutnisky D, Peron S, Xu NL, Cox J, Svoboda K (2014b) Procedures for behavioral experiments in head-fixed mice. PloS One 9:e88678. 10.1371/journal.pone.0088678 [DOI] [PMC free article] [PubMed] [Google Scholar]
- Guo ZV, Inagaki HK, Daie K, Druckmann S, Gerfen CR, Svoboda K (2017) Maintenance of persistent activity in a frontal thalamocortical loop. Nature 545:181–186. 10.1038/nature22324 [DOI] [PMC free article] [PubMed] [Google Scholar]
- Hanes DP, Schall JD (1996) Neural control of voluntary movement initiation. Science 274:427–430. 10.1126/science.274.5286.427 [DOI] [PubMed] [Google Scholar]
- Harvey CD, Coen P, Tank DW (2012) Choice-specific sequences in parietal cortex during a virtual-navigation decision task. Nature 484:62–68. 10.1038/nature10918 [DOI] [PMC free article] [PubMed] [Google Scholar]
- Hippenmeyer S, Vrieseling E, Sigrist M, Portmann T, Laengle C, Ladle DR, Arber S (2005) A developmental switch in the response of DRG neurons to ETS transcription factor signaling. PLoS Biol 3:e159. 10.1371/journal.pbio.0030159 [DOI] [PMC free article] [PubMed] [Google Scholar]
- Hopfield JJ. (2010) Neurodynamics of mental exploration. Proc Natl Acad Sci U S A 107:1648–1653. 10.1073/pnas.0913991107 [DOI] [PMC free article] [PubMed] [Google Scholar]
- Inagaki H, Fontolan L, Romani S, Svoboda K (2017) Discrete attractor dynamics underlying selective persistent activity in frontal cortex. bioRxiv 203448 10.1101/203448 [DOI] [PubMed] [Google Scholar]
- Ison JR, Allen PD, O'Neill WE (2007) Age-related hearing loss in C57BL/6J mice has both frequency-specific and non-frequency-specific components that produce a hyperacusis-like exaggeration of the acoustic startle reflex. J Assoc Res Otolaryngol 8:539–550. 10.1007/s10162-007-0098-3 [DOI] [PMC free article] [PubMed] [Google Scholar]
- Itskov V, Curto C, Pastalkova E, Buzsáki G (2011) Cell assembly sequences arising from spike threshold adaptation keep track of time in the hippocampus. J Neurosci 31:2828–2834. 10.1523/JNEUROSCI.3773-10.2011 [DOI] [PMC free article] [PubMed] [Google Scholar]
- Janssen P, Shadlen MN (2005) A representation of the hazard rate of elapsed time in macaque area LIP. Nat Neurosci 8:234–241. 10.1038/nn1386 [DOI] [PubMed] [Google Scholar]
- Jun JJ, Steinmetz NA, Siegle JH, Denman DJ, Bauza M, Barbarits B, Lee AK, Anastassiou CA, Andrei A, Aydın Ç, Barbic M, Blanche TJ, Bonin V, Couto J, Dutta B, Gratiy SL, Gutnisky DA, Häusser M, Karsh B, Ledochowitsch P, et al. (2017a) Fully integrated silicon probes for high-density recording of neural activity. Nature 551:232–236. 10.1038/nature24636 [DOI] [PMC free article] [PubMed] [Google Scholar]
- Jun JJ, Mitelut C, Lai C, Gratiy S, Anastassiou C, Harris TD (2017b) Real-time spike sorting platform for high-density extracellular probes with ground-truth validation and drift correction. bioRxiv 101030 10.1101/101030 [DOI] [Google Scholar]
- Kepecs A, Uchida N, Zariwala HA, Mainen ZF (2008) Neural correlates, computation and behavioural impact of decision confidence. Nature 455:227–231. 10.1038/nature07200 [DOI] [PubMed] [Google Scholar]
- Kerlin AM, Andermann ML, Berezovskii VK, Reid RC (2010) Broadly tuned response properties of diverse inhibitory neuron subtypes in mouse visual cortex. Neuron 67:858–871. 10.1016/j.neuron.2010.08.002 [DOI] [PMC free article] [PubMed] [Google Scholar]
- Kleinfeld D. (1986) Sequential state generation by model neural networks. Proc Natl Acad Sci U S A 83:9469–9473. 10.1073/pnas.83.24.9469 [DOI] [PMC free article] [PubMed] [Google Scholar]
- Koch C, Segev I (1998) Methods in neuronal modeling: from ions to networks, 2nd edition Cambridge, MA: MIT. [Google Scholar]
- Komiyama T, Sato TR, O'Connor DH, Zhang YX, Huber D, Hooks BM, Gabitto M, Svoboda K (2010) Learning-related fine-scale specificity imaged in motor cortex circuits of behaving mice. Nature 464:1182–1186. 10.1038/nature08897 [DOI] [PubMed] [Google Scholar]
- Komura Y, Tamura R, Uwano T, Nishijo H, Kaga K, Ono T (2001) Retrospective and prospective coding for predicted reward in the sensory thalamus. Nature 412:546–549. 10.1038/35087595 [DOI] [PubMed] [Google Scholar]
- Kubota K, Niki H (1971) Prefrontal cortical unit activity and delayed alternation performance in monkeys. J Neurophysiol 34:337–347. 10.1152/jn.1971.34.3.337 [DOI] [PubMed] [Google Scholar]
- Latimer KW, Yates JL, Meister ML, Huk AC, Pillow JW (2015) Neuronal modeling. Single-trial spike trains in parietal cortex reveal discrete steps during decision-making. Science 349:184–187. 10.1126/science.aaa4056 [DOI] [PMC free article] [PubMed] [Google Scholar]
- Li N, Chen TW, Guo ZV, Gerfen CR, Svoboda K (2015) A motor cortex circuit for motor planning and movement. Nature 519:51–56. 10.1038/nature14178 [DOI] [PubMed] [Google Scholar]
- Li N, Daie K, Svoboda K, Druckmann S (2016) Robust neuronal dynamics in premotor cortex during motor planning. Nature 532:459–464. 10.1038/nature17643 [DOI] [PMC free article] [PubMed] [Google Scholar]
- Liu D, Gu X, Zhu J, Zhang X, Han Z, Yan W, Cheng Q, Hao J, Fan H, Hou R, Chen Z, Chen Y, Li CT (2014) Medial prefrontal activity during delay period contributes to learning of a working memory task. Science 346:458–463. 10.1126/science.1256573 [DOI] [PubMed] [Google Scholar]
- Madisen L, Mao T, Koch H, Zhuo JM, Berenyi A, Fujisawa S, Hsu YW, Garcia AJ 3rd, Gu X, Zanella S, Kidney J, Gu H, Mao Y, Hooks BM, Boyden ES, Buzsáki G, Ramirez JM, Jones AR, Svoboda K, Han X, et al. (2012) A toolbox of cre-dependent optogenetic transgenic mice for light-induced activation and silencing. Nat Neurosci 15:793–802. 10.1038/nn.3078 [DOI] [PMC free article] [PubMed] [Google Scholar]
- Maimon G, Assad JA (2006) A cognitive signal for the proactive timing of action in macaque LIP. Nat Neurosci 9:948–955. 10.1038/nn1716 [DOI] [PubMed] [Google Scholar]
- Miller P. (2016) Dynamical systems, attractors, and neural circuits. F1000Research 5 pii:F1000 Faculty Rev-992. 10.12688/f1000research.7698.1 [DOI] [PMC free article] [PubMed] [Google Scholar]
- Miyashita Y. (1988) Neuronal correlate of visual associative long-term memory in the primate temporal cortex. Nature 335:817–820. 10.1038/335817a0 [DOI] [PubMed] [Google Scholar]
- Murakami M, Vicente MI, Costa GM, Mainen ZF (2014) Neural antecedents of self-initiated actions in secondary motor cortex. Nat Neurosci 17:1574–1582. 10.1038/nn.3826 [DOI] [PubMed] [Google Scholar]
- Murray JD, Bernacchia A, Roy NA, Constantinidis C, Romo R, Wang XJ (2017) Stable population coding for working memory coexists with heterogeneous neural dynamics in prefrontal cortex. Proc Natl Acad Sci U S A 114:394–399. 10.1073/pnas.1619449114 [DOI] [PMC free article] [PubMed] [Google Scholar]
- Ohmae S, Kunimatsu J, Tanaka M (2017) Cerebellar roles in self-timing for sub- and supra-second intervals. J Neurosci 37:3511–3522. 10.1523/JNEUROSCI.2221-16.2017 [DOI] [PMC free article] [PubMed] [Google Scholar]
- Rajan K, Harvey CD, Tank DW (2016) Recurrent network models of sequence generation and memory. Neuron 90:128–142. 10.1016/j.neuron.2016.02.009 [DOI] [PMC free article] [PubMed] [Google Scholar]
- Riehle A, Requin J (1989) Monkey primary motor and premotor cortex: single-cell activity related to prior information about direction and extent of an intended movement. J Neurophysiol 61:534–549. 10.1152/jn.1989.61.3.534 [DOI] [PubMed] [Google Scholar]
- Romo R, Brody CD, Hernández A, Lemus L (1999) Neuronal correlates of parametric working memory in the prefrontal cortex. Nature 399:470–473. 10.1038/20939 [DOI] [PubMed] [Google Scholar]
- Schmitt LI, Wimmer RD, Nakajima M, Happ M, Mofakham S, Halassa MM (2017) Thalamic amplification of cortical connectivity sustains attentional control. Nature 545:219–223. 10.1038/nature22073 [DOI] [PMC free article] [PubMed] [Google Scholar]
- Shenoy KV, Sahani M, Churchland MM (2013) Cortical control of arm movements: a dynamical systems perspective. Annu Rev Neurosci 36:337–359. 10.1146/annurev-neuro-062111-150509 [DOI] [PubMed] [Google Scholar]
- Shepherd GM. (2013) Corticostriatal connectivity and its role in disease. Nat Rev Neurosci 14:278–291. 10.1038/nrn3469 [DOI] [PMC free article] [PubMed] [Google Scholar]
- Sofroniew NJ, Flickinger D, King J, Svoboda K (2016) A large field of view two-photon mesoscope with subcellular resolution for in vivo imaging. Elife 5 pii:e14472. 10.7554/eLife.14472 [DOI] [PMC free article] [PubMed] [Google Scholar]
- Sompolinsky H, Kanter II (1986) Temporal association in asymmetric neural networks. Phys Rev Lett 57:2861–2864. 10.1103/PhysRevLett.57.2861 [DOI] [PubMed] [Google Scholar]
- Svoboda K, Li N (2017) Neural mechanisms of movement planning: motor cortex and beyond. Curr Opin Neurobiol 49:33–41. 10.1016/j.conb.2017.10.023 [DOI] [PubMed] [Google Scholar]
- Taberner AM, Liberman MC (2005) Response properties of single auditory nerve fibers in the mouse. J Neurophysiol 93:557–569. 10.1152/jn.00574.2004 [DOI] [PubMed] [Google Scholar]
- Tanaka M. (2007) Cognitive signals in the primate motor thalamus predict saccade timing. J Neurosci 27:12109–12118. 10.1523/JNEUROSCI.1873-07.2007 [DOI] [PMC free article] [PubMed] [Google Scholar]
- Tanji J, Evarts EV (1976) Anticipatory activity of motor cortex neurons in relation to direction of an intended movement. J Neurophysiol 39:1062–1068. 10.1152/jn.1976.39.5.1062 [DOI] [PubMed] [Google Scholar]
- van der Leeden R. (2008) Resampling multilevel models. In: Handbook of multilevel analysis (de Leeuw J, Meijer E, eds), pp 401–433. New York, NY: Springer. [Google Scholar]
- Vue TY, Bluske K, Alishahi A, Yang LL, Koyano-Nakagawa N, Novitch B, Nakagawa Y (2009) Sonic hedgehog signaling controls thalamic progenitor identity and nuclei specification in mice. J Neurosci 29:4484–4497. 10.1523/JNEUROSCI.0656-09.2009 [DOI] [PMC free article] [PubMed] [Google Scholar]
- Wurtz RH, Goldberg ME (1972) Activity of superior colliculus in behaving monkey. 3. Cells discharging before eye movements. J Neurophysiol 35:575–586. 10.1152/jn.1972.35.4.575 [DOI] [PubMed] [Google Scholar]
- Zhao S, Ting JT, Atallah HE, Qiu L, Tan J, Gloss B, Augustine GJ, Deisseroth K, Luo M, Graybiel AM, Feng G (2011) Cell type-specific channelrhodopsin-2 transgenic mice for optogenetic dissection of neural circuitry function. Nat Methods 8:745–752. 10.1038/nmeth.1668 [DOI] [PMC free article] [PubMed] [Google Scholar]


