

Abstract
Neural oscillations are important for memory formation in the brain. The desynchronization of alpha (10 Hz) oscillations in the neocortex has been shown to predict successful memory encoding and retrieval. However, when engaging in learning, it has been found that the hippocampus synchronizes in theta (4 Hz) oscillations, and that learning is dependent on the phase of theta. This inconsistency as to whether synchronization is “good” for memory formation leads to confusion over which oscillations we should expect to see and where during learning paradigm experiments. This paper seeks to respond to this inconsistency by presenting a neural network model of how a well functioning learning system could exhibit both of these phenomena, i.e., desynchronization of alpha and synchronization of theta during successful memory encoding.
We present a spiking neural network (the Sync/deSync model) of the neocortical and hippocampal system. The simulated hippocampus learns through an adapted spike-time dependent plasticity rule, in which weight change is modulated by the phase of an extrinsically generated theta oscillation. Additionally, a global passive weight decay is incorporated, which is also modulated by theta phase. In this way, the Sync/deSync model exhibits theta phase-dependent long-term potentiation and long-term depression. We simulated a learning paradigm experiment and compared the oscillatory dynamics of our model with those observed in single-cell and scalp-EEG studies of the medial temporal lobe. Our Sync/deSync model suggests that both the desynchronization of neocortical alpha and the synchronization of hippocampal theta are necessary for successful memory encoding and retrieval.
SIGNIFICANCE STATEMENT A fundamental question is the role of rhythmic activation of neurons, i.e., how and why their firing oscillates between high and low rates. A particularly important question is how oscillatory dynamics between the neocortex and hippocampus support memory formation. We present a spiking neural-network model of such memory formation, with the central ideas that (1) in neocortex, neurons need to break out of an alpha oscillation to represent a stimulus (i.e., alpha desynchronizes), whereas (2) in hippocampus, the firing of neurons at theta facilitates formation of memories (i.e., theta synchronizes). Accordingly, successful memory formation is marked by reduced neocortical alpha and increased hippocampal theta. This pattern has been observed experimentally and gives our model its name—the Sync/deSync model.
Keywords: oscillations, computational modeling, episodic memory, theta, alpha, EEG
Introduction
Brain oscillations, via their ability to synchronize and desynchronize neuronal populations, play a crucial role in the formation and retrieval of episodic memories. However, little is known about how oscillations implement the necessary mechanisms for encoding and retrieval of such memories. This knowledge gap is partly due to a lack of computational models simulating oscillatory behaviors as observed in human EEG/MEG recordings during memory tasks. The link between oscillations and memory is further complicated by empirical data, which has fuelled a conundrum as to how oscillations relate to memory. Specifically, hippocampal theta (∼3–8 Hz) and gamma (∼40–80 Hz) synchronization (Fell and Axmacher, 2011) and the desynchronization of alpha and beta (8–30 Hz) in cortical regions (Hanslmayr et al., 2012) have both been reported as important for memory encoding and retrieval. Classic computational models theorize that hippocampal and neocortical regions offer functionally distinct mechanisms to form episodic memory (O'Reilly et al., 2014), where a sparsely connected hippocampus learns new information quickly and a dense neo-cortex incorporates this information slowly. Building on these complementary learning systems, we recently presented a potential solution to the synchronization/desynchronization conundrum (Hanslmayr et al., 2016), suggesting that hippocampal theta synchronization (∼4 Hz) mediates the binding of concepts, while neocortical alpha desynchronization (∼10 Hz) is due to the representations of these concepts becoming active. We here present a first computational network model that implements these mechanisms and simulates the opposing synchronizing and desynchronizing behaviors in the hippocampus and neocortex during a typical episodic memory task. Our model, while being very simple, successfully simulates a number of empirical findings ranging from human single-neuron recordings, intracranial EEG recordings, to noninvasive EEG/MEG recordings and therefore represents a useful theoretical link between different levels of human electrophysiological recordings.
Theta oscillations in medial temporal lobe are assumed to play a key role in the formation of memories, where learning is dependent on the power of theta oscillations and the timing of action potentials in relation to the ongoing theta cycle (Rutishauser et al., 2010; Staudigl and Hanslmayr, 2013; Backus et al., 2016; Heusser et al., 2016). Studies in rodents have provided a mechanism by which theta oscillations exert their influence on memory in showing that long-term potentiation (LTP) and long-term depression (LTD) occur in specific phases of the theta cycle (Pavlides et al., 1988; Huerta and Lisman, 1995). Building on theories of synaptic plasticity, it has been postulated that LTD occurs while most neurons in region CA1/CA3 are active in the excitatory phase of theta (as recorded from CA1/CA3 hippocampal regions), whereas LTP occurs in the inhibitory phase of theta when most neurons are silent (Hasselmo, 2005). (We clarify how these inhibitory and excitatory phases map onto the trough and peak of theta in Materials and Methods, Computational model). The model we describe here shows that stimulated hippocampal cells demonstrate a phase shift forward in theta, enabling LTP to occur in the inhibitory phase of theta where other nonstimulated cells are silent.
Concerning alpha oscillations, it can be assumed that there is a negative relationship between alpha power and discriminating neural activity (Haegens et al., 2011), leading to the notion that alpha provides functional inhibition (Klimesch et al., 2007; Jensen and Mazaheri, 2010). Supporting this notion, alpha power decreases (i.e., desynchronizations) are often localized in cortical regions relevant for a given task, whereas alpha power increases occur in competing areas that are being inhibited (Jokisch and Jensen, 2007; Waldhauser et al., 2012). These findings suggest that the desynchronization of alpha represents the flow of information to a targeted group of neurons. Consistent with this general gating function of alpha, power decreases are strongly evident in episodic memory tasks where cortical alpha power decreases predict successful encoding (Hanslmayr et al., 2012) and retrieval (Khader et al., 2010; Waldhauser et al., 2016). In addition to the hippocampal theta dynamics, our model also simulates such memory dependent alpha power decreases in the neocortex during the encoding and retrieval of episodic memories.
Materials and Methods
Computational model.
Here we describe a simple computational neural network model, which takes inspiration from the complementary learning systems framework (CLS), and lends credence to the previously theorized notion that opposing oscillatory behavior in cortical and hippocampal regions both contribute to episodic memory formation (Hanslmayr et al., 2016). We do not fully detail the different steps of how information enters and exits the hippocampus through different subregions, e.g., via the perforant pathway from entorhinal cortex. Importantly, theta oscillations show a phase reversal between the two pathways from entorhinal cortex to CA1 (the monosynaptic perforant pathway and the trisynaptic pathway, via the Schaffer collaterals), which is the focus of previous models describing the computational utility of theta in providing discrete time windows for encoding and retrieval (Hasselmo et al., 2005) or error-driven learning (Ketz et al., 2013). Our model draws inspiration from these works, but focusses particularly on the dynamics in region CA1. The key functional property we have constructed our model upon is that theta sets up an inhibitory phase at the soma of pyramidal cells, at which LTP occurs, and a facilitatory phase at the soma of such cells, at which LTD occurs. Neurophysiologically, this could arise from the coincidence of a trough of fissure theta (which is known to coincide with LTP), a peak at stratum radiatum (input from Schaffer collaterals to CA1), and a trough at stratum pyramidale (i.e., functional inhibition at the cell body). This pattern is justified by Hasselmo et al. (2005, their section Induction of LTP), and is consistent with Hanslmayr et al. (2016), which refers to the peak in stratum radiatum. To simplify presentation, through the main body of the paper, we use functional descriptors, i.e., we talk in terms of the inhibitory phase of theta, meaning functional suppression at the pyramidal cell body, and the facilitatory phase of theta, meaning functional facilitation at the pyramidal cell body. In these terms, we will model a simple mechanism to simulate a typical episodic memory paradigm where an association between stimuli has to be learnt in one trial. A principle of our modeling endeavor has been to identify the simplest neural instantiation of our theory under an Ockham's razor principle.
Experimental paradigm.
We chose to compare our model to an experiment that recorded from medial temporal lobe (MTL) neurons within epilepsy patients (Ison et al., 2015). As depicted in Figure 1A, the experimenters screened many images of people to each participant to find one that the neuron under observation responded to, denoted from here on as the preferred (P) image. A separate image of a location was chosen that the neuron did not respond to, denoted as the nonpreferred (NP) image. The P image of the person was then digitally superimposed onto the NP image of the location [denoted here as the composite (C) image], before being presented to the participant in what is termed here as the learning phase. The experimenters then conducted the screening process again, presenting both the NP and P images, to assess the impact of learning on the activity of the hippocampal neuron. Figure 1A shows how we simulated this paradigm, where there is a screening phase before and after the presentation of the composite stimulus.
Figure 1.
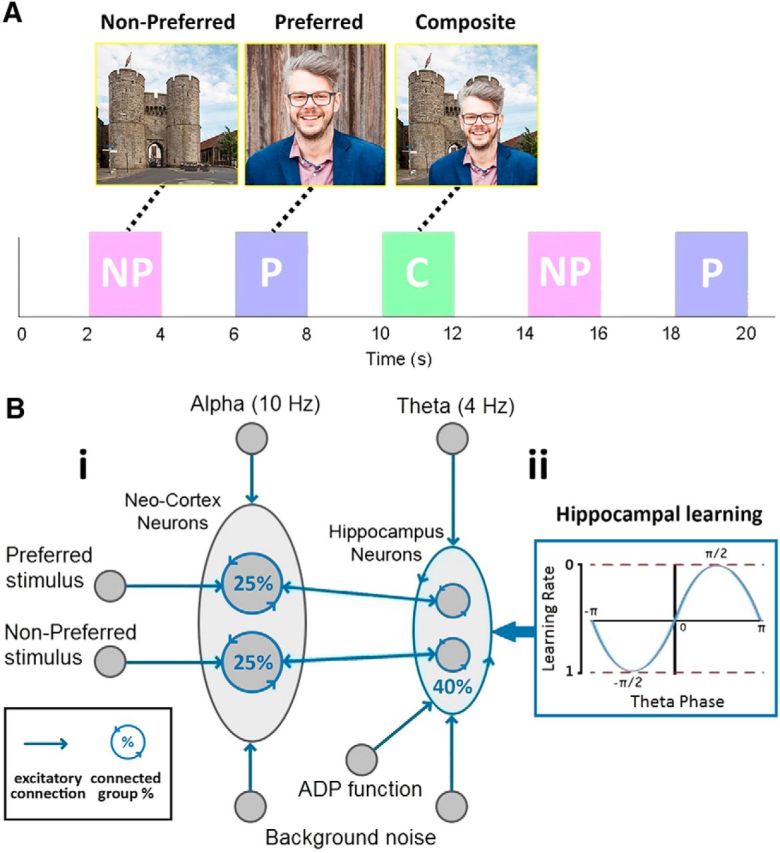
Experimental paradigm (A). A NP and P image are found that the neuron does not and does respond to. These are then combined and presented in a C stimulus. Both P and NP images are presented again after this learning phase. Network connectivity (B). The architecture of the network (Bi) shows how a group of NC neurons and a group of hippocampal (Hip) neurons receive input from a 10 and 4 Hz tonic wave, respectively, and both groups receive (background) noise from Poisson distributed spikes. Two subgroups of NC neurons receive input from higher level areas that represent the P and NP image. Each subgroup of NC and Hip neurons has reciprocal connectivity between themselves, 25% for NC and 40% for Hip. Hippocampal neurons also receive an ADP function. Hippocampal neurons are interconnected (i.e., not just within subgroups), again with 40% connectivity, and STDP is enabled with a theta phase-dependent learning rate (Bii).
Neuron physiology.
Our model comprises two groups of neurons representing the neocortex (NC) and the hippocampus (Fig. 1Bi), split again into two subgroups coding for the P and NP images (where the number of neurons in each group was NNC = 20, Nhip = 10). All neurons are simulated using an integrate-and-fire equation (equation 1, Vth = −55mV, E = −70mV, Cm = 240nF, Vref = 2ms, τm = 20ms). A spike event is sent to other downstream connected neurons if the membrane potential (Vm(t) of a neuron surpasses the threshold for firing (Vth). After a spike, the neuron enters a refractory period, where the membrane potential is clamped to the resting potential (E) for a set period (Vref). With this equation, the membrane potential of a neuron is constantly decaying to its resting potential (E) at a rate dictated by the membrane time constant (τm). The sum of all inputs at t is divided by the capacitance (Cm) of the membrane potential. Inputs originate from constant alternating currents (Itonic), the sum of EPSPs from spikes at each input synapse (Isyn) and an afterdepolarization (ADP) function (IADP), which will be described in more detail later. The integrate-and-fire model:
 |
An alpha function (Eq. 2) was used to model EPSPs for incoming spike events, where Δt is equal to the current time (t) minus the time of the eliciting spike (tfire). The higher the synaptic time constant τs, the larger the integral through time of the EPSP, ensuring that a spike has a more sustained effect on the receiving neuron's membrane potential. All synapses within the NC integrated with a τs of 1.5 ms, whereas synapses within the hippocampus integrated with a slightly larger synaptic time constant (τs = 5 ms) to allow them to more easily interact with one another. Spikes originating from external noise generators had a synaptic time constant of 1.5 ms. The EPSP:
 |
Neocortical system.
Based on CLS, the NC system learns slowly from repeated presentations. As our model emphasizes the effect of oscillations on a single learning event, we assumed the existence of two pre-established NC populations, one representing the P and the other the NP concept, where neurons within each population had a 25% chance of being connected and synaptic modification was not implemented due to an assumed slow cortical learning rate (Fig. 1Bi). Each NC neuron received background noise, representing “chatter” from other brain regions, in the form of Poisson distributed spike events (∼42,000 spikes/s). We do not explicitly model a neural mechanism for oscillations, thus a cosine wave of frequency 10 Hz (amplitude = 21 pA) was fed into NC neurons via Itonic to model ongoing alpha. This approximates the dominance of alpha oscillatory activity in the cortex, which arise via pacemaker regions like the thalamus (Hughes et al., 2004) or emerge via corticocortical top-down interactions (van Kerkoerle et al., 2014). Two separately generated Poisson distributed spike-trains (∼80,000 spikes/s) were then paired with each NC subgroup upon stimulus presentation, modeling the activation of the P and/or NP images from higher cortical and visual areas. Stimulus related spike trains were multiplied by an alpha function (Eq. 2; τs = 250 ms) to more realistically model the activation of many neurons at stimulus onset.
Hippocampal system.
Hippocampal neurons were similarly organized into two subgroups (Fig. 1Bi), where each neuron received background noise (∼4000 spikes/s) and a cosine wave of 4 Hz (amplitude = 28 pA) to model ongoing theta. This ongoing theta oscillation approximates input into the hippocampus from pacemaker regions like the septum (Petsche et al., 1962), or interactions between different types of interneurons acting as local theta generators (Rotstein et al., 2005). Based on CLS, the hippocampal system learns quickly from a single presentation. Therefore, hippocampal synaptic modification was enabled via an adapted spike-time-dependent plasticity (STDP) learning rule (Song et al., 2000). We adjusted this rule to relate to empirical evidence that hippocampal learning is theta phase-dependent (Huerta and Lisman, 1995), with LTP occurring in the functionally inhibitory phase and LTD in the functionally excitatory phase of theta (Hasselmo, 2005). To this end, synaptic LTP was implemented by multiplying STDP weight modifications by the phase of the theta cosine wave, with a value between 0 and 1, with 0 on the excitatory “up” phase and 1 on the inhibitory “down” phase (Fig. 1Bii).
When a neuron spiked, a reward (A+) for contributing synapses was calculated as the product of a constant learning rate (ε ∈ ℝ. 0 ≤ ε ≤ 1), theta at time t (θ ∈ ℝ. 0 ≤ θ ≤ 1) and the maximum weight (Wmax), whereas punishments for competing synapses were calculated as A− = 1.1 · A+ (see Eq. 3). The greater strength for A− compared with A+ reflected a preference for synaptic weakening to maintain a stable network. Whenever a spike event occurs, at unit i or j, an accumulated STDP update vij(t) for synapse i to j is calculated from its history of previous spiking (i then j or j then i; see Eq. 5). A function was then used to calculate the STDP acting on the synapse (see Eq. 4), where an exponential weighting of A+ was applied if the presynaptic spike occurred before the postsynaptic spike and of A− if the postsynaptic spike occurred first. All hippocampal weights were subject to STDP updates, along with an exponential passive decay, which was multiplied by the complement of the phase of theta (1 − θ(t); see Eq. 6). The presence of this decay is consistent with the nonspecific LTD that might occur during oscillatory spiking in the facilitatory phase of theta (Hasselmo, 2005). This decay was larger for smaller weights, establishing a transition point whereby weakly interacting synapses were pruned (τw = 20). A piecewise linear bounding function was used to protect against sign reversal and run-away weights (see Eq. 7; Wmax = 120; Wmin = 0). Reward (A+) and punishment (A−) of synapses:
Function for STDP between presynaptic and postsynaptic spikes (Song et al., 2000):
 |
where Δt is always the difference between the time of a presynaptic and postsynaptic spike. SDTP synaptic modification at time t for a network with node labels ℵ = {1, …, n}:
 |
C(i, j) is true if and only if i and j are connected. S(t)i. indicates a spike event at the ith neuron at time t. T(k, t) returns the set of all times before time t, at which there was a spike at neuron k. This is used to provide spike events paired, across synapse i, j, with the spike at time t. In addition, we use auxiliary weight variables vij and Vij to enable application of a piecewise linear bounding function (see Eq. 7). Update of auxiliary weight variable and implementation of nonspecific passive decay of synapses:
 |
Piecewise linear bounding function:
 |
Hippocampal neurons were interconnected with a probability of 40% to form a connection. Additionally, as it was assumed that both images were previously known to the participants but not associated, a random 50% of synapses within each subgroup had initial synaptic weights of Wmax, whereas all others were set to 0. This ensured the random assignment of pre-established sets of winning and losing pathways within the subgroups coding for the P and NP image.
Hippocampal neurons received additional input from an ADP function (Jensen et al., 1996) to control activation (Eq. 8; AADP = 100 pA, τADP = 250 ms). This provided exponentially ramping input, which was reset after each spike-event (tfire). Evidence for an ADP function in hippocampal neurons has been found experimentally during cholinergic (Andrade, 1991; Caesar et al., 1993; Libri et al., 1994) and serotonergic (Araneda and Andrade, 1991) modulation, and has the effect here of modeling an effectively inhibitory input for each hippocampal neuron, which wanes the further one is from the eliciting spike. ADP function:
 |
Local field potential and time–frequency analysis methods.
The local field potential (LFP) measures the activity of a group of neurons by first aggregating spikes through time. This was then filtered twice, first by using a Hanning filter with a 30 ms window and then again with a sampling frequency between 2 and 6 or 8 and 12 Hz dependent on whether we are filtering by theta or alpha, respectively. The LFP was analyzed in time–frequency space using a Gabor filter with an upper and lower bound of 2–6 or 8–12 Hz for theta or alpha analysis (γ = 0.5 for <30 Hz or γ = π/2 for >30 Hz). The absolute values were then taken and plotted in time–frequency space.
Code availability.
The MATLAB code that was used to generate the results reported in this paper can be downloaded at https://github.com/GP2789/Sync-deSync-model.
Results
Simulation procedure
We simulated our model based on a learning paradigm used in an MTL single-cell recording experiment (Ison et al., 2015). During the initial screening phase, both the P and NP images were presented individually. This was simulated by independently creating two Poisson distributed spike trains (∼80,000/s for 2 s) that fed into each respective P and NP subgroup of NC neurons (Fig. 1A; P, blue; NP, magenta). An interstimulus interval of 2 s was used. Afterward, we presented both images in a composite stimulus (green), where both subgroups of NC neurons concurrently received spike trains. Following this learning phase, we repeated the screening phase to assess the capability of the network to associate these stimuli together. The whole process was simulated 1000 times to assess the variability of the network, where for each simulation the alpha and theta cosine waves each began at a different random phase (choosing a random 30° angle between 0° and 360°, i.e., N × 30° where N ∈ ℕ s.t. 0 ≤ N ≤ 12), new noisy spike trains were generated, and new initial patterns of connectivity were established. Thus, there was no carryover of weight values between runs. The following results take an average over all simulations, where each simulation is treated as an individual trial with default initial parameters.
Hippocampal weight change
Maximal synaptic modification occurs between hippocampal neurons that are stimulated to shift forward in phase and fire in the inhibitory cycle of an ongoing theta oscillation (Hasselmo, 2005). Due to this, synaptic learning only occurs during the screening and learning phases of the simulation (Fig. 2; NP stimulus, magenta; P stimulus, blue; C stimulus, green) and not during the interstimulus intervals. Weight change after stimulus onset follows the alpha function shape of the activation fed into these neurons. Due to the maximization of a random 50% of synapses within each P and NP subgroup, the average weights of these groups begin at Wmax/2 (Fig. 2A). Throughout the entire simulation, there is weight change within each subgroup (P, blue line; NP, magenta dash) when the respective image they are coding for is presented. With the competitive STDP rule, winning and losing weights are pushed toward Wmax or Wmin, respectively, causing a capping effect where a weight in one direction can still change while its competitor is capped. Here, this means that the average weight of each subgroup rises a small amount to stabilize just above Wmax/2 every time the respective image is presented.
Figure 2.

Hippocampal weight change throughout the simulation both within (A) and between subgroups (B) that code for the P and NP stimulus. Weights within each subgroup increase when the relevant image is presented (A), where the magenta and blue periods indicate the presentation of the NP and P images, respectively, and the green period indicates the presentation of both images combined into a composite image. During this learning period, weights from the NP to the P subgroup (magenta dashed line) and vice versa (solid blue line) increase (B). Outgoing weights then increase upon the presentation of the relevant stimulus after learning (AL). Incoming weights also increase a small amount before learning (BL), then decay back to zero.
When the composite stimulus is presented (green), there is only marked synaptic change between both subgroups (Fig. 2B; P→NP, blue line; NP→P, magenta dash). Here, weights go up bidirectionally as both subgroups of neurons are concurrently stimulated to become active during the inhibitory phase of theta. In this phase, there are short term increases and decreases in weights, as paths are found between subgroups. As indicated by Figure 2B (DL period), sustained changes are positive. When the screening phase is repeated after the learning phase, weights fluctuate and eventually settle with an increase in the direction from the active population to the nonactive population. Before learning, concepts are only strengthened when the relevant image is presented. After learning, both concepts are reinforced upon the presentation of either image, indicating how previously associated but non-present concepts can remain strong over time.
Weights passively decay very slowly according to an exponential pattern to model the effect of a large population of neurons spiking during the facilitatory phase of theta, where LTD has been found to occur (Hasselmo, 2005). As LTP occurs over a spectrum of 1–0, small weight increases occur as neurons spike on either side of the point at which theta maximally inhibits. The passive decay implemented here is stronger for smaller weights (Eq. 6), to mitigate these gradual weight increases and prune irrelevant synapses. This can be seen most prominently in Figure 2B during the initial screening phase (2–4 and 6–8 s), where small weight increases to stimulated neurons decay quickly. LTD weight decay is also prominent in the interstimulus periods, where all weights slowly reduce over time.
Hippocampal activity
Activity is measured as the sum of spikes within bins of a 20 ms width throughout the length of a simulation, taking an average of 1000 simulations with varying random phases for alpha and theta oscillations, where the mean firing rate is shown with bootstrapped confidence intervals (Fig. 3A). As we have access to data from both P and NP neurons, we can capture the network's capability of recognition, where P and NP units respond to their own stimulus, and cued recall, where P and NP units respond to the opposite stimulus. During the initial screening phase before learning, we see that neurons respond to their relevant images (Fig. 3A), where activation at stimulus onset seems to cause a phase reset. This generates a high-frequency damped oscillation that is phase consistent across replications, and rides on top of a much lower frequency-evoked transient, which plays out over a second or more.
Figure 3.
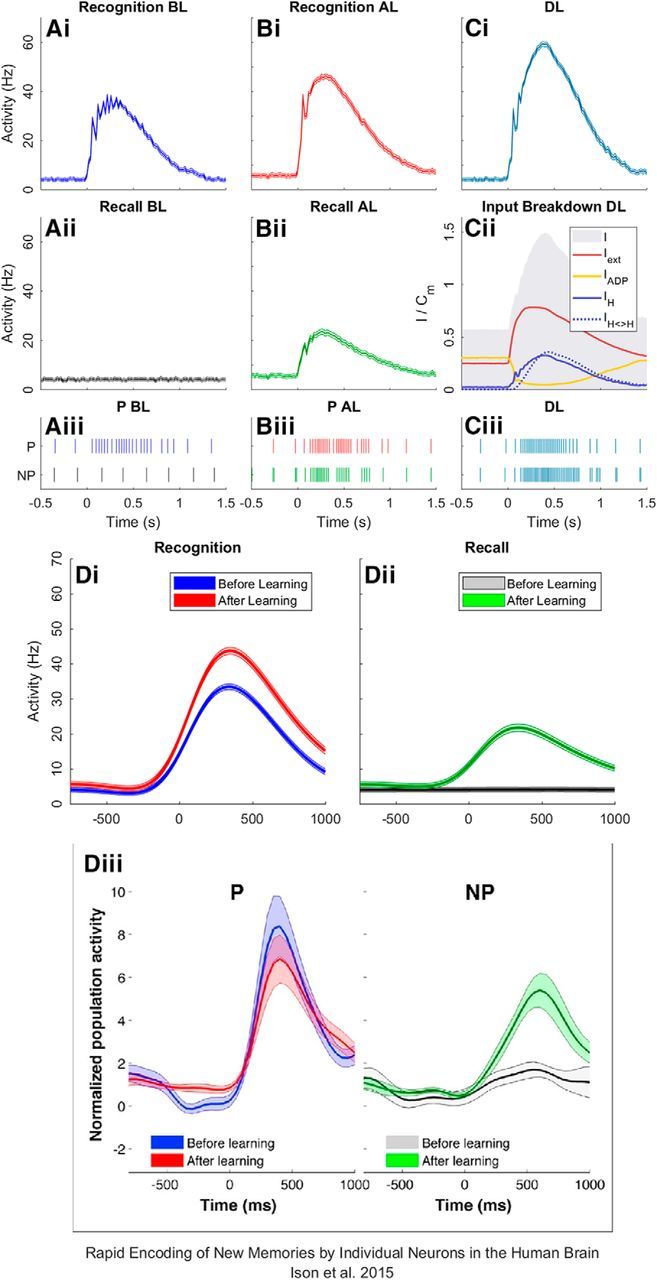
Activity of hippocampal neurons. Recognition reflects neurons responding to their own stimulus, i.e., P units activating for the P stimulus. Cued recall reflects neurons responding to the opposite stimulus, i.e., P units activating for the NP stimulus. Here, activation from before learning (BL; A), after learning (AL; B) and during learning (DL; C) is shown. Raster plots show the activity of a single P and NP neuron during presentations of the P stimulus BL (Aiii), AL (Biii), and DL (Ciii). The average input into both P and NP neurons across all trials is shown in Cii, where coincidental external drive (Iext) during stimulus onset counteracts the effect of the ADP function (IADP). Additional activation causes an increase in input from other neurons within the group (IH) and also from the opposite group (IH<>H) as weights increase during learning. Smoothed activation data at recognition (Di) and recall (Dii) is then compared with data reported in a MTL neuron study (Diii).
When the C image is presented during learning (Fig. 3Ci), activity increases dramatically. Figure 3Cii shows the cause of this increase by breaking down the average input coming into neurons during learning, where the sum of all input sources follows the gray area (I). Here, we see an external force (Iext) drive the hippocampus at stimulus onset, which then causes the ADP current (IADP) to reset before it can reach maximum conductance (Eq. 8; AADP), thus reducing its effect. The relative increase in activation is due to substantial weight change, and resulting additional input, between subgroups (IH<>H). Activation then feeds back into each subgroup dependent on how weights develop.
When the screening phase is repeated after learning, the network successfully performs cued recall (Fig. 3Bii) due to the aforementioned weight change, showing that our model efficiently learns associations between two arbitrary stimuli in one short presentation, a crucial requirement for a model of episodic memory. Similarly, random reciprocal feedback of activity between subgroups causes a relative increase in activation (Fig. 3Bi).
Raster plots show the activation of a single random P and NP neuron, as they respond to presentations of the P stimulus through a randomly chosen trial, where each line corresponds to a spike event (Fig. 3Aiii,Biii,Ciii). These are color coordinated with the relevant activation plots seen above.
We compare the results of our simulation to those from experimental evidence from a recent human single-unit learning paradigm (Ison et al., 2015). Figure 3, Di and Dii, shows smoothed curves (smoothing spline; p = 1e−7) following simulated recognition and cued recall performance before and after learning compared with experimental evidence of the same data in Figure 3Diii. Despite some overlap of confidence intervals, Figures 3, Di and Dii, suggest that there is an increase in prestimulus activation after learning for recognition and recall in both sets of data. Raster plots show that this could be caused by occasional double spike events during the excitatory phase of theta, due to increased weights between neurons (Fig. 3Biii; −500 to 0 ms). Both the model and experimental data indicate successful cued recall after learning (Fig. 3Dii,Diii, green), however, recognition after learning varies (Fig. 3Di,Diii, red). The experimental finding is that encoding neurons become less active with successive presentations of the same stimulus (Ison et al., 2015), perhaps due to a repetition suppression effect (Pedreira et al., 2010). In our model, an increase in recognition activation after learning is caused by the overall increase in synaptic efficacies both between and within subgroups. This could be countered by implementing a habituation mechanism that lies outside of the scope of this model. Such a mechanism could involve the rebalancing of weights or the storing of short-term-memory in a higher brain structure.
Theta phase
Figure 4 shows the theta phase for the cued recall condition during the three stages of the simulation. The red and green halves of the polar distribution represent the excitatory and inhibitory phases of the 4 Hz cosine wave used to model theta, where π/2 is maximum excitation and −π/2 is maximum inhibition. The total number of spikes occurring within each phase quadrant of theta was recorded (Fig. 4Ai,Bi,Ci), as well as the first spike of each neuron after maximum inhibition (>−π/2; Fig. 4Aii,Bii,Cii). The latter analysis was performed to show how hippocampal neurons shift forward in theta phase once stimulated. Spike numbers were normalized over 1000 simulations.
Figure 4.

Polar histograms for the recall condition of all spikes before (Ai), during (Bi), and after learning (Ci), and of first spikes after −π/2 before (Aii), during (Bii), and after learning (Cii). D shows the distinction between the excitatory (red) and inhibitory (green) phases of theta, where LTD and LTP occur, respectively.
Before learning, neurons are unresponsive to the image they do not encode for and oscillate at theta, where all spikes occur during the excitatory phase (Fig. 4Ai; 0 to π/2 to π), with the first spikes generally occurring just before maximum excitation (Fig. 4Aii; 0 to π/2). When the C image is presented during the learning phase, both subgroups become active across all phases of theta (Fig. 4Bi). Importantly, for activation to overcome inhibition, more activity will occur during the inhibitory phase of theta. Neurons also exclusively spiked first immediately after the inhibitory maximum (Fig. 4Bii; −π/2 to 0), indicating that all neurons in the P subgroup successfully phase-shifted forward once stimulated during learning.
When the screening phase occurs again after learning, neurons now respond to the opposite image. Spikes occur in most phase quadrants of theta (Fig. 4Ci), but in the main during the excitatory phase. However, inhibition can now be overcome, allowing spikes to first occur during the negative phase of theta (Fig. 4Cii) and demonstrating a phase shift forward in theta. This shift in phase is an index of successful learning and has been well documented in rodents for neurons encoding a particular place when the rodent approaches that place (Huxter et al., 2003). Our model shows a similar behavior and predicts that this shift in phase is responsible for associative memory formation. Importantly, this phase shift is most evident when analyzing only the first spike within a theta cycle, starting at the theta trough (i.e., where inhibition is maximal). This prediction can be tested in studies recording single units and LFPs in human epilepsy patients (Ison et al., 2015).
Alpha desynchronization
Figure 5A shows time–frequency power spectra (8–12 Hz) of the LFPs of the NC neurons for the recall, recognition and learning phases. A thick band at 10 Hz during the recall condition before learning shows nonstimulated neurons oscillating at alpha (Fig. 5Ai), as they do not respond to an image at this time. When neurons are responsive to the image they encode for in recognition and learning conditions, a strong desynchronization of alpha is exhibited (Fig. 5Aii,Aiii,Av; 0–1 s), simulating the well documented effect of alpha suppression upon visual stimulation (Berger, 1929). A similar, but weaker effect can be seen in the cued recall condition after learning (Fig. 5Aiv; 0–1 s). This desynchronization is due to learning driven activation of hippocampal neurons caused by the association between the P and NP stimuli. This low-frequency drive (from hippocampus to neocortex) desynchronizes alpha by causing substantial activation in the inhibitory phase. The effect can be more clearly seen in Figure 5Bii, where a 20% relative decrease in alpha power from prestimulus to poststimulus is exhibited (Fig. 5Bii; 0–1 s), consistent with the findings that memory retrieval can be predicted by this same alpha desynchronization (Hanslmayr et al., 2012). Prestimulus alpha power is also slightly stronger (Fig. 5Bi; −1 to 0 s), indicating that prestimulus alpha/beta power can be used to predict memory formation (Salari and Rose, 2016). This is due to stronger weights within hippocampal subgroups causing knock-on activation during the excitatory phase of alpha. This activation feeds back into hippocampal units to cause an even more pronounced increase in prestimulus alpha after learning (Fig. 5Ci), where after stimulus onset alpha also significantly decreases in these hippocampal units (Fig. 5Cii), which is consistent with a previous study (Staresina et al., 2016).
Figure 5.

Time–frequency analysis (TFA) of neocortical alpha for the recall and recognition conditions before and after learning (Ai, Aii, Aiv, Av), as well as during learning (Aiii). A time course of alpha power is shown for the color-coded boxes around the recall condition before (Ai) and after (Aiv) learning, where pure power (Bi) and percentage change in prestimulus and poststimulus power (Bii) are shown. The same analysis can be seen for hippocampal alpha, where pure power (Ci) and relative power change (Cii) are shown.
This behavior of our model mimics several findings in the literature showing memory-dependent alpha power decreases during the reinstatement of episodic memories (Khader et al., 2010; Michelmann et al., 2016; Waldhauser et al., 2016). Here, the desynchronization of alpha represents the flow of information in the NC caused by activation of relevant stimuli (Klimesch et al., 2007; Jensen and Mazaheri, 2010).
Theta synchronization
Figure 6, Ai–Av, shows time–frequency power spectra (2–4 Hz) of the LFPs of hippocampal neurons for the recall, recognition, and learning conditions. In the recall condition before learning, neurons do not respond to any image and oscillate at theta (Fig. 6Ai). An increase in theta power accompanies increased activation, because neurons respond to the image they encode for before and during learning (Fig. 6Aii,Aiii). Theta synchronization is stronger during learning, consistent with experimental evidence (Lega et al., 2012; Staudigl and Hanslmayr, 2013; Backus et al., 2016). This is due to the rapid increase in synaptic weights during this period (Fig. 2B; 10–12 s) causing feedback activation, which, in turn, causes more neurons to fire above threshold, but according to the theta rhythm.
Figure 6.

Time–frequency analysis (TFA) of hippocampal theta for the recall and recognition conditions before and after learning (Ai, Aii, Aiv, Av), as well as for during learning (Aiii). A time course of theta power is shown (B) for the color-coded highlighted boxes (Ai, Aiv), where pure power (Bi) and percentage change in prestimulus and poststimulus power (Bii) are shown. The same analysis is shown for neocortical theta power during the same time periods (Ci, Cii).
After the learning phase, neurons are also responsive to the opposite image, where a synchronization of theta occurs due to an increase in activity poststimulus (Fig. 6Aiv). This can be seen more clearly in Figure 6Bii, where there is up to a 60% increase in theta power relative to the prestimulus period. Due to stronger weights between the P and NP clusters, there is increased feedback activity during the normal oscillatory rhythm. This activity is amplified by a higher synaptic time constant (τs = 5 ms for hippocampal neurons), causing an increase in prestimulus theta power (Fig. 6Bi; −1 to 0 s). The same changes in theta power are passed through to the NC (Fig. 6Ci,Cii), which is consistent with experimental evidence of increases of theta in NC areas after learning paradigm experiments (Klimesch et al., 2005; Burke et al., 2014).
Varying stimulus strength
We next varied how strongly our simulated participant perceived the P and NP images during the encoding and recall after learning conditions, allowing us to explore the Sync/deSync of hippocampal theta and NC alpha over time at different strengths. This is achieved by varying stimulus strength, i.e., the rate of spikes per second being fed into NC neurons at stimulus onset, and taking the average power during the poststimulus period across frequencies (0–30 Hz). This information is displayed as heat maps of frequency versus stimulus strength (Fig. 7Ai,Aii,Di,Dii), where stimulus strength is shown on a logarithmic scale from 100 to 106. We can extract from this information to show the evolution of NC alpha (Fig. 7B, red; 8–12 Hz) and hippocampal theta (blue; 3–5 Hz) as neurons are driven more. It can be shown that for weakly perceived stimuli, the NC actually synchronizes in alpha within the model (see ∼103 strength). This is due to input activity being too weak to overcome the trough of the 10 Hz cosine input, but strong enough to cause more spiking in the peak. As stimulus strength increases, a desynchronization of alpha is obtained as neurons overcome inhibition to spike across all phases of alpha (see ∼105 strength). In contrast, the hippocampus exhibits a strong synchronization of 4 Hz (Fig. 7B) with increasing stimulus strength. This is due to the ADP function preventing neurons recovering quickly after a spike event. This then is an important difference between the neo-cortical and hippocampal systems, which underlies why (apart from with very strong inputs) the hippocampus synchronizes rather than desynchronizes; essentially the ADP function prevents the hippocampus from desynchronizing. Weight change between P and NP units also increases monotonically with stimulus strength, plateauing at the same level that theta and alpha maximally Sync/deSync, respectively. This indicates why alpha desynchronization and theta synchronization are both markers of successful memory encoding (Hanslmayr et al., 2012; Lega et al., 2012; Staudigl and Hanslmayr, 2013; Backus et al., 2016). Hippocampal theta synchronization can also be seen to bleed into NC neurons as stimulus strength increases (Fig. 7Ai; 104–106 strength), corroborating experimental evidence (Klimesch et al., 2005; Burke et al., 2014).
Figure 7.

Increasing stimulus strength (number of spikes being fed into NC neurons) during the encoding (DL) and recall after learning conditions, where stimulus strength is depicted on a logarithmic scale. During the encoding stage (A–C), frequency by strength heat maps of NC (Ai) and hippocampus (Aii) are shown. From these data, relative changes in NC alpha (B, red; 8–12 Hz) and hippocampal theta power (B, blue; 3–5 Hz) are plotted, as well as weight change between P and NP hippocampal subgroups (B, black). From this plot, three different stimulus strength values are chosen: normal oscillatory activity (∼101 strength), small alpha power increases (∼103 strength) and maximal theta power increases (∼105 strength). At these points, LFPs are calculated using specific 2–6 or 8–12 Hz filters for hippocampal theta (Cii) and NC alpha (Ci), respectively, where blue and red highlighted regions indicate the possible stimulus onset area due to realigning phases across multiple trials. The same symbols indicate at which point an LFP represents. The same format is applied for the recall after learning condition (D–F).
When we push the model past normal levels of activation (the model's default is ∼8 × 10⁴), hippocampal theta eventually desynchronizes, indicating that although the ADP function essentially acts as a break on hippocampal units, it can eventually be overcome. Weight change remains high as units are spiking across all phases of theta. This gives a possible explanation for why some experimental evidence also finds a positive correlation with successful memory encoding and hippocampal theta desynchronization (Greenberg et al., 2015; Crespo-García et al., 2016; Fellner et al., 2016).
We also choose three important points from Figure 7B that best convey the model's Sync/deSync characteristics, indicated by vertical green lines during first normal oscillatory behavior; second, alpha sync; and third, maximal theta sync and alpha desync. The corresponding LFPs (indicated by the same symbol) are shown for these three points for NC (Fig. 7Ci) and hippocampal units (Fig. 7Cii). NC alpha LFPs show how power can increase when more spikes during the excitatory phase cause larger amplitudes of activity (Fig. 7Ci, cross), and how power decreases when activation occurs throughout an oscillation (Fig. 7Ci, triangle). Similarly, hippocampal theta LFPs show how power can increase with increased activation in the peaks, despite the low-level activation in the trough (Fig. 7Cii, triangle) that is responsible for learning.
The same analysis has been performed for the recall condition after learning, with similar results. Importantly, the method of desynchronization is different in this condition. As Figure 7Di shows, in the NC an alpha desync at recall is accompanied by a theta sync, indicating that alpha is desynced by theta as activation feeds into the hippocampus, which in turn feeds activation back to the NC. This ensures we do not see a small synchronization of alpha with low levels of stimulus strength as we saw in the encoding condition. As theta and alpha phases are rarely aligned (Figs. 7, compare Fi and Fii LFP plots), maximal theta excitability is just as likely to desynchronize by occurring during an alpha inhibitory phase as it is to be facilitated by aligning with an alpha excitatory phase. As stimulus strength increases, one observes both hippocampal theta synchronization and NC alpha desynchronization accordingly, indicating that both are important for successful memory retrieval.
Figure 7E shows that the model is able to exhibit re-instantiation of a memory's content. That is, neocortical alpha desynchronizes during recall for the stimulus cued, but not presented. This represents a purely endogenous activation of rich content.
Sync/deSync predicts learning
Having demonstrated that our model mimics the described behavior of alpha power decreases in the NC, and theta power increases and phase dynamics in the hippocampus, we now link these contrasting synchronization behaviors with learning (Fig. 8). By varying the learning rate of STDP weight change (ε) between 0 and 1, it was possible to assess how the model behaves with different learning outcomes. The average of all bidirectional hippocampal weights between subgroups P and NP increased with ε (Fig. 8C), which is used here to assess learning, i.e., the stronger the weight change the better the memory. We then calculate the effectiveness of recall (P response to NP + NP response to P) as a percentage change in power at a particular frequency from before learning to after learning, effectively allowing us to isolate the effect of learning on power. A bootstrap procedure then provided the confidence intervals (Fig. 8, shaded area) around a mean (solid line) of recall power for incremental values of ε for prestimulus (black) and poststimulus (red) periods.
Figure 8.

The effect of increasing the learning rate (ε), and therefore synaptic efficacy between P and NP subgroups, on NC alpha power (Ai), hippocampal theta power (Bi), NC theta power (Aii), and hippocampal alpha power (Bii). C plots the mean and variance of P↔NP weights from 1000 simulations, where the learning rate (ε) was incremented gradually from 0 to 1.
From this we can use power at a particular frequency to predict whether learning has successfully occurred in our model, and vice versa. In respect of the Sync/deSync theory (Hanslmayr et al., 2016), the model indicates that both a desynchronization of alpha in NC areas (Fig. 8Ai) and a synchronization of theta in hippocampal areas (Fig. 8Bi) during recall can predict successful memory retrieval.
Interestingly, one could also look at prestimulus theta and alpha power in the hippocampus to predict whether learning has occurred (Fig. 8Bi,Bii, black), where both increase by 30–40% due to stronger weights within the hippocampus and reciprocal connectivity between the hippocampus and NC. This is consistent with evidence that reports the importance of prestimulus theta for learning (Gyderian et al., 2009; Fell et al., 2011). The effect of feedback activity plays a smaller role in NC areas, where a small increase (<5%) in prestimulus alpha power (Fig. 8Ai, black) and an increase (<20%) in prestimulus theta power (Fig. 8Aii, black) can also predict learning (Salari and Rose, 2016). Importantly, there is a large synchronization of theta (<70%) at recall (Fig. 8Bii, red) in NC areas, consistent with experimental findings (Klimesch et al., 2005; Burke et al., 2014).
Discussion
We have presented a relatively simple spiking neural network model, which captures the complex synchronizing and desynchronizing behaviors of hippocampus and neocortex during encoding and retrieval in a typical memory task. This model, which we term the Sync/deSync (SdS) model, simulates hippocampal theta synchronization and neocortical alpha desynchronization in the service of encoding and retrieving novel stimulus associations; a key requirement of episodic memory. Consistent with the notion that one-shot learning occurs in the hippocampus, but not in the neocortex (O'Reilly et al., 2014), our model only implements synaptic modifications in the hippocampus. This hippocampal learning uses two well described synaptic modification mechanisms. The first is STDP (Song et al., 2000), where synaptic modifications increase exponentially with decreasing time lag between the firing of presynaptic and postsynaptic neurons. The second mechanism is theta phase-dependent plasticity, where synapses between neurons firing in the inhibitory phase of theta are strengthened, whereas synaptic connections between neurons firing in the excitatory phase are weakened (Hasselmo, 2005). In the model neocortex, neurons fire phase-locked to an alpha oscillation when they receive no input (Klimesch et al., 2007; Jensen and Mazaheri, 2010). When these neurons are driven by a stimulus, they increase their firing rate and gradually desynchronize from the ongoing alpha, especially when the input is strong enough to overcome maximum inhibition. Therefore, alpha power decrease is negatively related to the neural firing rate (apart from the small power increase at low stimulus intensities), thereby mimicking the well known negative relationship between alpha and neural firing (Haegens et al., 2011).
The Sync/deSync model draws inspiration from and resonates with a number of previous models that incorporate oscillations into the complementary learning systems framework. In particular, the concept of theta phase-dependent plasticity in the hippocampus has inspired aspects of a number of influential neural models (Hasselmo et al., 2002; Norman et al., 2005; Ketz et al., 2013). An important component in two of these models (Hasselmo at al., 2005; Ketz et al., 2013) is a phase reversal between the two pathways from entorhinal cortex to CA1 (the monosynaptic performant pathway and the trisynaptic pathway, via the Schaffer collaterals), which could provide a powerful mechanism in terms of separating encoding from retrieval cycles. We chose not to fully model this aspect in detail, but focused particularly on the dynamics in area CA1 to keep the model as simple as possible. Norman et al. (2005) present an important refinement of the basic complementary learning systems model, in which the strength of k Winner-Take-All inhibition is varied across theta phases. This modulation of inhibition provides a theta-phase-dependent learning, with parallels to the Sync/deSync model. That is, in the Norman et al. (2005) model, the high inhibition phase of theta generates selective activation, restricting above-threshold activation to strongly responding units. LTP is then applied just to the active units, enabling selective weight update. This has similarities to the Sync/deSync idea that strongly active units move their spiking forward in the phase of theta, enabling LTP (which only obtains in the inhibitory phase) to be selectively applied.
The match between the Norman et al. (2005) and Sync/deSync models for the low inhibition phase of theta is a little weaker than for the high inhibition phase, but there are still parallels. Specifically, both models exhibit activation of a broader profile of units in the low inhibition phase. In the Norman et al. (2005) model, this enables LTD to be applied to competitor units (that are not strongly tuned to the memory being encoded). Sync/deSync similarly applies LTD in this low inhibition phase, however, it is a nonspecific, passive, decay.
Our use of an ADP function to reduce the capacity for units to spike multiple times in quick succession is inherited from the Jensen and Lisman (2005) model. Additionally, while advancing the phase of theta at which a unit spikes plays a key role in the Sync/deSync model, it is somewhat different to precession in the Jensen and Lisman (2005) model, where it encodes serial order.
The Sync/deSync model is also able to capture a number of human electrophysiological findings. Human single-neuron recordings revealed that hippocampal neurons can change their tuning, by showing an increase in firing rate to a nonpreferred stimulus after this stimulus has been associated with a preferred stimulus (Ison et al., 2015). Furthermore, Rutishauser et al. (2010) showed that a significant portion of neurons in the MTL are phase-locked to the ongoing theta rhythm during memory encoding, with an increase in theta phase-locking predicting later memory performance. Our model is consistent with these findings in showing an increase in activation for newly associated neurons, these responses being theta phase-locked, and increased theta synchronicity to be related to later memory performance. However, Sync/deSync also suggests that responsive neurons during learning are less locked to the ongoing theta phase (Fig. 4A,B), which seems at odds with Rutishauser et al. (2010). This decrease in theta phase-locking is present for responsive neurons only, occurring since these units overcome maximum inhibition and thus fire at the LTP phase of theta. Importantly, Rutishauser et al. (2010) did not separate neurons into stimulus responsive (i.e., showing an increase in firing rate) or not, therefore these findings cannot be directly linked to our model. However, an interesting prediction that arises from the model is that the preferred phase of firing differs between responsive and nonresponsive neurons, and that this phase difference is related to later memory performance. Indeed, Rutishauser et al. (2010) found that different neurons were locked to different phases of ongoing theta. In our model, this difference is most prominent when only the first spike occurring after maximum inhibition is considered, a specific prediction that can be tested in future experiments.
Inherent to the Sync/deSync model is that the same neurons can be either synchronized or desynchronized depending upon the strength of driving input. By gradually increasing stimulus strength, a population with more inhibition/slower integration can exhibit a synchronization at stimulus strengths when faster spiking populations exhibit a desynchronization (Fig. 7B; ∼105 strength). This provides a neat explanation for the Sync/deSync conundrum, suggesting that it reflects the point where active neurons in different brain regions are on their trajectory toward a ceiling firing rate. We show in Figure 7B that the slower spiking hippocampal population synchronizes with normal levels of input (∼105), but will eventually desynchronize (∼106). In fact, noninvasive studies in humans have linked successful encoding of stimulus associations in the MTL with both theta power increases (Kaplan et al., 2012; Staudigl and Hanslmayr, 2013; Backus et al., 2016), and decreases (Greenberg et al., 2015; Crespo-García et al., 2016; Fellner et al., 2016). Sync/deSync indicates that both eventualities could yield successful memory encoding (Fig. 7B, black and blue lines; which is trending negative at the top range of stimulus strengths).
With respect to alpha, many studies have shown that a decrease in alpha power coincides with successful encoding and retrieval of episodic memories (for review, see Hanslmayr et al., 2012; Hanslmayr and Staudigl, 2014). In most previous studies, these effects extend also to beta. For this reason, and to ensure model simplicity, we have assumed only one cortical alpha rhythm, although, we see no reason why the same principles would not also apply to beta. During successful encoding of episodic memories, alpha/beta power decreases have been found in left frontal areas for verbal material (Hanslmayr et al., 2009, 2011; Meeuwissen et al., 2011) and occipital for visual material (Noh et al., 2014). During retrieval, alpha/beta power decreases indicate the areas that are being reactivated, i.e., house the memory representation (Khader and Rösler, 2011; Michelmann et al., 2016; Waldhauser et al., 2016). This targeted alpha/beta power decrease is exactly what is modeled here, with only neural assemblies that actively process the stimulus during encoding or retrieval showing power decreases, and the degree of this power decrease predicting memory performance. A key element of formal modeling is the identification of predictions that give the opportunity for the model to be falsified. The key predictions that Sync/deSync makes are presented in Figure 7B, which shows that as driving stimulus strength increases, neo-cortical alpha goes through an initial phase (strength ∼103), of alpha power increase (i.e., synchronization), followed by a much more marked alpha power decrease (i.e., desynchronization), which is maximal just below a strength of 105. This pattern could be argued to be inherent to the way synchronization and desynchronization are modeled, i.e., a small increase in drive will generate more spikes at an oscillation's peak, and power will increase, whereas a large drive will cause spiking during the trough of the oscillation and power will go down. This pattern is our main prediction.
A further prediction is that the degree of alpha power decrease should correlate with the degree of hippocampal theta power increase, and the degree of phase precession of responsive neurons in the hippocampus. This prediction can be tested in intracranial EEG, which often records simultaneously from the neocortex and the hippocampus.
Footnotes
This work was supported by the ERC Grant Code4Memory (Grant Agreement 647954) awarded to S.H. S.H. is further supported by the Royal Society and Wolfson Society.
References
- Andrade R. (1991) Cell excitation enhances muscarinic cholinergic responses in rat association cortex. Brain Res 548:81–93. 10.1016/0006-8993(91)91109-E [DOI] [PubMed] [Google Scholar]
- Araneda R, Andrade R (1991) 5-Hydroxtryptamine 2 and 5-hydroxtryptamine 1A receptors mediate opposing responses on membrane excitability in rat association cortex. Neuroscience 40:399–412. 10.1016/0306-4522(91)90128-B [DOI] [PubMed] [Google Scholar]
- Backus AR, Schoffelen JM, Szebényi S, Hanslmayr S, Doeller CF (2016) Hippocampal-prefrontal theta oscillations support memory integration. Curr Biol 26:450–457. 10.1016/j.cub.2015.12.048 [DOI] [PubMed] [Google Scholar]
- Berger H. (1929) Über das elektrenkephalogramm des menschen. H Archiv f Psychiatrie 87:527–570. 10.1007/BF01797193 [DOI] [Google Scholar]
- Burke JF, Sharan AD, Sperling MR, Ramayya AG, Evans JJ, Healey MK, Beck EN, Davis KA, Lucas TH 2nd, Kahana MJ (2014) Theta and high-frequency activity mark spontaneous recall of episodic memories. J Neurosci 34:11355–11365. 10.1523/JNEUROSCI.2654-13.2014 [DOI] [PMC free article] [PubMed] [Google Scholar]
- Caesar M, Brown DA, Gahwiler BH, Knöpfel T (1993) Characterization of a calcium-dependent current generating a slow after depolarization of CA3 pyramidal cells in rat hippocampal slice cultures. Eur J Neurosci 5:560–569. 10.1111/j.1460-9568.1993.tb00521.x [DOI] [PubMed] [Google Scholar]
- Crespo-García M, Zeiller M, Leupold C, Kreiselmeyer G, Rampp S, Hamer HM, Dalal SS (2016) Slow-theta power decreases during item-place encoding predict spatial accuracy of subsequent context recall. Neuroimage 142:533–543. 10.1016/j.neuroimage.2016.08.021 [DOI] [PubMed] [Google Scholar]
- Fell J, Axmacher N (2011) The role of phase synchronisation in memory processes. Nat Rev Neurosci 12:105–118. 10.1038/nrn2979 [DOI] [PubMed] [Google Scholar]
- Fell J, Ludowig E, Staresina BP, Wagner T, Kranz T, Elger CE, Axmacher N (2011) Medial temporal theta/alpha power enhancement precedes successful memory encoding: evidence based on intracranial EEG. J Neurosci 31:5392–5397. 10.1523/JNEUROSCI.3668-10.2011 [DOI] [PMC free article] [PubMed] [Google Scholar]
- Fellner MC, Volberg G, Wimber M, Goldhacker M, Greenlee MW, Hanslmayr S (2016) Spatial mnemonic encoding: theta power decreases and medial temporal lobe BOLD increases co-occur during the usage of the method of loci. eNeuro 3:ENEURO.0184–16.2016. 10.1523/ENEURO.0184-16.2016 [DOI] [PMC free article] [PubMed] [Google Scholar]
- Greenberg JA, Burke JF, Haque R, Kahana MJ, Zaghloul KA (2015) Decreases in theta and increases in high frequency activity underlie associative memory encoding. Neuroimage 114:257–263. 10.1016/j.neuroimage.2015.03.077 [DOI] [PMC free article] [PubMed] [Google Scholar]
- Gyderian S, Schott BH, Richardson-Klavehn A, Düzel E (2009) Medial temporal theta state before an event predicts episodic encoding success in humans. Proc Natl Acad Sci U S A 106:5365–5370. 10.1073/pnas.0900289106 [DOI] [PMC free article] [PubMed] [Google Scholar]
- Haegens S, Nácher V, Luna R, Romo R, Jensen O (2011) α-Oscillations in the monkey sensorimotor network influence discrimination performance by rhythmical inhibition of neuronal spiking. Proc Natl Acad Sci U S A 108:19377–19382. 10.1073/pnas.1117190108 [DOI] [PMC free article] [PubMed] [Google Scholar]
- Hanslmayr S, Staudigl T (2014) How brain oscillations form memories: a processing based perspective on oscillatory subsequent memory effects. Neuroimage 85:648–655. 10.1016/j.neuroimage.2013.05.121 [DOI] [PubMed] [Google Scholar]
- Hanslmayr S, Spitzer B, Bäuml KH (2009) Brain oscillations dissociate between semantic and nonsemantic encoding of episodic memories. Cereb Cortex 19:1631–1640. 10.1093/cercor/bhn197 [DOI] [PubMed] [Google Scholar]
- Hanslmayr S, Gross J, Klimesch W, Shapiro KL (2011) The role of alpha oscillations in temporal attention. Brain Res Rev 67:331–343. 10.1016/j.brainresrev.2011.04.002 [DOI] [PubMed] [Google Scholar]
- Hanslmayr S, Staudigl T, Fellner MC (2012) Oscillatory power decreases and long-term memory: the information via desynchronization hypothesis. Front Hum Neurosci 6:74. 10.3389/fnhum.2012.00074 [DOI] [PMC free article] [PubMed] [Google Scholar]
- Hanslmayr S, Staresina BP, Bowman H (2016) Oscillations and episodic memory: addressing the synchronization/desynchronization conundrum. Trends Neurosci 39:16–25. 10.1016/j.tins.2015.11.004 [DOI] [PMC free article] [PubMed] [Google Scholar]
- Hasselmo ME. (2005) What is the function of hippocampal theta rhythm? Linking behavioral data to phasic properties of field potential and unit recording data. Hippocampus 15:936–949. 10.1002/hipo.20116 [DOI] [PubMed] [Google Scholar]
- Hasselmo ME, Eichenbaum H (2005) Hippocampal mechanisms for the context-dependent retrieval of episodes. Neural Netw 18:1172–1190. 10.1016/j.neunet.2005.08.007 [DOI] [PMC free article] [PubMed] [Google Scholar]
- Hasselmo ME, Bodelón C, Wyble BP (2002) A proposed function for hippocampal theta rhythm: separate phases of encoding and retrieval enhance reversal of prior learning. Neural Comput 14:793–817. 10.1162/089976602317318965 [DOI] [PubMed] [Google Scholar]
- Heusser AC, Poeppel D, Ezzyat Y, Davachi L (2016) Episodic sequence memory is supported by a theta-gamma phase code. Nat Neurosci 19:1374–1380. 10.1038/nn.4374 [DOI] [PMC free article] [PubMed] [Google Scholar]
- Huerta PT, Lisman JE (1995) Bidirectional synaptic plasticity induced by a single burst during cholinergic theta oscillation in CA1 in vitro. Neuron 15:1053–1063. 10.1016/0896-6273(95)90094-2 [DOI] [PubMed] [Google Scholar]
- Hughes SW, Lörincz M, Cope DW, Blethyn KL, Kékesi KA, Parri HR, Juhász G, Crunelli V (2004) Synchronized oscillations at alpha and theta frequencies in the lateral geniculate nucleus. Neuron 42:253–268. 10.1016/S0896-6273(04)00191-6 [DOI] [PubMed] [Google Scholar]
- Huxter J, Burgess N, O'Keefe J (2003) Independent rate and temporal coding in hippocampal pyramidal cells. Nature 425:828–832. 10.1038/nature02058 [DOI] [PMC free article] [PubMed] [Google Scholar]
- Ison MJ, Quian Quiroga R, Fried I (2015) Rapid encoding of new memories by individual neurons in the human brain. Neuron 87:220–230. 10.1016/j.neuron.2015.06.016 [DOI] [PMC free article] [PubMed] [Google Scholar]
- Jensen O, Mazaheri A (2010) Shaping functional architecture by oscillatory alpha activity: gating by inhibition. Front Hum Neurosci 4:186. 10.3389/fnhum.2010.00186 [DOI] [PMC free article] [PubMed] [Google Scholar]
- Jensen O, Idiart M. Lisman J (1996) Physiologically realistic formation of autoassociative memory in networks with theta/gamma oscillations: role of fast NMDA channels. Learn Mem 3:243–256. 10.1101/lm.3.2-3.243 [DOI] [PubMed] [Google Scholar]
- Jensen O, Lisman JE (2005) Hippocampal sequence-encoding driven by a cortical multi-item working memory buffer. Trends Neurosci 28:67–72. 10.1016/j.tins.2004.12.001 [DOI] [PubMed] [Google Scholar]
- Jokisch D, Jensen O (2007) Modulation of gamma and alpha activity during a working memory task engaging the dorsal or ventral stream. J Neurosci 27:3244–3251. 10.1523/JNEUROSCI.5399-06.2007 [DOI] [PMC free article] [PubMed] [Google Scholar]
- Kaplan R, Doeller CF, Barnes GR, Litvak V, Düzel E, Bandettini PA, Burgess N (2012) Movement-related theta rhythm in humans: coordinating self-directed hippocampal learning. PLoS Biol 10:e1001267. 10.1371/journal.pbio.1001267 [DOI] [PMC free article] [PubMed] [Google Scholar]
- Ketz N, Morkonda SG, O'Reilly RC (2013) Theta coordinated error-driven learning in the hippocampus. PLoS Comput Biol 9:e1003067. 10.1371/journal.pcbi.1003067 [DOI] [PMC free article] [PubMed] [Google Scholar]
- Khader PH, Rösler F (2011) EEG power changes reflect distinct mechanisms during long-term memory retrieval. Psychophysiology 48:362–369. 10.1111/j.1469-8986.2010.01063.x [DOI] [PubMed] [Google Scholar]
- Khader P, Jost K, Ranganath C, Rösler F (2010) Theta and alpha oscillations during working-memory maintenance predict successful long-term memory encoding. Neurosci Lett 468:339–343. 10.1016/j.neulet.2009.11.028 [DOI] [PMC free article] [PubMed] [Google Scholar]
- Klimesch W, Schack B, Sauseng P (2005) The functional significance of theta and upper alpha oscillations. Exp Psychol 52:99–108. 10.1027/1618-3169.52.2.99 [DOI] [PubMed] [Google Scholar]
- Klimesch W, Sauseng P, Hanslmayr S (2007) EEG alpha oscillations: the inhibition-timing hypothesis. Brain Res Rev 53:63–88. 10.1016/j.brainresrev.2006.06.003 [DOI] [PubMed] [Google Scholar]
- Lega BC, Jacobs J, Kahana M (2012) Human hippocampal theta oscillations and the formation of episodic memories. Hippocampus 22:748–761. 10.1002/hipo.20937 [DOI] [PubMed] [Google Scholar]
- Libri V, Constanti A, Calaminici M, Nisticó G (1994) A comparison of the muscarinic response and morphological properties of identified cells in the guinea-pig olfactory cortex in vitro. Neuroscience 59:331–347. 10.1016/0306-4522(94)90600-9 [DOI] [PubMed] [Google Scholar]
- Meeuwissen EB, Takashima A, Fernández G, Jensen O (2011) Increase in posterior alpha activity during rehearsal predicts successful long-term memory formation of word sequences. Hum Brain Mapp 32:2045–2053. 10.1002/hbm.21167 [DOI] [PMC free article] [PubMed] [Google Scholar]
- Michelmann S, Bowman H, Hanslmayr S (2016) The temporal signature of memories: identification of a general mechanism for dynamic memory replay in humans. PLoS Biol 14:e1002528. 10.1371/journal.pbio.1002528 [DOI] [PMC free article] [PubMed] [Google Scholar]
- Noh E, Herzmann G, Curran T, de Sa VR (2014) Using single-trial EEG to predict and analyze subsequent memory. Neuroimage 84:712–723. 10.1016/j.neuroimage.2013.09.028 [DOI] [PMC free article] [PubMed] [Google Scholar]
- Norman KA, Newman EL, Perotte AJ (2005) Methods for reducing interference in the complementary learning systems model: oscillating inhibition and autonomous memory rehearsal. Neural Netw 18:1212–1228. 10.1016/j.neunet.2005.08.010 [DOI] [PubMed] [Google Scholar]
- O'Reilly RC, Bhattacharyya R, Howard MD, Ketz N (2014) Complementary learning systems. Cogn Sci 38:1229–1248. 10.1111/j.1551-6709.2011.01214.x [DOI] [PubMed] [Google Scholar]
- Pavlides C, Greenstein YJ, Grudman M, Winson J (1988) Long-term potentiation in the dentate gyrus is induced preferentially on the positive phase of theta-rhythm. Brain Res 439:383–387. 10.1016/0006-8993(88)91499-0 [DOI] [PubMed] [Google Scholar]
- Pedreira C, Mormann F, Kraskov A, Cerf M, Fried I, Koch C, Quiroga RQ (2010) Responses of human medial temporal lobe neurons are modulated by stimulus repetition. J Neurophysiol 103:97–107. 10.1152/jn.91323.2008 [DOI] [PMC free article] [PubMed] [Google Scholar]
- Petsche H, Stumpf C, Gogolak G (1962) The significance of the rabbit's septum as a relay station between the midbrain and the hippocampus: I. the control of hippocampus arousal activity by the septum cells. Electroencephalogr Clin Neurophysiol 14:202–211. 10.1016/0013-4694(62)90030-5 [DOI] [PubMed] [Google Scholar]
- Rotstein HG, Pervouchine DD, Acker CD, Gillies MJ, White JA, Buhl EH, Whittington MA, Kopell N (2005) Slow and fast inhibition and an H-current interact to create a theta rhythm in a model of CA1 interneuron network. J Neurophysiol 94:1509–1518. 10.1152/jn.00957.2004 [DOI] [PubMed] [Google Scholar]
- Rutishauser U, Ross IB, Mamelak AN, Schuman EM (2010) Human memory strength is predicted by theta-frequency phase-locking of single neurons. Nature 464:903–907. 10.1038/nature08860 [DOI] [PubMed] [Google Scholar]
- Salari N, Rose M (2016) Dissociation of the functional relevance of different pre-stimulus oscillatory activity for memory formation. Neuroimage 125:1013–1021. 10.1016/j.neuroimage.2015.10.037 [DOI] [PubMed] [Google Scholar]
- Song S, Miller KD, Abbott LF (2000) Competitive Hebbian learning through spike-timing-dependent-plasticity. Nat Neurosci 3:919–926. 10.1038/78829 [DOI] [PubMed] [Google Scholar]
- Staresina BP, Michelmann S, Bonnefond M, Jensen O, Axmacher N, Fell J (2016) Hippocampal pattern completion is linked to gamma power increases and alpha power decreases during recollection. eLife 5:e17397. 10.7554/eLife.17397 [DOI] [PMC free article] [PubMed] [Google Scholar]
- Staudigl T, Hanslmayr S (2013) Theta oscillations at encoding mediate the context-dependent nature of human episodic memory. Curr Biol 23:1101–1106. 10.1016/j.cub.2013.04.074 [DOI] [PubMed] [Google Scholar]
- van Kerkoerle T, Self MW, Dagnino B, Gariel-Mathis MA, Poort J, van der Togt C, Roelfsema PR (2014) Alpha and gamma oscillations characterize feedback and feedforward processing in monkey visual cortex. Proc Natl Acad Sci U S A 111:14332–14341. 10.1073/pnas.1402773111 [DOI] [PMC free article] [PubMed] [Google Scholar]
- Waldhauser GT, Johansson M, Hanslmayr S (2012) Alpha/beta oscillations indicate inhibition of interfering visual memories. J Neurosci 32:1953–1961. 10.1523/JNEUROSCI.4201-11.2012 [DOI] [PMC free article] [PubMed] [Google Scholar]
- Waldhauser GT, Braun V, Hanslmayr S (2016) Episodic memory retrieval functionally relies on very rapid reactivation of sensory information. J Neurosci 36:251–260. 10.1523/JNEUROSCI.2101-15.2016 [DOI] [PMC free article] [PubMed] [Google Scholar]