

Abstract
Inflammatory processes may be involved in the pathophysiology of neuropsychiatric illnesses including autism spectrum disorder (ASD). Evidence from studies in rodents indicates that immune activation during early development can produce core features of ASD (social interaction deficits, dysregulation of communication, increases in stereotyped behaviors, and anxiety), although the neural mechanisms of these effects are not thoroughly understood. We treated timed-pregnant mice with polyinosinic:polycytidylic acid (Poly I:C), which simulates a viral infection, or vehicle on gestational day 12.5 to produce maternal immune activation (MIA). Male offspring received either vehicle or lipopolysaccharide, which simulates a bacterial infection, on postnatal day 9 to produce postnatal immune activation (PIA). We then used optogenetics to address the possibility that early developmental immune activation causes persistent alterations in the flow of signals within the mPFC to basolateral amygdala (BLA) pathway, a circuit implicated in ASD. We found that our MIA regimen produced increases in synaptic strength in glutamatergic projections from the mPFC to the BLA. In contrast, our PIA regimen produced decreases in feedforward GABAergic inhibitory postsynaptic responses resulting from activation of local circuit interneurons in the BLA by mPFC-originating fibers. Both effects were seen together when the regimens were combined. Changes in the balance between excitation and inhibition were differentially translated into the modified spike output of BLA neurons. Our findings raise the possibility that prenatal and postnatal immune activation may affect different cellular targets within brain circuits that regulate some of the core behavioral signs of conditions such as ASD.
SIGNIFICANCE STATEMENT Immune system activation during prenatal and early postnatal development may contribute to the development of autism spectrum disorder (ASD). Combining optogenetic approaches and behavioral assays that reflect core features of ASD (anxiety, decreased social interactions), we uncovered mechanisms by which the ASD-associated behavioral impairments induced by immune activation could be mediated at the level of interactions within brain circuits implicated in control of emotion and motivation (mPFC and BLA, specifically). Here, we present evidence that prenatal and postnatal immune activation can have different cellular targets in the brain, providing support to the notion that the etiology of ASD may be linked to the excitation/inhibition imbalance in the brain affecting the signal flow within relevant behavior-driving neural microcircuits.
Keywords: autism, model, neural circuits, optogenetics, synaptic plasticity
Introduction
Accumulating evidence suggests that the immune system is involved in neuropsychiatric conditions including autism spectrum disorder (ASD) (Miller et al., 2017). ASD comprises a group of neurodevelopmental disorders with distinctive behavioral manifestations and complex underlying mechanisms (Markram and Markram, 2010). The contribution of genetic factors to some forms of ASD is well established (Abrahams and Geschwind, 2008; Betancur, 2011; O'Roak et al., 2012; Talkowski et al., 2014). However, environmental factors, including those that trigger immune responses, may also play a role in the etiology of ASD (Onore et al., 2012; McDougle et al., 2015; Lombardo et al., 2017; Meltzer and Van de Water, 2017). Several studies have shown that viral infection during the second trimester of pregnancy is associated with an increased risk of ASD (Patterson, 2009; Atladóttir et al., 2010; Zerbo et al., 2011; Knuesel et al., 2014; Patel et al., 2017). Consistent with the results of studies in humans, immune system activation in laboratory animals can recapitulate key aspects of ASD, supporting the notion that immunoactivation in the brain could lead to the development of functional abnormalities characteristic of ASD (Smith et al., 2007; Sangha et al., 2014; Canetta et al., 2016; Choi et al., 2016; Missig et al., 2018).
It is becoming increasingly clear that ASD is a neural network phenomenon that may reflect dysregulation of functional interactions between brain regions, controlling specific behavioral domains. Typically, aberrant social interactions, communication deficits, and increases in stereotyped behaviors are considered to be the primary diagnostic features of ASD, but these signs are frequently comorbid with other features including enhanced anxiety. The neurocircuits underlying social interaction and anxiety-related behaviors are well defined and include the mPFC and the amygdala (AMG) (Baron-Cohen et al., 1999; Markram and Markram, 2010). Accordingly, there is increasing interest in the possibility that ASD-associated behavioral impairments may be linked to dysfunction within these neural circuits. It has been demonstrated in genetic and valproic acid exposure models that the development of ASD-like behavioral signs is associated with hyperconnectivity within the mPFC (Rinaldi et al., 2008; Sui and Chen, 2012; Testa-Silva et al., 2012). This could increase activation of target areas receiving projections from the mPFC, including the AMG. Because the AMG is a key component of the brain circuits underlying anxiety-related behaviors (LeDoux, 2000), increased mPFC–AMG functional connectivity might contribute to features of anxiety and social avoidance seen in ASD.
Previous studies have implicated the activity of projections from the mPFC to the AMG in control of anxiety and fear (Maren and Quirk, 2004; Pape and Pare, 2010). It remains unknown, however, whether the development of ASD features is associated with altered neurotransmission in the mPFC–basolateral AMG (BLA) pathway. Using optogenetic techniques (Boyden et al., 2005), we addressed this question in a “two-hit” mouse model (Harvey and Boksa, 2012; Giovanoli et al., 2013; Missig et al., 2018), exploring the possibility that early developmental immune activation can increase the prevalence of ASD-associated dysfunctions (Mrozek-Budzyn et al., 2013; Hadjkacem et al., 2016). In this model, mice received a maternal immune activation (MIA) challenge on embryonic day 12.5 (E12.5) with polyinosinic:polycytidylic acid (Poly I:C), a toll-like receptor 3 TLR3 agonist simulating an innate immune response to a virus, with or without a subsequent postnatal immune activation (PIA) challenge with lipopolysaccharide (LPS), a TLR4 agonist simulating an innate immune response to bacteria, on postnatal day 9 (P9) (Smith et al., 2007; Kawai and Akira, 2008; Reisinger et al., 2015; Canetta et al., 2016; Choi et al., 2016; Custódio et al., 2017; Patel et al., 2017). This approach aligns with TLR expression patterns (Barak et al., 2014) and infection risk factors seen in humans (Bilbo et al., 2009). We then examined neurotransmission in mPFC–BLA projections in the treatment groups. We found that our MIA regimen significantly enhanced glutamatergic synaptic transmission in mPFC–BLA projections, whereas our PIA regimen significantly diminished feedforward inhibition in the same pathway, suggesting that these immune challenges act upon different cellular targets in the brain.
Materials and Methods
Animal model of maternal and postnatal immunoactivation.
The McLean Hospital Institutional Animal Care and Use Committee approved all animal procedures in this study. Timed pregnant Jackson Laboratory mice (C57BL6J) were obtained by housing a female and male pair overnight. The following morning, pairs were separated and midday was considered E0.5. Pregnancy was identified by body weight gain and physical appearance. At E12.5, pregnant dams received an intraperitoneal injection of either 20 mg/kg Poly I:C (catalog #P9852; Sigma-Aldrich) or vehicle (sterile PBS). The dosing of Poly I:C and its route of administration were as in previously published studies (Smith et al., 2007; Choi et al., 2016; Missig et al., 2018). Dams were monitored for parturition. Male offspring of these mice (1–5 mice per litter) were used in our experiments. On P9, pups received a subcutaneous injection of 10 mg/kg LPS from Escherichia coli 0111:B4 (catalog #L3024; Sigma-Aldrich) or vehicle (endotoxin-free saline). The optimal dose of LPS and an efficient route of its administration were determined empirically in previous control studies (Missig et al., 2018). P9 in rodents corresponds to an ∼39- to 40-week human gestation (term infant) (Semple et al., 2013; Custodio et al., 2017). Therefore, we used the regimen providing bacterial challenge at P9 to mimic the environmental challenges that human newborns could meet very early postnatally.
Microglia immunohistochemistry and quantitative analysis.
To confirm the presence of treatment-induced inflammatory responses in the brain, we examined brain microglia. Mice were deeply anesthetized with pentobarbital and transcardially perfused with PBS, followed by 4% paraformaldehyde. Brains were dissected, postfixed in 4% paraformaldehyde overnight at 4°C, equilibrated to 30% sucrose, and then cryosectioned. Sections (30 μm) containing the BLA were permeabilized with 0.3% Triton X-100, blocked with 1% bovine serum albumin and 2% normal donkey serum, and then incubated with 1:400 rabbit anti-ionized calcium binding adaptor molecule 1 (IBA-1) antibody (019-19471; Wako Chemicals) overnight at 4°C. After rinses, sections were incubated in 1:200 anti-rabbit Alexa Fluor 488 antibody for 2 h, stained with DAPI (0.5 μg/ml), rinsed, and then mounted on slides. Images were obtained with a 40× objective using a confocal laser-scanning microscope (TCS SP8; Leica) of the identical portion of the BLA. Five-micrometer z-stacks were obtained at Nyquist-derived optimal section thickness. All images were acquired under identical settings and parameters and then exported to ImageJ software for analysis. Maximum projections were made and the total threshold signal per unit area, cell count, soma size, or ramifications of each image were quantified by semiautonomous methods or by using a blinded scorer in ImageJ. The colocalization of DAPI and IBA-1 immunoreactivity was used to identify individual cells.
Behavioral tests.
Effects of MIA or PIA alone on ASD-like behaviors have been described previously (Smith et al., 2007; Custódio et al., 2017). To confirm treatment-induced changes in behavior, we used the open field to quantify anxiety-like responses, considering that anxiety is frequently comorbid with ASD. Mice were placed in the corner of a brightly lit open field (44 × 44 × 30 cm) and allowed to explore freely for 10 min while being video recorded. The percentage of time the mouse spent in the center of the open field and total distance traveled were analyzed using Ethovision-XT (Noldus Information Technology). The social interaction test (Golden et al., 2011; Bagot et al., 2015) consisted of 2 separate 3 min sessions. The first session consisted of a mouse being placed in a chamber (44 × 44 × 30 cm) that contained an empty metal wire cage (10 × 8 × 6 cm) at the other end of the arena. In the second session, an age-matched and sex-matched novel conspecific was placed in the metal cage, preventing direct physical contact. The duration of time in the interaction zone was calculated for both the empty cage and conspecific sessions using automated tracking software (Ethovision XT 7.0; Noldus Information Technology). Data are presented as the social interaction ratio (mouse/empty interaction zone time) normalized to the Veh_Veh group.
Viral constructs.
We used adeno-associated virus (AAV) carrying channelrhodopsin-2(H143R)-eYFP under control of CaMKIIα promoter to investigate functional connectivity in the mPFC–AMG circuits. Vectors were purchased from the viral vector core facility at the University of North Carolina and the titers were ∼10.0 × 10¹² particles/ml.
Stereotaxic surgery and viral injections.
Surgeries were performed using medical and laboratory aseptic techniques. Male offspring of immunoactivated mice (8–10 weeks old) were anesthetized with a mixture of ketamine and xylazine (160 mg/kg and 12 mg/kg body weight, respectively). The surgical procedures and viral injections were performed as described previously (Cho et al., 2013). Briefly, bilateral craniotomy was made to target the prelimbic cortex (PL) of the mPFC using the stereotaxic coordinates: 1.8 mm rostral to bregma, ± 0.4 mm lateral to midline, and 1.8 mm ventral to the skull surface (Franklin and Paxinos, 2007). The AAV vector carrying channelrhodopsin-2(H143R)-eYFP was injected bilaterally into PL at a rate of 0.1 μl/min under control of the syringe pump (Stoelting). Mice were given 0.1 ml of ketoprofen (Boehringer Ingelheim) subcutaneously to reduce pain. After surgery, mice were single housed for 8 weeks before behavioral or ex vivo electrophysiological experiments.
Ex vivo electrophysiology and photostimulation.
After cervical dislocation and decapitation, brains were removed and coronal slices (300 μm) containing the mPFC or the AMG were obtained using a vibratome in cold cutting solution containing the following (in mm): 252 sucrose, 1.0 CaCl2, 5.0 MgCl2, 2.5 KCl, 1.25 NaH2PO4, 26 NaHCO3, and 10 glucose and equilibrated with 95% O2 and 5% CO2. Slices were then incubated in oxygenated artificial CSF (ACSF) containing the following (in mm): 125 NaCl, 2.5 KCl, 2.5 CaCl2, 1.0 MgSO4, 1.25 NaH2PO4, 26 NaHCO3, and 10 glucose at room temperature for at least 1 h before electrophysiological recordings. The subnuclei of the AMG were visualized under a Zeiss microscope coupled with an IR camera (Hamamatsu) and defined based on the structural landmarks of the internal capsule and the external capsule. Whole-cell recording were obtained from neurons in the BLA with patch electrodes (3–5 MΩ resistance) containing the following (in mm): 130 Cs-methane-sulfonate, 5.0 KCl, 2.5 NaCl, 1.0 MgCl2, 10 BAPTA, 10 HEPES, 2 MgATP, and 0.1 NaGTP, adjusted to pH 7.2 with KOH. Qx-314 (5 mm) and spermine (0.5 mm) were added in the internal solution before the recordings. To assay membrane properties and to record photostimulation-induced APs in the mPFC (see Fig. 2D), 130 mm K-gluconate was used instead of Cs-methane-sulfonate in the pipette solution. Neurobiotin (0.2%; Vector Laboratories) was added into the internal pipette solution to locate the recorded neurons in the AMG. Synaptic responses were induced by photostimulation of channelrhodopsin2 (ChR2)-expressing mPFC projecting fibers in the BLA through a 40× water-immersion objective lens (Carl Zeiss microscope) with a LED light source (excitation wavelength: 470 nm, 1 ms in duration, Thorlabs). All whole-cell recordings were performed at 30–32°C in the external medium. Current were filtered at 1 kHz and digitized at 5 kHz. After recordings, slices were placed in PBS containing 4% paraformaldehyde and kept in a refrigerator until histological processing.
Figure 2.

Optogenetic analysis of mPFC inputs to the BLA in animal models of maternal and postnatal immunoactivation. A, Experimental design for optogenetic activation of mPFC–AMG projections. A vertical dashed line indicates location of a coronal section shown in B (as in Cho et al., 2013). B, Left, Microscopic image at the low magnification shows the expression of eYFP-ChR2 at the injection site in mPFC (green) merged with an image of fluorescent Nissl stain (red). Right, Confocal image showing expression of eYFP-ChR2 across the cell layers in the PL. aca, Anterior commissure, anterior part. C, Left, ChR2-mediated currents recorded in a pyramidal neuron in layer V of mPFC were evoked by 1 s pulses of blue light (470 nm, blue horizontal bar) of increasing intensity (0.2–1.7 mW/mm2) in the presence of NBQX (10 μm), D-AP5 (50 μm), and bicuculline (30 μm). Right, Input/output plots of the photocurrent amplitudes as a function of the light power densities (mW/mm2) in slices from different experimental groups (Veh_Veh group: n = 21 neurons from 8 mice; Poly I:C_Veh: n = 22 neurons from 9 mice; Veh_LPS: n = 17 neurons from 7 mice; Poly I:C_LPS: n = 23 neurons from 10 mice). Expression of ChR2 in the mPFC was not affected by immunoactivation. D, Left, Examples of APs recorded in a pyramidal neuron in layer V of mPFC triggered by trains of 1 ms pulses of blue light at different stimulation frequencies (5–40 Hz, marked by vertical blue bars for the 5 Hz stimulation) in current-clamp mode. Right, Plot of AP firing reliability at different stimulation frequencies (Veh_Veh group: n = 9 neurons from 4 mice; Poly I:C_Veh: n = 8 neurons from 5 mice; Veh_LPS: n = 6 neurons from 4 mice; Poly I:C_LPS: n = 7 neurons from 5 mice).
To minimize the variability in photostimulation-induced synaptic responses between experimental groups, the volume of ChR2-encoding virus infused in the mPFC, coordinates of the PL and the expression time of ChR2 in the brain were kept constant throughout the study. Before the recordings, the extent and intensity of ChR2-eYFP expression at the injection site in acute slices containing the mPFC and ChR2-expressing fibers in the AMG (projection site) were evaluated under low (10×) magnification. To assay the effects of immunoactivation on functional expression of ChR2 in the brain, the amplitude of photostimulation-induced currents and the reliability of photostimulation-induced APs were examined in pyramidal neurons in layer V at the ChR2 injection site in the PL (see Fig. 2C,D).
Pharmacological reagents used in the electrophysiological experiments, which included NBQX disodium salt, D-AP5, N-(2,6 dimethylphenylcarbamoylmethyl)triethylammonium (QX 314) chloride, (-)-bicuculline methobromide (R&D Systems), and spermine tetrahydrochloride (Sigma-Aldrich), were prepared as stock solutions in water at 1000- to 5000-fold concentrations and stored at −20°C.
Histology.
Brain slices were washed in PBS (3 × 15 min) and incubated in 0.1% Triton PBS containing neurotracer fluorescent Nissl stain (diluted 40×; Invitrogen) for 1 h at room temperature, and then rewashed in PBS (3 × 20 min). Sections containing neurobiotin-loaded cells were incubated in 0.1% Triton PBS containing streptavidin–Alexa Fluor 568 conjugate (20 μg/ml; Invitrogen) for 2 h at room temperature and then washed in PBS (3 × 20 min). Finally, sections were mounted on the gelatinized slides, dehydrated, and coversliped. Vectashield mounting medium (Vector Laboratories) was applied to slices to prevent fluorescence fading. Viral vector infusion sites were examined under a Leica TCS SP8 confocal microscope or a Zeiss Axioskop 2 fluorescent microscope. Mice in which the injection missed the target (PL of the mPFC) were excluded from the analysis.
Analysis of mPFC projection patterns in the AMG.
To detect the effect of immunoactivation on mPFC projection patterns in different subnuclei of the AMG, the fluorescence intensity of ChR2-eYFP-expressing fibers within the subregion were analyzed quantitatively. Confocal fluorescent images were acquired using a Leica TCS SP8 confocal microscope with a 10/0.40 numerical aperture (NA) objective lens. The settings for aperture gain, laser intensity, and offset were optimized initially and then kept constant throughout the acquisition of images from all mice used for the analysis. Confocal z-stack images of ChR2-eYFP-expressing fibers in the AMG contained 6–12 images that were captured 5 μm apart. The boundaries of the subnuclei of the AMG were defined based on landmark structures (internal and external capsules) and cellular morphology (Sah et al., 2003) revealed by fluorescent Nissl and DAPI counterstain. The fluorescence intensity on a single focal plane in the channel for ChR2-eYFP was measured using ImageJ version 1.51f.
Sholl analysis.
To detect the effect of immune activation on neuronal structure, we reconstructed 32 neurobiotin-filled BLA neurons from all four experimental groups (eight neurons per group). The recorded and subsequently reconstructed cells were identified as neurons based on their accommodating firing patterns (Tsvetkov et al., 2002). Neurobiotin (6.0 mm) was added to the intrapipette solution. Stained neurons were scanned with a Leica confocal microscope under 40×/1.30 NA objective lens. Confocal z-stack images were processed using ImageJ and then reconstructed in the NeuronStudio program (version 0.9.92). Because the program automatically determines the 3D position and branch diameter based on the imaging data, we used the manual tracing tool to trace each branch analyzed. Specifically, we started the manual tracing from the beginning of each primary dendrite and moved one node at a time to form an entire path along a branch in the 2D or 3D window. The image of a reconstructed neuron in Figure 5A was generated with Neurolucida 360 (MBF Bioscience). The dendritic length, dendritic surface area, and the number of branch points were measured using Sholl analysis (Sholl, 1953). Soma size was estimated by its largest projection area of stack images, measured in ImageJ.
Figure 5.

Sholl analysis of dendritic morphology in the BLA after immune activation. A, Sholl dendritic analysis of reconstructed neurobiotin-filled BLA neurons was performed by placing a series of concentric circles spaced at 30 μm intervals and centered on the soma. B, Average soma size estimates in all experimental groups. There was a significant increase in the soma size in LPS-treated mice (see text for details). C, Averaged number of primary dendrites in all experimental groups. D, Summary plot of the dendritic length as a function of the radial distance from soma by 30 μm increments. There was a main effect of LPS on the dendritic length: three-way ANOVA (Poly I:C × LPS × distance from soma, Poly I:C, F(1,224) = 0.272, p = 0.603; LPS, F(1,224) = 10.499, p = 0.001; interaction, F(7,224) = 0.64, p = 1.0; post hoc Bonferonni's test: p = 0.004 for Veh_Veh versus Veh_LPS). E, Summary plot of the dendritic surface area as a function of the radial distance from soma. There was an increase in the dendritic surface area in Veh_LPS and Poly I:C_LPS groups versus Veh_Veh group: three-way ANOVA (Poly I:C × LPS × distance from soma, Poly I:C, F(1,224) = 1.681, p = 0.196; LPS, F(1,224) = 51.762, p < 0.001; interaction, F(1,224) = 0.086, p = 0.99; post hoc Bonferonni's test: p < 0.001 for both Veh_Veh versus Veh_LPS and Veh_Veh versus Poly I:C_LPS groups). F, Averaged number of branch points. There was no difference in branch point numbers between the groups: three-way ANOVA (Poly I:C × LPS × distance from soma, Poly I:C, F(1,224) = 2.27, p = 0.133; LPS, F(1,224) = 0.0396, p = 0.842; interaction, F(7,224) = 0.338, p = 0.936). G, Averaged dendritic diameter as a function of distance from soma. There was an increase in the averaged dendritic diameter in the Veh_LPS and Poly I:C_LPS groups versus Veh_Veh group: three-way ANOVA (Poly I:C × LPS × distance from soma, Poly I:C, F(1,112) = 7.5, p = 0.007; LPS, F(1,112) = 30.197, p < 0.001; interaction, F(3,112) = 0.376, p = 0.771; post hoc Bonferonni's simultaneous multiple comparisons: p = 0.032 for Veh_Veh versus Veh_LPS and p < 0.001 for Veh_Veh group versus Poly I:C_LPS group). Veh_Veh group: n = 8 neurons from 5 mice; Poly I:C_Veh: n = 8 neurons from 4 mice; Veh_LPS: n = 8 neurons from 7 mice; Poly I:C_LPS: n = 8 neurons from 6 mice). **p < 0.01.
Experimental design and statistical analysis.
Mice were randomly assigned to experimental groups. In electrophysiological experiments, one neuron was recorded per a slice. The numbers of mice and recorded neurons used for the analysis in different experiments are indicated in the figure legends. Data are reported as means ± SEM. The experiments were conducted using a 2 × 2 factorial design (see Fig. 1A) and results were analyzed with two-way or three-way ANOVA when appropriate to assess main effects of either Poly I:C or LPS, as well as of a third factor when it was present (such as light power density, stimulation frequency, bregma plane, or distance from soma), and interaction effects, followed by post hoc Bonferroni's simultaneous multiple comparisons of each treatment group to Veh_Veh. When appropriate, Student's two-tailed paired t test was used. Statistical analysis was performed with SigmaPlot 13.0 or Minitab 16. The results of the statistical analysis are presented in the text or in the figure legends.
Figure 1.

Immune activation is associated with activation of microglia in the BLA and ASD-related behavioral dysfunctions. A, Experimental design (see the main text for details). B, Confocal microscopic images showing immunohistochemical staining for IBA-1, a microglial marker, in the BLA in 13-week-old offspring mice from different experimental groups. C, Number of IBA-1-positive cells and IR of IBA-1 were increased in the offspring groups receiving the postnatal LPS injections, indicating a robust activation of microglia ∼12 weeks after the LPS injection at P9 (Veh_Veh group: n = 6 slides from 4 mice; Poly I:C_Veh: n = 8 slides from 4 mice; Veh_LPS: n = 5 slides from 3 mice; Poly I:C_LPS: n = 3 slides from 3 mice). D, Quantitative morphological analysis of microglia in the animal models of maternal and postnatal immunoactivation. Left, No difference was seen in the soma size of microglia in the BLA between experimental groups (Veh_Veh group: n = 50 from 4 mice; Poly I:C_Veh: n = 59 from 4 mice; Veh_LPS: n = 93 from 7 mice; Poly I:C_LPS: n = 36 from 3 mice). Right, Groups did not differ in the number of microglial ramifications (Veh_Veh group: n = 50 from 4 mice; Poly I:C_Veh: n = 59 from 4 mice; Veh_LPS: n = 93 from 7 mice; Poly I:C_LPS: n = 36 from 3 mice). E, Results of the open-field test. Left, Summary plot showing the percentage of time spent in the center of the arena. Increased anxiety-like behavior (less time spent in the center) was observed in Veh_LPS and Poly I:C_LPS groups relative to the control Veh_Veh group. Right, Plot showing the total distance traveled during the open-field test. Numbers of mice tested: Veh_Veh group: n = 28 mice; Poly I:C_Veh: n = 26 mice; Veh_LPS: n = 11 mice; Poly I:C_LPS: n = 17 mice. F, Results of the social interaction test. Left, Mice in Veh_LPS and Poly I:C_LPS groups showed impaired social behavior as they spent less time in the interaction zone with the novel conspecific mouse relative the control Veh_Veh group. Right, Distance traveled during the social interaction test. Numbers of mice tested: Veh_Veh group: n = 12 mice; Poly I:C_Veh: n = 17 mice; Veh_LPS: n = 11 mice; Poly I:C_LPS: n = 18 mice. *p < 0.05, **p < 0.01, ***p < 0.001. Error bars are SEM.
Results
Immune activation results in alterations of microglia in the BLA and leads to ASD-linked behavioral impairments
To investigate whether in utero and/or early life neuroinflammation could alter the signal flow in the mPFC–AMG circuits and produce ASD-relevant behavioral dysfunction, we administered either Poly I:C (20 mg/kg, IP) or vehicle (PBS) to pregnant female C57BL/6J mice on day 12.5 of pregnancy as in Smith et al. (2007). Subsequently, male offspring from both groups (Poly I:C- or vehicle-injected mothers) were injected either with LPS (10 mg/kg; Poly I:C_LPS and Veh_LPS groups) or vehicle on P9.5 (Poly I:C_Veh and Veh_Veh groups) (Fig. 1A). Poly I:C binds to TLR3, triggering production of type I interferons, whereas LPS activates TLR4, resulting in release of TNF-α from macrophages (for review, see Lombardo et al., 2017). Poly I:C-induced neuroinflammation in pregnant mice is associated with activation of cytokine signaling mediated by interleukin-6, which is capable of passing from a pregnant female through the placenta to the fetal brain (Lombardo et al., 2017). Because it has been shown previously that Poly I:C-induced MIA leads to lasting alterations of microglia in the offspring mice exhibiting characteristics of the microglial hyperactive state (Krstic et al., 2012; Knuesel et al., 2014), we performed immunostaining for a microglial marker, IBA-1, in 13-week-old offspring mice. In our analysis, we focused on the BLA, where prefrontal projection fibers were predominantly found (see below). We found that both the number of IBA-1-positive cells and the intensity of IBA-1 (Fig. 1B,C) staining (immunoreactivity, IR) were increased in the offspring groups receiving the postnatal LPS injections, indicating an activation of microglia ∼12 weeks after the LPS injection at P9 (Fig. 1C, left: two-way ANOVA, Poly I:C, F(1,18) = 0.356, p = 0.558; LPS, F(1,18) = 25.821, p < 0.001; interaction, F(1,18) = 0.241, p = 0.629; post hoc Bonferroni's test: p = 0.009 for Veh_Veh versus Veh_LPS and p = 0.03 for Veh_Veh versus Poly I:C_LPS; Fig. 1C, right: two-way ANOVA, Poly I:C, F(1,18) = 0.538, p = 0.473; LPS, F(1,18) = 17.538, p < 0.001; interaction, F(1,18) = 0.108, p = 0.747; post hoc Bonferroni's test: p < 0.05 for Veh_Veh versus Veh_LPS or for Veh_Veh versus Poly I:C_LPS). There were no significant differences in microglial soma size or the number of microglial ramifications between experimental groups (Fig. 1D; soma size: two-way ANOVA, Poly I:C, F(1,234) = 3.334, p = 0.069; LPS, F(1,234) = 0.462, p = 0.497; interaction, F(1,234) = 2.339, p = 0.128; number of ramifications: two-way ANOVA, Poly I:C, F(1,234) = 3.238, p = 0.073; LPS, F(1,234) = 1.268, p = 0.261; interaction, F(1,234) = 0.019, p = 0.892).
Accompanying these inflammatory markers, there were group differences in anxiety and social behavior. Mice in the Veh_LPS group exhibited increased anxiety-like behavior in the open-field test (Britton and Britton, 1981; File, 1985; Riccio et al., 2009, 2014). Specifically, these mice spent less time in the center of the open field compared with the Veh_Veh group (Fig. 1E), which is commonly interpreted as an increased anxiety-like behavioral response (Lezak et al., 2017). This effect was not due to decreased locomotor activity because animals in the Veh_LPS group did not differ from mice in the control Veh_Veh group in the total distance traveled (Fig. 1E). Mice in the Poly I:C_LPS group also showed increased anxiety-like responses (Fig. 1E; time in center (%): two-way ANOVA, Poly I:C, F(1,78) = 2.291, p = 0.134; LPS, F(1,78) = 17.052, p < 0.001; interaction, F(1,78) = 0.008, p = 0.928; post hoc Bonferroni's test: p < 0.05 for Veh_Veh versus Veh_LPS and p < 0.001 for Veh_Veh versus Poly I:C_LPS). In this experimental group, the total distance traveled was increased compared with Veh_Veh control mice (Fig. 1E; distance traveled: two-way ANOVA, Poly I:C, F(1,78) = 4.293, p = 0.042; LPS, F(1,78) = 3.275, p = 0.074; interaction, F(1,78) = 0.014, p = 0.906; post hoc Bonferroni's test: p < 0.05 for Veh_Veh versus Poly I:C_LPS). However, it is unlikely that slight increases in locomotor activity can explain the enhanced anxiogenesis in Poly I:C_LPS mice because enhanced locomotion may slightly blunt anxiety-like responses rather than promote them due to the fact that more actively moving mice could randomly cross into the anxiogenic center more often. In agreement with the role of immune activation in the development of ASD-linked behavioral dysfunctions, we also found that social interactions were diminished in our experimental groups. Mice in both Veh_LPS and Poly I:C_LPS groups spent less time in the interaction zone with the novel conspecific mouse (Fig. 1F, left, two-way ANOVA, Poly I:C, F(1,54) = 2.397, p = 0.127; LPS, F(1,54) = 10.157, p = 0.002; interaction, F(1,54) = 1.923, p = 0.171; post hoc Bonferroni's test: p = 0.014 for Veh_Veh group versus Veh_LPS group and p = 0.004 for Veh_Veh versus Poly I:C_LPS). However, there was no treatment effect on the distance traveled during the social interaction test (Fig. 1F, right, two-way ANOVA, Poly I:C, F(1,54) = 0.161, p = 0.69; LPS, F(1,54) = 0.313, p = 0.578; interaction, F(1,54) = 0.109, p = 0.743).
Together, these findings indicate that perinatal immune activation can trigger long-lasting alterations in brain and behavior.
Projection-specific optogenetic targeting of mPFC–AMG circuits
To target neuronal projections from mPFC to AMG for the subsequent functional analysis, we expressed ChR2 in the mPFC by stereotaxically injecting AAV5-CaMKIIα-ChR2-eYFP) in mice from all four experimental groups (Fig. 2A). Eight weeks after gene transfer, eYFP-tagged ChR2 was densely expressed at the injection site (Fig. 2B). Although the tip of an injection pipette was placed within the PL mPFC, the ChR2-eYFP-mediated green fluorescent signal was also observed in the IL mPFC, suggesting that both IL- and PL-originating projections were activated in these experiments. We found previously that the IL and PL projection patterns to the AMG are virtually identical (Cho et al., 2013). By performing whole-cell recordings from virally transduced neurons, we confirmed the functionality of ChR2 expression at the mPFC injection site. Delivery of prolonged pulses of blue light (470 nm) of increasing intensity triggered inward currents with transient and sustained components in recorded neurons under voltage-clamp recording conditions at a holding potential of −80 mV (Fig. 2C). We did not observe differences in the peak photocurrent amplitude between the groups, indicating that neither MIA nor PIA had effects on ChR2 expression in the mPFC [Fig. 2C; three-way ANOVA (Poly I:C × LPS × light power density); Poly I:C, F(1,474) = 0.199, p = 0.651; LPS, F(1,474) = 0.003, p = 0.986; interaction, F(5,474) = 0.227, p = 0.951]. In current-clamp recordings, short (5-ms-long) pulses of blue light evoked AP firing, with spikes reliably following higher frequencies of photostimulation (up to 40 Hz) (Fig. 2D). Consistent with the lack of the effect of neuroinflammation on the ability of ChR2 to drive neuronal spiking, the input/output curves for the probability of AP firing in response to trains of photostimuli of increasing frequency did not differ between the experimental groups [Fig. 2D; three-way ANOVA (Poly I:C × LPS × stimulation frequency); Poly I:C, F(1,103) = 0.0003, p = 0.996; LPS, F(1,103) = 2.425, p = 0.122; interaction, F(3,103) = 0.967, p = 0.411].
Consistent with previous reports (Cho et al., 2013), the ChR2-eYFP-expressing fibers arising from the virally transduced neurons in the mPFC were found predominantly in the BLA (Fig. 3). We confirmed that mPFC projections form functional synapses on neurons in the BLA by performing whole-cell recordings from these cells and triggering the EPSCs in them in voltage-clamp mode at −80 mV by 1 ms pulses of blue light (Fig. 3A). The EPSCs at the mPFC–BLA synapses were glutamatergic, as indicated by their sensitivity to NBQX (10 μm), an AMPA/kainate receptor antagonist (Fig. 3A). Synaptic responses were suppressed by tetrodotoxin (TTX, 1 μm), a sodium channel blocker, providing evidence that they were mediated by presynaptic AP firing (Cho et al., 2013). Under these recording conditions, the glutamatergic EPSCs in mPFC–AMG projections are monosynaptic because they could be rescued by an exogenously applied blocker of voltage-gated K+ channels, 4-AP, when the EPSCs were blocked by TTX (Petreanu et al., 2009; Cho et al., 2013; Fig. 3C,D). In agreement with our previous report (Cho et al., 2013), photostimulation of mPFC fibers induced EPSCs in all recorded BLA neurons (140 neurons) and in most intercalated cells (ITCs; 81.8%, 27 of 33 neurons (Fig. 3B) (but see Strobel et al., 2015, and Luchkina and Bolshakov, 2017, for discussion of possible reasons of why monosynaptic mPFC inputs to ITCs were not detected in Strobel et al., 2015). ITCs possess very high membrane resistance (>1.0 GOhm) and thus could be reliably identified in slice recordings (Cho et al., 2013). The synaptic connectivity between the mPFC and lateral nucleus of the AMG (LA) or lateral subnucleus of the central AMG (CeL) was very sparse (in LA, 25%, 7 of 28 neurons exhibited synaptic responses; in CeL, 20%, 7 of 35 neurons). We found that MIA, PIA, and MIA+PIA failed to affect the fraction of BLA neurons or ITCs (relative to the total number of recorded cells) in which photostimulation-induced EPSCs could be observed at the maximum light intensity of 10.5 mW/mm2 (Fig. 3B).
Figure 3.
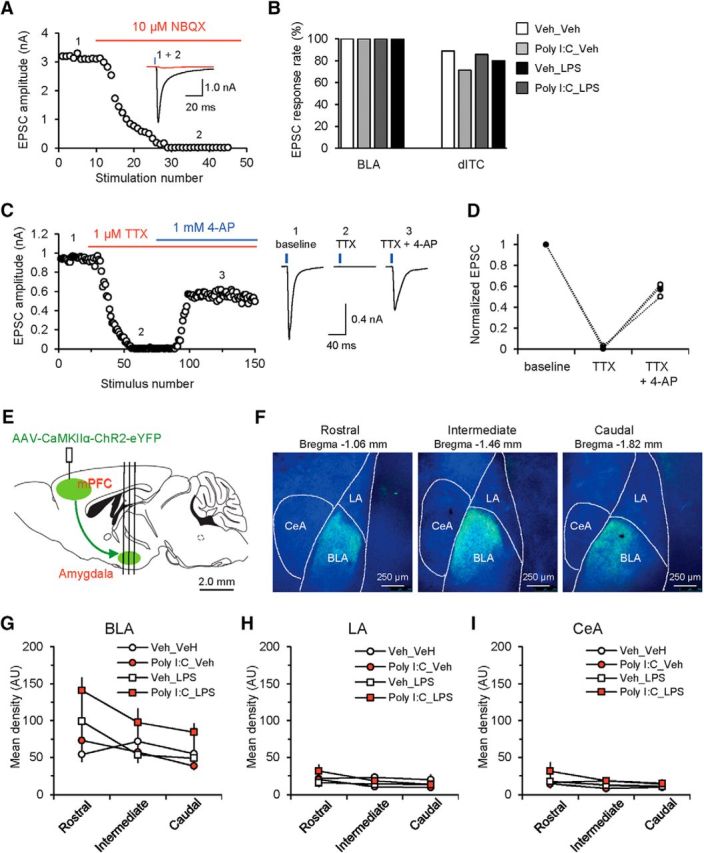
mPFC–AMG synaptic connectivity and innervation patterns of the AMG by ChR2-expressing mPFC projection fibers. A, Light-evoked EPSCs recorded in BLA PNs at −80 mV were blocked by the AMPA/kainate receptor antagonist NBQX (10 μm). B, Fractions of neurons in the BLA and the dorsal cluster of intercalated cells in the AMG (dITC) in which EPSCs could be observed in response to photostimulation of mPFC afferents in slices from all groups. In these recordings, the light power density was 10.5 mW/mm2. BLA: n = 38 neurons from 38 recorded cells in Veh_Veh group, n = 30 neurons from 30 recorded cells in Poly I:C_Veh group, n = 36 neurons from 36 recorded cells in Veh_LPS group, n = 36 neurons from 36 recorded cells in Poly I:C_LPS group; dITC: n = 8 neurons from 9 recorded cells in Veh_Veh group, n = 5 neurons from 7 recorded cells in Poly I:C_Veh group, n = 6 neurons from 7 recorded cells in Veh_LPS group, n = 8 neurons from 10 recorded cells in Poly I:C_LPS group. C, Rescue of optogenetically induced and TTX-blocked EPSCs at mPFC(PL)-BLA projections by 4-AP. Left, Graph showing the time course of changes in the EPSC amplitude under control conditions (1), after application of TTX (2), and after the subsequent addition of 4-AP (3). Right, EPSCs (average of 10 traces) recorded in a BLA neuron at −80 mV under different experimental conditions. EPSCs evoked by photostimulation (with 5-ms-long pulses) of ChR2-expressing mPFC fibers were blocked by TTX (1 μm). An addition of 4-AP (1 mm) in the presence of TTX partially rescued the EPSC (as in Cho et al., 2013; n = 3 neurons), confirming monosynaptic nature of activated mPFC–BLA projections. D, Summary plot of the EPSC amplitudes in TTX only and TTX + 4-AP. Peak amplitudes of EPSCs were normalized to the baseline EPSC recorded under control conditions. Open circles represent individual experiments, whereas closed circles show average values (n = 3 neurons). E, Experimental design for the analysis of mPFC–AMG connectivity. Vertical lines indicate location of coronal sections through the AMG shown in F. F, Microscopic images showing innervation of the AMG by ChR2-eYFP-expressing mPFC fibers (green) in coronal brain sections (300 μm in thickness) along the rostral–caudal axis. Blue fluorescence indicates DAPI counterstain. CeM, Medial division of the central nucleus; dITC, dorsal cluster of intercalated cells in the AMG. G–I, Mean densities of ChR2-eYFP fluorescence due to the innervation by mPFC projections in different sections along the rostral-caudal axes in BLA (G), LA (H), and central nucleus of the AMG (CeA) (I) in slices from all experimental groups (Veh_Veh group: n = 16 slides from 6 mice; Poly I:C_Veh: n = 14 slides from 4 mice; Veh_LPS: n = 18 slides from 6 mice; Poly I:C_LPS: n = 17 slides from 6 mice).
We also compared the fluorescence intensity of ChR2-eYFP-expressing mPFC projections in various parts of the AMG in brain slices between all experimental groups along the rostral–caudal axis at three different bregma levels (Fig. 3E,F; see Materials and Methods for the quantification details). Consistent with the lack of a treatment effect on the functional synaptic connectivity at mPFC projections to LA and CeL, the mean density of ChR2-eYFP fluorescence in these two AMG subnuclei remained unchanged [Fig. 3H,I; LA: three-way ANOVA (Poly I:C × LPS × bregma plane); Poly I:C, F(1,53) = 0.037, p = 0.849; LPS, F(1,53) = 0.012, p = 0.914; interaction, F(2,53) = 0.128, p = 0.88; CeL: three-way ANOVA (Poly I:C × LPS × bregma plane), Poly I:C, F(1,53) = 0.138, p = 0.712; LPS, F(1,53) = 1.321, p = 0.256; interaction, F(2,53) = 0.137, p = 0.872]. However, the fluorescence density was significantly enhanced in the BLA of mice from the Poly I:C_LPS group [Fig. 3G; BLA: three-way ANOVA (Poly I:C × LPS × bregma plane); Poly I:C, F(1,53) = 3.57, p = 0.064; LPS, F(1,53) = 9.178, p = 0.004; interaction, F(2,53) = 0.320, p = 0.728; post hoc Bonferonni's simultaneous multiple comparisons: p = 0.003 for Veh_Veh versus Poly I:C_LPS], suggesting that the innervation of BLA by mPFC fibers might be increased in the MIA+PIA group.
Prenatal MIA but not PIA is associated with synaptic strengthening at glutamatergic projections from mPFC to BLA
We examined the effects of immunoactivation on synaptic transmission in the mPFC–BLA projections by performing whole-cell patch-clamp recordings of the light-induced EPSCs in BLA neurons in brain slices obtained from all experimental treatment groups (Veh_Veh, Poly I:C-Veh, Veh_LPS or Poly I:C_LPS; see above for details) (Fig. 4A–C). EPSCs were recorded in voltage-clamp mode at a holding potential of −80 mV. There were no treatment-induced alterations in the passive membrane properties of BLA neurons (Table 1; Gentet et al., 2000). However, we found that synaptic strength, as quantified by input/output curves for EPSCs induced by the 1 ms pulses of blue light, was significantly increased in both Poly I:C_Veh and Poly I:C_LPS groups compared with control Veh_Veh mice [Fig. 4C,D; three-way ANOVA (Poly I:C × LPS × light power density), Poly I:C, F(1,798) = 54.262, p < 0.001; LPS, F(1,798) = 0.049, p = 0.825; interaction, F(5,798) = 0.305, p = 0.91; post hoc Bonferroni's simultaneous multiple comparisons: p = 0.003 for Veh_Veh versus Poly I:C_Veh and p < 0.001 for Veh_Veh versus Poly I:C_LPS]. The lack of a detectable effect in these experiments on the magnitude of mPFC–BLA EPSCs in the Veh_LPS group indicates that the observed increases in the efficacy of glutamatergic neurotransmission in mPFC–BLA projections could be specifically attributed to MIA.
Figure 4.
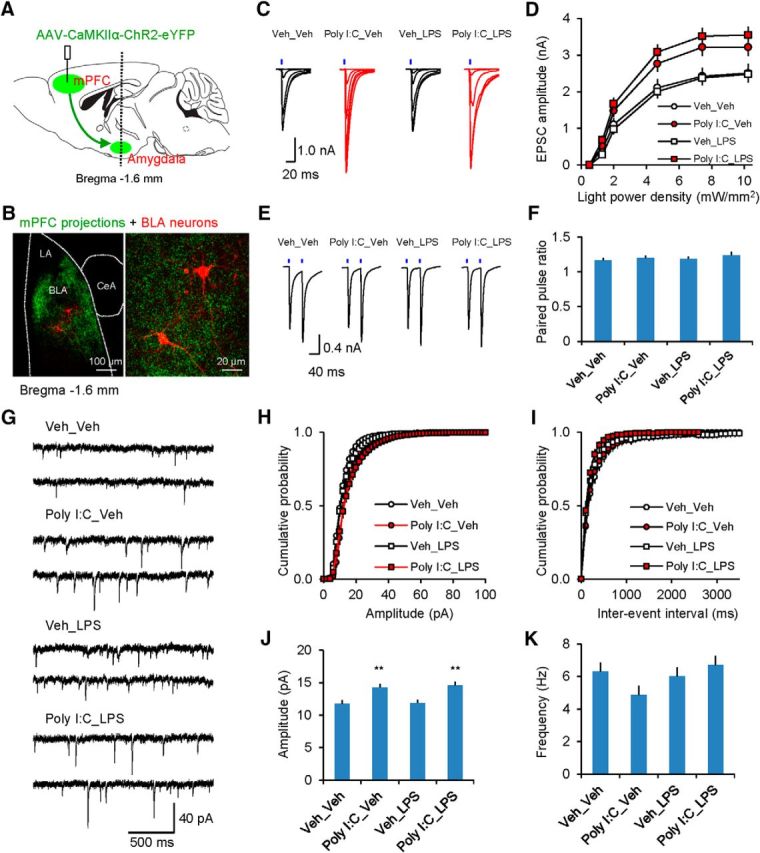
MIA but not PIA results in increased synaptic strength in glutamatergic mPFC projections to the BLA. A, Experimental design for optogenetic analysis of mPFC–AMG projections. A vertical line indicates location of a coronal section through the AMG shown in B. B, Left, Confocal microscopic image showing ChR2-eYFP-expressing mPFC fibers in the AMG (green). Red fluorescent cells in the BLA are neurobiotin-filled neurons. Right, Higher-magnification image of the same section. C, EPSCs (average of five responses) recorded in PNs in mPFC–BLA projections in voltage-clamp mode at a holding potential −80 mV in slices from different experimental groups. EPSCs were evoked by photostimuli of increasing intensity. D, Input/output plots for peak amplitudes of EPSCs at the mPFC–BLA synapses in all experimental groups (Veh_Veh group: n = 39 neurons from 12 mice; Poly I:C_Veh: n = 28 neurons from 9 mice; Veh_LPS: n = 36 neurons from 9 mice; Poly I:C_LPS: n = 38 neurons from 12 mice). E, EPSCs in BLA PNs were evoked by paired photostimuli (50 ms interpulse interval) at the saturating photostimulation intensity (10.2 mW/mm2) in slices from all groups. F, There was no effect of the treatments on the paired-pulse ratio magnitude (Veh_Veh group: n = 25 neurons from 12 mice; Poly I:C_Veh: n = 24 neurons from 9 mice; Veh_LPS: n = 16 neurons from 9 mice; Poly I:C_LPS: n = 28 neurons from 12 mice). G, Examples of sEPSCs recorded in BLA neurons. H, I, Cumulative amplitude (H) and interevent interval (I) histograms of sEPSCs recorded in slices from all groups. J, K, Summary plots of the mean sEPSC amplitude (J) and the frequency (K) in slices from all groups (Veh_Veh group: n = 10 neurons from 5 mice; Poly I:C_Veh: n = 9 neurons from 6 mice; Veh_LPS: n = 8 neurons from 4 mice; Poly I:C_LPS: n = 9 neurons from 5 mice). **p < 0.01.
Table 1.
Summary table of passive membrane properties determined in current-clamp recordings from principal neurons in slices of the BLA from different experimental groups of mice
| Group | Veh_Veh | Poly I:C_Veh | Veh_LPS | Poly I:C_LPS | Poly I:C | LPS |
|---|---|---|---|---|---|---|
| No. cells/no. mice | 21/10 | 24/11 | 15/7 | 20/12 | ||
| Rseries (MΩ) | 17.2 ± 0.7 | 16.5 ± 0.6 | 17.1 ± 1.0 | 17.5 ± 0.8 | F(1,76) = 0.03 (p = 0.871) | F(1,76) = 0.29 (p = 0.59) |
| Rinput (MΩ) | 159.3 ± 12.5 | 155.4 ± 16.4 | 152.0 ± 14.5 | 131.0 ± 12.8 | F(1,76) = 0.71 (p = 0.402) | F(1,76) = 1.16 (p = 0.285) |
| RMP (mV) | 74.2 ± 0.9 | 76.1 ± 1.1 | 76.6 ± 1.6 | 72.5 ± 1.1 | F(1,76) = 0.87 (p = 0.355) | F(1,76) = 0.26 (p = 0.61) |
| τmembrane (ms) | 2.7 ± 0.1 | 3.1 ± 0.1 | 3.0 ± 0.1 | 2.9 ± 0.1 | F(1,76) = 1.05 (p = 0.308) | F(1,76) = 0.41 (p = 0.526) |
| Cm (pF) | 181.8 ± 9.1 | 215.3 ± 12.1 | 204.1 ± 11.8 | 196.3 ± 7.4 | F(1,76) = 1.48 (p = 0.228) | F(1,76) = 0.02 (p = 0.877) |
The membrane capacitance (Cm) was calculated using the following equation: Cm = τ(1/Ra + 1/Rin), as described previously (Gentet et al., 2000). Two-way ANOVA in a 2 × 2 factorial design was used to evaluate the statistical significance of differences between experimental groups.
We next explored synaptic expression mechanisms of MIA-triggered synaptic potentiation in mPFC–BLA projections. The observed synaptic strengthening could be due either to enhanced probability of neurotransmitter release (Pr), increased responsiveness to single quanta of glutamate, or both, as well as due to increases in the number of sites of synaptic transmission (Tsvetkov et al., 2002; Zucker and Regehr, 2002; Goussakov et al., 2006; Cho et al., 2013). We found that the magnitude of the paired-pulse ratio at the mPFC–BLA synapses, a commonly used measure of presynaptic function (Pr, specifically), was identical in slices from all experimental groups, indicating that Pr at prefrontal glutamatergic inputs to BLA remained unaffected by MIA, PIA, or MIA+PIA (Fig. 4E,F; two-way ANOVA, Poly I:C, F(1,89) = 0.99, p = 0.321; LPS, F(1,89) = 0.483, p = 0.489; interaction, F(1,89) = 0.04, p = 0.852). To address the possibility that immunoactivation could be associated with postsynaptic modifications at glutamatergic inputs to BLA neurons, we recorded and analyzed spontaneous EPSCs (sEPSCs), which reflect synaptic responses to single quanta of glutamate (Li et al., 2013) (Fig. 4G–I). The sEPSCs were recorded at a holding potential of −80 mV in the presence of bicuculline (30 μm). Consistent with the potentiating effect of MIA on evoked, light-induced synaptic responses, the amplitude of sEPSPs was enhanced in Poly I:C_Veh and Poly I:C_LPS groups relative to control Veh_Veh mice (Fig. 4J; two-way ANOVA, Poly I:C, F(1,32) = 17.523, p < 0.001; LPS, F(1,32) = 0.292, p = 0.593; interaction, F(1,32) = 0.251, p = 0.62; post hoc Bonferroni's test: p = 0.007 for Veh_Veh versus Poly I:C_Veh and p = 0.002 for Veh_Veh versus Poly I:C_LPS). However, the frequency of sEPSCs, reflecting presynaptic function, was not altered (Fig. 4K; two-way ANOVA, Poly I:C, F(1,32) = 0.02, p = 0.887; LPS, F(1,32) = 0.361, p = 0.552; interaction, F(1,32) = 0.187, p = 0.669). Together, these results suggest that potentiation of glutamatergic synaptic transmission in mPFC–BLA projections in Poly I:C_Veh and Poly I:C_LPS groups may be postsynaptically regulated.
Sholl analyses of neuronal structure in neurobiotin-filled BLA principal neurons (PNs) in fixed tissue sections showed that immune activation was associated with morphological changes. The averaged soma size (area) was increased in Poly I:C_LPS-treated mice (Fig. 5A,B; soma size: two-way ANOVA, Poly I:C, F(1,28) = 2.553, p = 0.121; LPS, F(1,28) = 11.417, p = 0.002; interaction, F(1,28) = 0.085, p = 0.773, post hoc Bonferroni's test: p = 0.005 for Veh_Veh vs Poly IC_LPS). We detected the main effect of LPS treatment on the number of primary dendrites (Fig. 5C; two-way ANOVA, Poly I:C, F(1,28) = 0.914, p = 0.347; LPS, F(1,28) = 5.264, p = 0.029; interaction, F(1,28) = 0.91, p = 0.347). However, post hoc Bonferroni's test did not reveal statistically significant differences between Veh_Veh and Poly IC_LPS groups (F(3,28) = 2.364, p = 0.092). The dendritic surface area and averaged dendritic diameter were also enhanced in Veh_LPS and Poly I:C_LPS groups (Fig. 5E,G), as well as the dendritic length in the Veh_LPS group (Fig. 5D), whereas the number of branch points was unaffected by immune activation (Fig. 5F).
PIA selectively decreases feedforward GABAergic inhibition in mPFC–BLA projections
Excitatory neurotransmission in the BLA is under strong inhibitory control by local circuit GABA-releasing interneurons (INs) (Ehrlich et al., 2009). Specifically, BLA INs receive direct glutamatergic inputs from the mPFC and, when INs are driven above the AP firing threshold, this results in feedforward inhibition of BLA PNs (Fig. 6A; Cho et al., 2013). We investigated whether neuronal immunoactivation could affect the efficacy of feedforward inhibition in mPFC–BLA projections, thereby modifying the firing output of BLA neurons. Consistent with previous reports, activation of mPFC projections to the BLA by pulses of blue light resulted in monosynaptic (see above) glutamatergic EPSCs in recorded neurons that were followed by GABAA receptor-mediated IPSCs. To record the excitatory and inhibitory responses from the same neurons in isolation, we evoked the EPSCs at a holding potential of −80 mV (close to the reversal potential for chloride-mediated GABAergic IPSCs) and the IPSCs at 0 mV (the reversal potential for AMPA receptor EPSCs) (Cho et al., 2013) (Fig. 6B). Synaptic latencies of IPSCs were ∼2 times longer than those of the EPSCs, consistent with the disynaptic nature of inhibitory responses (Fig. 6B; Student's two-tailed paired t test, t(14) = 5.296, p < 0.001 for the comparison between synaptic latencies of EPSCs and IPSCs). The IPSCs at 0 mV were completely blocked by bicuculline (30 μm), confirming that IPSCs were mediated by activation of GABAA receptors and were not contaminated by EPSCs at this holding potential (Fig. 6C). Conversely, the EPSCs at −80 mV were suppressed by AMPA/kainate and NMDA receptor antagonists (10 μm NBQX and 50 μm D-AP5, respectively) when the antagonists were applied together (Fig. 6D). GABAAR-IPSCs were also completely blocked by the application of NBQX and D-AP5, confirming that they were disynaptic, mediating feedforward inhibition of BLA neurons (Fig. 6D).
Figure 6.
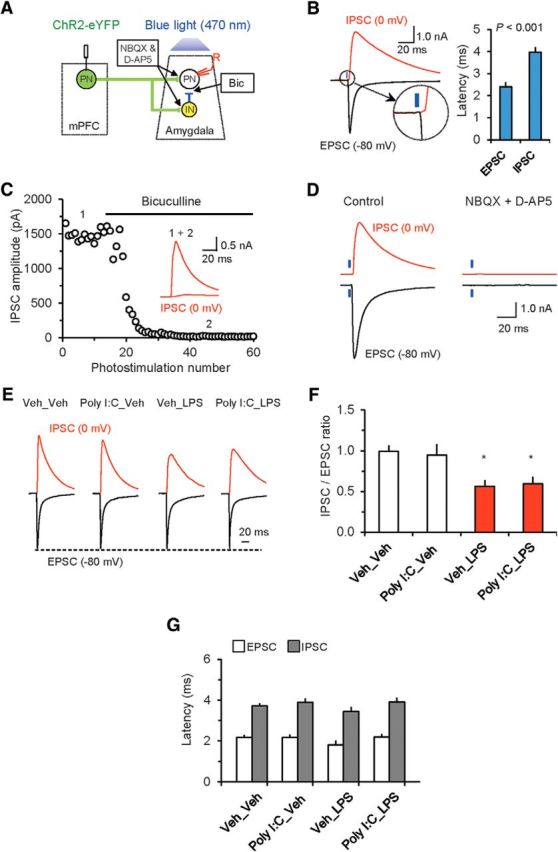
Feedforward inhibition in the mPFC–BLA pathway is diminished in postnatally immunoactivated mice. A, Experimental design for analyzing neural circuits of feedforward inhibition in the mPFC–BLA projections. Glutamatergic inputs to both BLA PNs and INs, activated by blue light stimulation of mPFC fibers, were blocked by AMPA and NMDA receptor antagonists (10 μm NBQX and 50 μm D-AP5, respectively). Projections from IN to PN were suppressed by the GABAA receptor antagonist bicuculline (Bic, 30 μm). B, Left, Synaptic responses were induced by photostimualtion (7.4–10.2 mW/mm2) and recorded in BLA neurons at −80 mV (black trace, EPSC) and 0 mV (red trace, IPSC). The inset shows a delayed onset (synaptic latency) of synaptic currents recorded at 0 mV. Right, mean synaptic latencies of IPSCs and EPSCs. The IPSC latency (at a holding potential of 0 mV) was much longer compared with EPSCs recorded in the same neurons at a holding potential of −80 mV, suggesting that the IPSC is polysynaptic in nature (n = 10 neurons from 3 mice). C, IPSCs at a holding potential of 0 mV were completely blocked by the GABAA receptor antagonist bicuculline (30 μm). D, Both EPSCs and IPSCs (recorded in BLA PNs at −80 or 0 mV, respectively) were completely blocked by NBQX (10 μm) and D-AP5 (50 μm), confirming that the IPSCs, mediated by activation of local circuit INs, are polysynaptic in origin and triggered by glutamatergic mPFC inputs to IN. E, EPSCs and IPSCs (averages of 10 traces) recorded in the same neurons in slices from all experimental groups. IPSCs were normalized to the mean amplitude of the EPSC at a holding potential of −80 mV to allow the comparison of changes in the IPSC amplitude between the groups. F, The IPSC/EPSC amplitude ratio was decreased in Veh_LPS and Poly I:C_LPS groups, indicating an effect of PIA on the balance between excitation and inhibition in mPFC–BLA projections (Veh_Veh group: n = 17 neurons from 7 mice; Poly I:C_Veh: n = 18 neurons from 9 mice; Veh_LPS: n = 13 neurons from 5 mice; Poly I:C_LPS: n = 23 neurons from 11 mice). G, Immunoactivation had no effect on the latencies of EPSCs or IPSCs in mPFC–BLA projections (Veh_Veh group: n = 17 neurons from 7 mice; Poly I:C_Veh: n = 18 neurons from 9 mice; Veh_LPS: n = 13 neurons from 5 mice; Poly I:C_LPS: n = 23 neurons from 11 mice). *p < 0.05.
To determine the effects of immunoactivation on feedforward inhibition in mPFC–BLA projections, we first recorded photostimulation-induced glutamatergic EPSCs at −80 mV and then GABAergic IPSCs at 0 mV (see above) from the same neurons in the BLA (Fig. 6E) in control and treated mice and calculated IPSC/EPSC amplitude ratios in all experimental groups. We found that these ratios were significantly reduced in slices from Veh_LPS and Poly I:C_LPS groups compared with control Veh_Veh animals (Fig. 6F; two-way ANOVA, Poly I:C, F(1,67) = 0.004, p = 0.95; LPS, F(1,67) = 14.598, p < 0.001; interaction, F(1,67) = 0.148, p = 0.702; post hoc Bonferroni's test: p = 0.044 for Veh_Veh versus Veh_LPS and p = 0.027 for Veh_Veh versus Poly I:C_LPS). However, IPSC/EPSC amplitude ratios were not altered in the Poly I:C_Veh group. MIA, PIA, and MIA+PIA had no effects on the latencies of synaptic responses in mPFC inputs to the BLA (Fig. 6G; EPSC latencies: two-way ANOVA, Poly I:C, F(1,67) = 1.733, p = 0.193; LPS, F(1,67) = 1.245, p = 0.269; interaction, F(1,67) = 1.522, p = 0.222; IPSC latencies: two-way ANOVA, Poly I:C, F(1,67) = 2.538, p = 0.116; LPS, F(1,67) = 0.402, p = 0.528; interaction, F(1,67) = 0.519, p = 0.474). Considered together with the fact that the efficacy of glutamatergic synaptic transmission was unaffected in Veh_LPS mice (Fig. 4C,D), these findings suggest that PIA, but not MIA, led to decreased feedforward inhibition, thus shifting the balance between inhibition and excitation in mPFC–BLA projections toward a greater functional efficiency of excitation. Therefore, it appears that MIA and PIA may have distinct cellular targets in the BLA.
Neuroinflammation-induced synaptic modifications in mPFC–BLA projections lead to increased firing output of BLA neurons
To explore the functional consequences of MIA-induced strengthening of glutamatergic synapses and PIA-induced suppression of feedforward GABAergic inhibitory responses in prefrontal projections to the BLA, we tested the effects of immunoactivation on the probability of synaptically driven spiking at the studied pathways (Riccio et al., 2009; Cho et al., 2012, 2013). We induced extracellular synaptically triggered spikes with photostimuli of increasing intensity (ranging from 0.5 to 10.2 mW/mm2) and recorded them in BLA neurons in a cell-attached patch configuration (Fig. 7A,B). Under these recording conditions, we minimized the contribution of voltage errors, which might be prominent for synaptic responses exceeding 1 nA in amplitude (Fig. 4C), and avoided the potential problems associated with prolonged whole-cell recordings, which can disturb the intracellular milieu, thus possibly affecting the properties of recorded neurons (Cho et al., 2011). The probability of AP generation was dramatically increased when the GABAA receptor antagonist bicuculline (30 μm) was added to the external medium (Fig. 7C,D; two-way ANOVA, F(1,84) = 14.169, p < 0.001), providing evidence that synaptically driven spike output of BLA neurons is under inhibitory control. We then compared the average number of extracellular spikes triggered in BLA neurons by single pulses of light of increasing intensity delivered to the ChR2-expressing mPFC fibers. We found that the probability of neuronal firing induced by synaptic activation was increased in slices from the Veh_LPS group only[(relative to the control Veh_Veh group) (Fig. 7E,F; three-way ANOVA (Poly I:C × LPS × light power density), Poly I:C, F(1,442) = 23.474, p < 0.001; LPS, F(1,442) = 34.994, p < 0.001; interaction, F(1,442) = 1.027, p = 0.401; post hoc Bonferroni's multiple comparisons: p < 0.001 for Veh_Veh versus Veh_LPS], whereas there was no effect of the treatments on spike output of BLA neurons in Poly I:C_Veh or Poly I:C_LPS groups.
Figure 7.

Neuroinflammation is associated with the increased probability of synaptically driven spike firing in the mPFC–BLA pathway. A, Experimental design for recording of synaptically driven extracellular spikes in BLA PNs in response to photostimulation of mPFC fibers. B, Left, Superimposed synaptic responses (extracellular spikes) recorded in a BLA PN evoked by photostimulation of ChR2-expressing mPFC fibers in a cell-attached patch configuration. Right, Recordings under current-clamp conditions from the same neuron after establishing a whole-cell recording configuration. C, Examples of responses (extracellular spikes recorded in a cell-attached patch configuration) in BLA neurons to light pulses of increasing intensity under control conditions (left) and in the presence of the GABAA receptor antagonist bicuculline (30 μm, right). D, Number of spikes in response to presynaptic photostimulation was increased significantly in the presence of the GABAA receptor antagonist bicuculline (30 μm) in the external medium (control: n = 10 neurons from 3 mice; bicuculline: n = 6 neurons from 3 mice). E, Examples of synaptically driven spikes in BLA PNs in slices from different groups of mice. F, Summary input/output plots for synaptically driven spikes in BLA neurons in all experimental groups (Veh_Veh group: n = 22 neurons from 7 mice; Poly I:C_Veh: n = 13 neurons from 5 mice; Veh_LPS: n = 21 neurons from 5 mice; Poly I:C_LPS: n = 22 neurons from 7 mice).
Considered together, our findings provide evidence that neuroinflammation-associated synaptic modifications are functionally relevant, modifying the signal flow in mPFC–BLA circuits, and that the various manipulations (MIA, PIA, and MIA+PIA) can be distinguished from each other using our methodologies, enabling the development of a model that depicts the specific effects of each process (Fig. 8).
Figure 8.

Functional alterations in the mPFC–BLA circuits associated with maternal and postnatal immunoactivation. A–D, Left, Diagrams illustrating the signal flow in the mPFC–BLA pathways in mice from all experimental groups. Glutamatergic (red lines) mPFC projections form excitatory synapses on BLA PNs and on the local circuit INs. Interneurons form inhibitory synapses (blue line) on PN and thus provide strong feedforward inhibition in the mPFC–BLA pathway. PNs in the BLA, when driven to the AP threshold, send information (red line) to the downstream structures, including the central nucleus of the AMG (CeA), bed nucleus of the stria terminalis (BNST), striatum, and cortical areas. Right, Activation of mPFC inputs to BLA PNs and INs results in generation of monosynaptic EPSCs (black trace) and disynaptic IPSCs (blue trace), which could be recorded in BLA PNs at holding potentials of −80 or 0 mV, respectively. Changes in the thickness of lines indicate a change in synaptic efficacy. See Discussion for the additional detailed interpretation of experimental findings.
Discussion
Our studies provide evidence that MIA and PIA could have distinct cellular targets in the brain. Specifically, our MIA regimen (prenatal Poly I:C) led to the strengthening of monosynaptic glutamatergic inputs of the mPFC-arising afferents to PNs in the BLA, whereas our PIA regimen (postnatal LPS) suppressed feedforward GABAAR-mediated inhibition of BLA neurons by local circuit INs. The resulting shift in the balance between excitation and inhibition in mPFC–BLA projections, enhancing the functional efficiency of excitatory prefrontal inputs, translated into the increased firing of BLA neurons. These physiological alterations were accompanied by increases in anxiety-like behavior and decreases in social interactions in groups in which mice had received LPS treatment (Veh_LPS and Poly I:C_LPS). Conversely, systemic neuroinflammation has been shown previously to result in increased neuronal activity within the AMG, which was correlated with increases in anxiety-like behavior (Engler et al., 2011). The fact that all of the immune-activating treatments produced distinct physiological consequences, even in the absence of a significant change in behavior (e.g., Poly I:C_Veh mice), suggests a potentially higher sensitivity of the electrophysiological techniques in detecting effects that might be below the threshold for significantly altering behavioral endpoints.
Our results enable the development of a circuit model that captures the unique “physiological signature” of each treatment. Mechanistically, in the offspring of Poly I:C-treated dams (Poly I:C_Veh group), the efficacy of glutamatergic synaptic transmission in mPFC projections to both BLA PNs and BLA INs was proportionally increased (shown as thicker red lines in Fig. 8B), reflected in proportionally increased amplitudes of EPSCs and IPSCs. The proportionality of the effect of MIA on EPCS and IPSCs is supported by the finding that the IPSC/EPSC amplitude ratio in slices from these mice was unaffected relative to control Veh_Veh mice. Consistent with this, the spike output of BLA neurons in response to activation of mPFC afferents remained unchanged. Postnatal immunoactivation alone (Veh_LPS group) did not affect synaptic efficacy at glutamatergic mPFC inputs to the BLA, but it was associated with decreases in the amplitude of feedforward IN-mediated IPSCs (represented as a thinner blue line in the diagram in Fig. 8C). The resulting decreases in the IPSC/EPSC amplitude ratio led to the increased functional efficiency of neurotransmission in the mPFC–BLA projections, translating into the increased spike output of BLA PNs. In mice from the Poly I:C_LPS group, the BLA spike output appears to be determined by complex interactions between the effects of MIA (increased synaptic strength at both glutamatergic and GABAergic inputs to BLA PNs) and PIA-induced decreases in inhibition. Although the opposing effects of MIA and PIA on feedforward inhibition partially compensate each other, the IPSC/EPSC amplitude ratio was still decreased relative to control animals (Fig. 8D). However, this shift toward a greater functional efficiency of excitation in the Poly I:C_LPS group was insufficient to affect the spike output of BLA neurons in mPFC–BLA projections. Regardless, each of the three treatments produces a unique signature that can be differentiated from the others.
Our finding that the altered signal flow in the mPFC–AMG pathways may result in enhanced anxiety and decreased social interactions is consistent with previously published observations implicating both the mPFC (Elliott et al., 2016; Felix-Ortiz et al., 2016; Vila-Verde et al., 2016) and the BLA complex (Sanders et al., 1995; Frankland et al., 1997; Pérez de la Mora et al., 2006) in control of innate fear and anxiety responses. In addition, we recently reported evidence that, among other mechanisms, the activation of the BLA complex mediates anxiogenesis (Riccio et al., 2014). Specifically, we found that the knock-down of the transient receptor potential channel subunit 4 (TRPC4) subunit, which is abundantly expressed in brain areas controlling innate fear responses in the normal mouse brain, in the lateral AMG resulted in suppressed innate fear responses as quantified with anxiety-probing behavioral tests. Our present results link together these previously disparate observations, highlighting the role of mPFC–BLA projections in control of anxiety-like behaviors, which are frequently comorbid with ASD (South and Rodgers, 2017). Considering that it has been shown that MIA alone and PIA alone can each produce behavioral signs in mice that resemble the core features of ASDs (e.g., aberrant social interactions, communication deficits, and increases in stereotyped behaviors; Smith et al., 2007; Custódio et al., 2017), our data raise the possibility that mPFC–BLA functional interactions could be affected in humans with ASD.
It is important to emphasize that our studies characterize the effects of using Poly I:C as the trigger for MIA and LPS as the trigger for PIA. We selected this order to approximate the human condition, where postnatal bacterial infections (modeled by LPS) are highly prevalent (Bilbo and Schwarz, 2009). In addition, this order of treatment matches well with models that describe the putative time course of TLR3 (the receptor at which Poly I:C acts) and TLR4 (the receptor at which LPS acts) expression (Barak et al., 2014). Other permutations of this treatment regimen may yield different outcomes.
The mechanisms that we describe here could contribute to the behavioral manifestations of ASD, providing evidence that the development of ASD may implicate dysregulation of the functional connectivity between distinct brain regions involved in control of specific behavioral mechanisms (Markram and Markram, 2010; Monk et al., 2010; Rudie et al., 2012). More generally, our work lends support to a theory that the development of ASD may be associated with the excitation/inhibition imbalance in the brain leading to increased excitability of relevant neural circuits (Hussman, 2001; Rubenstein and Merzenich, 2003; Nelson and Valakh, 2015; Canetta et al., 2016; Lee et al., 2017; Missig et al., 2018). Future studies will be needed to identify molecular pathways implicated in neuroinflammation-induced synaptic changes in the mPFC–BLA circuits and to determine whether there might be sex differences that contribute to the prevalence of conditions such as ASD (Baron-Cohen et al., 2005; Werling and Geschwind, 2013).
Footnotes
We thank the Robert and Donna Landreth Family Fund and the Nancy Lurie Marks Family Foundation for their generous support of this project.
The authors declare no competing financial interests.
References
- Abrahams BS, Geschwind DH (2008) Advances in autism genetics: on the threshold of a new neurobiology. Nat Rev Genet 9:341–355. 10.1038/nrg2346 [DOI] [PMC free article] [PubMed] [Google Scholar]
- Atladóttir HO, Thorsen P, Østergaard L, Schendel DE, Lemcke S, Abdallah M, Parner ET (2010) Maternal infection requiring hospitalization during pregnancy and autism spectrum disorders. J Autism Dev Disord 40:1423–1430. 10.1007/s10803-010-1006-y [DOI] [PubMed] [Google Scholar]
- Bagot RC, Parise EM, Peña CJ, Zhang HX, Maze I, Chaudhury D, Persaud B, Cachope R, Bolaños-Guzmán CA, Cheer JF, Deisseroth K, Han MH, Nestler EJ (2015) Ventral hippocampal afferents to the nucleus accumbens regulate susceptibility to depression. Nat Commun 6:7626. 10.1038/ncomms8626 [DOI] [PMC free article] [PubMed] [Google Scholar]
- Barak B, Feldman N, Okun E (2014) Toll-like receptors as developmental tools that regulate neurogenesis during development: an update. Front Neurosci 8:272. 10.3389/fnins.2014.00272 [DOI] [PMC free article] [PubMed] [Google Scholar]
- Baron-Cohen S, Ring HA, Wheelwright S, Bullmore ET, Brammer MJ, Simmons A, Williams SC (1999) Social intelligence in the normal and autistic brain: an fMRI study. Eur J Neurosci 11:1891–1898. 10.1046/j.1460-9568.1999.00621.x [DOI] [PubMed] [Google Scholar]
- Baron-Cohen S, Knickmeyer RC, Belmonte MK (2005) Sex differences in the brain: implications for explaining autism. Science 310:819–823. 10.1126/science.1115455 [DOI] [PubMed] [Google Scholar]
- Betancur C. (2011) Etiological heterogeneity in autism spectrum disorders: more than 100 genetic and genomic disorders and still counting. Brain Res 1380:42–77. 10.1016/j.brainres.2010.11.078 [DOI] [PubMed] [Google Scholar]
- Bilbo SD, Schwarz JM (2009) Early-life programming of later-life brain and behavior: a critical role for the immune system. Front Behav Neurosci 3:14. 10.3389/neuro.08.014.2009 [DOI] [PMC free article] [PubMed] [Google Scholar]
- Boyden ES, Zhang F, Bamberg E, Nagel G, Deisseroth K (2005) Millisecond-timescale, genetically targeted optical control of neural activity. Nat Neurosci 8:1263–1268. 10.1038/nn1525 [DOI] [PubMed] [Google Scholar]
- Britton DR, Britton KT (1981) A sensitive open field measure of anxiolytic drug activity. Pharmacol Biochem Behav 15:577–582. 10.1016/0091-3057(81)90212-4 [DOI] [PubMed] [Google Scholar]
- Canetta S, Bolkan S, Padilla-Coreano N, Song LJ, Sahn R, Harrison NL, Gordon JA, Brown A, Kellendonk C (2016) Maternal immune activation leads to selective functional deficits in offspring parvalbumin interneurons. Mol Psychiatry 21:956–968. 10.1038/mp.2015.222 [DOI] [PMC free article] [PubMed] [Google Scholar]
- Cho JH, Bayazitov IT, Meloni EG, Myers KM, Carlezon WA Jr, Zakharenko SS, Bolshakov VY (2011) Coactivation of thalamic and cortical pathways induces input timing-dependent plasticity in amygdala. Nat Neurosci 15:113–122. 10.1038/nn.2993 [DOI] [PMC free article] [PubMed] [Google Scholar]
- Cho JH, Zushida K, Shumyatsky GP, Carlezon WA Jr, Meloni EG, Bolshakov VY (2012) Pituitary adenylate cyclase-activating polypeptide induces postsynaptically expressed potentiation in the intra-amygdala circuit. J Neurosci 32:14165–14177. 10.1523/JNEUROSCI.1402-12.2012 [DOI] [PMC free article] [PubMed] [Google Scholar]
- Cho JH, Deisseroth K, Bolshakov VY (2013) Synaptic encoding of fear extinction in mPFC–amygdala circuits. Neuron 80:1491–1507. 10.1016/j.neuron.2013.09.025 [DOI] [PMC free article] [PubMed] [Google Scholar]
- Choi GB, Yim YS, Wong H, Kim S, Kim H, Kim SV, Hoeffer CA, Littman DR, Huh JR (2016) The maternal interleukin-17a pathway in mice promotes autism-like phenotypes in offspring. Science 351:933–939. 10.1126/science.aad0314 [DOI] [PMC free article] [PubMed] [Google Scholar]
- Custódio CS, Mello BSF, Filho AJMC, de Carvalho Lima CN, Cordeiro RC, Miyajima F, Réus GZ, Vasconcelos SMM, Barichello T, Quevedo J, de Oliveira AC, de Lucena DF, Macedo DS (2017) Neonatal immune challenge with lipopolysaccharide triggers long-lasting sex- and age-related behavioral and immune/neurotrophic alterations in mice: relevance to autism spectrum disorders. Mol Neurobiol. In press. 10.1007/s12035-017-0616-1 [DOI] [PubMed] [Google Scholar]
- Ehrlich I, Humeau Y, Grenier F, Ciocchi S, Herry C, Lüthi A (2009) Amygdala inhibitory circuits and the control of fear memory. Neuron 62:757–771. 10.1016/j.neuron.2009.05.026 [DOI] [PubMed] [Google Scholar]
- Elliott E, Manashirov S, Zwang R, Gil S, Tsoory M, Shemesh Y, Chen A (2016) Dnmt3a in the medial prefrontal cortex regulates anxiety-like behavior in adult mice. J Neurosci 36:730–740. 10.1523/JNEUROSCI.0971-15.2016 [DOI] [PMC free article] [PubMed] [Google Scholar]
- Engler H, Doenlen R, Engler A, Riether C, Prager G, Niemi MB, Pacheco-López G, Krügel U, Schedlowski M (2011) Acute amygdaloid response to systemic inflammation. Brain Behav Immun 25:1384–1392. 10.1016/j.bbi.2011.04.005 [DOI] [PubMed] [Google Scholar]
- Felix-Ortiz AC, Burgos-Robles A, Bhagat ND, Leppla CA, Tye KM (2016) Bidirectional modulation of anxiety-related and social behaviors by amygdala projections to the medial prefrontal cortex. Neuroscience 321:197–209. 10.1016/j.neuroscience.2015.07.041 [DOI] [PMC free article] [PubMed] [Google Scholar]
- File SE. (1985) What can be learned from the effects of benzodiazepines on exploratory behavior? Neurosci Biobehav Rev 9:45–54. 10.1016/0149-7634(85)90031-4 [DOI] [PubMed] [Google Scholar]
- Frankland PW, Josselyn SA, Bradwejn J, Vaccarino FJ, Yeomans JS (1997) Activation of amygdala cholecystokininB receptors potentiates the acoustic startle response in the rat. J Neurosci 17:1838–1847. [DOI] [PMC free article] [PubMed] [Google Scholar]
- Franklin K, Paxinos G (2007) The mouse brain in stereotaxic coordinates. San Diego, CA: Academic. [Google Scholar]
- Gentet LJ, Stuart GJ, Clements JD (2000) Direct measurement of specific membrane capacitance in neurons. Biophys J 79:314–320. 10.1016/S0006-3495(00)76293-X [DOI] [PMC free article] [PubMed] [Google Scholar]
- Giovanoli S, Engler H, Engler A, Richetto J, Voget M, Willi R, Winter C, Riva MA, Mortensen PB, Feldon J, Schedlowski M, Meyer U (2013) Stress in puberty unmasks latent neuropathological consequences of prenatal immune activation in mice. Science 339:1095–1099. 10.1126/science.1228261 [DOI] [PubMed] [Google Scholar]
- Golden SA, Covington HE 3rd, Berton O, Russo SJ (2011) A standardized protocol for repeated social defeat stress in mice. Nat Protoc 6:1183–1191. 10.1038/nprot.2011.361 [DOI] [PMC free article] [PubMed] [Google Scholar]
- Goussakov I, Chartoff EH, Tsvetkov E, Gerety LP, Meloni EG, Carlezon WA Jr, Bolshakov VY (2006) LTP in the lateral amygdala during cocaine withdrawal. Eur J Neurosci 23:239–250. 10.1111/j.1460-9568.2005.04538.x [DOI] [PubMed] [Google Scholar]
- Hadjkacem I, Ayadi H, Turki M, Yaich S, Khemekhem K, Walha A, Cherif L, Moalla Y, Ghribi F (2016) Prenatal, perinatal and postnatal factors associated with autism spectrum disorder. J Pediatr (Rio J) 92:595–601. 10.1016/j.jped.2016.01.012 [DOI] [PubMed] [Google Scholar]
- Harvey L, Boksa P (2012) Prenatal and postnatal animal models of immune activation: relevance to a range of neurodevelopmental disorders. Dev Neurobiol 72:1335–1348. 10.1002/dneu.22043 [DOI] [PubMed] [Google Scholar]
- Hussman JP. (2001) Suppressed GABAergic inhibition as a common factor in suspected etiologies of autism. J Autism Dev Disord 31:247–248. 10.1023/A:1010715619091 [DOI] [PubMed] [Google Scholar]
- Kawai T, Akira S (2008) Toll-like receptor and RIG-I-like receptor signaling. Ann NY Acad Sci 1143:1–20. 10.1196/annals.1443.020 [DOI] [PubMed] [Google Scholar]
- Knuesel I, Chicha L, Britschgi M, Schobel SA, Bodmer M, Hellings JA, Toovey S, Prinssen EP (2014) Maternal immune activation and abnormal brain development across CNS disorders. Nat Rev Neurol 10:643–660. 10.1038/nrneurol.2014.187 [DOI] [PubMed] [Google Scholar]
- Krstic D, Madhusudan A, Doehner J, Vogel P, Notter T, Imhof C, Manalastas A, Hilfiker M, Pfister S, Schwerdel C, Riether C, Meyer U, Knuesel I (2012) Systemic immune challenges trigger and drive alzheimer-like neuropathology in mice. J Neuroinflammation 9:151. 10.1186/1742-2094-9-151 [DOI] [PMC free article] [PubMed] [Google Scholar]
- LeDoux JE. (2000) Emotion circuits in the brain. Annu Rev Neurosci 23:155–184. 10.1146/annurev.neuro.23.1.155 [DOI] [PubMed] [Google Scholar]
- Lee E, Lee J, Kim E (2017) Excitation/inhibition imbalance in animal models of autism spectrum disorders. Biol Psychiatry 81:838–847. 10.1016/j.biopsych.2016.05.011 [DOI] [PubMed] [Google Scholar]
- Lezak KR, Missig G, Carlezon WA Jr (2017) Behavioral methods to study anxiety in rodents. Dialogues Clin Neurosci 19:181–191. [DOI] [PMC free article] [PubMed] [Google Scholar]
- Li Y, Meloni EG, Carlezon WA Jr, Milad MR, Pitman RK, Nader K, Bolshakov VY (2013) Learning and reconsolidation implicate different synaptic mechanisms. Proc Natl Acad Sci U S A 110:4798–4803. 10.1073/pnas.1217878110 [DOI] [PMC free article] [PubMed] [Google Scholar]
- Lombardo MV, Moon HM, Su J, Palmer TD, Courchesne E, Pramparo T (2017) Maternal immune activation dysregulation of the fetal brain transcriptome and relevance to the pathophysiology of autism spectrum disorder. Mol Psychiatry. In press. 10.1101/064683 [DOI] [PMC free article] [PubMed] [Google Scholar]
- Luchkina NV, Bolshakov VY (2017) Diminishing fear: Optogenetic approach toward understanding neural circuits of fear control. Pharmacol Biochem Behav (Epub ahead of print). [DOI] [PMC free article] [PubMed] [Google Scholar]
- Maren S, Quirk GJ (2004) Neuronal signalling of fear memory. Nat Rev Neurosci 5:844–852. 10.1038/nrn1535 [DOI] [PubMed] [Google Scholar]
- Markram K, Markram H (2010) The intense world theory–a unifying theory of the neurobiology of autism. Front Hum Neurosci 4:224. 10.3389/fnhum.2010.00224 [DOI] [PMC free article] [PubMed] [Google Scholar]
- McDougle CJ, Landino SM, Vahabzadeh A, O'Rourke J, Zurcher NR, Finger BC, Palumbo ML, Helt J, Mullett JE, Hooker JM, Carlezon WA Jr (2015) Toward an immune-mediated subtype of autism spectrum disorder. Brain Res 1617:72–92. 10.1016/j.brainres.2014.09.048 [DOI] [PubMed] [Google Scholar]
- Meltzer A, Van de Water J (2017) The role of the immune system in autism spectrum disorder. Neuropsychopharmacology 42:284–298. 10.1038/npp.2016.158 [DOI] [PMC free article] [PubMed] [Google Scholar]
- Miller AH, Haroon E, Felger JC (2017) The immunology of behavior-exploring the role of the immune system in brain health and illness. Neuropsychopharmacology 42:1–4. 10.1038/npp.2016.229 [DOI] [PMC free article] [PubMed] [Google Scholar]
- Missig G, Mokler EL, Robbins JO, Alexander AJ, McDougle CJ, Carlezon WA Jr (2018) Perinatal immune activation produces persistent sleep alterations and epileptiform activity in male mice. Neuropsychopharmacology 43:482–491. 10.1038/npp.2017.243 [DOI] [PMC free article] [PubMed] [Google Scholar]
- Monk CS, Weng SJ, Wiggins JL, Kurapati N, Louro HM, Carrasco M, Maslowsky J, Risi S, Lord C (2010) Neural circuitry of emotional face processing in autism spectrum disorders. J Psychiatry Neurosci 35:105–114. 10.1503/jpn.090085 [DOI] [PMC free article] [PubMed] [Google Scholar]
- Mrozek-Budzyn D, Majewska R, Kieltyka A (2013) Prenatal, perinatal and neonatal risk factors for autism: study in Poland. Cent Eur J Med 8:424–430. 10.2478/s11536-013-0174-5 [DOI] [Google Scholar]
- Nelson SB, Valakh V (2015) Excitatory/Inhibitory balance and circuit homeostasis in autism spectrum disorders. Neuron 87:684–698. 10.1016/j.neuron.2015.07.033 [DOI] [PMC free article] [PubMed] [Google Scholar]
- Onore C, Careaga M, Ashwood P (2012) The role of immune dysfunction in the pathophysiology of autism. Brain Behav Immun 26:383–392. 10.1016/j.bbi.2011.08.007 [DOI] [PMC free article] [PubMed] [Google Scholar]
- O'Roak BJ, Vives L, Fu W, Egertson JD, Stanaway IB, Phelps IG, Carvill G, Kumar A, Lee C, Ankenman K, Munson J, Hiatt JB, Turner EH, Levy R, O'Day DR, Krumm N, Coe BP, Martin BK, Borenstein E, Nickerson DA, et al. (2012) Multiplex targeted sequencing identifies recurrently mutated genes in autism spectrum disorders. Science 338:1619–1622. 10.1126/science.1227764 [DOI] [PMC free article] [PubMed] [Google Scholar]
- Pape HC, Pare D (2010) Plastic synaptic networks of the amygdala for the acquisition, expression, and extinction of conditioned fear. Physiol Rev 90:419–463. 10.1152/physrev.00037.2009 [DOI] [PMC free article] [PubMed] [Google Scholar]
- Patel S, Masi A, Dale RC, Whitehouse AJO, Pokorski I, Alvares GA, Hickie IB, Breen E, Guastella AJ (2017) Social impairments in autism spectrum disorder are related to maternal immune history profile. Mol Psychiatry. In press. 10.1038/mp.2017.201 [DOI] [PubMed] [Google Scholar]
- Patterson PH. (2009) Immune involvement in schizophrenia and autism: etiology, pathology and animal models. Behav Brain Res 204:313–321. 10.1016/j.bbr.2008.12.016 [DOI] [PubMed] [Google Scholar]
- Pérez de la Mora M, Lara-García D, Jacobsen KX, Vázquez-García M, Crespo-Ramírez M, Flores-Gracia C, Escamilla-Marvan E, Fuxe K (2006) Anxiolytic-like effects of the selective metabotropic glutamate receptor 5 antagonist MPEP after its intra-amygdaloid microinjection in three different non-conditioned rat models of anxiety. Eur J Neurosci 23:2749–2759. 10.1111/j.1460-9568.2006.04798.x [DOI] [PubMed] [Google Scholar]
- Petreanu L, Mao T, Sternson SM, Svoboda K (2009) The subcellular organization of neocortical excitatory connections. Nature 457:1142–1145. 10.1038/nature07709 [DOI] [PMC free article] [PubMed] [Google Scholar]
- Reisinger S, Khan D, Kong E, Berger A, Pollak A, Pollak DD (2015) The poly(I:C)-induced maternal immune activation model in preclinical neuropsychiatric drug discovery. Pharmacol Ther 149:213–226. 10.1016/j.pharmthera.2015.01.001 [DOI] [PubMed] [Google Scholar]
- Riccio A, Li Y, Moon J, Kim KS, Smith KS, Rudolph U, Gapon S, Yao GL, Tsvetkov E, Rodig SJ, Van't Veer A, Meloni EG, Carlezon WA Jr, Bolshakov VY, Clapham DE (2009) Essential role for TRPC5 in amygdala function and fear-related behavior. Cell 137:761–772. 10.1016/j.cell.2009.03.039 [DOI] [PMC free article] [PubMed] [Google Scholar]
- Riccio A, Li Y, Tsvetkov E, Gapon S, Yao GL, Smith KS, Engin E, Rudolph U, Bolshakov VY, Clapham DE (2014) Decreased anxiety-like behavior and Gαq/11-dependent responses in the amygdala of mice lacking TRPC4 channels. J Neurosci 34:3653–3667. 10.1523/JNEUROSCI.2274-13.2014 [DOI] [PMC free article] [PubMed] [Google Scholar]
- Rinaldi T, Perrodin C, Markram H (2008) Hyper-connectivity and hyper-plasticity in the medial prefrontal cortex in the valproic acid animal model of autism. Front Neural Circuits 2:4. 10.3389/neuro.04.004.2008 [DOI] [PMC free article] [PubMed] [Google Scholar]
- Rubenstein JL, Merzenich MM (2003) Model of autism: increased ratio of excitation/inhibition in key neural systems. Genes Brain Behav 2:255–267. 10.1034/j.1601-183X.2003.00037.x [DOI] [PMC free article] [PubMed] [Google Scholar]
- Rudie JD, Shehzad Z, Hernandez LM, Colich NL, Bookheimer SY, Iacoboni M, Dapretto M (2012) Reduced functional integration and segregation of distributed neural systems underlying social and emotional information processing in autism spectrum disorders. Cereb Cortex 22:1025–1037. 10.1093/cercor/bhr171 [DOI] [PMC free article] [PubMed] [Google Scholar]
- Sah P, Faber ES, Lopez De Armentia M, Power J (2003) The amygdaloid complex: anatomy and physiology. Physiol Rev 83:803–834. 10.1152/physrev.00002.2003 [DOI] [PubMed] [Google Scholar]
- Sanders SK, Shekhar A (1995) Regulation of anxiety by GABAA receptors in the rat amygdala. Pharmacol Biochem Behav 52:701–706. 10.1016/0091-3057(95)00153-N [DOI] [PubMed] [Google Scholar]
- Sangha S, Greba Q, Robinson PD, Ballendine SA, Howland JG (2014) Heightened fear in response to a safety cue and extinguished fear cue in a rat model of maternal immune activation. Front Behav Neurosci 8:168. 10.3389/fnbeh.2014.00168 [DOI] [PMC free article] [PubMed] [Google Scholar]
- Semple BD, Blomgren K, Gimlin K, Ferriero DM, Noble-Haeusslein LJ (2013) Brain development in rodents and humans: identifying benchmarks of maturation and vulnerability to injury across species. Prog Neurobiol 106–107:1–16. 10.1016/j.pneurobio.2013.04.001 [DOI] [PMC free article] [PubMed] [Google Scholar]
- Sholl DA. (1953) Dendritic organization in the neurons of the visual and motor cortices of the cat. J Anat 87:387–406. [PMC free article] [PubMed] [Google Scholar]
- Smith SE, Li J, Garbett K, Mirnics K, Patterson PH (2007) Maternal immune activation alters fetal brain development through interleukin-6. J Neurosci 27:10695–10702. 10.1523/JNEUROSCI.2178-07.2007 [DOI] [PMC free article] [PubMed] [Google Scholar]
- South M, Rodgers J (2017) Sensory, emotional and cognitive contributions to anxiety in autism spectrum disorders. Front Hum Neurosci 11:20. 10.3389/fncom.2017.00020 [DOI] [PMC free article] [PubMed] [Google Scholar]
- Strobel C, Marek R, Gooch HM, Sullivan RK, Sah P (2015) Prefrontal and auditory input to intercalated neurons of the amygdala. Cell Rep pii: S2211–1247(15)00136–9. 10.1016/j.celrep.2015.02.008 [DOI] [PubMed] [Google Scholar]
- Sui L, Chen M (2012) Prenatal exposure to valproic acid enhances synaptic plasticity in the medial prefrontal cortex and fear memories. Brain Res Bull 87:556–563. 10.1016/j.brainresbull.2012.01.011 [DOI] [PubMed] [Google Scholar]
- Talkowski ME, Minikel EV, Gusella JF (2014) Autism spectrum disorder genetics: diverse genes with diverse clinical outcomes. Harv Rev Psychiatry 22:65–75. 10.1097/HRP.0000000000000002 [DOI] [PMC free article] [PubMed] [Google Scholar]
- Testa-Silva G, Loebel A, Giugliano M, de Kock CP, Mansvelder HD, Meredith RM (2012) Hyperconnectivity and slow synapses during early development of medial prefrontal cortex in a mouse model for mental retardation and autism. Cereb Cortex 22:1333–1342. 10.1093/cercor/bhr224 [DOI] [PMC free article] [PubMed] [Google Scholar]
- Tsvetkov E, Carlezon WA, Benes FM, Kandel ER, Bolshakov VY (2002) Fear conditioning occludes LTP-induced presynaptic enhancement of synaptic transmission in the cortical pathway to the lateral amygdala. Neuron 34:289–300. 10.1016/S0896-6273(02)00645-1 [DOI] [PubMed] [Google Scholar]
- Vila-Verde C, Marinho AL, Lisboa SF, Guimarães FS (2016) Nitric oxide in the prelimbic medial prefrontal cortex is involved in the anxiogenic-like effect induced by acute restraint stress in rats. Neuroscience 320:30–42. 10.1016/j.neuroscience.2016.01.040 [DOI] [PubMed] [Google Scholar]
- Werling DM, Geschwind DH (2013) Sex differences in autism spectrum disorders. Curr Opin Neurol 26:146–153. 10.1097/WCO.0b013e32835ee548 [DOI] [PMC free article] [PubMed] [Google Scholar]
- Zerbo O, Iosif AM, Delwiche L, Walker C, Hertz-Picciotto Knuesel I. (2011) Month of conception and risk of autism. Epidemiology 22:469–475. 10.1097/EDE.0b013e31821d0b53 [DOI] [PMC free article] [PubMed] [Google Scholar]
- Zucker RS, Regehr WG (2002) Short-term synaptic plasticity. Annu Rev Physiol 64:355–405. 10.1146/annurev.physiol.64.092501.114547 [DOI] [PubMed] [Google Scholar]