

Abstract
The medial prefrontal cortex and the basolateral amygdala (BLA) are essential for discriminating between harmful and safe stimuli. The primary auditory cortex (Te1) sends projections to both sites, but whether and how it interacts with these areas during fear discrimination are poorly understood. Here we show that in male rats that can differentiate between a new tone and a threatening one, the selective optogenetic inhibition of Te1 axon terminals into the prelimbic (PL) cortex shifted discrimination to fear generalization. Meanwhile, no effects were detected when Te1 terminals were inhibited in the BLA. Using a combination of local field potential and multiunit recordings, we show that in animals that discriminate successfully between a new tone and a harmful one, the activity of the Te1 and the PL cortex becomes immediately and tightly synchronized in the slow-gamma range (40–70 Hz) at the onset of the new tone. This enhanced synchronization was not present in other frequency ranges, such as the theta range. Critically, the level of gamma synchrony predicted the behavioral choice (i.e., no freezing or freezing) of the animals. Moreover, in the same rats, gamma synchrony was absent before the fear-learning trial and when animals should discriminate between an olfactory stimulus and the auditory harmful one. Thus, our findings reveal that the Te1 and the PL cortex dynamically establish a functional connection during auditory fear-discrimination processes, and that this corticocortical oscillatory mechanism drives the behavioral choice of the animals.
SIGNIFICANCE STATEMENT Identifying neural networks that infer safety versus danger is of great interest in the scientific field. Fear generalization reduces the chances of an animal's survival and leads to psychiatric diseases, such as post-traumatic stress disorders and phobias in humans. Here we demonstrate that animals able to differentiate a new tone from a previous threating tone showed synchronization between the prefrontal and primary auditory cortices. Critically, this connectivity precedes and predicts the behavioral outcome of the animal. Optogenetic inhibition of this functional connectivity leads to fear generalization. To the best of our knowledge, this study is the first to demonstrate that a corticocortical dialogue occurring between sensory and prefrontal areas is a key node for fear-discrimination processes.
Keywords: auditory cortex, fear discrimination, fear generalization, gamma and theta activity, prefrontal cortex
Introduction
In our daily lives, we face new stimuli and situations that can be safe or dangerous. Inferring the most appropriate behavior for these new circumstances represents a major challenge for animals, including humans. Difficulties in this assessment are a hallmark of anxiety disorders, such as post-traumatic stress disorders and generalized phobias. The medial prefrontal cortex (mPFC) is widely recognized to play a key role in these inferring processes (Dunsmoor and Paz, 2015; Likhtik and Paz, 2015; Onat and Büchel, 2015; Do Monte et al., 2016). In particular, the more dorsal mPFC, called the prelimbic (PL) cortex in rodents, has emerged as a candidate for top-down regulation of fear responses and for selecting the most suitable behavioral responses (Likhtik et al., 2005; Corcoran and Quirk, 2007; Herry and Johansen, 2014; Likhtik and Paz, 2015; Do Monte et al., 2016; Karalis et al., 2016). Recent studies have demonstrated that the mPFC interacts with the basolateral amygdala (BLA) during fear-memory expression and fear-discrimination processes. Communication between these two areas relies on the neuronal oscillatory activity of local field potentials (LFPs) in the theta (Likhtik et al., 2014; Dejean et al., 2016; Karalis et al., 2016) and gamma bands (Stujenske et al., 2014). Fear states have been proposed to coincide with the development of 4 Hz oscillations in the prefrontal–amygdala circuit (Likhtik et al., 2014; Karalis et al., 2016), and switches between states of fear and safety are thought to be mediated by changes in this communication (Bocchio and Capogna, 2014; Likhtik et al., 2014; Stujenske et al., 2014).
In addition to these sites, the primary auditory cortex (Te1) is involved in discriminating between neutral and frightening auditory stimuli (Aizenberg and Geffen, 2013; Headley and Weinberger, 2013; Weinberger et al., 2013; Aizenberg et al., 2015; Grosso et al., 2015; Weinberger, 2015; Natan et al., 2017; Wigestrand et al., 2017). Fear learning produces long-lasting plasticity in the Te1 (Aizenberg and Geffen, 2013; Weinberger et al., 2013; Weinberger, 2015), which in turns regulates threat-memory specificity, thereby enabling discrimination between stimuli (Aizenberg and Geffen, 2013; Weinberger, 2015; Wigestrand et al., 2017). In line with these findings, optogenetic manipulation of Te1 neurons modulates memory specificity and discrimination processes (Aizenberg et al., 2015), and Te1 blockade impairs auditory fear discrimination (Wigestrand et al., 2017).
The Te1 is connected to the mPFC via both direct and indirect anatomical pathways (Kolb and Tees, 1990; Van Eden et al., 1992; Paxinos and Watson, 2004). Previous studies have shown that the mPFC and the Te1 dynamically establish a functional connection during auditory tasks, requiring discrimination between classes of reference and target stimuli (Fritz et al., 2010), and that both the mPFC and Te1 show similar neuronal processes when learning to select a specific sound from a mixture of tones (Rodgers and DeWeese, 2014). To the best of our knowledge, however, no studies have addressed the question of whether and how the mPFC and the Te1 interact during fear-memory expression, generalization, and discrimination processes. In the present study, we address this issue. Moreover, because the Te1 is also reciprocally connected to the BLA, although auditory projections are weaker (Romanski and LeDoux, 1993), we also investigated whether the Te1–BLA pathway is engaged, potentially representing a parallel pathway for information flow.
Materials and Methods
Experimental design and statistical analysis
Animals
Male Wistar rats (aged 65–70 d and weighing 250–350 g) were used for all experiments. Animals were housed in plastic cages with food and water available ad libitum, under a 12 h light/dark cycle (lights on at 7:00 A.M.) at a constant temperature of 22 ± 1°C. All experiments were conducted in accordance with the European Communities Council Directive 2010/63/EU and were approved by the Italian Ministry of Health (authorization no. 322/2015).
Behavioral procedures
Fear conditioning.
Rats were trained to associate a conditioned auditory stimulus (CS) with a painful unconditioned stimulus (US), as in our previous studies (Sacco and Sacchetti, 2010; Cambiaghi et al., 2016). The floor of the conditioning cage was made of stainless steel rods connected to a shock generator set to deliver 1 mA current. The chamber was fitted with a loudspeaker connected to a tone generator set to deliver an 80 dB, 1000 Hz pure tone (CS); the loudspeaker was located at 20 cm above the floor. One animal at a time was placed inside the chamber and left undisturbed for 2 min. The rat was then exposed to a series of seven consecutive auditory CSs, each lasting 8 s and, during the last 1 s, paired with an electric foot shock (1 mA, 1 s); the seven sensory stimuli were separated by intervals of 22 s.
Presentation of new auditory stimuli and fear-memory retention test.
The presentation of novel auditory stimuli and the retention of fear memory were tested 3 weeks after the conditioning. Rats were handled for 2 consecutive days (5 min per day), habituated to a different apparatus from that used for conditioning, and placed in a different room, to avoid fear behavior conditioned to contextual cues (Sacco and Sacchetti, 2010; Cambiaghi et al., 2016). The cage consisted of a transparent plastic cage enclosed within a sound-attenuating box equipped with an exhaust fan, which eliminated odorized air from the enclosure and provided background noise of 60 dB. On day 3, we administered the behavioral test: after 1 min of free exploration, we presented a novel auditory stimulus (frequency, 15 kHz; intervals, 15 and 36 s), which was repeated twice. Three days later, animals were placed back in the same environment and exposed to the CS (frequency, 1 kHz; intervals, 8 and 22 s), which was presented twice.
A subgroup of these conditioned animals was also presented with one “cheese-odor stimulus” (lasting 12 s) delivered through a flow-dilution olfactomer in the same cage. A small group of animals that generalized in the presence of the new tone was also presented with a white noise stimulus (15 s, 36 s interval), presented twice.
A further behavioral group was presented with the 15 and 1 kHz tones before conditioning (naive animals). The following day the same rats were conditioned to the 1 kHz tone and 3 weeks later they were tested as above, to address their discriminative abilities after fear learning.
Therefore, there were as follows: 15 male generalizers and 12 male discriminators for higher-frequency coherence and spectral-density analysis (2 male discriminators and 1 male generalizer with artifacts in 2 s windows used for lower-frequency studies were further excluded); a subgroup of these animals was also tested with the olfactory cues (10 male generalizers; 7 male discriminators) and some of the generalizers were tested with the white noise cue (n = 11); 15 male generalizers and 9 male discriminators for the naive→postconditioning group.
For each trial, we eliminated any animals that lost their electrodes or had artifacts in their recordings. The total number of subjects included was consistent with our past work.
Behavioral analysis
The rats' behavior was recorded by a digital camera and videos were reviewed to determine the duration of “freezing.” The freezing response was used as an index of defensive behavior. Freezing was expressed as the percentage of time during which there was complete absence of somatic mobility, except for respiratory movements. The assessment of freezing was performed by one person blinded to the animal's assignment to a particular experimental group. To classify the extent to which animals differentiate or generalize between the two stimuli, we defined a discrimination score (DS) obtained by dividing the percentage of freezing in response to the CS by the percentage of freezing in response to the new tone (CS/new tone). In our sample, animals that discriminated between stimuli froze to the new stimuli ∼<50% less than to the CS (Likhtik et al., 2014). Therefore, we used a DS = 2 to distinguish generalizers (DS < 2) from discriminators (DS > 2).
Paired and unpaired t tests were used to compare freezing responses toward the cue.
For electromyography (EMG) recordings, unilateral EMG signals were bandpass filtered from 300 to 5000 Hz and imported in Matlab to be rectified. We used a new tone/pretone EMG ratio as function of the change in rats' mobility related to stimulus onset (Steenland and Zhuo, 2009).
Open field.
Rats were tested in an open-field apparatus, consisting of a plastic opaque box (50 × 80 × 40 cm). Rats were placed in the center of the apparatus and behavior was recorded for 8 min. During this time, the LED light (lasting 2 min) was administered every 2 min. The distance travelled and the time spent by the rats during the light-on and light-off conditions in the center or periphery of the arena were analyzed in each 2 min time window. The open-field analyses were conducted using Smart 3.0 software.
In vivo LFPs recordings.
For recording extracellular field potentials in freely behaving rats, stainless steel wires were implanted unilaterally (right hemisphere). Electrodes were formed with stainless steel wires (∅ 150 μm) soldered to a pin. Under deep anesthesia, electrodes were stereotaxically implanted in the PL cortex and Te1 according to the following coordinates: PL cortex: anteroposterior (AP), +3.5 mm; lateral (L), 0.65 mm; ventral (V), 3.6 mm; Te1: AP, −5 mm; L, 7.2 mm; V, 4.2 mm (Paxinos and Watson, 2004); an additional wire implanted in the contralateral hemisphere served as both reference and ground. All implants were secured using dental cement. For EMG recordings, a wire electrode was inserted into the neck muscles and then connected to a pin. After surgery, rats were allowed to recover for 6–7 d before testing. All recordings were performed in a customized Faraday chamber. LFPs were recorded and initially digitalized at 1 kHz and stored on a hard drive for off-line analysis. LFP epochs were visually examined for the presence of artifacts in the analysis windows: 500 ms (higher frequencies) or 2 s (lower frequencies) windows before (prestimulus) and after the stimulus onset (15 kHz tone, CS, odor, white noise).
The coherence between LFP channels was measured by magnitude squared coherence (MSC) using the function mscohere in the Matlab signal processing toolbox, which is a coherence estimate of the input signals x and y using the Welch's averaged, modified periodogram method. Recordings were filtered using a bandpass filter (0.5–300 Hz). The MSC estimate is a function of frequency with values between 0 and 1 and indicates how well x corresponds to y at each frequency. Segments of 500 ms duration were split into three epochs with 50% overlap (Lapish et al., 2012) to evaluate high-beta (20–40 Hz) and gamma frequencies (40–120 Hz), while segments of 2 s (to analyze delta, theta, and low-beta frequencies; 0.5–20 Hz) were split into four epochs with the same 50% overlap. The MSC estimate was calculated with a frequency resolution of 0.5 Hz. To test whether coherence values were significantly higher than those expected by chance, we performed a permutation test with a shuffle procedure in which epochs were randomly shifted by 5–10 s relative to each other. This process was repeated 1000 times to obtain the distribution of coherence expected by chance (Lapish et al., 2012). Difference (Δ) in coherence was obtained by subtraction of coherence values during stimulus presentation and immediately before (stimulus minus prestimulus). Statistics were performed calculating the area under the curve of this Δ coherence within the frequency bands of interest (delta, 0.5–3 Hz; low theta, 3–7 Hz; high theta, 7–12 Hz; low beta, 12–20 Hz; high beta, 20–40 Hz; slow gamma, 40–70 Hz; fast gamma, 70–120 Hz; Likhtik et al., 2014; Cambiaghi et al., 2016).
The power spectral density was performed using the Multitaper method provided by Chronux Matlab (Bokil et al., 2010), and was presented as a relative estimation of the ratio between the LFP power activity after tone onset and pretone (tone/pretone). Specifically, the power activity in each frequency band was divided by the power activity along the total spectrum, resulting in a relative power estimation. The relative power during the tone was then divided by the relative power during pretone (Courtin et al., 2014). For the gamma-band activity, we analyzed 500 ms segments before and during the stimuli onset with a temporal window (TW) of three and five tapers and 100 ms moving windows, overlapped by 50%. Meanwhile, for the delta–theta range, 2 s segments were analyzed using a TW of 1.5 and 3 tapers with moving windows overlapped by 50%. Animals containing artifacts in the 2 s windows around the stimuli were excluded in the low-frequency analysis.
The coherence and Power spectral density (PSD) were compared between generalizers and discriminators using an unpaired t test (see Results).
In vivo multiunit activity recordings.
Multiunit activity (MUA) in Te1 was recorded using six stereotrodes per animal, contained in a 26 gauge stainless steel guide cannula. Stereotrodes were built with tungsten wires ( 12.5 μm) connected to a 16-channel-board (EIB-16). The remaining channels were connected to stainless steel wires ( 150 μm) to record LFP activity in the PFC (two wires) and the left two to EMG recording wires in the neck. Under deep anesthesia, electrodes were stereotaxically implanted according to the above-cited coordinates (Paxinos and Watson, 2004). A silver wire over the frontal areas served as both reference and ground. For recording, an EIB-16 was connected to a headstage, which in turn was connected to a 16-channel preamplifier (gain 100× bandpass filter from 300 Hz to 9 kHz for MUA). Spiking activity and LFPs were digitized at 40 kHz. Spikes above the threshold (30–40 μV) that were clearly distinguishable from background activity were considered as multiunit. Traces with noise or artifacts were visually detected and excluded.
Data were imported into Matlab for analysis. A combination of custom-written scripts and the Circular Statistics Toolbox (Berens, 2009) were used for analyses. The phase of each gamma-filtered (40–70 Hz) sample was extracted from the Hilbert transform, and each spike was assigned the phase of its correspondent field-potential sample. Phase-locking was quantified as the circular concentration of the resulting phase distribution, which was defined as the mean resultant length (MRL) of the phase angles. The MRL is the sum of the unit length vectors representing the phases at which each spike occurred, divided by the number of spikes. It therefore uses values between 0 (no phase-locking) and 1 (perfect phase-locking (Likhtik et al., 2014; Cambiaghi et al., 2016).
For the MUA studies, we obtained nine male discriminator and nine male generalizer animals. For each session we eliminated animals that lost their electrodes, that had artifacts in the recordings, or that had no detectable units. MRL values were compared between generalizers and discriminators by using an unpaired t test (see Results).
Optogenetics.
The adeno-associated virus (AAV5:CaMKIIα::eNpHR3.0-mCherry) was obtained from the University of North Carolina Vector Core. Viral titer was 4.7 × 10¹² vg/ml. The use of CaMKII promoter enabled transgene expression favoring pyramidal neurons. Viruses were housed in a −80°C freezer. For the control, we used the same adeno-associated virus that did not express the halorhodopsin (AAV5:CaMKIIα-mCherry). Injections were performed as follows under deep anesthesia using different stereotaxical coordinates (Paxinos and Watson, 2004) according to the behavioral group, with two injections per side (volume, 0.5 μl each): Te1 injection: (1) AP, −4 mm; L, 6.8 mm; V, 4.8 mm; (2) AP, −5.3 mm; L, 7 mm; V, 4.8 mm; Te3 injection: (1) AP, −4 mm; L, 6.6 mm; V, 7 mm; (2) AP, −5.3 mm; L, 6.8 mm; V, 6.8 mm.
After 2 weeks, animals were conditioned (see above) and, after 2 more weeks, they were implanted with optic fibers (FLAT 200/230-10 mm-Q5) in the region of interest at the following stereotaxical coordinates (Paxinos and Watson, 2004): PL cortex: AP, +3.1 mm; L, 2 mm; V, 4.2 mm; α = 14°; BLA: AP, −2.8 mm; L, 5.4 mm; V, 7.8 mm.
At 5 weeks following the virus injection, rats were handled for habituation for 2 d in the plastic cage described in Behavioral procedures. On day 3, they were presented with two orange LED lights of 620 nm in the absence of any tone. Light passed through optical fiber connectors (1 m length) to reach the brain. The power density estimated at the tip of the optic fiber was 6 mW for illuminating projection sites. The following day, animals were presented with the new 15 kHz tone (15 s, 36 s interval) repeated twice. After 3 h, the same tones were delivered with the LED light on. The light was delivered at 4 s before the stimuli onset and stopped at 4 s after the stimuli offset. After 3 d, animals were tested for fear-memory retention, as previously described, with the presentation of two CSs (frequency, 1 kHz; intervals, 8 and 22 s). After 3 h, the same CSs were delivered with the LED light.
Through these experiments, we collected the following: Te1-PL cortex: 13 AAV5-CaMKIIα:eNpHR3.0-mCherry discriminators; eight AAV5-CaMKIIα: -mCherry discriminators; six AAV5-CaMKIIα:eNpHR3.0-mCherry generalizers; six AAV5-CaMKIIα: -mCherry generalizers; Te3-PL cortex: six AAV5-CaMKIIα:eNpHR3.0-mCherry discriminators; six AAV5-CaMKIIα:eNpHR3.0-mCherry generalizers; Te1-BLA: five AAV5-CaMKIIα:eNpHR3.0-mCherry discriminators; five AAV5-CaMKIIα: -mCherry discriminators; nine AAV5-CaMKIIα:eNpHR3.0-mCherry generalizers; seven AAV5-CaMKIIα: -mCherry generalizers.
For data reproducibility, we eliminated animals with no detectable virus infection, with a too extensive virus infection, or with lesions of the Te1/Te3. Statistics on the optogenetics are described in Statistical summary and Results.
Injection of retrobeads.
Injections of fluorescent retrobeads (volume: 0.4 μl for each side) were performed under deep anesthesia using the following stereotaxical coordinates (Paxinos and Watson, 2004): PL cortex: (1) AP, +2.5 mm; L, 0.6 mm; V, 3.6 mm; (2) AP, +3.5 mm; L, 0.6 mm; V, 3.2 mm.
After 2 weeks, animals were transcardially perfused and fixed brains were cut using a cryostat.
Histology.
Upon completion of experiments, rats were deeply anesthetized and perfused intracardially with 4% PFA. Brains were dissected, stored overnight at 4°C, and finally transferred to 30% sucrose. Coronal sections (50 μm) were cut on a cryostat and collected in PBS.
The needle track in relation to virus injections, optic fibers, and electrode placements were histologically verified at the end of the experiments with Nissl staining, using the conventional procedure and by observing mounted slices in a stereo-microscope equipped with a fluorescent lamp (Hg, 100 W) and a digital camera.
The spread of mCherry-tagged virus from Te3 and Te1 soma to the PL cortex or from the Te1 soma to BLA presynaptic terminals was determined by incubating with a primary monoclonal mouse antibody to mCherry (1:250; Abcam, catalog #ab167453, RRID:AB_2571870) in blocking solution overnight [room temperature (RT)]. Subsequently, sections were washed with PBS and incubated for 2 h at RT with fluorescent Alexa Fluor 568-labeled secondary anti-mouse antibody (1:400; Thermo Fisher Scientific, catalog #A21099, RRID:AB_10055702). To determine the specificity of the mCherry-tagged terminals, we used the primary monoclonal rabbit antibody bassoon (1:1000; Synaptic Systems, catalog #141 016, RRID:AB_2661779) for the synaptic stain, subsequently revealed with fluorescent Alexa Fluor 488 secondary anti-rabbit (1:400; Invitrogen, catalog #A-11094, RRID:AB_221544). Sections were washed in PBS, mounted with mounting media containing DAPI, and placed on a coverslip. The presence of mCherry labeling and the colocalization of mCherry with bassoon were examined by using a Leica SP5 confocal microscope: three lasers were used (488, 520, and 570 nm), corresponding to the peak emission spectrum for DAPI (Nissl stain for cell nuclei), Alexa-Fluor 488 (bassoon), and Alexa-Fluor 568 (mCherry), respectively. Mosaic micrographs of Te1 and Te3 were acquired by using a 20× objective for each single image. Conversely, to visualize terminals in the PL cortex and the amygdala, images were collected at 63× magnification.
The correct placements of virus expression, optic fibers, and electrodes were determined by visual inspection.
Statistical analysis summary
To test the differences between two different groups, we used a Student's two-tailed unpaired t test. To test the differences between two different conditions within the same group, we used a Student's two-tailed paired t test.
To test the between-groups and within-groups differences in the optogenetic experiments with the new 15 kHz tone, we computed a 2 × 3 mixed-design ANOVA model with “group” (Te1-eNpHR3.0-mCherry, Te1-mCherry controls) as the between-subjects variable and “condition” (light-alone, new 15 kHz tone, 15 kHz tone + light) as the within-subjects variable. Where the group × condition interaction was significant, we performed a simple main-effects analysis.
To test the between-groups and within-groups differences in optogenetic experiments with the CS and with the odor, we used a 2 × 3 mixed-design ANOVA with “group” (Te1-eNpHR3.0-mCherry, Te1-mCherry controls) as the between-subjects variable and “condition” (CS, CS + light or odor, odor + light) as the within-subjects variable. Where the group × condition interaction was significant, we performed a simple main-effects analysis. The same analysis was performed to test the between-groups and within-groups differences in freezing responses of animals, with “group” (discriminators, generalizers, naive) as the between-subjects variable and “condition” (15 kHz tone, CS and 15 kHz tone before conditioning, after conditioning) as the within-subjects variable.
To test the between-groups and within-groups differences in optogenetic experiments with the new 15 kHz tone and the CS, we computed a 2 × 4 mixed-design ANOVA model with “group” (Te1-eNpHR3.0-mCherry, Te1-mCherry controls with BLA optic fibers) as the between-subjects variable and “condition” (light-alone, new 15 kHz tone, 15 kHz tone + light, CS) as the within-subjects variable. Where the group × condition interaction was significant, we performed a simple main-effects analysis.
To test the within-group differences of Te3-eNpHR3.0-mCherry-injected animals under different conditions (light-alone, new 15 kHz tone, 15 kHz tone + light, CS), we performed a repeated-measures ANOVA followed by Bonferroni-corrected post hoc multiple comparisons.
The normal distribution of variables was assessed through the Kolmogorov–Smirnov test. For each mixed-design ANOVA and repeated-measures ANOVA, we assessed the sphericity assumption through Mauchly's test of sphericity, and we found no violations.
The null hypothesis was rejected at the p < 0.05 significance level. All statistical analyses were performed using SPSS Statistics 22.
We declare no preregistration of the study.
Results
Te1 and PL cortex activity is tightly synchronized during fear discrimination
First, we investigated the interactions between the Te1 and the PL cortex during fear-discrimination processes. For this purpose, we simultaneously recorded LFPs from these cortices during the presentation of a new sound that may resemble a tone previously paired with an aversive stimulation. First, rats underwent the association between a pure tone of a specific frequency (1 kHz, CS) and a mildly painful foot-shock (US; Fig. 1A). We chose this conditioning procedure (i.e., using a single type of auditory stimulus) because it mimics real-life threatening experiences that occur without fine or prolonged discrimination (Aizenberg and Geffen, 2013; Aizenberg et al., 2015; Resnik and Paz, 2015) and allows the investigation of the neural circuits engaged when animals address new stimuli different from that paired with a painful experience. Rats were then presented with a new tone and subsequently with the CS at 3 weeks after training (Fig. 1A), to study the long-term processes that underlie fear-discrimination and memory-expression phenomena. At this long-term time interval, we observed that the presentation of a new tone with a frequency of 15 kHz was accompanied by a marked individual variability, with some animals displaying enhanced freezing to the new tone, indicating generalization of fear, and others that did not show any defensive behavior, suggesting that they were able to differentiate between the new tone and the CS (Fig. 1A). To classify the extent to which animals differentiate or generalize between the two different stimuli, we defined a DS obtained by dividing the percentage of freezing to the CS by the percentage of freezing to the new tone. In our sample, animals that discriminated between stimuli froze to the new stimulus ∼<50% less than to the CS (Fig. 1A; Likhtik et al., 2014). Therefore, we used a DS = 2 to distinguish generalizer (DS <2) from discriminator (DS >2). By applying this criterion in the following group, we found that among 27 rats, 12 were discriminators and 15 were generalizers. Animals in both groups were equally likely to freeze to the CS (unpaired t test, t(25) = 1.05, p = 0.30; Fig. 1A).
Figure 1.
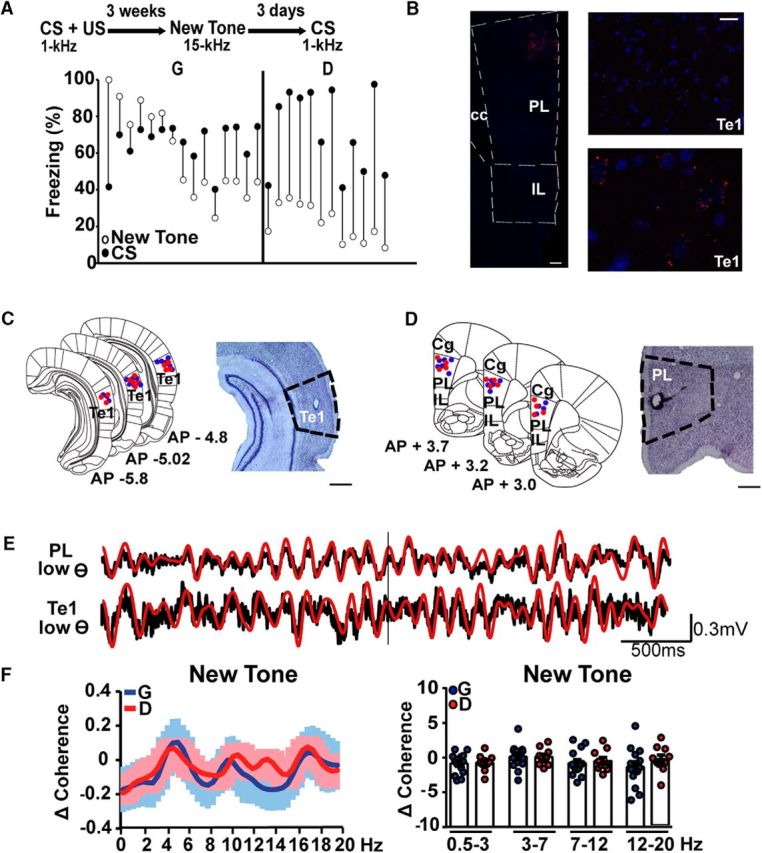
Te1 projects to the PL cortical area. A, Diagram of experiments. The different behavioral response elicited by the new tone and the CS (CS/New Tone) allowed us to establish DS = 2 to divide rats into generalizers and discriminators. B, A mosaic representation of injection of retrobeads into the PL cortex and consequent detection of the beads in the Te1. Scale bars: left, 250 μm; right, 25 μm. C, D, Representative histology of electrode implants in discriminator and generalizer rats in the Te1 (C) and PL cortex (D) and relative Nissl staining of the tracks. Scale bars, 500 μm. E, Example of raw and theta-filtered (3–7 Hz) neural activity recorded in the PL cortex and Te1 before and during the presentation of the new 15 kHz tone. F, Differences in the Te1–PL cortex coherence (new tone minus pretone) were similar in a subgroup of the previous discriminator and generalizer rats in the lower frequency ranges. All coherences are expressed as stimulus minus prestimulus (Δ Coherence). Data are presented as the mean curve or dots representing the area under the curve for each animal. All data are mean ± SEM. Animals containing artifacts in the 2 s windows around the stimuli were excluded in the low-frequency analysis.
We then investigated whether and how the Te1 and the PL cortex interact in the course of fear-discrimination and fear-memory expression processes. First, we addressed the issue of whether these two cortices were anatomically interconnected in adult male rats. In fact, there are clear anatomical demonstrations that the PL cortex sends direct inputs to the Te1 (Van Eden et al., 1992; Paxinos and Watson, 2004; Gao et al., 2017). Meanwhile, some evidence indicates that the Te1 sends direct projections to the PL cortex (Van Eden et al., 1992; Paxinos and Watson, 2004), but other studies suggest no direct connectivity (Condé et al., 1995; Hoover and Vertes, 2007). To address this issue, we injected a retrograde tracer (retrobeads) into the PL cortex. Figure 1B shows several labeled cells specifically within the Te1, thereby supporting the view that the Te1 sends direct anatomical projections to the PL cortex (see below for a further demonstration of this through anterograde viral administration).
We then recorded LFPs from the PL cortex and the Te1 (Fig. 1C–E) of both generalizer and discriminator rats immediately before and during the presentation of the new tone, and we used coherence to measure interarea synchronous activity (Fritz et al., 2010; Likhtik et al., 2014; Stujenske et al., 2014; Cambiaghi et al., 2016). Coherence was analyzed at slow frequencies in the theta range because previous studies have shown that the PL cortex interacts with the BLA during fear and safety processes in this band (Likhtik et al., 2014; Karalis et al., 2016). In line with our previous study (Cambiaghi et al., 2016), this analysis was performed during the 2 s that preceded tone delivery and during the first 2 s of the new tone. However, we found that generalizer (n = 14) and discriminator (n = 10) animals displayed similar coherence levels in the slow-theta (3–7 Hz; unpaired t test, t(22) = 0.09, p = 0.92) and high-theta (7–12 Hz; unpaired t test, t(22) = 0.45, p = 0.65) ranges (Fig. 1E,F). Furthermore, no differences were detected in the delta (0.5–3 Hz; unpaired t test, t(22) = 0.19, p = 0.84) or low-beta (12–20 Hz; unpaired t test, t(22) = 1.09, p = 0.28) frequencies (Fig. 1F). These data suggest that the activities of the PL cortex and the Te1 were not synchronized at low frequencies in either the discriminator or the generalizer animals.
We then analyzed interarea coherence in the gamma-frequency band (Fig. 2A,B). For this purpose, we restricted our analysis to the initial 500 ms at the onset of the new tone (Dejean et al., 2016). By comparing changes in the slow-gamma (40–70 Hz) coherence in discriminator (n = 12) and generalizer (n = 15) rats, we found significant differences in the 40–70 Hz range (unpaired t test, t(25) = 4.43, p = 0.0002), but not in the 70–120 Hz range (unpaired t test, t(25) = 0.52, p = 0.60; Fig. 2B). These results can be explained by the fact that discriminator rats showed an increase in the slow-gamma coherence during the initial 500 ms of the new tone presentation compared with the 500 ms time period preceding the tone (paired t test, t(11) = 4.39, p = 0.0011; Fig. 2C). Conversely, generalizer animals did not show any significant changes in gamma coherence between pretone and tone delivery (paired t test, t(14) = 0.47, p = 0.63; Fig. 2D). Moreover, in both groups of animals there was no increase at higher gamma frequencies (70–120 Hz; Fig. 2B–D). These data demonstrated that the activities of the Te1 and the PL cortex were tightly synchronized in animals that identified the new tone as less dangerous, while this did not occur in animals that generalized fear to the new tone.
Figure 2.
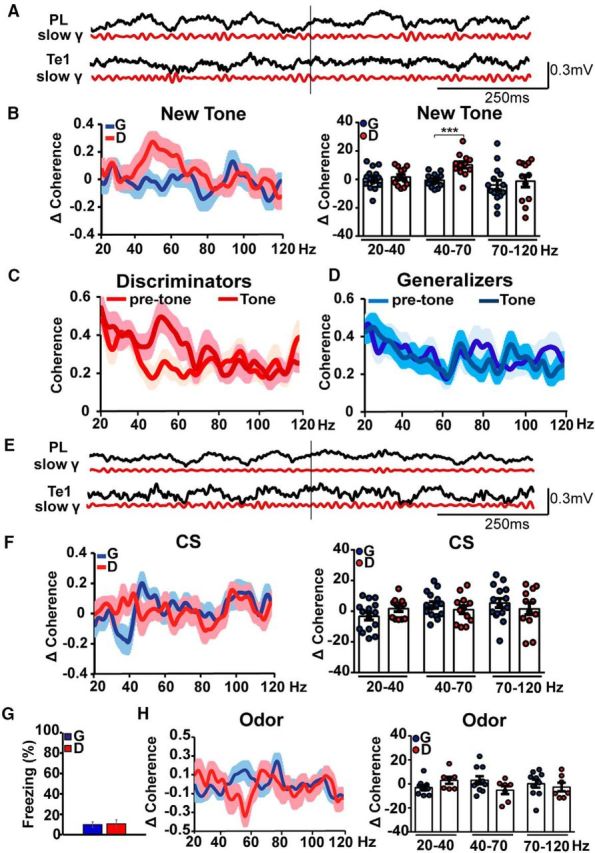
Discriminator rats exhibited an enhanced coherence between the Te1 and the PL cortex in the slow-gamma band. A, Raw and gamma-filtered (40–70 Hz) activity recorded in the PL cortex and the Te1 before and during presentation of the new tone. B, Discriminator animals displayed significantly higher Te1–PL cortex coherence (new tone minus pretone) than generalizer rats in the 40–70 frequency band but not in the other ranges. C, D, In discriminator rats, slow-gamma coherence increased during the 500 ms of the new tone onset, relative to the pretone activity, while in generalizer rats, there was no change. E, Raw and gamma-filtered (40–70 Hz) neural activity recorded in the PL cortex and the Te1 before and during the presentation of the CS. F, The PL cortex and Te1 coherences (CS minus pre-CS) were similar in generalizers and discriminators for each frequency band. G, Freezing responses during presentation of an olfactory stimulus in a subgroup of generalizer and discriminator rats. H, Presentation of the odor did not result in a change in Te1–PL cortex coherence. All coherences are expressed as stimulus minus prestimulus (Δ Coherence). Data are presented as the mean curve or dots representing the area under the curve for each animal. ***p < 0.001. All data are mean ± SEM.
We then investigated whether this enhanced synchronization was also present in discriminator animals during the presentation of the CS (Fig. 2E,F) or, alternatively, if it only occurred when animals were presented with a new tone and evaluated it as less dangerous. In the same animals, 3 d after the new-tone presentation, we administered the CS. Coherence in the gamma range was similar between generalizers (n = 15) and discriminators (n = 12; 40–70 Hz; unpaired t test, t(25) = 0.90, p = 0.37; 70–120 Hz; unpaired t test, t(25) = 0.78, p = 0.43; Fig. 2F). Similar results were obtained when coherence in the theta band was analyzed (3–7 Hz; unpaired t test, t(22) = 0.18, p = 0.85; 7–12 Hz; unpaired t test, t(22) = 0.20, p = 0.84, data not shown). Together, these data showed that the activities of the Te1 and the PL cortex only became highly synchronized in the slow-gamma range when animals were exposed to a new stimulus and evaluated it as less dangerous, whereas this functional interplay was absent in the same animals during CS presentation.
An alternative explanation of the observed difference between generalizers and discriminators, however, could be related to the different behavior displayed during the new-tone presentation by the generalizer (i.e., freezing) versus the discriminator (exploration) rats. To distinguish between these possibilities, we analyzed Te1–PL cortex coherence in a subgroup of the previous generalizer (n = 10) and discriminator (n = 7) animals during the presentation of an olfactory stimulus never experienced before. Although all the conditioned animals displayed a low of freezing to the new odor (unpaired t test, t(15) = 0.15, p = 0.87; Fig. 2G), thus showing fear discrimination, Te1–PL cortex slow-gamma coherence was low in both groups (40–70 Hz; unpaired t test, t(15) = 1.71, p = 0.10; Fig. 2H). These data confirmed that the increase in gamma coherence, when present, was not related to a low freezing response and occurred specifically in the PL cortex–Te1 pathway when animals evaluated a sound as less dangerous.
Slow-gamma coherence is related to the local activity
LFP analysis cannot determine whether the long-range synchrony detected in discriminator animals was mediated by direct connections between the Te1 and the PL cortex or by intermediate sites. To address this issue, we tested whether the local spiking activity in the Te1 was locked with the LFP slow-gamma oscillations in the PL cortex. We recorded MUA in the Te1 and the LFP in the PL cortex during the new-tone presentation (Fig. 3A–C). By using the MRL statistic, a measure of circular concentration (Likhtik et al., 2014; Cambiaghi et al., 2016), we found that, in discriminators (n = 9), compared to generalizers, Te1 spikes were better phase-locked to the ongoing PL cortex slow-gamma (40–70 Hz) frequency and tended to occur more frequently near the trough of the PL cortex gamma-filtered oscillations (n = 9; Fig. 3D,E). The MRL fold-change of Te1 MUA was significantly different between discriminator and generalizer rats (unpaired t test, t(16) = 2.33, p = 0.03; Fig. 3D). These findings are consistent with the coherence data, reinforcing the notion that the Te1 and the PL cortex work together to dynamically evaluate new stimuli.
Figure 3.
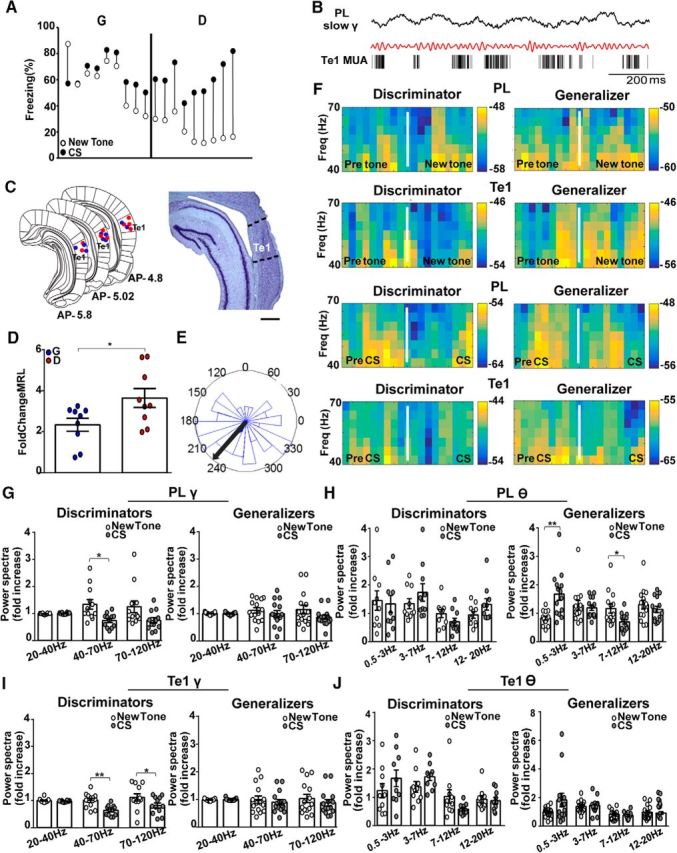
In discriminators, the new tone induces a phase-locking of Te1 MUA to PL cortex gamma oscillations. A, Different freezing responses elicited by the new tone and the CS in animals implanted with multiunit electrodes allowed us to divide them into generalizers (DS < 2) and discriminators (DS > 2). B, An example of the raw and gamma-filtered (40–70 Hz) LFP recorded in the PL cortex and MUA in the Te1 of a representative discriminator rat. C, Representative histology of MUA tracks and relative Nissl staining. Scale bar, 500 μm. D, Fold-change (new tone/pretone) in the strength of MUA phase-locking is significantly higher in discriminator rats than in generalizer rats. E, Distribution and mean (black arrow) of gamma phases in the LFP oscillation for discriminator animals. F, Representative spectrograms of PL cortex and Te1 slow-gamma activity in a discriminator and a generalizer rat before and during presentation of the new 15 kHz tone and the CS. G–L, In the power spectra of discriminator animals there was an increase in the slow-gamma (40–70 Hz) range in the PL cortex, but not in the high-beta (20–40 Hz) or high-gamma (70–120 Hz) ranges during presentation of the new 15 kHz tone (new tone/pretone) compared with the activity during the CS (CS/pre-CS). In generalizers, the PL cortex did not change in activity during presentation of the new tone compared with the activity during the CS at any frequency range. In the Te1, there was an increase in the slow-gamma (40–70 Hz) and high-gamma (70–120 Hz) ranges in discriminators during presentation of the new tone compared with the activity during the CS. In generalizers, the Te1 did not change in activity between the tones. The range of lower frequencies (0.5–20 Hz) only showed an increase in PL cortex activity of generalizers in the delta and high-theta bands. *p < 0.05, **p < 0.01. All data are mean ± SEM. Spectral power and MRL are expressed as the ratio between the stimulus and prestimulus. Power spectral analysis performed on the same rats as in Figure 1. Animals containing artifacts in the 2 s windows around the stimuli were excluded in the low frequencies analysis.
We then investigated whether and how the local activity within the PL cortex and the Te1 may be different between discriminator and generalizer rats (Fig. 3F–L). We analyzed the relative power by dividing the amplitude within each frequency band by the amplitude of the total spectrum (0.5–120 Hz; Courtin et al., 2014). In the low-gamma band, the presentation of the new tone was accompanied by enhanced gamma activity relative to the CS in both cortices of discriminators (n = 12; PL cortex: 40–70 Hz, paired t test, t(11) = 2.66, p = 0.02; Te1: 40–70 Hz, paired t test, t(11) = 4.17, p = 0.001) but not in generalizer animals (n = 15; PL cortex: 40–70 Hz, paired t test, t(14) = 0.75, p = 0.46; Te1: 40–70 Hz, paired t test, t(14) = 0.59, p = 0.55; Fig. 3G,I). These data showed that, in discriminators, the enhanced Te1–PL cortex long-range connectivity was associated with an increase in the local slow-gamma activity in both sites during new-tone versus CS presentation.
Te1–PL cortex slow-gamma synchrony drives fear discrimination
At this point, our data were only correlative and did not determine whether the observed enhanced gamma coherence simply correlated with the fear-discrimination process or actually contributed to the animals' decisions regarding the new stimuli, playing a causal role in the fear-discrimination process. To address this issue, we precisely scored the behavior that the animals displayed during the initial 500 ms of the new tone (Fig. 4A). To do this, we measured dorsal neck EMG (Steenland and Zhuo, 2009) and found that the behavior of the discriminators (n = 8) and generalizers (n = 10) was similar during this early time interval (unpaired t test, t(16) = 0.01, p = 0.99; Fig. 4A). We then analyzed the relationship between the gamma coherence during the same 500 ms of the new tone and the EMG, but did not detect any correlation between the two measures (Pearson's correlation, p = 0.60; Fig. 4A). This result further supports the idea that the different levels of Te1–PL cortex coherence detected during the initial 500 ms of the new tone were not related to the different animal behavior displayed by generalizers and discriminators. We then investigated whether these coherence levels may have conversely predicted the behavior that the animals displayed later during the entire first tone presentation (Fig. 4B). During this period, the EMG significantly differed between discriminators and generalizers (unpaired t test, t(16) = 3.06, p = 0.007). Visual inspection performed by a blind experimenter confirmed the behavioral similarity between EMG and hand-scored analysis (Pearson's correlation 15 s, p = 0.010, data not shown). We then examined the relationship between the coherence detected during the initial 500 ms with this measure, and we found a significant correlation (Pearson's correlation, p = 0.03; Fig. 4B). Similar results were obtained by plotting the same coherence levels with the EMG analysis of the behavior displayed during the overall tone presentation (Pearson's correlation, p = 0.04; EMG during overall tones: unpaired t test, t(16) = 4.56, p = 0.0003; Fig. 4C). The EMG and the hand-scored behavior again were similar in this period (Pearson's correlation 66 s, p = 0.006, data not shown). These data showed that the levels of synchrony between the Te1 and the PL cortex did not correlate with the behavior of animals during the initial 500 ms but, instead, accurately predicted the future behavior that the animals displayed. Thus, this interarea connectivity represented an accurate predictor of the animals' behavioral choice (safe vs dangerous).
Figure 4.

The Te1–PL cortex slow-gamma coherence at the new-tone onset predicts the animals' behavioral outcome. A, The Te1–PL cortex coherence (new tone minus pretone) in the slow-gamma band did not correlate with the behavior of the animals during the initial 500 ms of the tone. In this time window, EMGs (right dots) for the two groups were similar. B, During the entire first new tone (15 s), EMGs were significantly different between generalizers and discriminators (right dots) and the Te1–PL cortex coherence correlated with this measure. C, EMGs were also different during the overall two tones (right dots) and again Te1–PL cortex coherence correlated with this measure. D–G, Conversely, the power activity (new tone/pretone) of the PL cortex and Te1 in the slow-gamma band and in the low-theta band did not correlate with the animals' behavior. *p < 0.05, **p < 0.01, ***p < 0.001. All coherence data are presented as Δ coherence of the area under the curve. EMGs are presented as ratios (new tone/pretone).
We then investigated whether changes in the local activity of either the Te1 and/or the PL cortex may have also predicted the behavioral choice of the rats, as we observed for the Te1–PL cortex coherence. We plotted the slow-gamma activity of discriminator (n = 8) and generalizer (n = 10) rats against the EMG recorded during the entirety of the first tone presentation, but we did not find any significant correlations (Pearson's correlation, PL cortex, p = 0.58; Te1, p = 0.86; Fig. 4D,E). There were also no correlations detected by plotting the low-theta activity against the EMG relative to the first tone (PL cortex, p = 0.23; Te1, p = 0.17; Fig. 4F,G) or by plotting slow-gamma (PL cortex, p = 0.67; Te1, p = 0.90) or low-theta (PL cortex, p = 0.48; Te1, p = 0.33) power activity against the EMG during the overall presentation of the two tones (data not shown). Thus, the animals' behavior in the presence of new stimuli mostly arises by the interaction between different neural sites rather than being imposed by the local activity of a specific brain structure.
Te1–PL cortex synchrony is highly specific to the fear-discrimination process
Our data raise the question of the role played by the gamma synchrony. Is the Te1–PL cortex connectivity specific to the fear-discrimination process, or is it involved more broadly in sensory stimuli discrimination? Furthermore, is this enhanced connectivity already present before fear learning in discriminator animals, or does it occur specifically for fear discrimination? To investigate these issues, we analyzed Te1–PL cortex synchrony in naive animals presented with 15 and 1 kHz tones that had never been paired with aversive stimuli. Subsequently, the 1 kHz tone was paired with a US, and we then tested the discriminative processes between the 15 and 1 kHz tones as in the above experiments (Fig. 5A). In line with our findings, the presentation of the 15 kHz tone after fear conditioning was associated with different behaviors (no freezing or freezing; Fig. 5B; 2 × 2 mixed-design ANOVA, main effect of group: F(1,22) = 53.22, p < 0.001, main effect of condition: F(1,22) = 69.97, p < 0.001, group × condition interaction F(1,22) = 25.35, p < 0.001). Simple main-effect analysis indicated a significant difference between groups after conditioning (F(1,22) = 79.92, p < 0.001) but not before (F(1,22) = 0.55, p = 0.46), and a significant difference within the same group before and after fear learning (generalizers, n = 15, p < 0.001; discriminators, n = 9, p = 0.46). Moreover, after fear conditioning, rats also exhibited a different Te1–PL cortex synchrony (unpaired t test, t(22) = 3.06, p = 0.005; Fig. 5D). However, the presentation of the 15 kHz tone in the same animals before auditory fear conditioning was not associated with a similar enhanced coherence (unpaired t test, t(22) = 0.16, p = 0.87; Fig. 5C). More precisely, in discriminator rats (n = 9), the slow-gamma coherence during the presentation of the 15 kHz tone was lower before and significantly higher after fear learning (paired t test, t(8) = 3.11, p = 0.01; Fig. 5E). In generalizers (n = 15), gamma coherence remained similar before and after fear learning (paired t test, t(14) = 0.92, p = 0.37; Fig. 5E). These findings showed that Te1–PL cortex functional connectivity was in general not related to sensory stimuli discrimination, but could be specifically related to distinguishing new stimuli from previously threatening ones. These results also suggested that the enhanced Te1–PL cortex functional connectivity was not intrinsically present in discriminator animals, raising the possibility that this long-range connectivity may also be present in the previously classified “generalizer” animals in cases where they display fear-discriminative processes. Previous studies have shown that almost all animals can discriminate between a harmful pure tone and a white-noise stimulus (Kaouane et al., 2012). We therefore tested whether the previously classified “generalizer” animals would also effectively discriminate between a white-noise stimulus and the CS and whether, in this case, these animals would display enhanced Te1–PL cortex gamma synchrony. In the presence of a white-noise stimulus, the previously classified “generalizer” rats (n = 11) showed discriminative processes, as revealed by low defensive behaviors (paired t test, t(10) = 4.93, p = 0.0006; Fig. 5F). During the first 500 ms of the white noise, these rats displayed enhanced connectivity between the Te1 and PL cortex in the slow-gamma range (unpaired t test, t(10) = 2.69, p = 0.02; Fig. 5G). These data showed that the Te1 and PL cortex may dynamically establish a functional connection in all animals and, when this process occurred, animals displayed a fear-discrimination process.
Figure 5.

Boundary condition of the Te1–PL cortex long-range connectivity. A, Diagram of the experiment. Naive animals were presented with a 15 kHz tone and after 6 h with a 1 kHz tone, before conditioning. After 1 d, the same rats underwent CS–US association, using the 1 kHz tone as a CS. After 3 weeks, rats were tested to address their behavior toward the 15 kHz tone and the CS. B, Freezing responses during presentation of the 15 kHz tone in generalizers and discriminators before and after fear learning. After fear conditioning, generalizers showed a higher increase in the freezing response to the same tone compared with discriminators (left); different freezing responses to the new tone and the CS allowed us to divide postconditioned animals into generalizers and discriminators (right). C, Δ Coherence (mean curve, right; dot areas, left) in naive animal exposed to the new 15 kHz tone before fear conditioning. Subsequently, animals were divided into generalizers and discriminators. In the naive condition, all animals exhibited similar slow-gamma Te1–PL cortex coherence levels (new tone minus pretone). D, After conditioning, Te1–PL cortex enhanced connectivity was detected in discriminator but not generalizer rats. E, In discriminators, Δ coherence was higher after conditioning, while in generalizers we did not find any significant changes. Dots representing the coherence values for naive → discriminator rats are more evident in the right part of the figure. F, Generalizer rats displayed less frequent freezing when presented with a white-noise stimulus. G, These animals showed an enhanced Te1–PL cortex gamma synchronization compared with that exhibited during the 15 kHz tone. All coherences are expressed as stimulus minus prestimulus (Δ Coherence) and presented as the mean curve and area-under-the-curve dots for each animal. **p < 0.01, ***p < 0.001. All data are mean and SEM.
Direct projections from the Te1 to the PL cortex are necessary for fear discrimination
We then investigated whether direct connections between the Te1 and the PL cortex were absolutely necessary for fear-discrimination processes. To address this, we injected the AAV5-CaMKIIα:eNpHR3.0-mCherry virus expressing the inhibitory halorhodopsin eNpHR3.0 conjugated to a fluorescent mCherry reporter under the CaMKII promoter into the Te1 to express the halorhodopsin channel specifically in pyramidal cortical neurons. Control animals received the AAV5:CaMKIIα-mCherry virus that did not express the halorhodopsin (Fig. 6A–D). In line with previous anatomical tracing studies (Van Eden et al., 1992; Paxinos and Watson, 2004), by using anti-mCherry and anti-bassoon antibodies, we detected labeled Te1 terminals in the PL cortex (Fig. 6A). To define the extension of the infection, we characterized different Te1 sections, resulting in a convincing and limited spreading of the virus (Fig. 6B), with only some sparse cells found toward the Te3 boundaries. Infected rats underwent auditory fear conditioning and, 2 weeks later, were implanted with optical fibers immediately above the PL cortex. After 1 week, rats were presented with a 15 kHz new tone, and freezing was measured as an index of defensive behavior (Fig. 6E). Discriminator and generalizer animals were classified according to the previously described experiments (Fig. 5E–G). At 3 h after the presentation of the 15 kHz tone, animals were represented with this tone during optogenetic inhibition of Te1 terminals. In discriminators (n = 13), delivery of light caused a significant increase in freezing to the new tone in AAV5-CaMKIIα:eNpHR3.0-mCherry animals but not in control rats, nor on the day before the new tone presentation (n = 8; 2 × 3 mixed-design ANOVA, main effect of group: F(1,19) = 17.12, p = 0.001, main effect of condition: F(2,38) = 82.52, p < 0.001, group × condition interaction: F(2,38) = 37.41, p < 0.001; Fig. 6F). No effects were detected in generalizer animals (n = 6 eNpHR3.0-mCherry; n = 6 ctrl; 2 × 3 mixed-design ANOVA, main effect of group: F(1,10) = 2.18, p = 0.17; main effect of condition: F(2,20) = 103.14, p < 0.001; group × condition interaction: F(2,20) = 1.45, p = 0.25; Fig. 6G). In these animals, we can rule out the possibility of a ceiling effect masking the enhancement of the freezing response, as this behavioral response was 71% when the light was on. Together, these data showed that optogenetic inactivation of Te1→ PL cortex connections impaired the animals' ability to discriminate between a new tone and a previously threatening one, thereby shifting discrimination to generalized fear.
Figure 6.
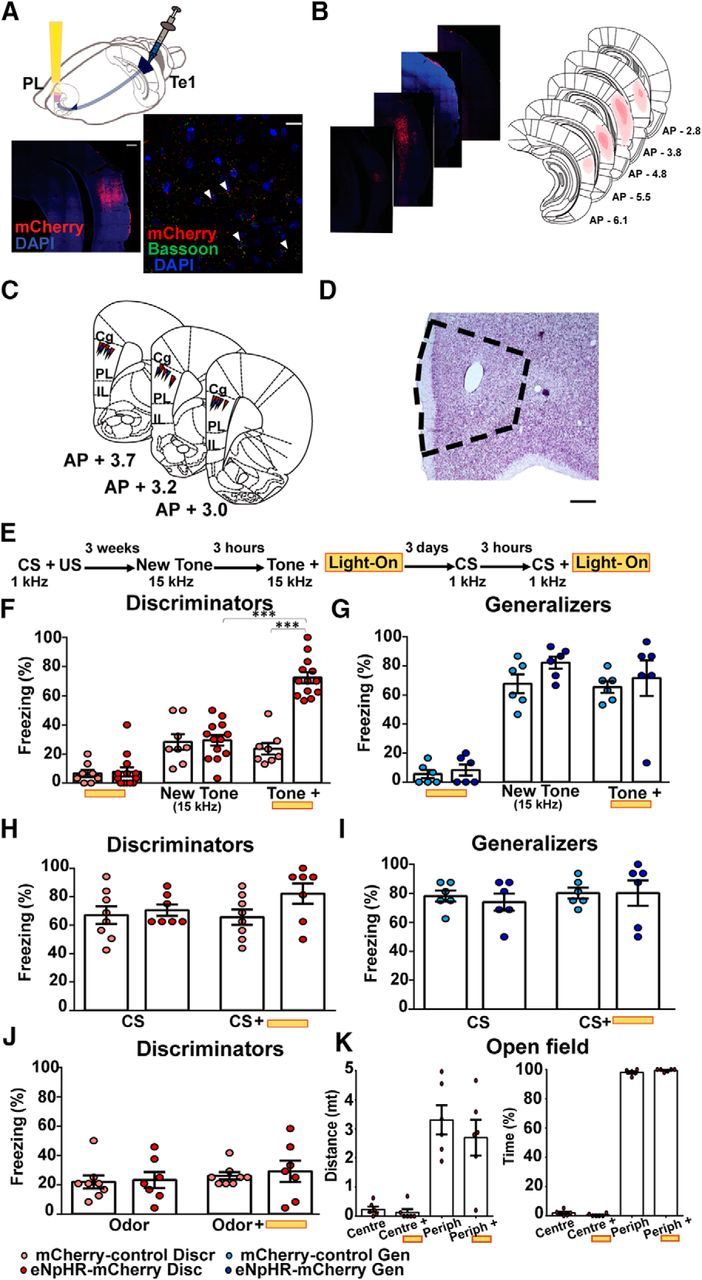
Optogenetic inhibition of Te1→ PL cortex axons caused fear generalization. A, Schematic representation of virus injections in the Te1 (AAV5-CaMKIIα:eNpHR3.0-mCherry or control AAV5-CaMKIIα-mCherry) and optic fibers implanted in the PL cortex. The anti-mCherry antibody revealed a specific injection in the Te1 and the colocalization between mCherry and the synaptic protein bassoon-specific Te1→ PL cortex labeled terminals. Scale bars: 500 and 25 μm. B, Virus infection of the Te1 of a representative rat (left) and atlas reconstruction of the minimal and maximal spreading of the virus along different stereotaxical coordinates (right). C, D, Schematic representation of the optic fiber tracks in the PL cortex and relative Nissl staining. Scale bar, 500 μm. E, Experimental design for the optogenetic experiments. F, eNpHR3.0-mCherry and mCherry discriminator rats showed low levels of freezing to the new 15 kHz tone. When the same tone was delivered during optogenetic inhibition of Te1 terminals, eNpHR3.0-mCherry rats showed an increase in the freezing response. G, Generalizer rats exhibited similar level of freezing during the optogenetic inhibition and not. H, I, During CS presentation, discriminators and generalizers exhibited high rates of freezing, and optogenetic manipulation did not affect conditioned freezing. J, Optogenetic manipulations did not affect fear-odor discrimination. K, A subgroup of discriminators was tested in the open-field apparatus. Animals spent most time in the periphery either during light-on and light-off conditions. ***p < 0.001. All data are mean and SEM.
We then investigated whether auditory information from the Te1 to the PL cortex was necessary for the detection of the CS, and we found that optogenetic inhibition of Te1 terminals did not modify defensive responses to the CS in either discriminators (n = 7 eNpHR3.0-mCherry; n = 8 ctrl; 2 × 2 mixed-design ANOVA, main effect of group: F(1,13) = 1.76, p = 0.2; main effect of condition: F(1,13) = 2.21, p = 0.16; group × condition interaction: F(1,13) = 3.66, p = 0.07;) or generalizers (n = 6 eNpHR3.0-mCherry; n = 6 ctrl; 2 × 2 mixed-design ANOVA, main effect of group: F(1,10) = 0.69, p = 0.79; main effect of condition: F(1,10) = 2.28, p = 0.16; group × condition interaction: F(1,10) = 0.57, p = 0.46; Fig. 6H,I), thus showing that axons from the Te1 to PL cortex are necessary for fear discrimination but not for fear-memory expression. The latter result also suggested that optogenetic manipulation did not interfere with the expression of fear-related behavior. To better address this point, we optogenetically inhibited Te1→PL cortex terminals during the exploration of an open field, a paradigm largely used to analyze innate anxiety and defensive behaviors. No significant effects were detected in discriminator animals (n = 6; center-distance: paired t test, t(5) = 0.94, p > 0.38, center-time: paired t test, t(5) = 1.90, p = 0.11; periphery-distance: paired t test, t(5) = 1.13, p = 0.30; center-time: paired t test, t(5) = 1.95, p = 0.11; Fig. 6K). As previous studies showed that activity of the PL cortex is necessary for fear-memory expression (Corcoran and Quirk, 2007; Do Monte et al., 2016), as well as for regulating innate fear in the open field (Likhtik et al., 2014; Stujenske et al., 2014; Padilla-Coreano et al., 2016), our findings allowed us to exclude the possibility that our optogenetic Te1→ PL cortex manipulation affected the overall activity of the PL cortex. To further control for the specificity of our manipulations, we repeated the optogenetic manipulation in discriminator rats (n = 7 eNpHR3.0-mCherry; n = 8 ctrl) presented with a novel odor. In this situation, the auditory information carried by the Te1 axons was not necessary, while the PL cortex was still required (Portero-Tresserra et al., 2013). The optogenetic manipulations did not affect this odor-discrimination task (2 × 2 mixed-design ANOVA, main effect of group: F(1,13) = 0.12, p = 0.73; main effect of condition: F(1,13) = 2.81, p = 0.11; group × condition interaction: F(1,13) = 0.08, p = 0.77; Fig. 6J), further supporting the idea that activity of the PL cortex was not affected overall by our optogenetic procedure.
To confirm that our results were due to the inhibition of axons arriving specifically from the Te1, we repeated our experiments in animals injected with the AAV5-CaMKIIα:eNpHR3.0-mCherry virus into the tertiary auditory cortex Te3, which is adjacent to the Te1 and also sends information to the PL cortex (Paxinos and Watson, 2004; Van Eden et al., 1992; Fig. 7A). The light delivery, together with the new tone presentation, did not exert any effects on discriminator rats (n = 6; repeated-measures ANOVA, main effect of condition: F(3,25) = 120.99, p < 0.001; Bonferroni-corrected post hoc multiple comparisons indicated a significant difference only between light-alone with respect to the other three conditions: p = 0.01 in all cases, as well as a significant difference between CS and the other three conditions: p = 0.01 in all cases; Fig. 7B; no differences were evident between the new 15 kHz tone and 15 kHz tone + light-on: p = 0.99); no effects were detected in generalizers (Fig. 7C; n = 6; repeated-measures ANOVA, main effect of condition: F(3,15) = 16.27, p < 0.001; Bonferroni-corrected post hoc multiple comparisons indicated a significant difference between light-alone condition with respect to the other three conditions: p < 0.05 in all cases; but there were no differences between these last three conditions: p > 0.05 in each comparison).
Figure 7.
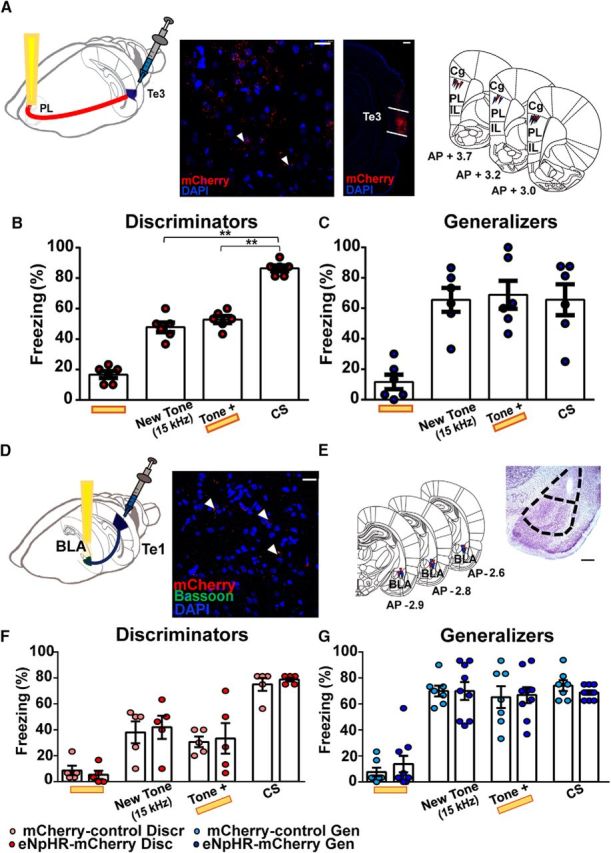
Fear discrimination is restricted to the Te1–PL cortex pathway. A, Schematic representation of the AAV5:CaMKIIα:eNpHR3.0-mCherry injection in the Te3 and optic fiber implant in the PL cortex region (left); spreading of the virus into the Te3 and Te3 axon terminals into the PL cortex, as revealed by mCherry immunostaining and relative fiber tracks (right). Scale bars: larger image, 500 μm; smaller image, 25 μm. B, Discriminator animals showed a low rate of freezing to the new 15 kHz tone alone and to the 15 kHz tone delivered with the light on, while freezing to CS was significantly more likely with respect to the previous conditions. No differences were evident between the new 15 kHz tone and 15 kHz tone + light-on. C, Generalizer animals showed an increase in the freezing response during presentation of the new 15 kHz tone, the 15 kHz tone delivered with the light on, and CS. D, Schematic representation of the AAV5:CaMKIIα:eNpHR3.0-mCherry injection in the Te1 and optic fiber implant in the BLA region (left). Colocalization of mCherry and the synaptic protein bassoon at Te1 axon terminals into the BLA (right). Scale bar, 25 μm. E, Representative histology of optic fibers tracks in the BLA with relative Nissl staining. Scale bar, 500 μm. F, eNpHR3.0-mCherry and mCherry discriminators did not differ in all conditions, both exhibiting only an increase in the freezing response to the CS. G, No effects were observed in the generalizers. **p < 0.01. All data are mean ± SEM.
The Te1 also sends axons to other regions involved in fear discrimination, such as the BLA. Although most of the auditory cortical projections into the BLA are from higher-order auditory cortices and the perirhinal cortex (Romanski and LeDoux, 1993), a few Te1 terminals can also be detected in the BLA (Romanski and LeDoux, 1993). Therefore, we tested whether, in addition to direct projections from the Te1 to the PL cortex, direct connections from the Te1 to the BLA were necessary for fear discrimination. Experiments were performed as described above, except that the optical fibers were targeted above the BLA (Fig. 7D,E). No significant effects were detected in the discriminator (n = 5 eNpHR3.0-mCherry; n = 5 ctrl; 2 × 4 mixed-design ANOVA main effect of group: F(1,8) = 0.12 p = 0.73; main effect of condition: F(3,24) = 39.48, p < 0.001; group × condition interaction: F(3,24) = 0.13, p = 0.93; Fig. 7F) or generalizer animals (n = 9 eNpHR3.0-mCherry; n = 7 ctrl; 2 × 4 mixed-design ANOVA main effect of group: F(1,14) = 0.02, p = 0.87; main effect of condition: F(3,42) = 50.97, p < 0.001; group × condition interaction: F(3,42) = 0.33, p = 0.80; Fig. 7G). Collectively, these data demonstrated that direct projections from the Te1 to the PL cortex, but not to the BLA, were necessary for fear-discrimination processes and that, in the absence of this connectivity, animals displayed generalized fear. Conversely, these connections were dispensable for fear-memory expression.
Discussion
Most studies have shown that the prelimbic region of the mPFC (PL cortex) is necessary for regulating the expression of fear memories (Do Monte et al., 2016; Karalis et al., 2016), as well as for inhibiting fear during extinction and discrimination processes (Likhtik et al., 2014; Stujenske et al., 2014). In the present study, we showed that the PL cortex requires inputs from the Te1 to infer safety. This long-range interaction occurs through synchronization of the cortical activity, specifically in the slow-gamma band. These data show for the first time that the prefrontal and auditory cortex interact to successfully differentiate between new stimuli and threatening ones, and have provided new information on the mechanisms and functions of this interplay.
Te1–PL cortex enhanced synchrony precedes and predicts the animals' behavioral choice
The enhanced synchrony between the Te1 and the PL cortex was already established within the initial 500 ms of the first new tone. During this period, the overt behavior of the generalizer and discriminator animals was similar. These data suggest that the functional Te1–PL cortex interaction was not a mere reflection of the animals' behavior. Then, during the entirety of the new tone (15 s) and the entirety of the two tones, the two groups markedly differed in their behavioral responses, and the enhanced synchrony analyzed during the 500 ms predicted these differences. Together, these data suggest that the gamma synchronization between the Te1 and the PL cortex precedes and predicts the observable behavioral choice of the animals (no freezing vs freezing) and lead us to propose that this synchronization may therefore drive the animals' choice. The role of this interarea connectivity may be specifically related to the appraisal of the new stimuli as safe versus dangerous. Overall this functional connectivity was absent when the same animals were exposed to the same stimuli but before fear conditioning occurred. Notably, at this stage the marked individual variability in the synchrony exhibited by naive animals (with some animals showing lower or higher coherence values) may have obscured in a few discriminator rats the subsequent coherence increase after fear learning. In this situation, some discriminators showed similarly high values with respect to those in the naive condition. Indeed, we observed a statistically significant difference in the same animals between the “discriminators” and “naive” conditions.
In line with our data, a previous study showed that fear discrimination in humans is not the mere result of the perceptual features of sensory stimuli, but is, instead, an active process that requires the participation of both sensory cortices and prefrontal areas (Onat and Büchel, 2015). During fear discrimination of visual stimuli, there is a high activation of visual cortices aimed at solving sensory stimuli ambiguity, and fear discrimination arises from the combined activity of all these cortices and the prefrontal area (Onat and Büchel, 2015). Moreover, in line with the idea that the auditory cortex and the prefrontal cortex interact to solve behaviorally relevant tasks, Fritz et al. showed that training ferrets to modulate their behavior on the basis of specific tones produces a dynamic connection between the prefrontal cortex and the Te1, which may be aimed at detecting the training tones and the significance of these incoming stimuli to change behavior accordingly (Fritz et al., 2010). Similarly, Rodgers and DeWeese demonstrated that neurons in both the prefrontal cortex and the Te1 participate in selecting a specific sound from a mixture of auditory stimuli. They suggested a model in which this sound selection is mediated by the anticipatory activation of a specific subgroup of neurons in both these cortices that give “rise to robust and widespread rule encoding” (Rodgers and DeWeese, 2014).
A new proposed model for the neural circuitry engaged by fear-discrimination processes
Our results further showed that Te1–PL cortex synchrony is only present in animals that interpreted the new tone as safe, while it was absent in animals that generalized fear to a similar tone. This was not due to a general inability of the latter group of animals to display Te1–PL cortex functional connectivity, as this connectivity was present during the presentation of a white-noise stimulus evaluated as safe. This observation supports the view that the establishment of Te1–PL cortex synchrony represents a crucial neural mechanism that allows animals to successfully differentiate between new tones and threatening ones, thereby evaluating the new tones as safe. Conversely, the absence of this connectivity impairs this function, as shown by the optogenetic experiments.
Previous studies have shown that in animals that generalize fear to neutral tones, there is a predominant input from the BLA to the PL cortex, while in discriminator animals, the directionality of this connectivity flows from the PL cortex to the BLA (Bocchio and Capogna, 2014; Likhtik et al., 2014; Stujenske et al., 2014). On the basis of these studies and the present ones, we propose that when the Te1 and PL cortex synchronize their activity during the initial presentation of a new tone, animals can differentiate between the new tone and the CS. Consequently, the PL cortex will entrain BLA activity to diminish defensive responses. In contrast, if the Te1 and PL cortex cannot establish functional connectivity, animals cannot successfully differentiate between the tones, and thereby generalize fear to the new stimuli. These two conditions are illustrated in Figure 8. In this framework, a key question that remains to be addressed is whether the BLA inputs into the PL cortex are predominant in generalizer animals, thereby hindering Te1–PL cortex synchronization, or whether the PL cortex and the Te1 cannot synchronize their activity in the gamma range, consequently preventing the PL cortex from entraining BLA activity, whose inputs therefore become predominant. In line with the idea that fear discrimination and generalization arise from an integrated network rather than being driven by the local activity of a specific structure, we found that fear discrimination and generalization did not correlate with the activity of either the PL cortex or the Te1, but only with the coherence between the Te1 and PL cortex.
Figure 8.

Proposed interactions between mPFC, Te1, and BLA during fear-generalization and fear-discrimination processes. In the presence of Te1–PL cortex gamma synchronization, animals can differentiate between the new tone and the CS. Consequently, the PL cortex entrains BLA activity to diminish defensive responses. In contrast, if the Te1 and PL cortex cannot establish functional connectivity, animals cannot successfully differentiate between the tones, BLA inputs predominate on PL cortex activity, and fear is generalized to the new stimuli.
Our optogenetic experiments showed that the Te1–PL cortex connection was dispensable during the expression of fear memories, and our electrophysiological recordings confirmed a lack of synchrony during this process. It is likely that, during fear-memory retrieval, other pathways are recruited, such as those converging into the BLA from the PL cortex (Do Monte et al., 2016; Karalis et al., 2016) and from the Te2 (Sacco and Sacchetti, 2010; Cambiaghi et al., 2016)
We also found that direct projections from the Te1 to the BLA were not necessary for successful fear discrimination. As most of the cortical auditory information arrives in the BLA from the higher-order auditory cortices Te2 and Te3, as well as from the perirhinal cortex, auditory fear discrimination may engage these connections. Alternatively, cortical–BLA connections may not be required for fear discrimination. In any case, our data have shown that auditory cortical–BLA connections are not sufficient for successful fear discrimination in the absence of the Te1–PL cortex interplay. In addition, in an unpublished study, we found that the presentation of a new tone of 15 kHz at 1 week after fear learning was accompanied by fear-discrimination processes in all the tested rats (Grosso et al., 2018). As in the present study, we found that a similar tone of 15 kHz was accompanied by a marked individual variability if presented at 3 weeks after training; these data suggest that the fear-discrimination gradient changes as a function of the time of the test, as observed in the case of the context-conditioning process (Bergstrom, 2016; Lopresto et al., 2016).
Gamma oscillations and the cortical circuits
Our findings suggest that the Te1 and the PL cortex use slow-gamma oscillations as a means of long-range communication for evaluating new tones. Gamma oscillations arise from the interaction between reciprocally connected groups of excitatory principal neurons and inhibitory interneurons, in particular, parvalbumin-positive (PV+) cells (Sohal et al., 2009; Resnik et al., 2011; Buzsáki and Wang, 2012; Headley and Paré, 2013; Lasztóczi and Klausberger, 2014). PV+ interneurons are also present in the Te1, where their optogenetic manipulation leads to changes in innate and learned auditory behaviors that rely on auditory frequency discrimination (Aizenberg et al., 2015). The fast activity of PV+ interneurons suggests that gamma oscillations are the best candidates to coordinate the signaling between cortical regions, allowing efficient flow of information between them and producing long-lasting changes in their connectivity (Headley and Paré, 2013; Bocchio and Capogna, 2014). Several studies have shown that gamma oscillations are related to attentive and cognitive processes that require corticocortical connections (Mather and Sutherland, 2011; Headley and Paré, 2013).
The ability to distinguish between safe and harmful stimuli is an essential survival function. Difficulty in making this distinction is characteristic of people with anxiety disorders, who react inappropriately to neutral cues (Kaouane et al., 2012; Likhtik and Paz, 2015). Often these patients have past traumatic experiences that have somehow disrupted the normal brain-screening mechanisms. Our results suggest that patients suffering from these psychiatric pathologies could be characterized by impairment in the connection between sensory cortices and the prefrontal cortex. This impairment could lead to an incorrect interpretation of neutral stimuli, thereby resulting in inappropriate fear reactions.
Footnotes
This work was supported by grants from the European Research Council (ERC) under the European Union's Seventh Framework Program (FP7/2007-20013)/ERC Grant agreement no. 281072 and the Compagnia di San Paolo, Progetto d'Ateneo, University of Turin 2011 no. 811M33N. This study is part of the Ministero dell'Istruzione, dell'Università e della Ricerca Project Dipartimenti di Eccellenza 2018-2022 of the Rita Levi-Montalcini Department of Neuroscience. We thank Eugenio Manassero and Ludovica Mana (University of Turin, Italy) for their help and advice in experimental procedures and manuscript editing.
The authors declare no competing financial interests.
References
- Aizenberg M, Geffen MN (2013) Bidirectional effects of aversive learning on perceptual acuity are mediated by the sensory cortex. Nat Neurosci 16:994–996. 10.1038/nn.3443 [DOI] [PubMed] [Google Scholar]
- Aizenberg M, Mwilambwe-Tshilobo L, Briguglio JJ, Natan RG, Geffen MN (2015) Bidirectional regulation of innate and learned behaviors that rely on frequency discrimination by cortical inhibitory neurons. PLoS Biol 13.e1002308. 10.1371/journal.pbio.1002308 [DOI] [PMC free article] [PubMed] [Google Scholar]
- Berens PJ. (2009) CircStat: a MATLAB toolbox for circular statistics. J Stat Softw 31:1–21. 10.18637/jss.v031.i10 [DOI] [Google Scholar]
- Bergstrom HC. (2016) The neurocircuitry of remote cued fear memory. Neurosci Biobehav Rev 71:409–417. 10.1016/j.neubiorev.2016.09.028 [DOI] [PubMed] [Google Scholar]
- Bocchio M, Capogna M (2014) Oscillatory substrates of fear and safety. Neuron 83:753–755. 10.1016/j.neuron.2014.08.014 [DOI] [PubMed] [Google Scholar]
- Bokil H, Andrews P, Kulkarni JE, Mehta S, Mitra PP (2010) Chronux: a platform for analyzing neural signals. J Neurosci Methods 192:146–151. 10.1016/j.jneumeth.2010.06.020 [DOI] [PMC free article] [PubMed] [Google Scholar]
- Buzsáki G, Wang XJ (2012) Mechanisms of gamma oscillations. Annu Rev Neurosci 35:203–225. 10.1146/annurev-neuro-062111-150444 [DOI] [PMC free article] [PubMed] [Google Scholar]
- Cambiaghi M, Grosso A, Likhtik E, Mazziotti R, Concina G, Renna A, Sacco T, Gordon JA, Sacchetti B (2016) Higher-order sensory cortex drives basolateral amygdala activity during the recall of remote, but not recently learned fearful memories. J Neurosci 36:1647–1659. 10.1523/JNEUROSCI.2351-15.2016 [DOI] [PMC free article] [PubMed] [Google Scholar]
- Condé F, Maire-Lepoivre E, Audinat E, Crépel F (1995) Afferent connections of the medial frontal cortex of the rat. II. cortical and subcortical afferents. J Comp Neurol 352:567–593. 10.1002/cne.903520407 [DOI] [PubMed] [Google Scholar]
- Corcoran KA, Quirk GJ (2007) Recalling safety: cooperative functions of the ventromedial prefrontal cortex and the hippocampus in extinction. CNS Spectr 12:200–206. 10.1017/S1092852900020915 [DOI] [PubMed] [Google Scholar]
- Courtin J, Chaudun F, Rozeske RR, Karalis N, Gonzalez-Campo C, Wurtz H, Abdi A, Baufreton J, Bienvenu TC, Herry C (2014) Prefrontal parvalbumin interneurons shape neuronal activity to drive fear expression. Nature 505:92–96. 10.1038/nature12755 [DOI] [PubMed] [Google Scholar]
- Dejean C, Courtin J, Karalis N, Chaudun F, Wurtz H, Bienvenu TC, Herry C (2016) Prefrontal neuronal assemblies temporally control fear behaviour. Nature 535:420–424. 10.1038/535020a [DOI] [PubMed] [Google Scholar]
- Do Monte FH, Quirk GJ, Li B, Penzo MA (2016) Retrieving fear memories, as time goes by…. Mol Psychiatry 21:1027–1036. 10.1038/mp.2016.78 [DOI] [PMC free article] [PubMed] [Google Scholar]
- Dunsmoor JE, Paz R (2015) Fear generalization and anxiety: behavioral and neural mechanisms. Biol Psychiatry 78:336–343. 10.1016/j.biopsych.2015.04.010 [DOI] [PubMed] [Google Scholar]
- Fritz JB, David SV, Radtke-Schuller S, Yin P, Shamma SA (2010) Adaptive, behaviorally gated, persistent encoding of task-relevant auditory information in ferret frontal cortex. Nat Neurosci 13:1011–1019. 10.1038/nn.2598 [DOI] [PMC free article] [PubMed] [Google Scholar]
- Gao L, Li X, Yang W, Sun X (2017) Modulation of azimuth tuning plasticity in rat primary auditory cortex by medial prefrontal cortex. Neuroscience 347:36–47. 10.1016/j.neuroscience.2017.01.046 [DOI] [PubMed] [Google Scholar]
- Grosso A, Cambiaghi M, Concina G, Sacco T, Sacchetti B (2015) Auditory cortex involvement in emotional learning and memory. Neuroscience 23:45–55. [DOI] [PubMed] [Google Scholar]
- Grosso A, Santoni G, Manassero E, Renna A, Sacchetti B (2018) The neuronal basis of fear discrimination in the lateral amygdala. Nat Commun 9:1214. 10.1038/s41467-018-03682-2 [DOI] [PMC free article] [PubMed] [Google Scholar]
- Headley DB, Paré D (2013) In sync: gamma oscillations and emotional memory. Front Behav Neurosci 7:170. 10.3389/fnbeh.2013.00170 [DOI] [PMC free article] [PubMed] [Google Scholar]
- Headley DB, Weinberger NM (2013) Fear conditioning enhances γ oscillations and their entrainment of neurons representing the conditioned stimulus. J Neurosci 33:5705–5717. 10.1523/JNEUROSCI.4915-12.2013 [DOI] [PMC free article] [PubMed] [Google Scholar]
- Herry C, Johansen JP (2014) Encoding of fear learning and memory in distributed neuronal circuits. Nat Neurosci 17:1644–1654. 10.1038/nn.3869 [DOI] [PubMed] [Google Scholar]
- Hoover WB, Vertes RP (2007) Anatomical analysis of afferent projections to the medial prefrontal cortex in the rat. Brain Struct Funct 212:149–179. 10.1007/s00429-007-0150-4 [DOI] [PubMed] [Google Scholar]
- Kaouane N, Porte Y, Vallée M, Brayda-Bruno L, Mons N, Calandreau L, Marighetto A, Piazza PV, Desmedt A (2012) Glucocorticoids can induce PTSD-like memory impairments in mice. Science 335:1510–1513. 10.1126/science.1207615 [DOI] [PubMed] [Google Scholar]
- Karalis N, Dejean C, Chaudun F, Khoder S, Rozeske RR, Wurtz H, Bagur S, Benchenane K, Sirota A, Courtin J, Herry C (2016) 4-Hz oscillations synchronize prefrontal-amygdala circuits during fear behavior. Nat Neurosci 19:605–612. 10.1038/nn.4251 [DOI] [PMC free article] [PubMed] [Google Scholar]
- Kolb B, Tees RC (1990) The cerebral cortex of the rat. Cambridge, MA: Massachusetts Institute of Technology. [Google Scholar]
- Lapish CC, Chiang J, Wang JZ, Phillips AG (2012) Oscillatory power and synchrony in the rat forebrain are altered by a sensitizing regime of D-amphetamine. Neuroscience 203:108–121. 10.1016/j.neuroscience.2011.12.020 [DOI] [PubMed] [Google Scholar]
- Lasztóczi B, Klausberger T (2014) Layer-specific GABAergic control of distinct gamma oscillations in the CA1 hippocampus. Neuron 81:1126–1139. 10.1016/j.neuron.2014.01.021 [DOI] [PubMed] [Google Scholar]
- Likhtik E, Paz R (2015) Amygdala-prefrontal interactions in (mal)adaptive learning. Trends Neurosci 38:158–166. 10.1016/j.tins.2014.12.007 [DOI] [PMC free article] [PubMed] [Google Scholar]
- Likhtik E, Pelletier JG, Paz R, Paré D (2005) Prefrontal control of the amygdala. J Neurosci 25:7429–7737. 10.1523/JNEUROSCI.2314-05.2005 [DOI] [PMC free article] [PubMed] [Google Scholar]
- Likhtik E, Stujenske JM, Topiwala MA, Harris AZ, Gordon JA (2014) Prefrontal entrainment of amygdala activity signals safety in learned fear and innate anxiety. Nat Neurosci 17:106–113. 10.1038/nn.3582 [DOI] [PMC free article] [PubMed] [Google Scholar]
- Lopresto D, Schipper P, Homberg JR (2016) Neural circuits and mechanisms involved in fear generalization: implications for pathophysiology and treatment of posttraumatic stress disorder. Neurosci Biobehav Rev 60:31–42. 10.1016/j.neubiorev.2015.10.009 [DOI] [PubMed] [Google Scholar]
- Mather M, Sutherland MR (2011) Arousal-biased competition in perception and memory. Perspect Psychol Sci 6:114–133. 10.1177/1745691611400234 [DOI] [PMC free article] [PubMed] [Google Scholar]
- Natan RG, Carruthers IM, Mwilambwe-Tshilobo L, Geffen MN (2017) Gain control in the auditory cortex evoked by changing temporal correlation of sounds. Cereb Cortex 27:2385–2402. 10.1093/cercor/bhw083 [DOI] [PMC free article] [PubMed] [Google Scholar]
- Onat S, Büchel C (2015) The neuronal basis of fear generalization in humans. Nat Neurosci 18:1811–1818. 10.1038/nn.4166 [DOI] [PubMed] [Google Scholar]
- Padilla-Coreano N, Bolkan SS, Pierce GM, Blackman DR, Hardin WD, Garcia-Garcia AL, Spellman TJ, Gordon JA (2016) Direct ventral hippocampal-prefrontal input is required for anxiety-related neural activity and behavior. Neuron 89:857–866. 10.1016/j.neuron.2016.01.011 [DOI] [PMC free article] [PubMed] [Google Scholar]
- Paxinos G, Watson C (2004) The rat brain in stereotaxic coordinates. San Diego: Academic. [DOI] [PubMed] [Google Scholar]
- Portero-Tresserra M, Cristóbal-Narváez P, Martí-Nicolovius M, Guillazo-Blanch G, Vale-Martínez A (2013) D-cycloserine in prelimbic cortex reverses scopolamine-induced deficits in olfactory memory in rats. PLoS One 8:e70584. 10.1371/journal.pone.0070584 [DOI] [PMC free article] [PubMed] [Google Scholar]
- Resnik J, Paz R (2015) Fear generalization in the primate amygdala. Nat Neurosci 18:188–190. 10.1038/nn.3900 [DOI] [PubMed] [Google Scholar]
- Resnik J, Sobel N, Paz R (2011) Auditory aversive learning increases discrimination thresholds. Nat Neurosci 14:791–796. 10.1038/nn.2802 [DOI] [PubMed] [Google Scholar]
- Rodgers CC, DeWeese MR (2014) Neural correlates of task switching in prefrontal cortex and primary auditory cortex in a novel stimulus selection task for rodents. Neuron 82:1157–1170. 10.1016/j.neuron.2014.04.031 [DOI] [PubMed] [Google Scholar]
- Romanski LM, LeDoux JE (1993) Information cascade from primary auditory cortex to the amygdala: corticocortical and corticoamygdaloid projections of temporal cortex in the rat. Cereb Cortex 3:515–532. 10.1093/cercor/3.6.515 [DOI] [PubMed] [Google Scholar]
- Sacco T, Sacchetti B (2010) Role of secondary sensory cortices in emotional memory storage and retrieval in rats. Science 329:649–656. 10.1126/science.1183165 [DOI] [PubMed] [Google Scholar]
- Sohal VS, Zhang F, Yizhar O, Deisseroth K (2009) Parvalbumin neurons and gamma rhythms enhance cortical circuit performance. Nature 459:698–702. 10.1038/nature07991 [DOI] [PMC free article] [PubMed] [Google Scholar]
- Steenland HW, Zhuo M (2009) Neck electromyography is an effective measure of fear behavior. J Neurosci Methods 177:355–360. 10.1016/j.jneumeth.2008.10.020 [DOI] [PubMed] [Google Scholar]
- Stujenske JM, Likhtik E, Topiwala MA, Gordon JA (2014) Fear and safety engage competing patterns of theta-gamma coupling in the basolateral amygdala. Neuron 83:919–933. 10.1016/j.neuron.2014.07.026 [DOI] [PMC free article] [PubMed] [Google Scholar]
- Van Eden CG, Lamme VA, Uylings HB (1992) Heterotopic cortical afferents to the medial prefrontal cortex in the rat. A combined retrograde and anterograde tracer study. Eur J Neurosci 4:77–97. 10.1111/j.1460-9568.1992.tb00111.x [DOI] [PubMed] [Google Scholar]
- Weinberger NM. (2015) New perspectives on the auditory cortex: learning and memory. Handb Clin Neurol 129:117–147. 10.1016/B978-0-444-62630-1.00007-X [DOI] [PubMed] [Google Scholar]
- Weinberger NM, Miasnikov AA, Bieszczad KM, Chen JC (2013) Gamma band plasticity in sensory cortex is a signature of the strongest memory rather than memory of the training stimulus. Neurobiol Learn Mem 104:49–63. 10.1016/j.nlm.2013.05.001 [DOI] [PMC free article] [PubMed] [Google Scholar]
- Wigestrand MB, Schiff HC, Fyhn M, LeDoux JE, Sears RM (2017) Primary auditory cortex regulates threat memory specificity. Learn Mem 24:55–58. 10.1101/lm.044362.116 [DOI] [PMC free article] [PubMed] [Google Scholar]