

Abstract
Ongoing neural dynamics comprise both frequency-specific oscillations and broadband-features, such as long-range dependence (LRD). Despite both being behaviorally relevant, little is known about their potential interactions. In humans, 8–12 Hz α oscillations constitute the strongest deviation from 1/f power-law scaling, the signature of LRD. We postulated that α oscillations, believed to exert active inhibitory gating, downmodulate the temporal width of LRD in slower ongoing brain activity. In two independent “resting-state” datasets (electroencephalography surface recordings and magnetoencephalography source reconstructions), both across space and dynamically over time, power of α activity covaried with the power slope <5 Hz (i.e., greater α activity shortened LRD). Causality of α activity dynamics was implied by its temporal precedence over changes of slope. A model where power-law fluctuations of the α envelope inhibit baseline activity closely replicated our results. Thus, α oscillations may provide an active control mechanism to adaptively regulate LRD of brain activity at slow temporal scales, thereby shaping internal states and cognitive processes.
SIGNIFICANCE STATEMENT The two prominent features of ongoing brain activity are oscillations and temporal long-range dependence. Both shape behavioral performance, but little is known about their interaction. Here, we demonstrate such an interaction in EEG and MEG recordings of task-free human brain activity. Specifically, we show that spontaneous dynamics in alpha activity explain ensuing variations of dependence in the low and ultra-low-frequency range. In modeling, two features of alpha oscillations are critical to account for the observed effects on long-range dependence, scale-free properties of alpha oscillations themselves, and a modulation of baseline levels, presumably inhibitory. Both these properties have been observed empirically, and our study hence establishes alpha oscillations as a regulatory mechanism governing long-range dependence or “memory” in slow ongoing brain activity.
Keywords: alpha oscillations, scale-freeness
Introduction
Temporal long-range dependence (LRD), a hallmark of complex dynamical systems, is found in physical, biological, and social systems in the form of scale-free behavior of spatiotemporal measures (Bak et al., 1987). Power-law scaling of spectral power density of time-series is a signature of LRD and a carrier mechanism of “memory” in representing and processing information. Given the ubiquitous nature of LRD, it is not surprising that brain activity across species and scales also shows this property, as does behavioral performance (Bak et al., 1987; Gilden et al., 1995; Linkenkaer-Hansen et al., 2001; He et al., 2010; Van de Ville et al., 2010).
Further evidence linking neural LRD to function comes from findings of a flattening of 1/f brain activity during aging (Bak et al., 1987; Voytek et al., 2015), of slope-modulations during sleep versus awake states (Gilden et al., 1995; Linkenkaer-Hansen et al., 2001; He et al., 2010; Van de Ville et al., 2010; Zempel et al., 2012), of slope-modulations during task activation in humans (He et al., 2010), and from the fact that neuronal and behavioral power-law scaling are correlated (Palva et al., 2013).
A different intrinsic property of ongoing neural dynamics is periodic activity that is the focus of far more studies than the scale-free broadband phenomenon of LRD. Neural oscillations have been linked to multiple cognitive functions and behavior (for review, see Wang, 2010). The most salient frequency band in ongoing brain activity is the 8–12 Hz range, where oscillations have been reported since the first EEG recordings, accordingly termed the “alpha rhythm” (Berger, 1929).
Early evidence linking alpha oscillations to sensory and cognitive function came from observations that stimulation decreases alpha oscillations (“alpha blocking”; e.g., during eyes opening or mental calculation) (Berger, 1929; Aranibar and Pfurtscheller, 1978; Pfurtscheller, 1989). Since then, alpha oscillations have been tied to numerous cognitive functions involving attention, anticipation (Thut et al., 2006; Rihs et al., 2009), perception (Varela et al., 1981; Mathewson et al., 2009; Busch and VanRullen, 2010), and working memory (Berger, 1929; Klimesch, 1997). Both amplitude and phase of alpha activity have been shown to impact evoked neural activity and likely the cognitive processes driven by them (Berger, 1929; Nikulin et al., 2007; Becker et al., 2008, 2011; Mazaheri and Jensen, 2008; Scheeringa et al., 2011).
While the behavioral relevance of alpha oscillations spans multiple functional domains, the basic underlying mechanism appears to be a cyclic inhibition. Numerous EEG-fMRI studies report less metabolic demand during alpha activity (Goldman et al., 2002; Laufs et al., 2003; Moosmann et al., 2003; de Munck et al., 2007; Becker et al., 2011; Scheeringa et al., 2011), an observation seemingly compatible with the classical view of alpha activity being a passive, idling brain state. More recent theories, specifically, “gating-by-inhibition” (Jensen and Mazaheri, 2010), however, propose that alpha oscillations actively exert pulsed inhibition and that alpha desynchronization releases from this inhibition, thereby facilitating neural processing. In a similar vein, we have suggested the metaphor of a “windshield wiper” proposing not only a suppressive, but also updating, mechanism that emphasizes current over accumulated earlier information (Sadaghiani and Kleinschmidt, 2016).
Evidence for these views comes from studies on task-related neural signals (Haegens et al., 2011), but a putatively generic inhibitory mechanism should equally impact spontaneous activity. Addressing this question by studying cross-frequency relationships as phase-amplitude coupling (Osipova et al., 2008) in recordings of ongoing brain dynamics by EEG, MEG, or even electrocorticography is hampered by the difficulty of identifying clear periodicities outside the alpha range. Therefore, we here tested the theory of gating by inhibition by studying the effect of alpha oscillations on temporal LRD, the dominant feature in such recordings. Specifically, we postulated that increased alpha activity should by way of repetitive inhibition shorten scale-free behavior of slower neural activity and thus reduce LRD. This would constitute an interesting fundamental brain mechanism where oscillations govern the level of LRD and “memory” in ongoing neural processing.
The two datasets we used to test our hypotheses were selected on the grounds of maximizing robustness and generalizability of our results. They were obtained in different laboratories, under different conditions (eyes closed vs eyes open), with different acquisition techniques (EEG/MEG), and different preprocessing steps, EEG being analyzed at sensor level and MEG after source reconstruction. To better understand the underlying mechanisms of the observed effects, we complemented this by computational modeling of interactions between oscillations and temporal LRD.
Materials and Methods
Participants and experimental setting: EEG.
Eleven healthy volunteers (7 male, 4 female, mean age 26.8 ± 5.5 years, written informed consent) participated in the EEG resting state study in the Brain Behavioral Laboratory, Geneva, Switzerland. They were instructed to keep their eyes closed. The session was a “resting state” recording preceding a task paradigm and lasted ∼5 min.
MEG.
Twelve participants were recorded during the MEG resting state study (8 male, 4 female, mean age 21.8 ± 2.1 years, written informed consent) at NeuroSpin, CEA Saclay, France. They were instructed to fixate a black screen. Recordings lasted for ∼5 min. Both studies received approval by the respective local ethics committees and have been conducted according to the Declaration of Helsinki.
Data acquisition: EEG.
EEG was acquired by using a high-density geodesic electrode cap with 256 AgCl electrodes (HCGSN, Electrical Geodesics) and a corresponding high-impedance EEG system (Electrical Geodesics), Cz referenced. Impedances were kept <30 kOhm. Sample rate was 1 khZ.
MEG.
Data were recorded in a magnetically shielded room using a 306 channel MEG system (Neuromag Elekta); a detailed description of data acquisition and preprocessing can be found elsewhere (Zilber et al., 2014). In summary, sampling rate was 2 kHz and a bandpass filter with a range of 0.03, 600 Hz was applied. Four head position coils measured the head position of participants before each block; three fiducial markers (nasion and preauricular points) were used for digitization and alignment with the ensuing anatomical MRI acquisition, permitting later source reconstruction. Simultaneously, electrooculogram (EOG for horizontal and vertical eye movements) and ECG was acquired.
Data preprocessing: EEG.
For EEG-DC data, mean trend was removed and bad electrodes were interpolated. A total of 204 channels were kept, removing electrodes located on the chin and cheek as well as the outmost posterior layer of electrodes at the back of the head. No other filtering was performed.
MEG.
MEG data were source reconstructed by aligning the subject specific anatomical MRI to the predefined fiducials in the MEG recording. Details of the source reconstruction approach are provided in Zilber et al. (2014). During source reconstruction, ocular and cardiac artifacts were removed by generation of signal space projections based on average event-locked responses to the QRS cardiac components as recorded with ECG and to eye blinks as recorded with EOG. Finally, reconstructed sources were clustered into 138 neuroanatomically labeled regions, covering the whole brain. Subsequently, both MEG and EEG data were downsampled to 200 Hz, and z-scored sensor/source-wise.
Time-frequency analysis.
We estimated the fluctuations of spontaneous activity in MEG and EEG by wavelet time-frequency analysis. The continuous wavelet analysis (CWT) was applied using the Cross Wavelet and Wavelet Coherence toolbox (Grinsted et al., 2004), using a Morlet mother wavelet (6 cycles, logarithmic scales of 1/6 octaves with in total 58 scales).
In general, the CWT of a time-series x is equivalent to a convolution of x with the mother wavelet ψ (dt kept constant) as follows:
 |
For computational and storage reasons, the wave let envelope activity was further downsampled to 50 Hz. The envelope was calculated as the logarithm of the modulus of the complex-valued wavelet coefficients log |Wx(s)|. Data outside the “cone of influence” of the boundaries were excluded to avoid artifacts.
Based on this time-frequency representation, we estimated activity in the alpha-band and changes of the 1/f slope across a lower frequency range (0.12–4.8 Hz). Subsequently, we related these dynamics to the changes in estimated alpha activity. To infer causality from temporal precedence, we estimated the temporal relationship of alpha activity and slope changes. Surrogate data (see below) were used for all analyses to control for trivial and non-neuronal effects.
Surrogate data generation.
For both EEG and MEG, surrogate datasets were generated subject-wise and sensor-wise by performing an FFT over the entire time series of each sensor (nfft parameter was set to length of time series). After obtaining the complex-valued FFT, phase was scrambled and subsequently an inverse FFT was applied to project these data back into the time domain, thus preserving the spectral average of the real data while removing any cross-frequency coupling (Theiler et al., 1992; Ivanov et al., 1999).
After generating the surrogate data, average CWT-based spectra were recalibrated for each subject and sensor (real data vs surrogate data). This was necessary due to a nontrivial relationship between FFT-based spectrum (which was identical) and the averaged CWT-based spectrum (i.e., while per definition the surrogate data have the identical FFT spectra as the real data, CWT based spectra are slightly different).
Estimation of fluctuating alpha activity.
To extract fluctuations of alpha activity, the envelope of each scale within the frequency band of 8–12 Hz was calculated and subsequently averaged across this frequency range. For subsequent analyses, we determined, for both EEG and MEG data, the 30 sensors and sources, respectively, with the highest alpha amplitude (as averaged across subjects) and collapsed results in further analyses (see below) into a single value.
Validation of frequency range for 1/f power-law fitting.
Because wavelet analysis (like all time-frequency representations) shows a tradeoff between frequency and time resolution, we wanted to further validate the lower-frequency range chosen for subsequent estimation of 1/f slope. Thus, we performed a calculation of cross-frequency coupling in each sensor or channel, respectively, and subject. This enabled us to estimate the inherent frequency resolution of the chosen wavelet approach. We verified that <5 Hz no spectral leakage from alpha activity occurred.
Estimation of 1/f slope.
By performing linear regression across the log-scaled envelope activity in the spectral range of 0.12 Hz (lower boundary) up to 4.8 Hz, we obtained an estimation of slope and intercept within this low-frequency range.
Relation of (average) alpha amplitude to 1/f slope.
After averaging across all subjects, we performed a correlation analysis where, on a per-sensor/source basis, average alpha amplitude was related to average slope coefficients. Complimentary to this more exploratory analysis, we also averaged slope coefficients for the 30 highest alpha power sensors/sources and for the 30 lowest alpha-power sensors/ sources before subjecting them to a pairwise t test across subjects to examine.
Relation of alpha fluctuations to 1/f slope changes.
Using the Pearson product-moment correlation coefficient, the slope fluctuations were then related to fluctuations of the alpha envelope. This analysis and all subsequent ones were performed locally (i.e., within each channel/source) and then collapsed within the previously defined cluster. For this analysis, slope and envelope estimation were related to each other at zero-time lag. Data were then split into quartiles of the 25% highest and 25% lowest alpha periods and subsequently estimated slopes were averaged. Finally, differences were determined between periods of high and low alpha activity and compared with the correspondingly analyzed surrogate data as explained below.
Figure 1 summarizes and illustrates the mentioned steps in estimating alpha activity and slope in the low-frequency range and correlating them at zero-time lag.
Figure 1.

Illustration of a time- and frequency-resolved approach to data analysis. Time-frequency presentation from one sensor of a typical dataset using log-scaled wavelet analysis. The time course of alpha activity as estimated by continuous wavelet analysis is extracted (inset, bottom right) and, with the same temporal resolution and zero time lag, the time course of the slope of spectral activity <5 Hz is estimated (inset, bottom left). A linear correlation between these two time-series is then performed at zero-lag to examine the link between the two features (see Materials and Methods; see Fig. 4). For analysis of a potential temporal precedence of one of the two signals, time lag was varied (see Fig. 6).
Additionally, we performed a second correlation analysis, where we correlated average alpha amplitude (per sensor/source) and average effect (i.e., alpha-to slope-change correlation coefficients) to determine whether the impact of alpha dynamics on slope dynamics scales with alpha amplitude across brain areas.
Cross-frequency amplitude-to-amplitude coupling.
To obtain the canonical cross-frequency coupling, we correlated all possible cross-frequency relationships across the available frequency spectrum.
Temporal asymmetry of alpha versus slope comodulations.
For assessing a temporal precedence of alpha activity versus slope changes or vice versa (i.e., a non-zero time lag), we performed cross-correlation in the temporal range from −1.5 to 1.5 s. Subsequently, a Gaussian plus a linear term (i.e., of the type a × exp(−(x − μ)2/(2 × σ2)) + b × x + c) was fit to the mean cross-correlation result in each channel or source to estimate the temporal precedence of one parameter over the other. Of interest are especially the lag parameter μ and the width parameter σ plus the linear drift term b. We further estimated subject-wise lags by fitting the linear-Gaussian term to each subject's individual cross-correlogram (in a window from −0.5 to 0.5 s) and tested whether the estimated lag was consistent across subjects by performing a Student's t test.
To compare with surrogate data, we furthermore accumulated cross-correlation values from −0.5 s to 0 s and from 0 s to 0.5 s (further referred to as accumulated correlation asymmetry [ACA]). Under the null hypothesis (i.e., the correlation peak being centered at zero lag), these two accumulated correlation coefficients should be equal; thus, their difference (i.e., the ACA) is on average zero. To test this, this difference was compared with the corresponding difference for surrogate data, thus providing a statistical threshold with an alpha error of α <5% (see below).
Additionally, we calculated a grand average of the ACA index and related it to the average alpha amplitude per channel (noncollapsed sensor/source data) to test whether this effect also scaled with the average power of alpha.
Statistical analysis.
For all main analyses, a threshold criterion was generated by performing the identical analyses in the surrogate data, for each subject and sensor/channel repeatedly (using maximum statistics with n = 19). Results were then averaged across subjects; subsequently, the maximum of the maxima yielded (across channels/sensors) during each analysis was maintained as a final threshold, providing a way of controlling the alpha error to remain <5%, corrected for multiple comparisons. Results from real EEG or MEG passing these thresholds were considered significant (i.e., p < 0.05, corrected).
For the performed slope change analysis and analysis of temporal precedence, we complemented the surrogate-data approach by estimating CIs (at 95% level) across subjects to further corroborate the robustness and generalizability of observed effects.
Correlation analyses over electrodes/sources were either tested against the surrogate data or complemented by other tests that ruled out spurious correlations due to spatial smoothness of the M/EEG data (as described in Relation of alpha fluctuations to 1/f slope changes).
Modeling.
To investigate the potential mechanisms underlying the observed empirical findings, we examined a number of different scenarios regarding the dynamics of alpha oscillations. Five models were compared with each other. In all of them, 300 s time courses, at 200 Hz sampling rate, containing alpha oscillations on top of 1/f noise were generated. We first produced the envelope of alpha oscillations and then convolved it with a Morlet-like alpha wavelet (center frequency of 9 Hz). Depending on the model, we also included a low-frequency baseline component that represented the alpha envelope.
After generation of synthetic signals, they were subjected to the same analyses as the experimental data, and the model outcomes were compared. In Model 1, we assumed systematically repeated 1 s bursts of alpha oscillations every 4 s. Bursts alternate in high and low amplitudes (see Fig. 8). In Model 2, the envelope of alpha activity fluctuations is not rhythmic, but generated by a random fractal process, integrating findings from previous reports about the fractality of the human alpha rhythm (Linkenkaer-Hansen et al., 2001). Fractal alpha envelope dynamics were implemented by using pink noise filtered in the sub-alpha frequency range to serve as modulation of the alpha envelope (instead of the rhythmic pulsing in Model 1). Model 3 uses the rhythmic alpha pattern from Model 1 but includes instantaneous negative baseline shifts during periods of alpha activity. This component was driven by reports about asymmetric alpha fluctuations (Nikulin et al., 2007; Mazaheri and Jensen, 2008). The baseline shift (BL) was implemented by subtracting voltage equal to the envelope of currently active alpha from the data (BLasymm(t) = −ENVα(t)). This causes activity to be at zero at the peak of each alpha oscillation (without added noise) and negative at its current amplitude during the trough.
Figure 8.

Modeling the effect of varying temporal dynamics of alpha oscillations and associated baseline shifts on slope estimations (for details, see Materials and Methods). First row, Model 1, represents rhythmic alpha pulsing, that is every 4 s with alpha oscillating (strong burst always followed by a weak burst) and no baseline shift. A zoom-in visualizes the symmetry of modeled alpha oscillations. The next panel represents the broadband power for high versus low alpha amplitudes. The fourth panel represents the same data for the analyzed frequency range <5 Hz. The last panel in each row represents the estimated correlations as a function of lag time in the correlogram. Second row, Model 2, represents rhythmic alpha with associated baseline shifts. Models 3 and 4 use fractally distributed alpha fluctuations. Model 3 involves no baseline shift during alpha oscillations, whereas Model 4 does. Model 4 shows similar alpha-dependent slope changes as the real data, distributed smoothly across frequencies <5 Hz. Model 5 in the lowest row is identical to Model 4, but with a 100 ms delay of alpha-dependent baseline shifts. Only this model shares a temporal precedence of alpha versus slope shift with the empirical data.
Model 4 shares the fractal alpha envelope dynamics of Model 3 and includes negative baseline shifts according to the degree of alpha activity, as in Model 2. Model 5 is equal to Model 4; the only difference is that it integrates a systematic shift or delay of the alpha-induced baseline shifts by 100 ms. In all models, 1/f noise (slope = −0.75) is added on top to make results more comparable with empirical data (for implementation, see Zhivomirov, 2015).
Results
Both datasets we analyzed show clear 1/f behavior in the low-frequency range below the alpha band. Figure 2 displays the normalized mean wavelet-based spectra for the two modalities (EEG and MEG). Both also show marked deviation from 1/f behavior in the near 10 Hz range indicating alpha oscillations. Figure 2 (right panels) depicts the topographic distribution of alpha oscillations with the well-known occipital dominance that is more pronounced in EEG (eyes closed) than MEG (eyes open).
Figure 2.

A, Grand average resting state broadband spectra of EEG and MEG data (rescaled for normalization). Plots are log-log transformed along both axes and show mean values across subjects along with their SEM, as indicated by the inset. B, Relative topography of 10 Hz activity in the EEG sensor data (above) and the MEG source-reconstructed data (below). The 30 sensors (EEG) or sources (MEG) with the highest average alpha activity (see color bar) are outlined by black lines. These positions were selected for dynamic analysis of the relation between alpha activity and the slope in the spectrum of low-frequency activity (range indicated by a line in A).
Given this topographical variability of alpha oscillations, we first tested across different spatial positions whether strength of alpha activity averaged over time is associated with less LRD in the low-frequency range (<5 Hz). Figure 3 shows that, at positions with more alpha activity (averaged across subjects), the negative slope of low-frequency activity in the power spectrum is less steep (i.e., less negative). This positive correlation was very strong both in the EEG data (r = 0.86, n = 203) and the MEG data (r = 0.91, n = 138) across all sensors and sources, respectively, and reflects an alpha-dependent decrease in LRD. Although being informative, this analysis might overestimate the actual relationship between alpha and slope due to the spatial smoothness of the M/EEG data. Thus, we performed another, pairwise test of average alpha amplitude versus slope in the 30 highest (compare Fig. 2) versus the 30 lowest sensors or sources which yielded significant differences across subjects for both conditions (p < 6e-3 and p < 6e-5 for EEG and MEG, respectively).
Figure 3.

Both in EEG (top left) and MEG recordings (top right), average alpha power at different electrodes (EEG, r = 0.86, n = 203) and sources (MEG, r = 0.91, n = 138) correlates positively with slope coefficients estimated in the frequency range <4.8 Hz. As slopes are negative, this means that higher alpha activity is associated with less steep power decline at the higher frequencies in the sub-alpha range, a sign of reduced self-similarity and LRD. This is not only consistent across electrodes or sources, but also across subjects: there is a significant difference in slope when comparing the 30 strongest alpha power sources (compare topography in Fig. 2) versus the 30 weakest power sensors or sources within subjects (pairwise t test, p < 6e-3 and p < 6e-5 for EEG and MEG, respectively).
Next, we probed whether what held true on average across different positions (sensors or sources) could also be confirmed dynamically at given positions. A first test was conducted by splitting time series into periods of high and low alpha power. We then tested whether the spectra during the quartile of the time series with the highest level of alpha activity showed a different low-frequency slope than the quartile with the lowest level (Fig. 4). These analyses were confined to the 30 sensors or sources, respectively, with the highest alpha power (Fig. 2, outlined in black). In addition to the alpha peak, spectra from these clusters showed strong power-law scaling with a negative slope in the low-frequency range (<5 Hz, average across n = 30 sensors, EEG −0.68 ± 0.03, MEG, −0.56 ± 0.02, [mean ± SEM, respectively]). Testing our hypothesis of interest, we found that this slope was significantly less negative during high than during low alpha activity (EEG −0.66 vs −0.70 and MEG −0.53 vs −0.58 for high and low alpha activity, respectively; Fig. 4C,D). This effect was highly consistent across subjects (Fig. 4E shows a 95% CI). To rule out trivial effects (e.g., due to spectral leakage), our null hypothesis used phase-randomized surrogate data derived from the experimental EEG and MEG data; that is, the average power spectrum and thus temporal correlation structure of the data were preserved under the null hypothesis, but all cross-frequency coupling was destroyed. No effect of high versus low alpha activity on power-law scaling was observed in these surrogate data (Fig. 4C–E, box plots).
Figure 4.
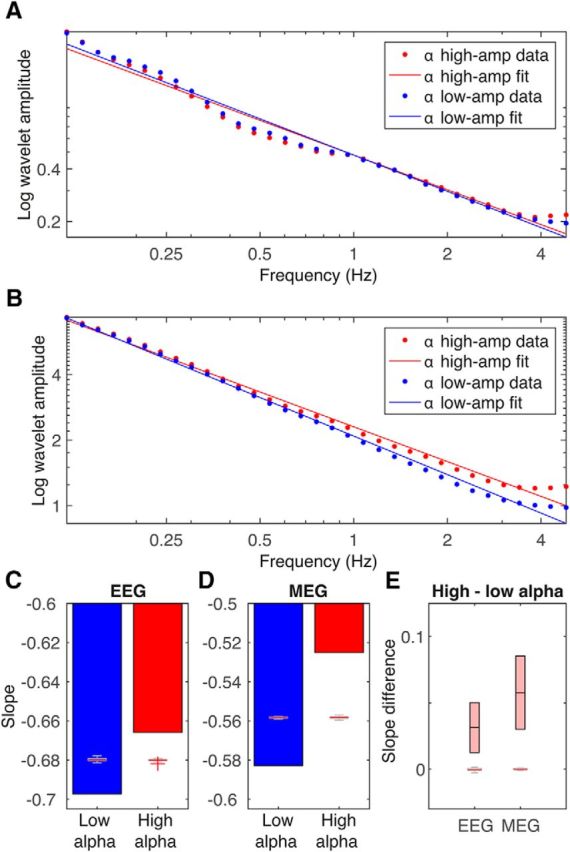
Alpha activity modulates the slope of low-frequency activity. A, As visualized by grand averages (across subjects and sensors/sources) for both EEG (A) and MEG (B), alpha fluctuations correlate with the slope of lower frequency activity (0.12–4.8 Hz). Higher alpha activity is related to a less negative slope. C, EEG results for alpha-dependent slope changes in all subjects. D, Corresponding MEG results. E, Across-subject analysis of slope differences between high and low alpha activity in EEG and MEG data, real data indicated by the light red boxes indicating the 95% CIs (with mean indicated by horizontal black line in the middle). C–E, Boxplot inlets with whiskers represent median (red line), minima and maxima (red crosses indicate values deemed outliers) for the surrogate data, with a first-order error probability ≤5%.
Quartile splitting and slope fitting on the average spectra from the related parts of the time series cannot provide a time- and frequency-resolved representation of ongoing dynamics. Therefore, we moved to a more fine-grained approach sequentially quantifying amplitude in the entire frequency range. Figure 1 illustrates our approach for time-frequency extraction using the continuous Morlet-wavelet transform. Scales were chosen to cover the 0.12–97.1 Hz band in 58 logarithmic scales. Based on this approach, we determined the amplitude-amplitude coupling of alpha oscillations to all other frequencies from 0.1 to 100 Hz in both EEG and MEG recordings (Fig. 5). The analysis of amplitude-amplitude coupling further confirms that the relationship of alpha activity to low-frequency activity is best described by a slope change across this frequency range rather than a selective amplitude-amplitude coupling occurring between alpha oscillations and other specific low-frequency bands. This interpretation holds when, instead of a single line read-out as in Figure 5, amplitude-amplitude couplings are analyzed over the full frequency range in our recordings (Fig. 6). The change in slope was driven by positive correlation in frequencies neighboring the alpha band that decayed with decreasing frequency, but only in the EEG data flipped into negative correlations at very low-frequency values. Our findings in the experimental data were validated against surrogate data (Fig. 5, blue curves). These control results are particularly important because they establish that the positive coupling of alpha oscillations with power in the immediately adjacent lower frequency band of theta is not due to “spectral leakage” or other potential shortcomings of our analytical tools.
Figure 5.

Correlation of alpha activity with spectral activity across the available range (left: EEG; right: MEG). Red line indicates real data. Blue line indicates surrogate data that are devoid of any cross-frequency couplings. The effect ∼10 Hz reflects the frequency resolution of the chosen continuous wavelet approach. In the spectral range outside a frequency window of 6–11 Hz, no trivial cross-frequency correlation with alpha activity is to be expected. Also of interest is the remarkable linear decay of the correlation between alpha envelope and lower frequency envelope dynamics (especially for the cleaner MEG data) without enforcing any slope-like behavior.
Figure 6.

A, B, Grand-average cross-correlograms of alpha amplitude and slope changes and their corresponding fit for EEG and MEG clusters, respectively. This analysis is a lagged version of the zero-lag correlation analysis shown in Figure 4 (for illustration, see also Fig. 2). The time-series entering the cross-correlation are the alpha amplitudes on the one hand and the concurrent slope changes on the other (Fig. 4A, B shows the lag of maximum correlation). C, D, Detailed analysis of a potential time lag across individuals in the time window of ±0.5 s reveals a significant lag in both EEG and MEG clusters, with the 95% CI ranging in the negative time window. E, F, Complementary to this analysis, the ACA (see Materials and Methods) shows a significant leftward correlation asymmetry (compared against surrogate data; gray boxplots). These results show that alpha activity precedes the correlated slope effects in the <5 Hz frequency range.
Our time-resolved approach permitted analyzing the correlation between alpha oscillations and the level of low-frequency LRD not only at zero-lag but also at variable time lags between the two time series. We tested whether shifting time courses of alpha power fluctuations relative to slope values emphasized the correlation effects, suggesting that one follows from the other and thereby identifying temporal precedence as a proxy of causality. We calculated the grand average cross-correlogram for both EEG and MEG data and fitted a Gaussian function plus a linear term. We found that alpha fluctuations preceded slope fluctuations by 137 ms in EEG data (lag parameter of Gaussian, goodness of fit r2 = 0.9978), and by 81 ms in MEG data (goodness of fit r2 = 0.9951) (Fig. 6A–D).
To test whether the estimated temporal lags are significantly different from zero, we used two approaches. Subject-wise fitting resulted in a mean ± SEM lag of 159 ± 47 ms for the EEG electrode cluster and of 79 ± 16 ms for the MEG source cluster (Fig. 6C,D). For comparison with the surrogate data where no good fit by Gaussian functions can be achieved, we also estimated temporal asymmetry by accumulating (summing up) all correlation coefficients from 0.5 s before and 0.5 s after the time-point zero of the correlogram and subtracting these from each other. These ACAs show a significant rightward asymmetry both in the experimental EEG and MEG data (0.42 and 0.35, respectively) but not in the related surrogate data (Fig. 6E,F).
Our previous testing had been conducted mostly on time series data collapsed over the 30 sensors (EEG) or sources (MEG) with the strongest alpha activity. As a final control of the generality of our observations, we therefore probed whether the influence of alpha oscillations on low-frequency slope changes and its precedence varies as a function of alpha power differences between all sensors and sources, respectively. We found both effects to scale with increasing average alpha activity (Fig. 7, top row), compared with the surrogate data that did not show this behavior (Fig. 7, bottom row).
Figure 7.
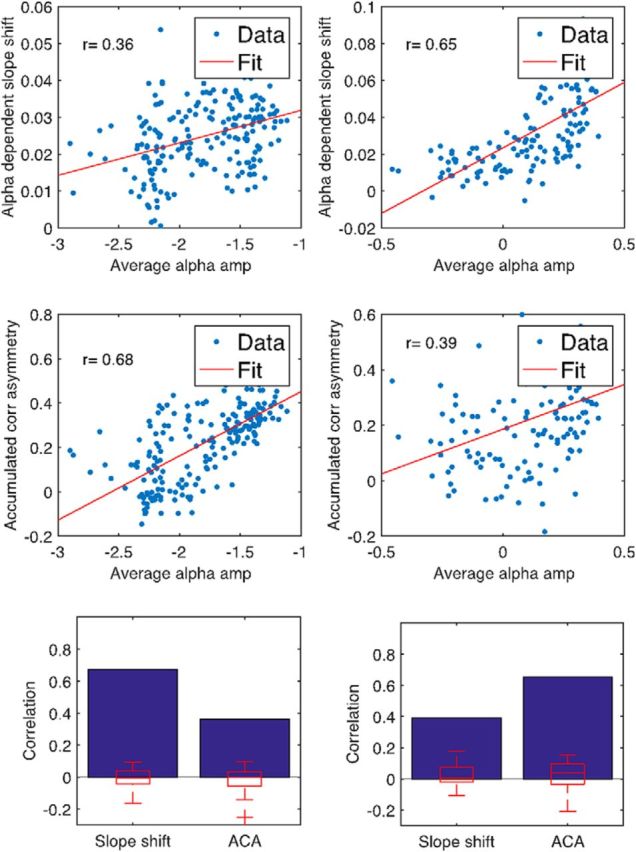
Both the reported slope shift analysis (top; see also Fig. 3) and the analysis of temporal precedence, that is, the accumulated correlation asymmetry (middle panels; compare also Fig. 6), show not only significant effects in the selected sensor or source cluster averages but are also systematically linked to the amount of average alpha activity in each individual sensor or source (left panels: EEG, n = 203; right panels: MEG, n = 138). A stronger prevalence of alpha activity entails stronger effects. To rule out potential spurious correlations, we tested this against the surrogate data obtaining significant (p < 0.05) effects (bottom row). Maximum statistics from surrogate runs (n = 19) did not reach the level of correlation of real data (summarized in blue), with the correlation coefficients of the surrogate runs indicated by the boxplots (in red). Whiskers indicate minima and maxima; +, outliers.
In summary, these empirical findings converge to suggest that alpha activity modulates LRD in the low-frequency range of brain activity. We therefore went on to examine which requirements a simple computational model would need to generate similar behavior as observed in our experimental data (Fig. 8). We simulated several different properties of alpha oscillations (embedded in stochastic 1/f noise) and analyzed ensuing slope changes in the low-frequency range. We found that replicating our findings required a model with fractal envelope dynamics of alpha oscillations that in turn induce baseline shifts with an ∼100 ms delay, thereby introducing apparent asymmetry (Mazaheri and Jensen, 2008). Neither regular (oscillatory with rhythmic alpha bursts) nor irregular (monofractal) modulations of alpha power alone introduced changes into the observed low-frequency spectrum (Fig. 8, first and second rows).
Our simulation was motivated by previous observations of 1/f behavior of alpha amplitude fluctuations (Linkenkaer-Hansen et al., 2001), a behavior also present in our own experimental data (Fig. 9). When simulating asymmetry by associating the alpha envelope with a concurrent baseline shift, we found that this alone did induce low-frequency power changes. This is not surprising but means that the first property tested (regularity vs irregularity that has no effect in itself on low-frequency activity) now becomes critical in determining the type of alpha-induced power change in the low-frequency range. When assuming a rhythmic modulation of the alpha power envelope, the effect was confined to the frequency of this modulation (Fig. 8, third row). In contrast, when assuming a fractal modulation of alpha power, the simulated data very closely approached the results from our analyses of the experimental data (Fig. 8, fourth row). However, these two assumptions (i.e., irregularity of alpha oscillations and asymmetry of baseline) were still insufficient to simulate the temporal precedence of alpha power fluctuations over associated slope changes in the low-frequency range. Only when assuming fractal power fluctuations of alpha together with a delayed suppression of a baseline (by 100 ms), were we able to closely replicate our results in the experimental data (Fig. 8, bottom row). In summary, assuming a fractal behavior of alpha oscillations that in turn induce delayed baseline shifts is sufficient in our model to account for the observations in empirical EEG and MEG data.
Figure 9.

In correspondence with previous reports (Linkenkaer-Hansen et al., 2001), the spectrum of alpha envelope dynamics (average across subjects) exhibits 1/f behavior in the examined datasets (left EEG, right MEG, grand averages across subjects).
Discussion
Background neural activity has long been discarded from models of brain function. One reason is that many neurophysiological techniques suffer from poor temporal stability and contamination by technical sources of noise, another that in the dominant behaviorist stance in the neurosciences, there was little conceptual room for conceiving ongoing activity other than as biological noise. These views have changed more recently; and especially with respect to oscillations, it has been established that they play an important functional role in neural processing that transpires into cognition and behavior (Wang, 2010). The other prominent feature of background brain activity (i.e., powerful slow variations) has now also been shown to be functionally relevant in that they influence stimulus processing and behavior (Boly et al., 2007; Fox et al., 2007; Hesselmann et al., 2008; Sadaghiani et al., 2009). Importantly, such studies have also found that the relation between ongoing and evoked activity is nonlinear (Hesselmann et al., 2008; He, 2013), thereby inevitably rendering models insufficient that do not account for ongoing brain processes on a trial-by-trial basis.
Slow fluctuations in brain activity display power-law scaling, a commonly observed property of many measures of physical, biological, and sociological systems (Bak et al., 1987; Turcotte et al., 2002). Although such 1/f behavior can also be seen, for instance, in human behavior (Gilden et al., 1995), it is not very clear to which extent it is merely an epiphenomenal trait of complex dynamical systems and hence also present in the brain. From a functional perspective, LRD and persistence of activity can be considered mechanisms for preserving information at different time scales, hence providing a form of memory that serves stability without locking into stationarity (Sadaghiani et al., 2010; Deco et al., 2011; Harmelech and Malach, 2013). However, one important requirement for optimizing brain function is adaptiveness and malleability, thereby introducing a need for context-dependent modulation. An ensuing question is how such context-dependent modulation of LRD could be mechanistically implemented.
The findings presented here illustrate, both empirically and computationally, how alpha oscillations change the low-frequency LRD signature of brain activity. The presence of alpha oscillations decreases LRD (i.e., shortens persistence), thereby reducing the temporal width of “memory” contained in self-similar activity time series. The empirical findings were obtained for two different types of recording modality, EEG and MEG, and independently from recording conditions: eyes closed for EEG and eyes open during MEG recordings. The effects did not depend on the type of preprocessing, being present both in EEG surface and MEG source data, and were not constrained to different brain sites, but only scaled with the strength of average alpha activity across different sensors or sources, respectively. We generated surrogate data from the experimental data themselves to ensure that these effects were not trivial or spurious. Finally, we found that the effect was maximal when assuming a precedence of alpha activity variations by about one alpha cycle relative to their impact on persistence in slow activity, thereby suggesting a causal relationship. Our analyses were motivated by the interest in temporal LRD in the low-frequency range but may reach beyond. However, techniques other than EEG and MEG would be more appropriate to address such potential effects.
Together, our findings indicate a ubiquitous and likely generic mechanism in brain function. By providing a model to explain our findings, we found two ingredients to be key. One is a fractal behavior of alpha amplitude variations themselves and the other that alpha oscillations induce delayed baseline shifts. Both have been observed empirically previously (Linkenkaer-Hansen et al., 2001; Nikulin et al., 2007; Mazaheri and Jensen, 2008), and our observations point at the importance of also considering the delay between alpha oscillations and baseline. The combined effect of two key ingredients in our computational simulations is to result in power changes at the slow modulation frequencies of alpha oscillations. The effects of the baseline shifts on the power spectrum are blind to the sign of these shifts, but there is sufficient empirical evidence to assume them to be inhibitory (Haegens et al., 2011). Furthermore, the fractal pattern of alpha oscillations makes the effects spread out across the entire frequency range below the alpha band instead of a single modulation frequency.
We were able to observe a direct inhibitory effect of alpha oscillations on power in very low frequencies only in the EEG data (Fig. 5, zero-crossing), but this may be due to a weak high pass filter applied to the MEG data already at the acquisition level. The more important observation, however, is that, even in a frequency-resolved analysis, the effects of alpha oscillations on power in lower frequencies were best described by assessing a slope change, rather than targeting power-power coupling between alpha oscillations and specific slower frequency bands. The approach of analyzing slope changes differs from previous analyses that were tied to classical EEG/MEG frequency bands, such as theta or delta oscillations, which are difficult to define in the type of neural population data we analyzed. Accordingly, the effect of alpha oscillations on LRD that we show here actually manifests by power increases instead of decreases in the neighboring lower frequencies, which at first glance may seem counterintuitive for a presumably inhibitory mechanism.
Alpha oscillations are associated with reduced cortical excitability, as indexed, for instance, by spiking and gamma activity (Osipova et al., 2008; Haegens et al., 2011) and fMRI-BOLD signal (Goldman et al., 2002; Moosmann et al., 2003; de Munck et al., 2007; Becker et al., 2011; Scheeringa et al., 2011, 2012). Evidence for cyclic inhibition during periods of strong alpha activity has been garnered from paradigms involving a modulation of stimulus-driven evoked neural responses by power of ongoing alpha oscillations or phase dependence within cycles (Osipova et al., 2008; Haegens et al., 2011). If the temporal structure of paradigms emphasizes higher spectral components, they will, of course, in turn interfere with LRD in ongoing activity, as has been shown in previous studies (Gilden, 2001). Here, however, we have addressed the third component of this triadic relation, namely, how two features of ongoing activity interact with each other in the absence of confounding influences from a paradigm. Accordingly, our results cannot be tied directly to behavioral performance, and our interpretation of the functional significance of these effects must remain speculative.
One possible line of speculation comes from the recent suggestion that an increase of alpha oscillations in task-relevant channels could be beneficial in settings where behavioral performance is determined by alertness (nonselective attention) as the key requirement (Sadaghiani et al., 2012). As “windshield wiper” alpha oscillations could improve the relative “salience” of novel incoming information by purging some of the accumulated information from the recent past (Sadaghiani and Kleinschmidt, 2016), this mechanism would hence be the opposite of the one supporting selective attention. It is tempting to link this proposal to our present observation that alpha oscillations reduce persistence of slow neural activity. The functional implication of this effect is that alpha oscillations regulate the extent to which brain activity is focused into the “here and now.” This interpretation emphasizes the active functional role of alpha oscillations but is different from alternative proposals that conceptualize alpha oscillations as an inhibitory counterpart of selective attention that deals with avoiding distracter interference (Jensen and Mazaheri, 2010). In a more general sense, this interpretation also permits to think of one fundamental property of ongoing activity, regularity in the form of oscillations, as a neural mechanism to govern another intrinsic property, irregularity in the form of LRD. This mechanism may be important to prevent brain activity from being enslaved by an emergent property as LRD, and to permit regulating the degree of LRD according to changing functional contexts.
Footnotes
This research was funded by the Swiss National Science Foundation (project number 320030–149781) and the Louis-Jeantet Foundation. Also, we would like to thank the Brain and Language Laboratory (Geneva) for providing the resting-state DC-EEG data (Prof. Narly Golestani and Dr. Alexis Hervais-Adelman) as well as Dr. Philippe Ciuciu and Dr. Virginie van Wassenhove (Neurospin, Paris) for providing the MEG source data; and Dr. Patrice Abry for fruitful discussions of LRD.
The authors declare no competing financial interests.
References
- Aranibar A, Pfurtscheller G (1978) On and off effects in the background EEG activity during one-second photic stimulation. Electroencephalogr Clin Neurophysiol 44:307–316. 10.1016/0013-4694(78)90306-1 [DOI] [PubMed] [Google Scholar]
- Bak P, Tang C, Wiesenfeld K (1987) Self-organized criticality: an explanation of the 1/f noise. Phys Rev Lett 59:381–384. 10.1103/PhysRevLett.59.381 [DOI] [PubMed] [Google Scholar]
- Becker R, Ritter P, Villringer A (2008) Influence of ongoing alpha rhythm on the visual evoked potential. Neuroimage 39:707–716. 10.1016/j.neuroimage.2007.09.016 [DOI] [PubMed] [Google Scholar]
- Becker R, Reinacher M, Freyer F, Villringer A, Ritter P (2011) How ongoing neuronal oscillations account for evoked fMRI variability. J Neurosci 31:11016–11027. 10.1523/JNEUROSCI.0210-11.2011 [DOI] [PMC free article] [PubMed] [Google Scholar]
- Berger H. (1929) Über das elektrenkephalogramm des menschen. Eur Arch Psychiatry Clin Neurosci 87:527–570. [Google Scholar]
- Boly M, Balteau E, Schnakers C, Degueldre C, Moonen G, Luxen A, Phillips C, Peigneux P, Maquet P, Laureys S (2007) Baseline brain activity fluctuations predict somatosensory perception in humans. Proc Natl Acad Sci U S A 104:12187–12192. 10.1073/pnas.0611404104 [DOI] [PMC free article] [PubMed] [Google Scholar]
- Busch NA, VanRullen R (2010) Spontaneous EEG oscillations reveal periodic sampling of visual attention. Proc Natl Acad Sci U S A 107:16048–16053. 10.1073/pnas.1004801107 [DOI] [PMC free article] [PubMed] [Google Scholar]
- Deco G, Jirsa VK, McIntosh AR (2011) Emerging concepts for the dynamical organization of resting-state activity in the brain. Nat Rev Neurosci 12:43–56. 10.1038/nrn2961 [DOI] [PubMed] [Google Scholar]
- de Munck JC, Gonçalves SI, Huijboom L, Kuijer JP, Pouwels PJ, Heethaar RM, Lopes da Silva FH (2007) The hemodynamic response of the alpha rhythm: an EEG/fMRI study. Neuroimage 35:1142–1151. 10.1016/j.neuroimage.2007.01.022 [DOI] [PubMed] [Google Scholar]
- Fox MD, Snyder AZ, Vincent JL, Raichle ME (2007) Intrinsic fluctuations within cortical systems account for intertrial variability in human behavior. Neuron 56:171–184. 10.1016/j.neuron.2007.08.023 [DOI] [PubMed] [Google Scholar]
- Gilden DL. (2001) Cognitive emissions of 1/f noise. Psychol Rev 108:33–56. 10.1037/0033-295X.108.1.33 [DOI] [PubMed] [Google Scholar]
- Gilden DL, Thornton T, Mallon MW (1995) 1/f noise in human cognition. Science 267:1837–1839. 10.1126/science.7892611 [DOI] [PubMed] [Google Scholar]
- Goldman RI, Stern JM, Engel J Jr, Cohen MS (2002) Simultaneous EEG and fMRI of the alpha rhythm. Neuroreport 13:2487–2492. 10.1097/00001756-200212200-00022 [DOI] [PMC free article] [PubMed] [Google Scholar]
- Grinsted A, Moore JC, Jevrejeva S (2004) Application of the cross wavelet transform and wavelet coherence to geophysical time series. Nonlin Processes Geophys 11:561–566. 10.5194/npg-11-561-2004 [DOI] [Google Scholar]
- Haegens S, Nácher V, Luna R, Romo R, Jensen O (2011) α oscillations in the monkey sensorimotor network influence discrimination performance by rhythmical inhibition of neuronal spiking. Proc Natl Acad Sci U S A 108:19377–19382. 10.1073/pnas.1117190108 [DOI] [PMC free article] [PubMed] [Google Scholar]
- Harmelech T, Malach R (2013) Neurocognitive biases and the patterns of spontaneous correlations in the human cortex. Trends Cogn Sci 17:606–615. 10.1016/j.tics.2013.09.014 [DOI] [PubMed] [Google Scholar]
- He BJ. (2013) Spontaneous and task-evoked brain activity negatively interact. J Neurosci 33:4672–4682. 10.1523/JNEUROSCI.2922-12.2013 [DOI] [PMC free article] [PubMed] [Google Scholar]
- He BJ, Zempel JM, Snyder AZ, Raichle ME (2010) The temporal structures and functional significance of scale-free brain activity. Neuron 66:353–369. 10.1016/j.neuron.2010.04.020 [DOI] [PMC free article] [PubMed] [Google Scholar]
- Hesselmann G, Kell CA, Eger E, Kleinschmidt A (2008) Spontaneous local variations in ongoing neural activity bias perceptual decisions. Proc Natl Acad Sci U S A 105:10984–10989. 10.1073/pnas.0712043105 [DOI] [PMC free article] [PubMed] [Google Scholar]
- Ivanov PC, Amaral LA, Goldberger AL, Havlin S, Rosenblum MG, Struzik ZR, Stanley HE (1999) Multifractality in human heartbeat dynamics. Nature 399:461–465. 10.1038/20924 [DOI] [PubMed] [Google Scholar]
- Jensen O, Mazaheri A (2010) Shaping functional architecture by oscillatory alpha activity: gating by inhibition. Front Hum Neurosci 4:186. 10.3389/fnhum.2010.00186 [DOI] [PMC free article] [PubMed] [Google Scholar]
- Klimesch W. (1997) EEG-alpha rhythms and memory processes. Int J Psychophysiol 26:319–340. 10.1016/S0167-8760(97)00773-3 [DOI] [PubMed] [Google Scholar]
- Laufs H, Kleinschmidt A, Beyerle A, Eger E, Salek-Haddadi A, Preibisch C, Krakow K (2003) EEG-correlated fMRI of human alpha activity. Neuroimage 19:1463–1476. 10.1016/S1053-8119(03)00286-6 [DOI] [PubMed] [Google Scholar]
- Linkenkaer-Hansen K, Nikouline VV, Palva JM, Ilmoniemi RJ (2001) Long-range temporal correlations and scaling behavior in human brain oscillations. J Neurosci 21:1370–1377. [DOI] [PMC free article] [PubMed] [Google Scholar]
- Mathewson KE, Gratton G, Fabiani M, Beck DM, Ro T (2009) To see or not to see: prestimulus phase predicts visual awareness. J Neurosci 29:2725–2732. 10.1523/JNEUROSCI.3963-08.2009 [DOI] [PMC free article] [PubMed] [Google Scholar]
- Mazaheri A, Jensen O (2008) Asymmetric amplitude modulations of brain oscillations generate slow evoked responses. J Neurosci 28:7781–7787. 10.1523/JNEUROSCI.1631-08.2008 [DOI] [PMC free article] [PubMed] [Google Scholar]
- Moosmann M, Ritter P, Krastel I, Brink A, Thees S, Blankenburg F, Taskin B, Obrig H, Villringer A (2003) Correlates of alpha rhythm in functional magnetic resonance imaging and near infrared spectroscopy. Neuroimage 20:145–158. 10.1016/S1053-8119(03)00344-6 [DOI] [PubMed] [Google Scholar]
- Nikulin VV, Linkenkaer-Hansen K, Nolte G, Lemm S, Müller KR, Ilmoniemi RJ, Curio G (2007) A novel mechanism for evoked responses in the human brain. Eur J Neurosci 25:3146–3154. 10.1111/j.1460-9568.2007.05553.x [DOI] [PubMed] [Google Scholar]
- Osipova D, Hermes D, Jensen O (2008) Gamma power is phase-locked to posterior alpha activity. PLoS ONE 3:e3990. 10.1371/journal.pone.0003990 [DOI] [PMC free article] [PubMed] [Google Scholar]
- Palva JM, Zhigalov A, Hirvonen J, Korhonen O, Linkenkaer-Hansen K, Palva S (2013) Neuronal long-range temporal correlations and avalanche dynamics are correlated with behavioral scaling laws. Proc Natl Acad Sci U S A 110:3585–3590. 10.1073/pnas.1216855110 [DOI] [PMC free article] [PubMed] [Google Scholar]
- Pfurtscheller G. (1989) Spatiotemporal analysis of alpha frequency components with the ERD technique. Brain Topogr 2:3–8. 10.1007/BF01128838 [DOI] [PubMed] [Google Scholar]
- Rihs TA, Michel CM, Thut G (2009) A bias for posterior α-band power suppression versus enhancement during shifting versus maintenance of spatial attention. Neuroimage 44:190–199. 10.1016/j.neuroimage.2008.08.022 [DOI] [PubMed] [Google Scholar]
- Sadaghiani S, Kleinschmidt A (2016) Brain networks and α oscillations: structural and functional foundations of cognitive control. Trends Cogn Sci 20:805–817. 10.1016/j.tics.2016.09.004 [DOI] [PubMed] [Google Scholar]
- Sadaghiani S, Hesselmann G, Kleinschmidt A (2009) Distributed and antagonistic contributions of ongoing activity fluctuations to auditory stimulus detection. J Neurosci 29:13410–13417. 10.1523/JNEUROSCI.2592-09.2009 [DOI] [PMC free article] [PubMed] [Google Scholar]
- Sadaghiani S, Hesselmann G, Friston KJ, Kleinschmidt A (2010) The relation of ongoing brain activity, evoked neural responses, and cognition. Front Syst Neurosci 4:20. 10.3389/fnsys.2010.00020 [DOI] [PMC free article] [PubMed] [Google Scholar]
- Sadaghiani S, Scheeringa R, Lehongre K, Morillon B, Giraud AL, D'Esposito M, Kleinschmidt A (2012) α-Band phase synchrony is related to activity in the fronto-parietal adaptive control network. J Neurosci 32:14305–14310. 10.1523/JNEUROSCI.1358-12.2012 [DOI] [PMC free article] [PubMed] [Google Scholar]
- Scheeringa R, Mazaheri A, Bojak I, Norris DG, Kleinschmidt A (2011) Modulation of visually evoked cortical fMRI responses by phase of ongoing occipital alpha oscillations. J Neurosci 31:3813–3820. 10.1523/JNEUROSCI.4697-10.2011 [DOI] [PMC free article] [PubMed] [Google Scholar]
- Scheeringa R, Petersson KM, Kleinschmidt A, Jensen O, Bastiaansen MC (2012) EEG α power modulation of fMRI resting-state connectivity. Brain Connect 2:254–264. 10.1089/brain.2012.0088 [DOI] [PMC free article] [PubMed] [Google Scholar]
- Theiler J, Eubank S, Longtin A, Galdrikian B, Doyne Farmer J (1992) Testing for nonlinearity in time series: the method of surrogate data. Physica D: Nonlin Phenomena 58:77–94. 10.1016/0167-2789(92)90102-S [DOI] [Google Scholar]
- Thut G, Nietzel A, Brandt SA, Pascual-Leone A (2006) α-Band electroencephalographic activity over occipital cortex indexes visuospatial attention bias and predicts visual target detection. J Neurosci 26:9494–9502. 10.1523/JNEUROSCI.0875-06.2006 [DOI] [PMC free article] [PubMed] [Google Scholar]
- Turcotte DL, Malamud BD, Guzzetti F, Reichenbach P (2002) Self-organization, the cascade model, and natural hazards. Proc Natl Acad Sci U S A 99:2530–2537. 10.1073/pnas.012582199 [DOI] [PMC free article] [PubMed] [Google Scholar]
- Van de Ville D, Britz J, Michel CM (2010) EEG microstate sequences in healthy humans at rest reveal scale-free dynamics. Proc Natl Acad Sci U S A 107:18179–18184. 10.1073/pnas.1007841107 [DOI] [PMC free article] [PubMed] [Google Scholar]
- Varela FJ, Toro A, John ER, Schwartz EL (1981) Perceptual framing and cortical alpha rhythm. Neuropsychologia 19:675–686. 10.1016/0028-3932(81)90005-1 [DOI] [PubMed] [Google Scholar]
- Voytek B, Kramer MA, Case J, Lepage KQ, Tempesta ZR, Knight RT, Gazzaley A (2015) Age-related changes in 1/f neural electrophysiological noise. J Neurosci 35:13257–13265. 10.1523/JNEUROSCI.2332-14.2015 [DOI] [PMC free article] [PubMed] [Google Scholar]
- Wang XJ. (2010) Neurophysiological and computational principles of cortical rhythms in cognition. Physiol Rev 90:1195–1268. 10.1152/physrev.00035.2008 [DOI] [PMC free article] [PubMed] [Google Scholar]
- Zempel JM, Politte DG, Kelsey M, Verner R, Nolan TS, Babajani-Feremi A, Prior F, Larson-Prior LJ (2012) Characterization of scale-free properties of human electrocorticography in awake and slow wave sleep states. Front Neurol 3:76. 10.3389/fneur.2012.00076 [DOI] [PMC free article] [PubMed] [Google Scholar]
- Zhivomirov H. (2015) Arbitrary spectral slope noise generation with Matlab implementation, file exchange, MATLAB central. Mathworkscom. https://uk.mathworks.com/matlabcentral/fileexchange/48628-arbitrary spectral slope-noise-generation-with-matlab-implementation. Accessed September 10, 2017.
- Zilber N, Ciuciu P, Gramfort A, Azizi L, van Wassenhove V (2014) Supramodal processing optimizes visual perceptual learning and plasticity. Neuroimage 93:32–46. 10.1016/j.neuroimage.2014.02.017 [DOI] [PubMed] [Google Scholar]