

Abstract
Synaptic AMPAR expression controls the strength of excitatory synaptic transmission and plasticity. An excess of synaptic AMPARs leads to epilepsy in response to seizure-inducible stimulation. The appropriate regulation of AMPARs plays a crucial role in the maintenance of the excitatory/inhibitory synaptic balance; however, the detailed mechanisms underlying epilepsy remain unclear. Our previous studies have revealed that a key modification of AMPAR trafficking to and from postsynaptic membranes is the reversible, posttranslational S-palmitoylation at the C-termini of receptors. To clarify the role of palmitoylation-dependent regulation of AMPARs in vivo, we generated GluA1 palmitoylation-deficient (Cys811 to Ser substitution) knock-in mice. These mutant male mice showed elevated seizure susceptibility and seizure-induced neuronal activity without impairments in synaptic transmission, gross brain structure, or behavior at the basal level. Disruption of the palmitoylation site was accompanied by upregulated GluA1 phosphorylation at Ser831, but not at Ser845, in the hippocampus and increased GluA1 protein expression in the cortex. Furthermore, GluA1 palmitoylation suppressed excessive spine enlargement above a certain size after LTP. Our findings indicate that an abnormality in GluA1 palmitoylation can lead to hyperexcitability in the cerebrum, which negatively affects the maintenance of network stability, resulting in epileptic seizures.
SIGNIFICANCE STATEMENT AMPARs predominantly mediate excitatory synaptic transmission. AMPARs are regulated in a posttranslational, palmitoylation-dependent manner in excitatory synapses of the mammalian brain. Reversible palmitoylation dynamically controls synaptic expression and intracellular trafficking of the receptors. Here, we generated GluA1 palmitoylation-deficient knock-in mice to clarify the role of AMPAR palmitoylation in vivo. We showed that an abnormality in GluA1 palmitoylation led to hyperexcitability, resulting in epileptic seizure. This is the first identification of a specific palmitoylated protein critical for the seizure-suppressing process. Our data also provide insight into how predicted receptors such as AMPARs can effectively preserve network stability in the brain. Furthermore, these findings help to define novel key targets for developing anti-epileptic drugs.
Keywords: AMPAR; palmitoylation; GluA, seizure; epilepsy
Introduction
Glutamate is the major excitatory neurotransmitter in the mammalian CNS. Among the ionotropic glutamate receptors (iGluRs), AMPA-type receptors mediate the majority of the fast component of EPSCs (Seeburg, 1993; Hollmann and Heinemann, 1994). The expression of postsynaptic AMPARs is closely linked to excitatory synaptic strength (Shepherd and Huganir, 2007; Heine et al., 2008). Therefore, quantitative control of synaptic AMPAR number is critical for basal synaptic transmission, mammalian synaptic plasticity, and higher brain function (Collingridge et al., 2004; Shepherd and Huganir, 2007; Kessels and Malinow, 2009; Huganir and Nicoll, 2013). The AMPAR is composed of four subunits, GluA1, GluA2, GluA3, and GluA4 (also known as GluR1–4, GluRA–D, or GluRα1–4). The subunit composition of AMPARs determines the routes of AMPAR trafficking, so GluA1 is dominant over others during activity-dependent AMPAR exocytosis to synapses. GluA2 is the primary determinant during endocytosis from synapses (Anggono and Huganir, 2012). In these processes, AMPAR trafficking to and from synapses is dynamically regulated by posttranslational protein modifications (Jiang et al., 2006; Anggono and Huganir, 2012; Lussier et al., 2015). Many studies have shown that the protein phosphorylation of AMPAR subunits plays a critical role in the regulation of synaptic plasticity, such as LTP and LTD or hyperexcitability (Rakhade et al., 2012). AMPAR phosphorylation modulates the properties of AMPAR ion channels and the membrane trafficking of AMPARs to the postsynaptic membrane (Malinow and Malenka, 2002; Derkach et al., 2007; Shepherd and Huganir, 2007).
Another key modification of AMPARs is the covalent attachment of the lipid palmitate at their intracellular cysteine residues via thioester bonds. This process of posttranslational protein S-palmitoylation is labile and reversible, like phosphorylation (Resh, 2006; Linder and Deschenes, 2007; Fukata and Fukata, 2010). Generally, palmitoylation acts as a sticky tag that can direct proteins, including many neuronal receptors and ion channels, to specific regions of the plasma membrane or specific intracellular membranes or vesicles (Kang et al., 2008; Shipston, 2011; Borroni et al., 2016). We have previously reported that palmitoylation regulates the synaptic expression and localization of AMPARs (Hayashi et al., 2005; Lin et al., 2009; Thomas et al., 2012, 2013; Thomas and Hayashi, 2013). The mammalian AMPAR subunits GluA1–4 are palmitoylated at two distinct sites: the transmembrane (TMD) 2 and C-terminal domains (Hayashi et al., 2005; Hayashi, 2014). TMD 2 palmitoylation causes an accumulation of receptors in the Golgi apparatus, which appears to act as a “quality control” mechanism to ensure correct receptor maturation. In contrast, the C-terminal palmitoylation site on AMPARs is implicated in the “quantitative regulation” of synaptic receptor number, which is associated with complex neuronal events. Palmitoylation on the C-terminal domain inhibits GluA1 interaction with the 4.1N protein, which stabilizes AMPAR expression on the cell surface and regulates endocytosis and AMPAR insertion in LTP (Shen et al., 2000; Hayashi et al., 2005; Lin et al., 2009). Furthermore, palmitoylation and depalmitoylation of the AMPAR is regulated in an activity-dependent manner (Hayashi et al., 2005; Kang et al., 2008), which is induced by cocaine or a high-fat diet (Van Dolah et al., 2011; Spinelli et al., 2017). In summary, palmitoylation appears uniquely suited to create dynamic control of synaptic expression and intracellular trafficking of AMPARs. Studies have revealed the importance of posttranslational AMPAR palmitoylation; however, its role is yet to be elucidated in vivo.
Here, we generated mice lacking the C-terminal palmitoylation site of GluA1 at Cys811 (C811) and demonstrated that a deficiency in palmitoylation enhanced seizure susceptibility and LTP-induced spine enlargements without affecting gross brain structure and normal excitatory synaptic transmission in knock-in homozygote mice. Our findings presented here indicate that an abnormality in palmitoylation-dependent regulation of the AMPARs may lead to hyperexcitability that reduces the maintenance of network stability, resulting in epileptic seizures.
Materials and Methods
Generation of palmitoylation-deficient GluA1CS mice and experimental animals.
To construct the targeting vector, we identified a bacterial artificial chromosome (BAC) clone RP24-223G10 (BACPAC Resources Center; RRID:SCR_007215) prepared from the C57BL/6 strain containing exon 16 of GluA1 using basic local alignment search tool searches against the mouse genome sequence database. The targeting vector comprised 5′-side (5.3 kb) and 3′-side (6.3 kb) arms with PGK–neomycin-resistant (neo) flanked by two loxP sites and the diphtheria toxin gene (DT). The 3′-side arm contained exon 16 with the palmitoylation site Cys811 mutated to serine. In addition, a silent NruI site mutation was introduced just after the serine mutation site to distinguish the mutant and WT alleles. All mutation procedures were performed by QuikChange II site directed mutagenesis kit (Stratagene; RRID:SCR_013575). These fragments were introduced into the pDEST-DT by Red/ET recombination using BAC subcloning kit (Gene Bridges; RRID:SCR_000483). The targeting vector was linearized by NotI and electroporated into embryonic stem (ES) cell line RENKA derived from C57BL/6N strain, as described previously (Mishina and Sakimura, 2007). Then, G-418-resistant clones were picked as positive clones and confirmed by Southern blot hybridization analysis using outer probes. PCR-amplified 231 and 243 bp fragments and 635 bp PstI fragments from pLFNeo were used as 5′, 3′, and neo probes, respectively. The 5′ and 3′ probes were amplified by PCR using 5′-GGCCAGAAGGGGAGGTAGCC-3′ and 5′-AGGACATCGGCTGGCACTGA-3′, 5′-TGGGGTTGGAGTGAGTGTCA-3′ and 5′-TAAAATCCATGATTCAGACA-3′ as primers, respectively. Recombinant ES cells were injected into eight-cell stage embryos of the CD-1 mouse strain. The embryos were cultured to blastocysts and transferred to a pseudopregnant CD-1 mouse uterus. The resulting chimera mice were mated to C57BL/6N mice to yield heterozygous [GluA1 WT/cysteine to serine (CS)–Neo(+)] mice. These mice were crossed to CAG-Cre (backcrossed six times to C57BL/6) to remove the neo cassette from the germline through Cre/loxP-mediated excision. After confirmation of neo excision by Southern blot analysis and PCR, homozygotes CS/CS mice were obtained by crossing heterozygous GluA1 WT/CS pairs. Mutants with no Cre gene were used for subsequent breeding. The mutant mice were backcrossed onto the C57BL/6N strain at least five times. The GluA1 CS allele was identified by PCR using the primers 5′-CTCTGAGCCTGAGCAATGTG-3′ and 5′-CTGCCTTCTGCTGTGTTCAA-3′. The intercross of heterozygotes resulted in the production of WT, heterozygous, and homozygous offspring at the expected 1:2:1 Mendelian ratio. Only male mice were used for subsequent analyses.
C57BL/6N mice were obtained from Charles River Laboratories. CAG-Cre mice were a kind gift from Dr. J. Miyazaki. Thy1-yellow fluorescent protein (YFP)-H transgenic mice were purchased from the Jackson Laboratory and backcrossed onto the C57BL/6J strain 15 times, followed by the C57BL/6N strain at least eight times. Mice were fed with standard laboratory chow and water in standard animal cages under a 12 h light/dark cycle.
All animal care and experiments were performed in accordance with the regulations and institutional guidelines of Niigata University, the University of Tokyo, the National Center of Neurology and Psychiatry (NCNP), the Japanese Pharmacological Society, and the Japan Neuroscience Society. The technical protocols for animal experiments in this study were approved by the institutional review committees of the Graduate School of Medicine, the University of Tokyo, and National Institute of Neuroscience, NCNP.
Drugs and antibodies.
Pentylenetetrazole (PTZ), valproic acid sodium salt (VPA), phenobarbital (PB), and diazepam (DZP) were purchased from Sigma-Aldrich; RRID:SCR_008988. Anti-GluA1 (ab31232, Abcam; RRID:AB_2113447), anti-GluA1 phospho-Ser831 (04-823, Millipore; RRID:AB_1977218), anti-GluA1 phospho-Ser845 (04-1073, Millipore; RRID:AB_1977219), anti-GluA2 (MAB397, Millipore; RRID:AB_2113875), anti-GluA2/3 (07-598, Millipore; RRID:AB_310741), anti-GluN1 (ab17345, Abcam; RRID:AB_776808), anti-GluN2A (AB1555P, Millipore; RRID:AB_90770), anti-GluN2B (ab65783, Abcam; RRID:AB_1658870), anti-PSD-95 (MA1-045, Thermo Fisher Scientific; RRID:AB_325399), anti-GAPDH (5174, Cell signaling technology; RRID:AB_10622025), anti-c-Fos (C-10, Santa Cruz Biotechnology; RRID:AB_10610067), and anti-Arc (OP1/2MBL-2012B and OP2-2012, H.O.) antibodies were used for the experiments.
Biochemical analysis.
Hippocampi or cortices were directly lysed in SDS sample buffer. Lysates were separated by SDS-PAGE followed by Western blotting with each antibody. Reactive bands were visualized with the ECL Prime Western Blotting Detection System and chemiluminescent images were acquired using the ImageQuant LAS 4000 mini imager (GE Healthcare; RRID:SCR_000004). Palmitoylation of AMPAR subunits, NMDAR subunits, and scaffolding MAGUK proteins were assessed using the acyl-biotinyl exchange (ABE) method (Drisdel et al., 2006; Kang et al., 2008), as described previously (Wan et al., 2007). Briefly, brain samples were directly denatured in lysis buffer containing 25 mm HEPES, pH 7.4, 150 mm NaCl, 2% SDS, 5 mm EDTA, protease inhibitor mixture (Roche), and 20 mm methyl methanethiosulfonate (MMTS) to block free thiols and acetone precipitation was used to move between steps. Following lysis, excess MMTS was removed by acetone precipitation and pellets were resuspended in buffer containing 4% (w/v) SDS buffer (4SB). Samples were diluted and incubated for 1 h in either 0.7 m hydroxylamine (NH2OH, pH 7.4) to cleave thioester bonds or 50 mm Tris, pH 7.4. After acetone precipitation to remove hydroxylamine or Tris, pellets were resuspended in 4SB and incubated for 1 h in 50 mm Tris, pH 7.4, containing 0.2 mm sulfhydryl-reactive biotin-HPDP (Cayman Chemical; RRID:SCR_008945) at room temperature. To remove unreacted HPDP–biotin, acetone precipitations was performed and pellets were resuspended in 4SB. SDS was then diluted to 0.1% (w/v) and biotinylated proteins in the samples were affinity purified using Streptavidin Mag Sepharose (GE Healthcare; RRID:SCR_000004). SDS sample buffer was used to cleave HPDP–biotin and to release purified proteins from the beads. The released proteins in the supernatant were denatured in SDS sample buffer and processed for Western blotting.
Histology and immunohistochemistry.
Brains were perfused and fixed with 4% (for Nissl staining and c-Fos expression) or 2% (Arc expression) paraformaldehyde (PFA) in PBS and transferred to 10%, 20%, and 30% sucrose in PBS solution step by step every 24 h. After tissues were embedded in optimal cutting temperature (OCT) compound, cryosections were cut at 20 μm thickness unless otherwise noted. Sagittal or coronal sections were stained with cresyl violet and observed under the light microscope for Nissl staining or processed for immunohistochemistry using anti-c-Fos and anti-Arc antibodies with DAPI. Confocal z-stack images of dendritic segments (0.3–0.8 μm intervals, 5–10 image sections/stack) acquired with the LSM710 using a 63× objective (numerical aperture 1.4, oil) were projected onto single planes by summation.
Electrophysiology.
Mouse brain slices were prepared as described previously with minor modifications (Zhao et al., 2011; Ting et al., 2014). Mice were anesthetized with sevoflurane and brains were quickly removed. Hippocampal slices were prepared using a linear slicer Pro 7 (Dosaka EM) in an ice-cold solution (in mm: 98 Choline-Cl, 2.5 KCl, 1.25 NaH2PO4, 30 NaHCO3, 20 HEPES, 25 glucose, 2 thiourea, 5 Na-ascorbate, 2.5 Na-pyruvate, 0.5 CaCl2, and 10 MgSO4). After sectioning, the slices were recovered with the cutting medium for 10 min at 32°C and then stored for at least 1 h at room temperature in a solution containing the following (in mm): 98 NaCl, 2.5 KCl, 1.25 NaH2PO4, 30 NaHCO3, 20 HEPES, 25 glucose, 2 thiourea, 5 Na-ascorbate, 2.5 Na-pyruvate, 2 CaCl2, and 2 MgSO4. Each slice was then transferred to the recording chamber and perfused (∼3 ml/min) with artificial CSF (ACSF) containing the following (in mm): 125 NaCl, 2.5 KCl, 26 NaHCO3, 1.25 NaH2PO4, 4 CaCl2, 4 MgSO4 and 10 glucose at 28–32°C. All external solutions were equilibrated with 95% O2 and 5% CO2, pH 7.4. The electrophysiological signal was acquired using a MultiClamp 700B, Digidata 1440, and pClamp 10 (Molecular Devices; RRID:SCR_011323). Liquid junction potential and series resistance were left uncompensated. The series resistance was monitored frequently during recordings and neurons showing >30 MΩ and a large drift (20%) in series resistance were excluded from the analysis. For voltage-clamp recordings, patch pipettes were filled with Cs+-based intracellular solution containing the following (in mm): 135 CsMeSO4, 5.0 TEA-Cl, 1 MgCl2, 0.5 EGTA, 3.0 Mg-ATP, 0.3 Na-GTP, 10 Na-phosphocreatine, 2 QX314, and 10 HEPES, pH 7.2, and the resistance was 4–6 MΩ. For the recording of miniature EPSCs (mEPSCs), neurons were held at −70 mV in the presence of 1 μm tetrodotoxin (TTX) and 100 μm pictrotoxin in the bath solution. The results were analyzed using pClamp 10 software (Molecular Devices; RRID:SCR_011323). A bipolar stimulating electrode (FHC) was used to evoke baseline EPSC of −200 to −400 pA at −70 mV. For measurement of AMPA/NMDA ratios, bath solution containing 100 μm pictrotoxin was used. AMPA/NMDA ratios were calculated as the ratio of peak current at −70 mV to the current at 80 ms after stimulus onset at +40 mV. For AMPAR rectification experiments, we added 100 μm DL-AP5 and 100 μm spermine to the external and internal solution, respectively. The rectification index was calculated as the ratio of peak current at −70 mV and +50 mV. For current-clamp recordings, patch pipettes were filled with a K+-based intracellular solution containing the following (in mm): 135 K-gluconate, 5.0 KCl, 1 MgCl2, 0.5 EGTA, 3.0 Mg-ATP, 0.3 Na-GTP, 10 Na-phosphocreatine, and 10 HEPES, pH 7.2, and the resistance was 4–6 MΩ. To measure the ratio of EPSPs to IPSPs, the resting membrane potential of patched neurons was set to ∼−60 mV by current injection. Schaffer collaterals were stimulated using a bipolar electrode and the amplitudes of evoked EPSPs were adjusted to ∼10 mV. The EPSP/IPSP ratio was calculated as the maximum EPSP amplitude divided by the IPSP amplitude.
Chemical LTP (cLTP).
cLTP was induced as described previously with some modifications (Liao et al., 2001; Lu et al., 2001; Passafaro et al., 2001; Park et al., 2004; Kopec et al., 2006, 2007). Briefly, 400 μm hippocampal slices were prepared from 3- to 4-week-old Thy1-YFP (WT) or GluA1 CS/CS; Thy1-YFP (CS/CS) mice in the cutting buffer containing the following (in mm): 20 HEPES, 30 NaHCO3, 1.25 NaH2PO4, 10 MgSO4, 2.5 KCl, 0.5 CaCl2, 160 sucrose, 25 d-glucose, 2.5 sodium pyruvate, 2.5 sodium ascorbate, and 1 N-acetyl-l-cysteine (NAC), pH 7.4, on ice. Then, slices were recovered in the incubation buffer containing the following (in mm): 20 HEPES, 30 NaHCO3, 1.25 NaH2PO4, 100 NaCl, 2.5 KCl, 2 CaCl2, 2 MgSO4, 25 d-glucose, 2.5 sodium pyruvate, 2.5 sodium ascorbate, and 1 NAC, pH 7.4, at room temperature for 1–2 h, followed by the incubation in ACSF containing the following (in mm): 26 NaHCO3, 1 NaH2PO4, 125 NaCl, 4.4 KCl, 2.5 CaCl2, 1.5 MgSO4, and 10 d-glucose at 30°C for 30 min. cLTP induction was performed in Mg2+-free ACSF containing the following (in mm): 26 NaHCO3, 1.2 KH2PO4, 124 NaCl, 4 CaCl2, 3 KCl, and 10 d-glucose with 200 μm glycine and 100 μm picrotoxin at 30°C for 30 min. Baseline controls were acquired in Mg2+-free ACSF with 200 μm glycine, 100 μm picrotoxin, and 100 μm DL-AP5, a NMDAR blocker, at 30°C for 30 min incubation. All solutions were continuously aerated with 5% CO2 and 95% O2 bubbling. Slices were fixed with 4% PFA in PBS for overnight and transferred to 30% sucrose in PBS solution. After the tissue was embedded in OCT compound, cryosections were recut at 30 μm thickness. Spine volumes were quantified as described previously (Matsuzaki et al., 2001, 2004). Background signals were subtracted from the projected images and YFP fluorescence signals showing spine morphology on clearly separated apical dendrites of CA1 pyramidal neurons were selected for blind analysis (see “Histology and immunohistochemistry” section). For intensity comparisons, mean fluorescent intensities and the area of individual spines were measured using ImageJ (RRID:SCR_003070).
Seizure observation and kindling procedure.
PTZ was administered intraperitoneally at a dose of 20–80 mg/kg. We used the PTZ-induced kindling model as described previously with some modifications (Schröder et al., 1993; Becker et al., 1995). Briefly, C57BL/6N and CS/CS mice were intraperitoneally injected with PTZ (30 mg/kg) once every 48 h for 12 total injections and mice showing more than three consecutive stage 4 seizures were used as kindled mice. Control mice were injected with PBS. Phenobarbital or diazepam was administered intraperitoneally for the indicated periods before PTZ injection. We examined seizure events during the 20 min observation period after injection. Seizure intensity was scored as follows: stage 0, no response; stage 1, ear, mouth, and facial twitching; stage 2, head nodding and convulsive twitching axially through the body; stage 3, limbic myoclonus; stage 4, rearing demonstrated by standing on hind legs and wild jumping; stage 5, generalized tonic-clonic seizures; and stage 6, death. Two-way repeated-measures ANOVA followed by Fisher's LSD test was used for the kindling experiment and the Mann–Whitney test was used to compare two groups.
Experimental design and statistical analysis.
The design of each experiment and statistical analysis methods used were described in each of the experimental sections. Statistical analyses were performed using Prism 6 (GraphPad Software; RRID:SCR_002798) and Excel (Microsoft; RRID:SCR_016137). All data are expressed as mean ± SEM unless indicated otherwise.
Results
Generation of GluA1 C-terminal palmitoylation mutant mice
To elucidate directly the role of GluA1 palmitoylation in the regulation of synaptic function in vivo, we analyzed a line of GluA1 non-palmitoylation mutant mice that lack the C-terminal palmitoylation site. Mice were generated by introducing a mutation at C811 in the GluA1 gene using homologous recombination techniques (knock-in). A targeting vector encoding CS substitution at C811 at exon 16 was constructed with a loxP-flanked neo marker at intron 15 (Fig. 1A and Fig. 1-1A). Correctly targeted ES cells containing the C811S mutation and neo cassette were injected into blastocysts. Chimera mice carrying the mutant allele were bred to C57BL/6N mice to generate heterozygous mice [GluA1 WT/CS-Neo(+)]. Heterozygous mice were then bred to CAG-Cre mice to delete the neo cassette from the germline via the Cre-loxP system (GluA1 WT/CS) and then intercrossed to produce homozygous mice (GluA1 CS/CS, hereinafter called CS/CS). The success of these procedures was confirmed by Southern blot and PCR analysis (Fig. 1-1B–D). Both heterozygous and homozygous GluA1 C811S mutant mice appeared to grow normally, have healthy characteristics, breed normally, and have similar fertility to WT littermate mice.
Figure 1.
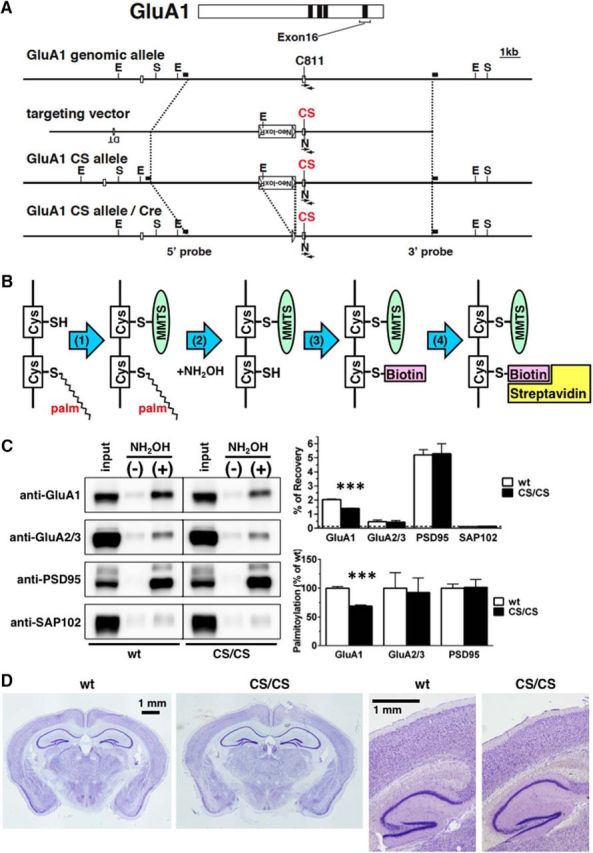
Generation of GluA1 C-terminal palmitoylation deficient mice. A, Top, Schematic representation of GluA1 protein structure. Black bars indicate four transmembrane domains. Exon 16 encoding the C-terminal palmitoylation site (C811) is shown. Middle, Genomic DNA structure with the relevant restriction enzyme sites; E, EcoRI; S, ScaI. White boxes represent exon 15 and 16. Bottom, Targeting vector and targeted genes. The Ser substitution for Cys811 (CS) is marked in red. Neo-loxP, PGK promoter neomycin-resistance gene with loxP sequence at both sides; arrows, PCR primers; N, silent NruI site. The 5′ and 3′ probes for Southern blot analysis, which contain the genomic sequence outside of the targeting vector, are depicted as black bars. B, Schematics of the ABE assay. The ABE assay consists of four steps, as follows: (1) blocking of free thiol (sulfhydryl groups, SH, on Cys residues by MMTS; (2) chemical cleavage of thioester linkage with hydroxylamine (NH2OH); (3) specific labeling with biotin-conjugated SH attacking reagent; and (4) purification of biotin-labeled (corresponding to palmitoylated) proteins with streptavidin-conjugated beads. C, Reduced palmitoylation at Cys811 in GluA1 CS/CS mice. Representative blots of protein expression and palmitoylation in the cerebrum lysate prepared from WT and GluA1 CS/CS (CS/CS) mice (left) showed that palmitoylation of GluA1, but not of other proteins, was specifically reduced in CS/CS mice. Experiments were performed in triplicate (n = 3) and palmitoylation levels were analyzed using two approaches: percentage of recovery (right, top) and normalized levels to WT mice (right, bottom). White bars are WT mice and black bars are CS/CS mice. Error bars indicate SEM. ***p < 0.001, t test. D, Nissl-stained sections across the hippocampus and cortex from WT or CS/CS mice showing no gross abnormalities in the cytoarchitecture (left: typical coronal sections; right, typical sagittal sections). Scale bar, 1 mm. See also Extended Figure 1-1.
Generation of GluA1 C-terminal palmitoylation deficient mice.
GluA1 C-terminal CS mutation and silent NruI site. The serine substitution for Cys811 (C811) and silent NruI site to distinguish mutation are shown.
Southern blot analysis of genomic DNA samples from ES cells. Left: digestion with EcoRI and hybridized with 5’ probe, middle: digestion with EcoRI and hybridized with 3’ probe, right: digestion with ScaI and hybridized with 3’ probe. Wild-type (wt/wt) and GluA1CS heterozygote (wt/CS-Neo(+)) are indicated.
Genomic Southern blot from mice tail samples digested with ScaI and hybridized with 3’ probe. Chimera and Neo-loxP deletion by mating with CAG-Cre mice (chimera/Cre) are shown.
PCR analysis of mice tail samples from wild-type (wt/wt), GluA1CS heterozygote (wt/CS) and GluA1CS homozygote (CS/CS).
Macroscopic brain structure. Nissl-stained coronal sections from anterior to posterior in wt or CS/CS mice, showing no gross abnormalities in the cytoarchitecture. Scale bar, 1 mm.
Download Figure 1-1, TIF file (2.9MB, tif)
First, we confirmed that the mutation of the palmitoylation site by ABE assay using specific antibodies (Fig. 1B). Decreased levels of GluA1 palmitoylation were found in the whole brain of CS/CS mice (68.9 ± 1.9% compared with WT control, n = 3 mice, respectively; p < 0.001; t test; Fig. 1C). The residual signals likely represented palmitoylation at Cys585 on TMD 2, which is intact in CS/CS mice. The palmitoylation of other AMPAR GluA2/GluA3 subunits and the major synaptic scaffolding protein, PSD95, were unaffected in CS/CS mice, which ensured that GluA1 C811 palmitoylation was specifically absent without affecting other palmitoylated synaptic proteins. A non-palmitoylated synaptic scaffolding protein, SAP102, was used to determine background level of palmitoylation. In addition, Nissl-stained brain sections from CS/CS mice did not show any gross abnormalities in cytoarchitecture compared with WT mice (Fig. 1D and Fig. 1-1E). Together, these results indicate that the lack of GluA1 C811 palmitoylation site does not alter brain gross anatomy or general synaptic palmitoylation.
Augmented GluA1 phosphorylation at Ser 831 and increased protein expression of GluA1 in GluA1 C811S mutant mice
Next, we examined the protein expression and phosphorylation of the major AMPAR subunits, GluA1, GluA2, and GluA3; the iGluR NMDAR subunits GluN1, GluN2A, and GluN2B (also called NR1/GluRζ1, NR2A/GluRε1, and NR2B/GluRε2); and PSD95 in the adult hippocampus. Western blot analysis showed that there was no significant difference in expression in these synaptic proteins between WT and CS/CS mice (Fig. 2A). Furthermore, GluA1 phosphorylation was increased at Ser831 (S831), but not Ser845, in CS/CS mice (Fig. 2B). At several phosphorylation sites in GluA1, phosphorylation at S831 is increased by LTP induction (Jiang et al., 2006; Derkach et al., 2007; Shepherd and Huganir, 2007; Kessels and Malinow, 2009; Lussier et al., 2015). The expression level of GluA1 was slightly increased in CS/CS mice, but this was not statistically different (107.9 ± 16.5% compared with WT, n = 8 mice, respectively; p = 0.20; t test). GluA1 protein expression was increased in the cortex of adult CS/CS mice compared with WT mice (Fig. 2C). These data suggest that GluA1 function is consistently upregulated in the cerebrum of CS/CS mice.
Figure 2.

Protein expression and phosphorylation of iGluR subunits in the hippocampus and cortex of GluA1 C811S mutant mice. A, Protein expression of AMPAR subunits, NMDAR subunits, and PSD-95 in hippocampal lysates from WT (white bars) and CS/CS (black bars) mice. Typical representative blots (left) and protein expression levels are shown (right, WT: n = 8, CS/CS: n = 8). B, GluA1 phosphorylation at S831 and S845 in hippocampus from WT (white bars) and CS/CS (black bars) mice. Typical blots are shown as representative samples (left). Phosphorylation levels are compared with WT (middle) and those normalized to GluA1 protein expression are shown (right) (WT: n = 8, CS/CS: n = 8). C, Protein expression levels of AMPAR subunits, NMDAR subunits, and PSD-95 in cortical lysates from WT (white bars) and CS/CS (black bars) mice. Typical blots as representative (left) and protein expression levels are shown (right, WT: n = 8, CS/CS: n = 8). Error bars indicate SEM. *p < 0.05, t test.
Normal synaptic transmission in GluA1 C811S mutant mice
Next, we examined basal synaptic transmission mediated by AMPARs in CS/CS mice. To characterize basal synaptic properties, we performed a series of electrophysiological experiments using acute hippocampal slices. First, the input–output relationships of field EPSPs (fEPSPs) were analyzed by the extracellular field recording at hippocampal CA3–CA1 synapses (Fig. 3A). The results did not show any difference in the input–output relationship between WT and CS/CS littermate mice (between genotypes: F(1,28) = 0.88, p = 0.36; two-way repeated-measures ANOVA). In addition, paired-pulse facilitation, an index of presynaptic function, was also measured (Fig. 3B). We found no obvious changes between WT and CS/CS mice in the paired-pulse ratio (between genotypes: F(1,28) = 3.39, p = 0.08; two-way repeated-measures ANOVA). These results indicated that basal synaptic strength and presynaptic release function of CA3-CA1 synapses was almost normal in CS/CS mice. To further explore any potential changes in basal synaptic transmission, we measured AMPAR-mediated miniature EPSCs (mEPSCs) by whole-cell patch-clamp recordings (Fig. 3C) and found no significant differences in mean amplitude or frequency of mEPSCs (amplitude: WT, 13.62 ± 1.06 pA, CS/CS, 15.00 ± 0.87 pA; frequency: WT 0.79 ± 0.08 Hz, CS/CS 0.80 ± 0.15 Hz; n = 15 cells from 4 WT mice, n = 13 cells from 4 CS/CS mice). Next, the ratio of AMPAR to NMDAR-mediated synaptic currents were measured to test whether the GluA1 C811S mutation led to alterations in NMDAR-mediated synaptic transmission (Fig. 3D). The results showed that there was no statistical difference between WT and CS/CS mice (9.90 ± 2.00, n = 19 cells from 4 WT mice; 9.12 ± 2.26, n = 19 cells from 4 CS/CS mice). To estimate the composition of calcium-permeable AMPARs and GluA1 homotetramers, we finally analyzed the current–voltage (I–V) relationship of AMPAR-mediated currents (Fig. 3E). CS/CS mice display identical I–V curves and similar rectification index to WT mice (0.33 ± 0.03, n = 13 cells from 4 WT mice; 0.31 ± 0.03, n = 11 cells from 4 CS/CS mice), which is typically reflected by the similar ratio of presence of the GluA1 homotetramers and GluA1/GluA2 heterotetramers composition. Collectively, these results suggest that the possible upregulation of GluA1 observed in CS/CS mice does not cause abnormalities in the basal synaptic transmission or membrane properties of CA1 pyramidal neurons (Fig. 3-1). Moreover, the GluA1 subunit lacking the C811 palmitoylation site was properly targeted to synapses, indicating that palmitoylation at C811 may not be critical for maintaining the steady-state level of receptors at synapses.
Figure 3.

Normal basal synaptic transmission in GluA1 C811S mutant mice. A, Input–output relationship. fEPSPs were recorded at different stimulation intensities by extracellular field recordings (left). To compare the input–output relationship, fEPSP slopes are plotted against stimulation intensities (right) (WT: n = 15 slices from 5 mice, CS/CS: n = 15 slices from 5 mice). B, Paired-pulse ratio (PPR). Responses to paired-pulse stimulation using different inter stimulus intervals were recorded (left). PPRs are plotted against interstimulus intervals (right) (WT: n = 15 slices from 5 mice, CS/CS: n = 15 slices from 5 mice). C, mEPSCs. CA1 pyramidal neurons were held at −70 mV and mEPSCs were recorded in the presence of picrotoxin and TTX (left). Amplitude and frequency of mEPSCs are shown (middle and right) (WT: n = 15 cells from 4 mice, CS/CS: n = 13 slices from 4 mice). D, AMPA/NMDA ratio. CA1 pyramidal neurons were held at either −70 mV or +40 mV and EPSCs evoked by the stimulation of Schaffer collateral were recorded (left). AMPA/NMDA ratios are calculated as described in experimental procedures (middle). Cumulative distributions of the AMPA/NMDA ratio are also shown (right) (WT: n = 19 cells from 4 mice, CS/CS: n = 19 slices from 4 mice). E, Rectification of AMPAR-EPSCs. Evoked AMPAR-EPSCs were recorded at various holding potentials (−70, −50, −30, −10, +10, +30, and +50 mV) (left). Normalized I–V plots are made from peak amplitude of AMPAR-EPSCs at various potential (middle). Rectification index are also plotted (right) (WT: n = 13 cells from 4 mice, CS/CS: n = 11 slices from 4 mice). See also Extended Figure 3-1.
Normal basic membrane properties in GluA1 C811S mutant mice. Whole-cell recordings were performed from a CA1 pyramidal neuron in current-clamp mode. Currents were injected, in a stepwise manner, to compare firing properties between wt and CS/CS mice.
Typical firing patterns at 200 pA are shown.
The average values for input/output relationship (between genotypes: F1, 28 = 2.29, p = 0.14 by two-way repeated measures ANOVA).
Resting potential (p = 0.57, t-test).
Input resistance (p = 0.23, t-test).
Action potential threshold (p = 0.25, t-test).
Action potential amplitude (p = 0.20, t-test).
Wt (white, n = 14 cells, N = 3 mice) and CS/CS (black, n = 16 cells, N = 3 mice) for all groups. n.s.: no statistical significance (p > 0.05). Error bars represent s.e.m. Download Figure 3-1, TIF file (2.9MB, tif)
Disturbed chemical LTP-induced spine volume enlargements in GluA1 C811S mutant mice
To assess whether a CS mutation affected neural circuits, we measured the synaptic excitatory/inhibitory (E/I) balance in acute hippocampal slices at the basal level. Schaffer collateral fibers were stimulated and the evoked EPSP–IPSP sequences were recorded in CA1 pyramidal neurons (Fig. 4A). As depicted, we could not find any difference in the EPSP/IPSP ratio between WT and CS/CS mice (4.40 ± 0.63, n = 14 cells from 3 WT mice; 3.09 ± 0.60, n = 17 cells from 3 CS/CS mice, p = 0.15 by t test).
Figure 4.

Normal LTP induction in GluA1 C811S mutant mice. A, E/I balances in CA1 pyramidal neurons. Representative traces of compound PSP in WT (left) and CS/CS (middle) mice are shown. The EPSP/IPSP ratios were calculated and plotted (right) (WT: n = 14 slices from 3 mice; CS/CS: n = 17 slices from 3 mice. B, Hippocampal CA3-CA1 LTP was induced using 4 trains of high-frequency stimulation (each train includes 100 Hz for 1 s, the intertrain interval is 10 s). fEPSP slopes (normalized to percentage of baseline) were plotted over time (left). Representative traces of fEPSPs before and after LTP induction are also shown. Scale bars, 0.5 mV, 10 ms. The summary plot of LTP (averaged for the last 10 min) level is shown in the right (WT: n = 11 slices from 5 mice, CS/CS: n = 11 slices from 5 mice). Error bars indicate SEM. C, Hippocampal CA3-CA1 LTD was induced by the bath application of 20 μm NMDA for 3 min. The normalized fEPSP slopes were plotted over time (left). Representative traces of fEPSP before and after chem-LTD induction are also shown. Scale bars, 0.5 mV, 10 ms. The summary plot of chem-LTD (averaged for last 10 min) level is shown on the right (WT: n = 11 slices from 5 mice, CS/CS: n = 11 slices from 5 mice). Error bars indicate SEM.
To further examine the physiological role of GluA1 C811 palmitoylation, we tested whether the GluA1 C811S mutation affected synaptic plasticity in CA1 pyramidal neurons. Our simple electrophysiological stimulation (100 pulses at 100 Hz × 4 trains) failed to detect a difference in LTP induction between WT and CS/CS mice (Fig. 4B, 182.8 ± 9.6%, n = 11 slices from 5 WT mice; 184.9 ± 15.6%, n = 11 slices from 5 CS/CS mice, p = 0.91 by t test). In addition, NMDA (20 μm, 3 min)-induced LTD showed no significant difference between WT and CS/CS mice (Fig. 4C, 62.5 ± 6.8%, n = 11 slices from 5 WT mice; 68.0 ± 10.1%, n = 11 slices from 5 CS/CS mice, p = 0.66 by t test).
Many studies have revealed a positive correlation among AMPAR currents, AMPAR synaptic expression, and spine volume (Holtmaat and Svoboda, 2009; Kasai et al., 2010). Lines of evidence indicate that volume expansion of dendritic spines highly correlates with LTP as well as surface expression of AMPARs. Previous studies have shown that the green fluorescence protein and its spectral variants are useful tools to analyze spine structures in transfected neurons. Thy1-YFP-H transgenic mice show sparse subset labeling in excitatory neurons (Feng et al., 2000). Therefore, we visualized spine structures in 3- 4-week-old Thy1-YFP (WT) mice or GluA1 CS/CS; Thy1-YFP (CS/CS) mice by observing endogenous YFP fluorescent signals and quantified stimulation-dependent changes of spine volume on the apical dendrites of CA1 pyramidal neurons in their hippocampal acute slices (Fig. 5A).
Figure 5.

Abnormal cLTP in GluA1 C811S mutant mice. A, Typical images of apical dendrites in CA1 pyramidal neurons, prepared from Thy1-YFP (WT) or GluA1 CS/CS; Thy1-YFP (CS/CS) mice with or without cLTP induction. Scale bar, 7.5 μm. B, Cumulative frequency of cLTP-induced spine volume enhancements [WT (control)]: n = 229 spines on 12 dendrites, n = 8 mice, [CS/CS (control)]: n = 236 spines on 9 dendrites, n = 8 mice, [WT (cLTP)]: n = 188 spines on 9 dendrites, n = 8 mice, [CS/CS (cLTP)]: n = 193 spines on 8 dendrites, n = 8 mice, *p < 0.05, Kolmogorov–Smirnov test. C, Comparison of the spine volume of the third quartile (Q3) in each dendritic segment. [WT (control)]: n = 12 dendrites, [CS/CS (control)]: n = 9 dendrites, [WT (cLTP)]: n = 9 dendrites, [CS/CS (cLTP)]: n = 8 dendrites. Error bars indicate SEM. *p < 0.05, ****p < 0.0001, ANOVA (F3,34 = 17.96, p < 0.0001) with Sidak post hoc multiple comparisons. See also Extended Figure 5-1.
Abnormal chemical LTP in GluA1 C811S mutant mice. The cumulative frequency of cLTP-induced spine volume enhancements on each dendrite. [wt (control)]: n = 12 dendrites, [CS/CS (control)]: n = 9 dendrites, [wt (cLTP)]: n = 9 dendrites, [CS/CS (cLTP)]: n = 8 dendrites. Download Figure 5-1, TIF file (2.9MB, tif)
In excitatory synapses, NMDARs are the main triggers in the induction of synaptic plasticity (Mori and Mishina, 2003; Collingridge et al., 2004; Lau and Zukin, 2007; Bliss and Collingridge, 2013). Here, we used the selective activation of synaptic NMDARs to induce cLTP by applying the NMDAR co-agonist glycine and the GABAAR antagonist picrotoxin (Fig. 5A). This glycine-induced cLTP protocol has previously been demonstrated to cause a rapid exocytosis of AMPARs into the synaptic plasma membrane, leading to LTP of AMPAR-mediated excitatory transmission (Liao et al., 2001; Lu et al., 2001; Passafaro et al., 2001; Park et al., 2004). Spine volumes showed no significant difference between WT and CS/CS slices in their basal states (Fig. 5B and Fig. 5-1, control). Upon cLTP induction, spine enlargements were observed in both WT and CS/CS groups at 30 min after glycine application, but the spine volume distributions were significantly differed between the groups; CS/CS slices showed larger spine volume compared with WT slices (Fig. 5B and Fig. 5-1, cLTP). Interestingly, the difference between WT and CS/CS groups under the cLTP condition was mostly found in a larger half of population, whereas there seemed to be no difference in the smaller half (Fig. 5B, p = 0.033 by Kolmogorov–Smirnov test). Indeed, when we compared the spine volume of the third quartile (Q3) in each dendritic segment analyzed, the CS/CS group was significantly larger than WT under the cLTP condition, whereas there was no difference between the WT and CS/CS groups (Fig. 5C, ANOVA with post hoc Sidak's multiple comparisons). cLTP stimulation caused significant enlargement in both groups. These findings suggested that the GluA1 palmitoylation function to suppress excessive spine enlargement above a certain size in the normal brain when excitatory neurons receive strong inputs, such as epileptic seizure-inducing stimulation.
Elevated seizure susceptibility in GluA1 C811S mutant mice
Our previous studies have revealed that depalmitoylation at GluA1 C811 suppresses stimulation-induced internalization of the AMPAR from the surface to intracellular regions in cultured cortical neurons (Hayashi et al., 2005; Lin et al., 2009). Therefore, we hypothesized that depalmitoylation of AMPARs would cause excess accumulation and stable localization of newly inserted AMPARs in excitatory synapses, which could form the basis of hyperexcitability in vivo. To test the possibility that CS/CS mice are prone to hyperexcitation, a noncompetitive GABAA receptor antagonist, PTZ, was used to induce convulsions. Without PTZ administration, CS/CS mice showed no apparent epileptic manifestations like WT mice. Consistent with the literature, mice administered with a single low PTZ dose (20–30 mg/kg) exhibited ear and facial twitching (stage 1, Racine score) or, at times, convulsive twitching axially through the body (stage 2). PTZ application at a dose of 40–80 mg/kg induced a seizure that was characterized by limbic myoclonus (stage 3) and clonic and/or tonic convulsion, jumping, and wild running (stage 4 or 5) in young adults (7 weeks old) and 3-month-old (13 weeks) adult mice (Fig. 6A,B). There were no significant differences in the highest seizure score between WT and CS/CS mice at any dose during 20 min observation after intraperitoneal PTZ injection. However, repeated occurrence of clonic and/or tonic seizures was increased in both 7- and 13-week-old CS/CS mice compared with WT mice in the same condition (repeated times of stage 4 and 5: Fig. 6C,D, repeated times of stage 5, and Fig. 6-1A,B).
Figure 6.

Epileptic seizure and kindling evoked by treating mice with PTZ. A, Seizure scores in 7-week-old WT (white bars) and CS/CS (black bars) mice received a single injection of PTZ at a dose of 0, 20, 30, 40, 60, or 80 mg/kg. Six white bars [WT]: n = 21, 12, 10, 13, 18, 16, six black bars [CS/CS]: n = 17, 13, 12, 15, 16, 16 (left to right). B, Seizure scores in 13-week-old WT (white bars) and CS/CS (black bars) mice received a single injection of PTZ at a dose of 0, 20, 40, or 60 mg/kg. Four white bars [WT]: n = 16, 13, 14, 14, four black bars [CS/CS]: n = 13, 14, 17, 16 (left to right). C, Occurrence of generalized tonic-clonic seizures (stage 4 and 5) in 7-week-old WT (white bars) and CS/CS (black bars) mice that received a single injection of PTZ at a dose of 40 (right, n = 13, 15, respectively) or 60 (left, n = 17, 16, respectively) mg/kg. D, Occurrence of generalized tonic-clonic seizures (stage 4 and 5) in 13-week-old WT (white bars) and CS/CS (black bars) mice that received a single injection of PTZ at a dose of 40 (right, n = 12, 12, respectively) or 60 (left, n = 13, 13, respectively) mg/kg. E, Kindling evoked by treating mice repeatedly with PTZ. WT (white) and CS/CS (black) mice were administered PTZ 12 times at a dose of 30 mg/kg (squares, n = 8, respectively) or saline (PBS, circles, n = 5, respectively) from 7-week-old (genotype effect, F(1,14) = 8.571, p = 0.011; kindling effect, F(11,154) = 24.06, p < 0.0001). F, Injection times of PTZ to induce the initial generalized tonic-clonic seizures (n = 8, respectively). G, Injection times of PTZ to establish the kindling response (n = 8, respectively). H, Continuous kindling response (n = 8, respectively). Error bars indicate SEM. *p < 0.05, **p < 0.01. See also Extended Figure 6-1.
Epileptic seizure evoked by treating mice with pentylenetetrazole (PTZ).
Occurrence of generalized tonic-clonic seizures (stage 5) in 7 weeks old wt (white bars) and CS/CS (black bars) mice received a single injection of PTZ at a dose of 40 (right, n = 13, 15, respectively) or 60 (left, n = 17, 16, respectively) mg/kg.
Occurrence of generalized tonic-clonic seizures (stage 5) in 13 weeks old wt (white bars) and CS/CS (black bars) mice received a single injection of PTZ at a dose of 40 (right, n = 12, 12, respectively) or 60 (left, n = 13, 13, respectively) mg/kg.
Error bars represent s.e.m. **p < 0.01, t-test. Download Figure 6-1, TIF file (2.9MB, tif)
The kindling experiment is a commonly used experimental animal model for the development of epilepsy in which induced seizures gradually increase after repeated electrical or chemical stimulation of certain forebrain structures. To further clarify the relationship between GluA1 C811S mutation and stimulation-dependent hyperexcitation, repeated administration of low-dose PTZ (30 mg/kg)-induced kindled seizure was examined to evaluate the possible differences in seizure susceptibility (Fig. 6E). In the kindling experiment, CS/CS mice showed that an early induction of the initial tonic-clonic seizure (Fig. 6F), early establishment of kindling (Fig. 6G), and longer continuous kindling responses (Fig. 6H). These pharmacological experiments suggested that the GluA1 C811S mutation led to a decreased seizure threshold, resulting in more severe generalized tonic-clonic and myoclonic seizures induced by PTZ.
Increased expression of immediate early genes (IEGs) in GluA1 C811S mutant mice
Activity-induced expression of the neuronal IEGs c-fos and Arc (also called arg3.1) were explored to monitor neuronal activity in the cerebrum (Okuno, 2011; Shepherd and Bear, 2011; West and Greenberg, 2011; Madabhushi and Kim, 2018). Basal protein expression of both c-Fos and Arc were comparably low in the hippocampal dentate gyrus of WT and CS/CS mice (c-Fos; Fig. 7A, Arc, B). PTZ-produced seizure was accompanied by increased expression of c-Fos and Arc proteins in the hippocampus 2 h after treatment (Ramírez-Amaya et al., 2005; Vazdarjanova et al., 2006; Minatohara et al., 2016). Compared with WT mice, CS/CS mice showed stronger dose-dependent induction of c-Fos and Arc expression in their hippocampi, especially at a dose of 60 mg/kg. These data suggest that GluA1 C811 depalmitoylation is related with stimulation-dependent hyperactivity in the hippocampus. Consistent with the previous reports, Arc proteins were mainly detected in the soma of hippocampal dentate granule cells 2 h after PTZ injection and later translocated across dendrites during subsequent time points (Fig. 8B,D). Similar to WT mice, stimulation-induced Arc expression overlapped with c-Fos in CS/CS mice (Fig. 8A,C). The basal expression and PTZ-induced protein expression of c-Fos were significantly increased at any dose in the cerebral cortex of CS/CS mice (Fig. 7C and 7-1A–C). This correlated with enhanced GluA1 protein expression in the cortex (Fig. 2C). Interestingly, administration of PTZ failed to increase activity-dependent production of Arc protein in the cortex (Fig. 7D and Fig. 7-1D–F).
Figure 7.

PTZ-induced neuronal activity visualized by IEGs. WT (white bars) and CS/CS (black bars) mice received a single injection of PTZ at a dose of 0, 20, 40, or 60 mg/kg and fixed 2 h after PTZ administration. Brain sections were incubated with each antibody and DAPI. Typical images are shown as representative (left). Scale bar, 200 μm. Ratio of c-Fos or Arc-positive to DAPI-positive cells are shown (right). White broken lines indicate the edge of lateral ventricle. A, c-Fos expression in the hippocampal dentate gyrus (n = 5, respectively, F(7,32) = 10.58, p < 0.0001). B, Arc expression in the hippocampal dentate gyrus (n = 6, respectively, F(7,40) = 14.22, p < 0.0001). C, c-Fos expression in the cortex (n = 19, respectively, F(7,144) = 12.44, p < 0.0001). D, Arc expression in the cortex (n = 12, respectively, F(7,88) = 3.166, p = 0.0049). Error bars indicate SEM. ANOVA with Tukey post hoc test. *p < 0.05, **p < 0.01, ***p < 0.001 compared with WT controls. See also Extended Figure 7-1.
Figure 8.

PTZ-induced c-Fos and Arc proteins in hippocampal dentate gyrus. c-Fos (red) or Arc (green) expression with DAPI staining (blue) in WT and CS/CS mice 4 h after a single injection of seizure-inducing PTZ (60 mg/kg) or PBS (0 mg/kg). Typical images are shown as representative. Scale bar, 200 μm. A, c-Fos expression with or without PTZ stimulation. B, Arc expression with or without PTZ stimulation. C, Merged image of c-Fos and Arc expression. D, Enlarged images of B.
c-Fos and Arc protein expressions in three areas of the cortex. Wt (white bars) and CS/CS (black bars) mice received a single injection of PTZ at a dose of 0, 20, 40 or 60 mg/kg and fixed 2 h after PTZ administration. Brain sections were incubated with each antibody and DAPI. Ratio of c-Fos or Arc-positive to DAPI-positive cells are shown.
c-Fos expression in the parietal association (PtA) cortex (n = 6, respectively, F7, 40 = 3.78, p = 0.0031).
c-Fos expression in the primary somatosensory (S1) cortex (n = 6, respectively, F7, 40 = 3.273, p = 0.0076).
c-Fos expression in the primary motor (M1) cortex (n = 7, respectively, F7, 48 = 4.411, p = 0.0008).
Arc expression in the parietal association (PtA) cortex (n = 4, respectively, F7, 24 = 1.727, p = 0.1501).
Arc expression in the primary somatosensory (S1) cortex (n = 4, respectively, F7, 24 = 1.19, p = 0.3456).
Arc expression in the primary motor (M1) cortex (n = 4, respectively, F7, 24 = 0.3123, p = 0.9412).
Error bars represent s.e.m. ANOVA with Tukey post hoc test. *p < 0.05, **p < 0.01, ***p < 0.001, compared to wt controls. Download Figure 7-1, TIF file (2.9MB, tif)
Reduced effects of anticonvulsants in GluA1 C811S mutant mice
Our experimental data indicated stimulation-induced hyperexcitation in the cerebrum of CS/CS mice. Therefore, effectiveness evaluation was assessed, concerning three types of clinically used anticonvulsants, VPA, PB, and DZP, on PTZ-induced seizure in CS/CS mice. At first, we confirmed that administration of these anticonvulsants potently and dose-dependently suppressed the PTZ-induced tonic-clonic and myoclonic seizures in WT mice (Fig. 9).
Figure 9.

Inhibitory effects of anticonvulsants on PTZ-evoked seizure. A, Dose dependence of VPA. Seizure scores of 7-week-old WT (white bars) and GluA1 CS/CS (black bars) mice that received an administration of VPA at a dose of 0, 200, 300, or 400 mg/kg 30 min before a single injection of 60 mg/kg PTZ. Four white bars [WT]: n = 19, 12, 10, 11, four black bars [CS/CS]: n = 19, 12, 11, 12 (left to right). F(7,98) = 12.89, p < 0.0001. B, Effects of VPA on occurrence of generalized tonic-clonic seizures. Four white bars [WT]: n = 17, 11, 10, 11, four black bars [CS/CS]: n = 16, 7, 8, 10 (left to right). F(7,82) = 11.91, p < 0.0001. C, Dose dependence of PB. Seizure scores of 7-week-old WT (white bars) and GluA1 CS/CS (black bars) mice that received an administration of PB at a dose of 0, 5, or 10 mg/kg 30 min before a single injection of 60 mg/kg PTZ. Three white bars [WT]: n = 19, 12, 14, three black bars [CS/CS]: n = 19, 12, 13 (left to right). F(5,83) = 5.108, p = 0.0004. D, Time course of PB effects at doses of 5 mg/kg. Seizure scores of 7-week-old WT (white squares) and CS/CS (black squares) mice that received an administration of PB at a dose of 5 mg/kg for the indicated periods before a single injection of 60 mg/kg PTZ. Four white squares [WT]: n = 19, 10, 11, 12, four black squares [CS/CS]: n = 19, 13, 14, 12 (left to right). F(7,102) = 3.556, p = 0.0018. E, Time course of PB effects at doses of 10 mg/kg. Seizure scores of 7-week-old WT (white squares) and CS/CS (black squares) mice that received an administration of PB at a dose of 10 mg/kg for the indicated periods before a single injection of 60 mg/kg PTZ. Four white squares [WT]: n = 19, 11, 14, 14, four black squares [CS/CS]: n = 19, 12, 10, 13 (left to right). F(7,104) = 4.259, p = 0.0004. F, Dose dependence of DZP. Seizure scores of 7-week-old WT (white bars) and CS/CS (black bars) mice that received an administration of DZP at a dose of 0, 0.1, 1, or 5 mg/kg, 5 min before a single injection of 80 mg/kg PTZ. Four white bars [WT]: n = 16, 11, 10, 10, four black bars [CS/CS]: n = 16, 12, 13, 11 (left to right). F(7,91) = 62.67, p < 0.0001. G, Effects of DZP on occurrence of generalized tonic-clonic seizures. Four white bars [WT]: n = 12, 8, 10, 10, four black bars [CS/CS]: n = 8, 8, 11, 11 (left to right). F(7,70) = 19.80, p < 0.0001. Error bars indicate SEM. ANOVA with Tukey–Kramer post hoc test. *p < 0.05, **p < 0.01, ***p < 0.001 compared with WT controls. See also Extended Figure 9-1.
Inhibitory effects of anticonvulsants on PTZ-evoked seizure. Seizure scores (A, B) and repeated times of generalized tonic-clonic seizures (C, D) in 7 weeks old wt (white bars) and CS/CS (black bars) mice received an administration of VPA or PB for indicated periods before a single injection of 60 mg/kg PTZ.
Time course of VPA effects at doses of 300 mg/kg. Four white bars [wt]: n = 19, 10, 10, 10, four black bars [CS/CS]: n = 19, 12, 11, 11 (left to right). F7, 94 = 12.59, p < 0.0001.
Time course of VPA effects at doses of 400 mg/kg. Four white bars [wt]: n = 19, 10, 11, 10, four black bars [CS/CS]: n = 19, 10, 12, 12 (left to right). F7, 95 = 8.950, p < 0.0001.
Time course of PB effects on occurrence of generalized tonic-clonic seizures at doses of 5 mg/kg. Four white bars [wt]: n = 17, 7, 8, 8, four black bars [CS/CS]: n = 16, 9, 9, 7 (left to right). F7, 73 = 1.958, p = 0.043.
Time course of PB effects on occurrence of generalized tonic-clonic seizures at doses of 10 mg/kg. Four white bars [wt]: n = 17, 9, 12, 9, four black bars [CS/CS]: n = 16, 10, 8, 8 (left to right). F7, 81 = 5.050, p < 0.0001.
Error bars represent s.e.m. ANOVA with Tukey-Kramer post hoc test *p < 0.05, **p < 0.01, compared to wt controls. Download Figure 9-1, TIF file (2.9MB, tif)
VPA acts as an anticonvulsant to inhibit GABA transaminase, leading to an increase in the concentration of the inhibitory neurotransmitter, GABA. Next, the dose dependency of VPA-induced effects with 60 mg/kg PTZ-induced seizure was examined (Fig. 9A,B). Compared with WT mice, 30 min pretreatment with VPA exhibited a reduced effect on CS/CS mice in the highest seizure score during the 20 min observation (Fig. 9A) and repetitions of tonic-clonic seizures induced by PTZ (Fig. 9B). In addition, time courses of the pretreatment effect with VPA administration on the occurrence of 60 mg/kg PTZ-induced seizure scores were examined (300 mg/kg, Fig. 9-1A; 400 mg/kg, Fig. 9-1B). These results showed that VPA could significantly suppress the PTZ-induced seizure in both WT and CS/CS mice, but notably had lower effects on CS/CS mice. Namely, the GluA1 C811S mutation significantly reduced the anticonvulsive effects of VPA.
PB possesses anti-seizure activity by increasing the GABAAR channel open probability at inhibitory synapses. The dose dependency and time course of PB pretreatment on 60 mg/kg PTZ-induced seizures were tested and the highest seizure scores are shown in Figure 9, C–E. Moreover, we observed the time courses of pretreatment effects with PB on the occurrence of 60 mg/kg PTZ-induced tonic-clonic seizure (5 mg/kg PB, Fig. 9-1C; 10 mg/kg PB, Fig. 9-1D). These results showed that PB had reduced effects on PTZ-induced seizures in CS/CS mice compared with WT mice. Similarly, DZP potently and efficaciously blocked PTZ-induced seizure by prolonging GABAAR channel open time. The dose dependency of DZP effects on 80 mg/kg PTZ-induced seizure was further tested. Pretreatment with DZP at doses of 1–5 mg/kg for 5 min showed lower effects on PTZ-induced seizure in CS/CS mice (the highest seizure score; Fig. 9F). DZP effects on the occurrence of PTZ-induced tonic-clonic seizure were relatively weak for CS/CS mice at all doses (repeated times of tonic-clonic seizure; Fig. 9G). These data are consistent with other results, implying that there exists increased seizure susceptibility in CS/CS mice.
Discussion
Epilepsy is characterized by recurring, unprovoked seizures, representing the abnormally synchronous activity of excitatory neurons in a focal area of the cerebrum and, in some cases, conveyed throughout the entire brain (Grone and Baraban, 2015; Staley, 2015). Epileptic seizure is associated with excessive cortical excitability resulting from imbalances between excitation and inhibition in the cerebrum. Disrupted E/I balance leads to perturbed neuronal circuit function and repetitive seizures induce serious epilepsy (Paz and Huguenard, 2015). E/I imbalance is supposed to occur in very few excitatory synapses and then spreads to other areas. Although the appropriate regulation of ion channels and neurotransmitter receptors plays a crucial role in the maintenance of the E/I synaptic balance (Haider and McCormick, 2009; Isaacson and Scanziani, 2011; Xue et al., 2014), detailed mechanisms underlining epilepsy remain unclear. Our findings presented here provide new insights into the regulation of functional AMPARs to preserve the stability of mammalian brain (Fig. 10).
Figure 10.

Model of the role of AMPAR palmitoylation in vivo. Palmitoylation of the GluA1 at C811 enables endocytosis of synaptic AMPARs and potentially upregulates the threshold of seizure occurrence in the cerebrum of WT mice (top). Constitutive depalmitoylation-mimicking C811S mutation of GluA1 prevents efficient internalization of synaptic AMPARs, which decreases the threshold of epileptic seizure when they receive seizure-inducing activity in the cerebrum of GluA1 CS/CS mice (bottom).
The excitatory synapses throughout the cerebrum contain AMPARs to predominantly mediate synaptic transmission. Although many factors have been identified to regulate excitatory synaptic strength, previous research has revealed that one common mechanism is the control of the postsynaptic expression of AMPARs. In the present study, we demonstrated that a disruption of the GluA1 C-terminal palmitoylation site causes disturbed spine volume enhancements and increased seizure susceptibility without affecting gross brain structure. This non-palmitoylation mutation C811S did not exert an influence on excitatory glutamatergic synaptic transmission in the basal state (Fig. 3) and did not correlate with any behavioral defect of CS/CS mice. These data suggest that GluA1 palmitoylation at C811 in WT mice may be limited at the basal state. No significant change in intrinsic membrane excitabilities between WT and CS/CS mice indicates that there is no alteration in potassium channels (Fig. 3-1). Furthermore, no obvious E/I imbalance was observed in CS/CS mice at the basal level (Fig. 4A), suggesting that the C811S mutation did not affect GABAergic inputs and the formation of hippocampal circuits. These mutant mice showed gradually increased PTZ-induced generalized tonic-clonic and myoclonic seizure incidence and severity, indicating that GluA1 C811 palmitoylation properly controls the hyperexcitation threshold in the normal cerebrum (Fig. 6). In addition, the expression of the activity-regulated genes c-fos and Arc was augmented in response to tonic-clonic seizure-inducing PTZ in the hippocampus of CS/CS mice (Figs. 7, 8). Interestingly, in the neocortex, there was a discrepancy between c-fos and Arc; c-fos was upregulated by PTZ administration, whereas Arc was not, in both WT and CS/CS mice. Such differential gene expression in the neocortex may represent a specific PTZ-driven activity pattern that preferentially upregulates a subset of activity-dependent genes (West and Greenberg, 2011; Madabhushi and Kim, 2018; Okuno et al., 2018; Tyssowski et al., 2018). In agreement with these pharmacological results, GluA1 phosphorylation at S831 in the hippocampus or AMPAR expression in the cortex was increased in CS/CS mice (Fig. 2). The GluA1 S831 phosphorylation is related with LTP (Jiang et al., 2006; Anggono and Huganir, 2012; Lussier et al., 2015). Therefore, these data strongly suggest that GluA1-containing AMPARs are ready to insert into hippocampal and cortical postsynapses in response to neuronal activities. Moreover, seizure blockade by clinically used anticonvulsants such as VPA, PB, and DZP showed reduced anti-epileptic properties in mutant mice when seizures are induced (Fig. 9). Our previous studies revealed that C811 palmitoylation of synaptic GluA1 is a critical driving force for AMPAR internalization from the surface (Hayashi et al., 2005). Our in vivo analysis presented here shows that the appropriate palmitoylation of AMPAR receptors prevents pathologic E/I imbalance due to excess excitatory synaptic transmission in normal brain. Concretely, the cLTP result suggests that palmitoylation deficiency induces exaggerated enlargement of relatively larger spines above a certain size, which possibly leads elevated seizure susceptibility (Fig. 5). Epileptic seizure may be aggravated when excitatory neuronal activities surpass a critical level in response to specific input, including these uncontrollably enlarged synapses. In contrast, significant difference was not observed in the lower, half-sized cLTP-induced spines. One interpretation is that some compensatory mechanisms may cover the impairment of AMPAR palmitoylation-dependent regulation in these smaller sized spines. Alternatively, AMPAR GluA1 subunits are dominantly palmitoylated in larger sized spines. At present, it remains unclear whether palmitoylation of GluA1 C811 occurs activity dependently in vivo. The molecular basis of dynamic regulation for GluA1 C811 palymitoylation should be further investigated in the future. Nevertheless, palmitoylation-dependent regulation of well balanced spine enlargement and newly inserted GluA1-containing AMPAR to synapses may ensure homeostatic fine tuning or adjustment to chronically suppress E/I imbalance (Davis, 2006; Marder and Goaillard, 2006; Heine et al., 2008; Turrigiano, 2011; Xue et al., 2014).
Although there are many factors related to the occurrence of epileptic seizures (Bateup et al., 2013; Noebels, 2015; Staley, 2015), our study provides a possibility that the palmitoylation-dependent appropriate regulation of synaptic AMPARs may suppress E/I imbalance, which prevents severe epileptic seizures. To date, major efforts to develop antiepileptic drugs targeting AMPARs have focused on the screening of useful antagonists for therapeutic use among a number of potential candidate compounds (Rakhade and Jensen, 2009; Rogawski, 2011; Russo et al., 2012). Perampanel (Fycompa), the only approved AMPAR antagonist for epilepsy, is clinically applied to treat patients with partial or generalized tonic-clonic seizures (Hibi et al., 2012; French et al., 2015; Kato et al., 2016; Faulkner, 2017). Presumably because AMPAR antagonists generally inhibit ion channel properties of all preexisting AMPARs on synapses in the whole brain, various adverse side effects are inevitable (Kramer et al., 2014; Zwart et al., 2014). Our present results suggest that AMPAR palmitoylation is a novel pharmacological target for treating refractory seizure in the future and compounds controlling AMPAR palmitoylation may have moderate side effects in various intractable epilepsies.
Footnotes
This work was supported in part by Grants-in-Aid from the Ministry of Education, Culture, Sports, Science and Technology of Japan (MEXT)/Japan Society for the Promotion of Science (JSPS) (Grants 22680029, 23650187, 24111512, and 16K07078 to T.H.; Grants 21249012, 22123008, 24249014, and 16H04676 to M.M.; Grants 21300118 and 24650195 to K.S.; Grants 24700321 and 26350979 to M.A.; Grants 25290027 and 17K07124 to K.W.; Grants 15K06730 and 17K10286 to M.S.; Grants 15H04258 and 18H05127 to H.O.; and Grant 15K0701 to M.I.); RRIME from Japan Agency for Medical Research and Development (AMED Grant JP18gm5910009 to T.H.), the Takeda Science Foundation (T.H.), the Mitsubishi Foundation (T.H.), the Brain Science Foundation (T.H.), the Suzuken Memorial Foundation (T.H.), and the Astellas Foundation for Research on Metabolic Disorders (T.H.). We thank our colleagues in the NCNP; J. Noguchi for valuable discussion and encouragement; K. Yamamoto and M. Date for animal care; T. Owa and S. Miyashita for technical assistance; A. Takayama, J. Sakawa, A. Tsuzuki, and A. Yanai for excellent administrative assistance; and the Graduate Program in the Department of Development and Regenerative Biology, Graduate School of Medical and Dental Science, Tokyo Medical and Dental University, Tokyo.
The authors declare no competing financial interests.
References
- Anggono V, Huganir RL (2012) Regulation of AMPA receptor trafficking and synaptic plasticity. Curr Opin Neurobiol 22:461–469. 10.1016/j.conb.2011.12.006 [DOI] [PMC free article] [PubMed] [Google Scholar]
- Bateup HS, Johnson CA, Denefrio CL, Saulnier JL, Kornacker K, Sabatini BL (2013) Excitatory/inhibitory synaptic imbalance leads to hippocampal hyperexcitability in mouse models of tuberous sclerosis. Neuron 78:510–522. 10.1016/j.neuron.2013.03.017 [DOI] [PMC free article] [PubMed] [Google Scholar]
- Becker A, Grecksch G, Schröder H (1995) N omega-nitro-L-arginine methyl ester interferes with pentylenetetrazol-induced kindling and has no effect on changes in glutamate binding. Brain Res 688:230–232. 10.1016/0006-8993(95)00565-8 [DOI] [PubMed] [Google Scholar]
- Bliss TV, Collingridge GL (2013) Expression of NMDA receptor-dependent LTP in the hippocampus: bridging the divide. Mol Brain 6:5. 10.1186/1756-6606-6-5 [DOI] [PMC free article] [PubMed] [Google Scholar]
- Borroni MV, Vallés AS, Barrantes FJ (2016) The lipid habitats of neurotransmitter receptors in brain. Biochim Biophys Acta 1858:2662–2670. 10.1016/j.bbamem.2016.07.005 [DOI] [PubMed] [Google Scholar]
- Collingridge GL, Isaac JT, Wang YT (2004) Receptor trafficking and synaptic plasticity. Nat Rev Neurosci 5:952–962. 10.1038/nrn1556 [DOI] [PubMed] [Google Scholar]
- Davis GW. (2006) Homeostatic control of neural activity: from phenomenology to molecular design. Annu Rev Neurosci 29:307–323. 10.1146/annurev.neuro.28.061604.135751 [DOI] [PubMed] [Google Scholar]
- Derkach VA, Oh MC, Guire ES, Soderling TR (2007) Regulatory mechanisms of AMPA receptors in synaptic plasticity. Nat Rev Neurosci 8:101–113. 10.1038/nrn2055 [DOI] [PubMed] [Google Scholar]
- Drisdel RC, Alexander JK, Sayeed A, Green WN (2006) Assays of protein palmitoylation. Methods 40:127–134. 10.1016/j.ymeth.2006.04.015 [DOI] [PubMed] [Google Scholar]
- Faulkner MA. (2017) Spotlight on perampanel in the management of seizures: design, development and an update on place in therapy. Drug Des Devel Ther 11:2921–2930. 10.2147/DDDT.S122404 [DOI] [PMC free article] [PubMed] [Google Scholar]
- Feng G, Mellor RH, Bernstein M, Keller-Peck C, Nguyen QT, Wallace M, Nerbonne JM, Lichtman JW, Sanes JR (2000) Imaging neuronal subsets in transgenic mice expressing multiple spectral variants of GFP. Neuron 28:41–51. 10.1016/S0896-6273(00)00084-2 [DOI] [PubMed] [Google Scholar]
- French JA, Krauss GL, Wechsler RT, Wang XF, DiVentura B, Brandt C, Trinka E, O'Brien TJ, Laurenza A, Patten A, Bibbiani F (2015) Perampanel for tonic-clonic seizures in idiopathic generalized epilepsy: a randomized trial. Neurology 85:950–957. 10.1212/WNL.0000000000001930 [DOI] [PMC free article] [PubMed] [Google Scholar]
- Fukata Y, Fukata M (2010) Protein palmitoylation in neuronal development and synaptic plasticity. Nat Rev Neurosci 11:161–175. 10.1038/nrn2788 [DOI] [PubMed] [Google Scholar]
- Grone BP, Baraban SC (2015) Animal models in epilepsy research: legacies and new directions. Nat Neurosci 18:339–343. 10.1038/nn.3934 [DOI] [PubMed] [Google Scholar]
- Haider B, McCormick DA (2009) Rapid neocortical dynamics: cellular and network mechanisms. Neuron 62:171–189. 10.1016/j.neuron.2009.04.008 [DOI] [PMC free article] [PubMed] [Google Scholar]
- Hayashi T. (2014) Evolutionarily conserved palmitoylation-dependent regulation of ionotropic glutamate receptors in vertebrates. Neurotransmitter 1:e388. [Google Scholar]
- Hayashi T, Rumbaugh G, Huganir RL (2005) Differential regulation of AMPA receptor subunit trafficking by palmitoylation of two distinct sites. Neuron 47:709–723. 10.1016/j.neuron.2005.06.035 [DOI] [PubMed] [Google Scholar]
- Heine M, Thoumine O, Mondin M, Tessier B, Giannone G, Choquet D (2008) Activity-independent and subunit-specific recruitment of functional AMPA receptors at neurexin/neuroligin contacts. Proc Natl Acad Sci U S A 105:20947–20952. 10.1073/pnas.0804007106 [DOI] [PMC free article] [PubMed] [Google Scholar]
- Hibi S, Ueno K, Nagato S, Kawano K, Ito K, Norimine Y, Takenaka O, Hanada T, Yonaga M (2012) Discovery of 2-(2-oxo-1-phenyl-5-pyridin-2-yl-1,2-dihydropyridin-3-yl)benzonitrile (perampanel): a novel, noncompetitive alpha-amino-3-hydroxy-5-methyl-4-isoxazolepropanoic acid (AMPA) receptor antagonist. J Med Chem 55:10584–10600. 10.1021/jm301268u [DOI] [PubMed] [Google Scholar]
- Hollmann M, Heinemann S (1994) Cloned glutamate receptors. Annu Rev Neurosci 17:31–108. 10.1146/annurev.ne.17.030194.000335 [DOI] [PubMed] [Google Scholar]
- Holtmaat A, Svoboda K (2009) Experience-dependent structural synaptic plasticity in the mammalian brain. Nat Rev Neurosci 10:647–658. 10.1038/nrn2699 [DOI] [PubMed] [Google Scholar]
- Huganir RL, Nicoll RA (2013) AMPARs and synaptic plasticity: the last 25 years. Neuron 80:704–717. 10.1016/j.neuron.2013.10.025 [DOI] [PMC free article] [PubMed] [Google Scholar]
- Isaacson JS, Scanziani M (2011) How inhibition shapes cortical activity. Neuron 72:231–243. 10.1016/j.neuron.2011.09.027 [DOI] [PMC free article] [PubMed] [Google Scholar]
- Jiang J, Suppiramaniam V, Wooten MW (2006) Posttranslational modifications and receptor-associated proteins in AMPA receptor trafficking and synaptic plasticity. Neurosignals 15:266–282. 10.1159/000105517 [DOI] [PubMed] [Google Scholar]
- Kang R, Wan J, Arstikaitis P, Takahashi H, Huang K, Bailey AO, Thompson JX, Roth AF, Drisdel RC, Mastro R, Green WN, Yates JR 3rd, Davis NG, El-Husseini A (2008) Neural palmitoyl-proteomics reveals dynamic synaptic palmitoylation. Nature 456:904–909. 10.1038/nature07605 [DOI] [PMC free article] [PubMed] [Google Scholar]
- Kasai H, Fukuda M, Watanabe S, Hayashi-Takagi A, Noguchi J (2010) Structural dynamics of dendritic spines in memory and cognition. Trends Neurosci 33:121–129. 10.1016/j.tins.2010.01.001 [DOI] [PubMed] [Google Scholar]
- Kato AS, Burris KD, Gardinier KM, Gernert DL, Porter WJ, Reel J, Ding C, Tu Y, Schober DA, Lee MR, Heinz BA, Fitch TE, Gleason SD, Catlow JT, Yu H, Fitzjohn SM, Pasqui F, Wang H, Qian Y, Sher E, et al. (2016) Forebrain-selective AMPA-receptor antagonism guided by TARP gamma-8 as an antiepileptic mechanism. Nat Med 22:1496–1501. 10.1038/nm.4221 [DOI] [PubMed] [Google Scholar]
- Kessels HW, Malinow R (2009) Synaptic AMPA receptor plasticity and behavior. Neuron 61:340–350. 10.1016/j.neuron.2009.01.015 [DOI] [PMC free article] [PubMed] [Google Scholar]
- Kopec CD, Li B, Wei W, Boehm J, Malinow R (2006) Glutamate receptor exocytosis and spine enlargement during chemically induced long-term potentiation. J Neurosci 26:2000–2009. 10.1523/JNEUROSCI.3918-05.2006 [DOI] [PMC free article] [PubMed] [Google Scholar]
- Kopec CD, Real E, Kessels HW, Malinow R (2007) GluR1 links structural and functional plasticity at excitatory synapses. J Neurosci 27:13706–13718. 10.1523/JNEUROSCI.3503-07.2007 [DOI] [PMC free article] [PubMed] [Google Scholar]
- Kramer LD, Satlin A, Krauss GL, French J, Perucca E, Ben-Menachem E, Kwan P, Shih JJ, Laurenza A, Yang H, Zhu J, Squillacote D (2014) Perampanel for adjunctive treatment of partial-onset seizures: a pooled dose-response analysis of phase III studies. Epilepsia 55:423–431. 10.1111/epi.12527 [DOI] [PubMed] [Google Scholar]
- Lau CG, Zukin RS (2007) NMDA receptor trafficking in synaptic plasticity and neuropsychiatric disorders. Nat Rev Neurosci 8:413–426. 10.1038/nrn2153, Error: More than 1 reference returned by Crossref. Check all DOIs. [DOI] [PubMed] [Google Scholar]
- Liao D, Scannevin RH, Huganir R (2001) Activation of silent synapses by rapid activity-dependent synaptic recruitment of AMPA receptors. J Neurosci 21:6008–6017. 10.1523/JNEUROSCI.21-16-06008.2001 [DOI] [PMC free article] [PubMed] [Google Scholar]
- Lin DT, Makino Y, Sharma K, Hayashi T, Neve R, Takamiya K, Huganir RL (2009) Regulation of AMPA receptor extrasynaptic insertion by 4.1N, phosphorylation and palmitoylation. Nat Neurosci 12:879–887. 10.1038/nn.2351 [DOI] [PMC free article] [PubMed] [Google Scholar]
- Linder ME, Deschenes RJ (2007) Palmitoylation: policing protein stability and traffic. Nat Rev Mol Cell Biol 8:74–84. 10.1038/nrm2084 [DOI] [PubMed] [Google Scholar]
- Lu W, Man H, Ju W, Trimble WS, MacDonald JF, Wang YT (2001) Activation of synaptic NMDA receptors induces membrane insertion of new AMPA receptors and LTP in cultured hippocampal neurons. Neuron 29:243–254. 10.1016/S0896-6273(01)00194-5 [DOI] [PubMed] [Google Scholar]
- Lussier MP, Sanz-Clemente A, Roche KW (2015) Dynamic regulation of N-methyl-D-aspartate (NMDA) and alpha-amino-3-hydroxy-5-methyl-4-isoxazolepropionic acid (AMPA) receptors by posttranslational modifications. J Biol Chem 290:28596–28603. 10.1074/jbc.R115.652750 [DOI] [PMC free article] [PubMed] [Google Scholar]
- Madabhushi R, Kim TK (2018) Emerging themes in neuronal activity-dependent gene expression. Mol Cell Neurosci 87:27–34. 10.1016/j.mcn.2017.11.009 [DOI] [PMC free article] [PubMed] [Google Scholar]
- Malinow R, Malenka RC (2002) AMPA receptor trafficking and synaptic plasticity. Annu Rev Neurosci 25:103–126. 10.1146/annurev.neuro.25.112701.142758 [DOI] [PubMed] [Google Scholar]
- Marder E, Goaillard JM (2006) Variability, compensation and homeostasis in neuron and network function. Nat Rev Neurosci 7:563–574. 10.1038/nrn1949 [DOI] [PubMed] [Google Scholar]
- Matsuzaki M, Ellis-Davies GC, Nemoto T, Miyashita Y, Iino M, Kasai H (2001) Dendritic spine geometry is critical for AMPA receptor expression in hippocampal CA1 pyramidal neurons. Nat Neurosci 4:1086–1092. 10.1038/nn736 [DOI] [PMC free article] [PubMed] [Google Scholar]
- Matsuzaki M, Honkura N, Ellis-Davies GC, Kasai H (2004) Structural basis of long-term potentiation in single dendritic spines. Nature 429:761–766. 10.1038/nature02617 [DOI] [PMC free article] [PubMed] [Google Scholar]
- Minatohara K, Akiyoshi M, Okuno H (2016) Role of immediate-early genes in synaptic plasticity and neuronal ensembles underlying the memory trace. Front Mol Neurosci 8:78. 10.3389/fnmol.2015.00078 [DOI] [PMC free article] [PubMed] [Google Scholar]
- Mishina M, Sakimura K (2007) Conditional gene targeting on the pure C57BL/6 genetic background. Neurosci Res 58:105–112. 10.1016/j.neures.2007.01.004 [DOI] [PubMed] [Google Scholar]
- Mori H, Mishina M (2003) Roles of diverse glutamate receptors in brain functions elucidated by subunit-specific and region-specific gene targeting. Life Sci 74:329–336. 10.1016/j.lfs.2003.09.020 [DOI] [PubMed] [Google Scholar]
- Noebels J. (2015) Pathway-driven discovery of epilepsy genes. Nat Neurosci 18:344–350. 10.1038/nn.3933 [DOI] [PMC free article] [PubMed] [Google Scholar]
- Okuno H. (2011) Regulation and function of immediate-early genes in the brain: beyond neuronal activity markers. Neurosci Res 69:175–186. 10.1016/j.neures.2010.12.007 [DOI] [PubMed] [Google Scholar]
- Okuno H, Minatohara K, Bito H (2018) Inverse synaptic tagging: an inactive synapse-specific mechanism to capture activity-induced Arc/arg3.1 and to locally regulate spatial distribution of synaptic weights. Semin Cell Dev Biol 77:43–50. 10.1016/j.semcdb.2017.09.025 [DOI] [PubMed] [Google Scholar]
- Park M, Penick EC, Edwards JG, Kauer JA, Ehlers MD (2004) Recycling endosomes supply AMPA receptors for LTP. Science 305:1972–1975. 10.1126/science.1102026 [DOI] [PubMed] [Google Scholar]
- Passafaro M, Piëch V, Sheng M (2001) Subunit-specific temporal and spatial patterns of AMPA receptor exocytosis in hippocampal neurons. Nat Neurosci 4:917–926. 10.1038/nn0901-917 [DOI] [PubMed] [Google Scholar]
- Paz JT, Huguenard JR (2015) Microcircuits and their interactions in epilepsy: is the focus out of focus? Nat Neurosci 18:351–359. 10.1038/nn.3950 [DOI] [PMC free article] [PubMed] [Google Scholar]
- Rakhade SN, Jensen FE (2009) Epileptogenesis in the immature brain: emerging mechanisms. Nat Rev Neurol 5:380–391. 10.1038/nrneurol.2009.80 [DOI] [PMC free article] [PubMed] [Google Scholar]
- Rakhade SN, Fitzgerald EF, Klein PM, Zhou C, Sun H, Hunganir RL, Jensen FE (2012) Glutamate receptor 1 phosphorylation at serine 831 and 845 modulates seizure susceptibility and hippocampal hyperexcitability after early life seizures. J Neurosci 32:17800–17812. 10.1523/JNEUROSCI.6121-11.2012 [DOI] [PMC free article] [PubMed] [Google Scholar]
- Ramírez-Amaya V, Vazdarjanova A, Mikhael D, Rosi S, Worley PF, Barnes CA (2005) Spatial exploration-induced arc mRNA and protein expression: evidence for selective, network-specific reactivation. J Neurosci 25:1761–1768. 10.1523/JNEUROSCI.4342-04.2005 [DOI] [PMC free article] [PubMed] [Google Scholar]
- Resh MD. (2006) Palmitoylation of ligands, receptors, and intracellular signaling molecules. Sci STKE 2006:re14. 10.1126/stke.3592006re14 [DOI] [PubMed] [Google Scholar]
- Rogawski MA. (2011) Revisiting AMPA receptors as an antiepileptic drug target. Epilepsy Curr 11:56–63. 10.5698/1535-7511-11.2.56 [DOI] [PMC free article] [PubMed] [Google Scholar]
- Russo E, Gitto R, Citraro R, Chimirri A, De Sarro G (2012) New AMPA antagonists in epilepsy. Expert Opin Investig Drugs 21:1371–1389. 10.1517/13543784.2012.705277 [DOI] [PubMed] [Google Scholar]
- Schröder H, Becker A, Lössner B (1993) Glutamate binding to brain membranes is increased in pentylenetetrazole-kindled rats. J Neurochem 60:1007–1011. 10.1111/j.1471-4159.1993.tb03248.x [DOI] [PubMed] [Google Scholar]
- Seeburg PH. (1993) The trends Neurosci/TiPS lecture. the molecular biology of mammalian glutamate receptor channels. Trends Neurosci 16:359–365. 10.1016/0166-2236(93)90093-2 [DOI] [PubMed] [Google Scholar]
- Shen L, Liang F, Walensky LD, Huganir RL (2000) Regulation of AMPA receptor GluR1 subunit surface expression by a 4. 1N-linked actin cytoskeletal association. J Neurosci 20:7932–7940. 10.1523/JNEUROSCI.20-21-07932.2000 [DOI] [PMC free article] [PubMed] [Google Scholar]
- Shepherd JD, Bear MF (2011) New views of arc, a master regulator of synaptic plasticity. Nat Neurosci 14:279–284. 10.1038/nn.2708 [DOI] [PMC free article] [PubMed] [Google Scholar]
- Shepherd JD, Huganir RL (2007) The cell biology of synaptic plasticity: AMPA receptor trafficking. Annu Rev Cell Dev Biol 23:613–643. 10.1146/annurev.cellbio.23.090506.123516 [DOI] [PubMed] [Google Scholar]
- Shipston MJ. (2011) Ion channel regulation by protein palmitoylation. J Biol Chem 286:8709–8716. 10.1074/jbc.R110.210005 [DOI] [PMC free article] [PubMed] [Google Scholar]
- Spinelli M, Fusco S, Mainardi M, Scala F, Natale F, Lapenta R, Mattera A, Rinaudo M, Li Puma DD, Ripoli C, Grassi A, D'Ascenzo M, Grassi C (2017) Brain insulin resistance impairs hippocampal synaptic plasticity and memory by increasing GluA1 palmitoylation through FoxO3a. Nat Commun 8:2009. 10.1038/s41467-017-02221-9 [DOI] [PMC free article] [PubMed] [Google Scholar]
- Staley K. (2015) Molecular mechanisms of epilepsy. Nat Neurosci 18:367–372. 10.1038/nn.3947 [DOI] [PMC free article] [PubMed] [Google Scholar]
- Thomas GM, Hayashi T (2013) Smarter neuronal signaling complexes from existing components: how regulatory modifications were acquired during animal evolution: evolution of palmitoylation-dependent regulation of AMPA-type ionotropic glutamate receptors. Bioessays 35:929–939. 10.1002/bies.201300076 [DOI] [PubMed] [Google Scholar]
- Thomas GM, Hayashi T, Chiu SL, Chen CM, Huganir RL (2012) Palmitoylation by DHHC5/8 targets GRIP1 to dendritic endosomes to regulate AMPA-R trafficking. Neuron 73:482–496. 10.1016/j.neuron.2011.11.021 [DOI] [PMC free article] [PubMed] [Google Scholar]
- Thomas GM, Hayashi T, Huganir RL, Linden DJ (2013) DHHC8-dependent PICK1 palmitoylation is required for induction of cerebellar long-term synaptic depression. J Neurosci 33:15401–15407. 10.1523/JNEUROSCI.1283-13.2013 [DOI] [PMC free article] [PubMed] [Google Scholar]
- Ting JT, Daigle TL, Chen Q, Feng G (2014) Acute brain slice methods for adult and aging animals: application of targeted patch clamp analysis and optogenetics. Methods Mol Biol 1183:221–242. 10.1007/978-1-4939-1096-0_14 [DOI] [PMC free article] [PubMed] [Google Scholar]
- Turrigiano G. (2011) Too many cooks? intrinsic and synaptic homeostatic mechanisms in cortical circuit refinement. Annu Rev Neurosci 34:89–103. 10.1146/annurev-neuro-060909-153238 [DOI] [PubMed] [Google Scholar]
- Tyssowski KM, DeStefino NR, Cho JH, Dunn CJ, Poston RG, Carty CE, Jones RD, Chang SM, Romeo P, Wurzelmann MK, Ward JM, Andermann ML, Saha RN, Dudek SM, Gray JM (2018) Different neuronal activity patterns induce different gene expression programs. Neuron 98:530–546.e11. 10.1016/j.neuron.2018.04.001 [DOI] [PMC free article] [PubMed] [Google Scholar]
- Van Dolah DK, Mao LM, Shaffer C, Guo ML, Fibuch EE, Chu XP, Buch S, Wang JQ (2011) Reversible palmitoylation regulates surface stability of AMPA receptors in the nucleus accumbens in response to cocaine in vivo. Biol Psychiatry 69:1035–1042. 10.1016/j.biopsych.2010.11.025 [DOI] [PMC free article] [PubMed] [Google Scholar]
- Vazdarjanova A, Ramírez-Amaya V, Insel N, Plummer TK, Rosi S, Chowdhury S, Mikhael D, Worley PF, Guzowski JF, Barnes CA (2006) Spatial exploration induces ARC, a plasticity-related immediate-early gene, only in calcium/calmodulin-dependent protein kinase II-positive principal excitatory and inhibitory neurons of the rat forebrain. J Comp Neurol 498:317–329. 10.1002/cne.21003 [DOI] [PubMed] [Google Scholar]
- Wan J, Roth AF, Bailey AO, Davis NG (2007) Palmitoylated proteins: purification and identification. Nat Protoc 2:1573–1584. 10.1038/nprot.2007.225 [DOI] [PubMed] [Google Scholar]
- West AE, Greenberg ME (2011) Neuronal activity-regulated gene transcription in synapse development and cognitive function. Cold Spring Harb Perspect Biol 3:a005744. 10.1101/cshperspect.a005744 [DOI] [PMC free article] [PubMed] [Google Scholar]
- Xue M, Atallah BV, Scanziani M (2014) Equalizing excitation-inhibition ratios across visual cortical neurons. Nature 511:596–600. 10.1038/nature13321 [DOI] [PMC free article] [PubMed] [Google Scholar]
- Zhao S, Ting JT, Atallah HE, Qiu L, Tan J, Gloss B, Augustine GJ, Deisseroth K, Luo M, Graybiel AM, Feng G (2011) Cell type-specific channelrhodopsin-2 transgenic mice for optogenetic dissection of neural circuitry function. Nat Methods 8:745–752. 10.1038/nmeth.1668 [DOI] [PMC free article] [PubMed] [Google Scholar]
- Zwart R, Sher E, Ping X, Jin X, Sims JR Jr, Chappell AS, Gleason SD, Hahn PJ, Gardinier K, Gernert DL, Hobbs J, Smith JL, Valli SN, Witkin JM (2014) Perampanel, an antagonist of alpha-amino-3-hydroxy-5-methyl-4-isoxazolepropionic acid receptors, for the treatment of epilepsy: studies in human epileptic brain and nonepileptic brain and in rodent models. J Pharmacol Exp Ther 351:124–133. 10.1124/jpet.114.212779 [DOI] [PubMed] [Google Scholar]
Associated Data
This section collects any data citations, data availability statements, or supplementary materials included in this article.
Supplementary Materials
Generation of GluA1 C-terminal palmitoylation deficient mice.
GluA1 C-terminal CS mutation and silent NruI site. The serine substitution for Cys811 (C811) and silent NruI site to distinguish mutation are shown.
Southern blot analysis of genomic DNA samples from ES cells. Left: digestion with EcoRI and hybridized with 5’ probe, middle: digestion with EcoRI and hybridized with 3’ probe, right: digestion with ScaI and hybridized with 3’ probe. Wild-type (wt/wt) and GluA1CS heterozygote (wt/CS-Neo(+)) are indicated.
Genomic Southern blot from mice tail samples digested with ScaI and hybridized with 3’ probe. Chimera and Neo-loxP deletion by mating with CAG-Cre mice (chimera/Cre) are shown.
PCR analysis of mice tail samples from wild-type (wt/wt), GluA1CS heterozygote (wt/CS) and GluA1CS homozygote (CS/CS).
Macroscopic brain structure. Nissl-stained coronal sections from anterior to posterior in wt or CS/CS mice, showing no gross abnormalities in the cytoarchitecture. Scale bar, 1 mm.
Download Figure 1-1, TIF file (2.9MB, tif)
Normal basic membrane properties in GluA1 C811S mutant mice. Whole-cell recordings were performed from a CA1 pyramidal neuron in current-clamp mode. Currents were injected, in a stepwise manner, to compare firing properties between wt and CS/CS mice.
Typical firing patterns at 200 pA are shown.
The average values for input/output relationship (between genotypes: F1, 28 = 2.29, p = 0.14 by two-way repeated measures ANOVA).
Resting potential (p = 0.57, t-test).
Input resistance (p = 0.23, t-test).
Action potential threshold (p = 0.25, t-test).
Action potential amplitude (p = 0.20, t-test).
Wt (white, n = 14 cells, N = 3 mice) and CS/CS (black, n = 16 cells, N = 3 mice) for all groups. n.s.: no statistical significance (p > 0.05). Error bars represent s.e.m. Download Figure 3-1, TIF file (2.9MB, tif)
Abnormal chemical LTP in GluA1 C811S mutant mice. The cumulative frequency of cLTP-induced spine volume enhancements on each dendrite. [wt (control)]: n = 12 dendrites, [CS/CS (control)]: n = 9 dendrites, [wt (cLTP)]: n = 9 dendrites, [CS/CS (cLTP)]: n = 8 dendrites. Download Figure 5-1, TIF file (2.9MB, tif)
Epileptic seizure evoked by treating mice with pentylenetetrazole (PTZ).
Occurrence of generalized tonic-clonic seizures (stage 5) in 7 weeks old wt (white bars) and CS/CS (black bars) mice received a single injection of PTZ at a dose of 40 (right, n = 13, 15, respectively) or 60 (left, n = 17, 16, respectively) mg/kg.
Occurrence of generalized tonic-clonic seizures (stage 5) in 13 weeks old wt (white bars) and CS/CS (black bars) mice received a single injection of PTZ at a dose of 40 (right, n = 12, 12, respectively) or 60 (left, n = 13, 13, respectively) mg/kg.
Error bars represent s.e.m. **p < 0.01, t-test. Download Figure 6-1, TIF file (2.9MB, tif)
c-Fos and Arc protein expressions in three areas of the cortex. Wt (white bars) and CS/CS (black bars) mice received a single injection of PTZ at a dose of 0, 20, 40 or 60 mg/kg and fixed 2 h after PTZ administration. Brain sections were incubated with each antibody and DAPI. Ratio of c-Fos or Arc-positive to DAPI-positive cells are shown.
c-Fos expression in the parietal association (PtA) cortex (n = 6, respectively, F7, 40 = 3.78, p = 0.0031).
c-Fos expression in the primary somatosensory (S1) cortex (n = 6, respectively, F7, 40 = 3.273, p = 0.0076).
c-Fos expression in the primary motor (M1) cortex (n = 7, respectively, F7, 48 = 4.411, p = 0.0008).
Arc expression in the parietal association (PtA) cortex (n = 4, respectively, F7, 24 = 1.727, p = 0.1501).
Arc expression in the primary somatosensory (S1) cortex (n = 4, respectively, F7, 24 = 1.19, p = 0.3456).
Arc expression in the primary motor (M1) cortex (n = 4, respectively, F7, 24 = 0.3123, p = 0.9412).
Error bars represent s.e.m. ANOVA with Tukey post hoc test. *p < 0.05, **p < 0.01, ***p < 0.001, compared to wt controls. Download Figure 7-1, TIF file (2.9MB, tif)
Inhibitory effects of anticonvulsants on PTZ-evoked seizure. Seizure scores (A, B) and repeated times of generalized tonic-clonic seizures (C, D) in 7 weeks old wt (white bars) and CS/CS (black bars) mice received an administration of VPA or PB for indicated periods before a single injection of 60 mg/kg PTZ.
Time course of VPA effects at doses of 300 mg/kg. Four white bars [wt]: n = 19, 10, 10, 10, four black bars [CS/CS]: n = 19, 12, 11, 11 (left to right). F7, 94 = 12.59, p < 0.0001.
Time course of VPA effects at doses of 400 mg/kg. Four white bars [wt]: n = 19, 10, 11, 10, four black bars [CS/CS]: n = 19, 10, 12, 12 (left to right). F7, 95 = 8.950, p < 0.0001.
Time course of PB effects on occurrence of generalized tonic-clonic seizures at doses of 5 mg/kg. Four white bars [wt]: n = 17, 7, 8, 8, four black bars [CS/CS]: n = 16, 9, 9, 7 (left to right). F7, 73 = 1.958, p = 0.043.
Time course of PB effects on occurrence of generalized tonic-clonic seizures at doses of 10 mg/kg. Four white bars [wt]: n = 17, 9, 12, 9, four black bars [CS/CS]: n = 16, 10, 8, 8 (left to right). F7, 81 = 5.050, p < 0.0001.
Error bars represent s.e.m. ANOVA with Tukey-Kramer post hoc test *p < 0.05, **p < 0.01, compared to wt controls. Download Figure 9-1, TIF file (2.9MB, tif)