

Abstract
There is an ongoing debate on the contribution of the neuronal glutamate transporter EAAC1 to the onset of compulsive behaviors. Here, we used behavioral, electrophysiological, molecular, and viral approaches in male and female mice to identify the molecular and cellular mechanisms by which EAAC1 controls the execution of repeated motor behaviors. Our findings show that, in the striatum, a brain region implicated with movement execution, EAAC1 limits group I metabotropic glutamate receptor (mGluRI) activation, facilitates D1 dopamine receptor (D1R) expression, and ensures long-term synaptic plasticity. Blocking mGluRI in slices from mice lacking EAAC1 restores D1R expression and synaptic plasticity. Conversely, activation of intracellular signaling pathways coupled to mGluRI in D1R-containing striatal neurons of mice expressing EAAC1 leads to reduced D1R protein level and increased stereotyped movement execution. These findings identify new molecular mechanisms by which EAAC1 can shape glutamatergic and dopaminergic signals and control repeated movement execution.
SIGNIFICANCE STATEMENT Genetic studies implicate Slc1a1, a gene encoding the neuronal glutamate transporter EAAC1, with obsessive-compulsive disorder (OCD). EAAC1 is abundantly expressed in the striatum, a brain region that is hyperactive in OCD. What remains unknown is how EAAC1 shapes synaptic function in the striatum. Our findings show that EAAC1 limits activation of metabotropic glutamate receptors (mGluRIs) in the striatum and, by doing so, promotes D1 dopamine receptor (D1R) expression. Targeted activation of signaling cascades coupled to mGluRIs in mice expressing EAAC1 reduces D1R expression and triggers repeated motor behaviors. These findings provide new information on the molecular basis of OCD and suggest new avenues for its treatment.
Keywords: dopamine, glutamate, mGluR, striatum, synaptic transmission, transporter
Introduction
Persistent thoughts, anxiety, and repeated execution of stereotyped movements are hallmark features of neuropsychiatric disorders such as obsessive-compulsive disorder (OCD) (Kessler et al., 2005). Family-based linkage analyses identify the gene Slc1a1, which encodes the neuronal glutamate transporter EAAC1, as one of the strongest candidate genes for OCD (Hanna et al., 2002; Arnold et al., 2006; Dickel et al., 2006; Stewart et al., 2007; Shugart et al., 2009; Wendland et al., 2009; Samuels et al., 2011). Alternative isoforms of Slc1a1 that are differentially regulated in OCD patients have been shown to impair glutamate uptake via EAAC1 (Porton et al., 2013). One of the hypotheses that has been put forward is that loss of function of EAAC1 leads to increased extracellular glutamate concentration and hyperactivity in the brain (Porton et al., 2013). This hypothesis is not consistent with functional studies in vitro indicating that regulation of the ambient glutamate concentration in the brain does not rely on neuronal but rather glial glutamate transporters (Jabaudon et al., 1999; Cavelier and Attwell, 2005; Le Meur et al., 2007), which are ∼100 times more abundantly expressed than neuronal transporters (Holmseth et al., 2012). Our own previous work shows that EAAC1 exerts a powerful control of phasic glutamatergic synaptic transmission, but does not alter the ambient glutamate concentration in the hippocampus (Scimemi et al., 2009). Despite these findings, our knowledge on the function of EAAC1 in regions of the brain that show structural and functional abnormalities in patients with OCD, such as the striatum, remains limited.
The striatum is the main entry point of excitatory inputs to the basal ganglia and exerts a fundamental role in the control of anxiety and movement execution (Piras et al., 2015). In the striatum, glial glutamate transporters clear synaptically released glutamate from the extracellular space and regulate GluA/N activation, similar to what they do in the hippocampus (Goubard et al., 2011). EAAC1 is abundantly expressed in the striatum, but its role in regulating synaptic function has so far remained elusive (Danbolt, 2001; Holmseth et al., 2012). Here, we show that loss of EAAC1 is associated with increased stereotyped movement execution and anxiety-like behaviors in mice. In the striatum, EAAC1 limits group I metabotropic glutamate receptor (mGluRI) activation and, by doing so, promotes D1 dopamine receptor (D1R) expression. Blocking mGluRIs in mice lacking EAAC1 and cell-specific activation of signaling cascades coupled to mGluRI in mice expressing EAAC1 allow for bidirectional control of D1R expression, synaptic plasticity, and repeated movement execution. These results identify new molecular mechanisms by which EAAC1 controls the function of the striatum and point to its pivotal role as a molecular switch controlling mGluRI activation, glutamatergic and dopaminergic transmission, and ultimately the execution of persistent motor behaviors.
Materials and Methods
Ethics statement
All experimental procedures were performed in accordance with protocols approved by the Institutional Animal Care and Use Committee at the State University of New York (SUNY)–Albany and guidelines described in the National Institutes of Health's Guide for the Care and Use of Laboratory Animals.
Mice
All mice were group housed and kept under a 12 h light cycle (7:00 A.M. on, 7:00 P.M. off) with food and water available ad libitum. Constitutive EAAC1 knock-out mice (EAAC1−/−) were obtained by targeted disruption of the Slc1a1 gene via insertion of a pgk neomycin resistance cassette in exon 1 of the Slc1a1 gene, as originally described by Peghini et al. (1997). EAAC1−/− breeders were generated after back-crossing EAAC1+/− mice with C57BL/6 mice for >10 generations, as described by Scimemi et al. (2009). C57BL/6 wild-type (WT) and EAAC1−/− mice at postnatal day 0 (P0) to P35 were identified by PCR analysis of genomic DNA. EAAC1−/− mice develop normally during the first 5 weeks of postnatal life. They are fertile and, although they give birth to smaller litters (number of pups in each litter: WT 8.2 ± 0.3 (n = 43), EAAC1−/− 6.5 ± 0.4 (n = 42), ***p = 8.0e-4), the litters are as viable as those of WT mice (perinatal mortality rate: WT 0.23 ± 0.04 (n = 40), EAAC1−/− 0.30 ± 0.06 (n = 41), p = 0.30) and have a similar sex distribution (proportion of females in each litter: WT 0.47 ± 0.04 (n = 32), EAAC1−/− 0.51 ± 0.03 (n = 26), p = 0.52). These data are consistent with previous phenotypic characterization of EAAC1−/− mice (Peghini et al., 1997).
D1Cre/+ mice (RRID:MMRRC_030778-UCD; Stock Tg(Drd1-cre)EY217Gsat/Mmucd) and A2ACre/+ mice (RRID:MMRRC_036158-UCD; Stock B6.FVB(Cg)-Tg(Adora2a-cre)KG139Gsat/Mmucd) (Gong et al., 2003; Gong et al., 2007) were kindly provided by Drs. A.V. Kravitz and C.F. Gerfen (National Institute of Diabetes and Digestive and Kidney Diseases –National Institutes of Health). In these mice, the protein Cre-recombinase is expressed under the control of the promoter for D1Rs and the adenosine receptor 2, which colocalizes with D2 dopamine receptors (D2Rs), respectively. Ai9Tg/Tg conditional reporter mice [RRID:IMSR_JAX:007909; Stock B6.Cg-Gt(ROSA)26Sortm9(CAG-tdTomato)Hze; Madisen et al., 2010] were kindly provided by Dr. P.E. Forni (SUNY–Albany). D1tdTomato/+ mice were purchased from The Jackson Laboratory [RRID:IMSR_JAX:016204; Stock Tg(Drd1a-tdTomato)6Calak].
Genotyping was performed on toe tissue samples of P7–P10 mice. Briefly, tissue samples were digested at 55°C overnight in a lysis buffer containing the following (in mm): 100 Tris base, pH 8, 5 EDTA, and 200 NaCl, along with 0.2% SDS and 100 μg/ml proteinase K. DNA samples were diluted in nuclease-free water (500 ng/μl) and processed for PCR analysis. The PCR primers used for EAAC1, D1RCre/+, A2ACre/+, D1tdTomato/+, and Ai9 were purchased from Fisher Scientific and their nucleotide sequence is listed in Table 1. The PCR protocol for EAAC1, D1RCre/+, A2ACre/+, D1tdTomato/+, and Ai9 are described in Tables 2, 3, 4, and 5. PCRs for D1tdTomato/+ were performed using a Hotstart Taq polymerase (catalog #KK5621; KAPA Biosystems). For all other reactions, we used standard TaqDNA Polymerase (catalog #R2523; Millipore Sigma).
Table 1.
Sequence of primers used for PCR analysis
| Gene | Primer forward | Primer reverse | Band size (bp) |
|---|---|---|---|
| EAAC1+/+ | 5' AGAAGCTCCTCGGTGGGACAC 3' | 5' GAGAGCAGCAGCCAGTGATTC 3' | 358 |
| EAAC1−/− | 5' CTGTGCTCGACGTTGTCACTG 3' | 5' GAGAGCAGCAGCCAGTGATTC 3' | 680 |
| D1Cre/+ | 5' GCTATGGAGATGCTCCTGATGGAA 3' | 5' CGGCAAACGGACAGAAGCATT 3' | 340 |
| A2ACre/+ | 5' CGTGAGAAAGCCTTTGGGAAGCT 3' | 5' CGGCAAACGGACAGAAGCATT 3' | 350 |
| Ai90/0 | 5' AAGGGAGCTGCAGTGGAGTA 3' | 5' CCGAAAATCTGTGGGAAGTC 3' | 297 |
| Ai9Tg/0 | 5' CTGTTCCTGTACGGCATGG 3' | 5' GGCATTAAAGCAGCGTATCC 3' | 196 |
| D1tdTomato/+ | 5' CTTCTGAGGCGGAAAGAACC 3' | 5' TTTCTGATTGAGAGCATTCG 3' | 750 |
Table 2.
PCR protocol for EAAC1
| Initiation/melting | Denaturation | Annealing | Elongation | Amplification | Hold | |
|---|---|---|---|---|---|---|
| Temperature (°C) | 95 | 95 | 63 | 72 | 72 | 4 |
| Duration (min) | 3 | 0.5 | 0.5 | 1.5 | 10 | ∞ |
| Cycles | 1 | 34 | 1 | |||
Table 3.
PCR protocol for D1Cre/+ and A2ACre/+
| Step | Initiation/Melting | Denaturation | Annealing | Elongation | Amplification | Hold |
|---|---|---|---|---|---|---|
| Temperature (°C) | 94 | 94 | 65–55 | 72 | 72 | 4 |
| Duration (min) | 5 | 0.25 | 0.5 | 0.17 | 5 | ∞ |
| Cycles | 1 | 40 (1–10: ΔTAnneal − 1°C/cycle) | 1 | |||
Table 4.
PCR protocol for D1tdTomato/+
| Step | Initiation/melting | Denaturation | Annealing | Elongation | Amplification | Hold |
|---|---|---|---|---|---|---|
| Temperature (°C) | 95 | 95 | 60 | 72 | 72 | 4 |
| Duration (min) | 3 | 0.25 | 0.25 | 0.25 | 1 | ∞ |
| Cycles | 1 | 35 | 1 | |||
Table 5.
PCR protocol for Ai9
| Step | Initiation/melting | Denaturation | Annealing | Elongation | Amplification | Hold |
|---|---|---|---|---|---|---|
| Temperature (°C) | 94 | 94 | 65–60 | 72 | 72 | 10 |
| Duration (min) | 2 | 0.33 | 0.25 | 0.17 | 2 | ∞ |
| Cycles | 1 | 38 (1–10: ΔTAnneal − 0.5°C/cycle) | 1 | |||
Behavior
Before performing any behavioral test, mice were acclimated to a new behavioral suite for at least 30 min. All mice were tested between 9:00 A.M. and 1:00 P.M. A battery of behavioral tests was performed on naive WT and EAAC1−/− mice (P14–P35) and on WT and D1Cre/+ and A2ACre/+ mice subjected to AAV-hSyn-DIO-hM3D(Gq)-mCherry stereotaxic and clozapine-N-oxide (CNO) intraperitoneal injections according to the experimental design described in the Results. The battery of behavioral tests included grooming, SmithKline-Beecham Harwell Imperial-College and Royal-London-Hospital Phenotype Assessment (SHIRPA), flying saucer, open-field, elevated plus maze, and marble-burying tests, performed as described below. Each behavioral apparatus was cleaned with 70% ethanol between each test.
Grooming test.
The behavioral arena used to acquire videos for the grooming analysis consisted of four chambers with clear bottom and white sidewalls (L 15 cm × W 25 cm × H 15 cm). A digital SLR camera (Canon EOS Rebel T3i with EF-S 18–55 mm f/3.5–5.6 IS lens, 60 fps) was positioned 15–30 cm below the grooming chamber to acquire 10-min-long videos in which we monitored the grooming behavior of each mouse. The distance traveled by the forepaws during grooming was analyzed using M-Track, a newly developed tracking algorithm (Reeves et al., 2016). The identification of the phase composition of each grooming episode was performed according to the scaling system described by Kalueff et al. (2007). Briefly, we identified phases in which there was no grooming (Phase 0), paw licking (Phase 1), face wash (Phase 2), body grooming (Phase 3), hind leg licking (Phase 4) and tail/genitals grooming (Phase 5). Correct transitions between grooming phases include the progressive transitions through all the steps of a grooming syntactic chain (e.g., 0–1, 1–2, 2–3, 3–4, 4–5, and 5–0). Any other transition that did not follow this order was classified as incorrect (Kalueff et al., 2007).
SHIRPA test.
The SHIRPA protocol is a collection of simple tests that provide a standardized, high-throughput screen for assessing the phenotype of WT and EAAC1−/− mice (P14–P35) (Rogers et al., 1997; Rogers et al., 1999). The SHIRPA test is effective in distinguishing qualitative differences between different strains of mice. The following tests and scores were included in the SHIRPA protocol.
Condition score (1–5): emaciated (1), thin (2), normal (3), overconditioned (4), and obese (5).
Gait (0–1; monitors exaggerated limb movements, dragging, and uneven cadence): abnormal (0), normal (1).
Posture: (0–1; monitors the presence of rounded or hunched body, head tilt, and tail dragging): abnormal (0), normal (1).
Body tone (0–3; mouse is held by the tail base on a hard surface and gently pressed with two fingers over the mid-dorsum): flaccid (0), allows depression to the floor (1), allows some flattening (2), hunches back to completely resist compression (3).
Petting escape (0–3; mouse is held by the tail base on a hard surface and stroked down its flanks from front to back): no reaction (0), difficult to elicit escape response (1), easy to elicit escape response (2), difficult to test because of spontaneous escape attempts (3).
Passivity (0–3; mouse is held by the tail and the front paws placed on the edge of the cage top; normal mice promptly climb up to the top of the cage; falling off or hanging without climbing is abnormal): falls (0), delayed or unsuccessful attempt to climb up (1), normal (2), hyperactive (3).
Trunk curl (0–3; mouse is suspended from the tail for 15 s and monitored for curling of trunk): zero or abnormal response (e.g., hindlimb clasping) (0), curls <90° (1), curls to 90° or more (2), climbs up the tail (3).
Righting (0–3; one hand is used to hold the mouse by the tail base and the other to provide a vertical surface; normal mice feel the surface of the hand and quickly flip over): mouse does not right itself (0), struggles to right itself (1), rights itself (2), hyperactive (3).
Visual placing/reach touch (0–1; mouse is held by the tail and lowered slowly toward the cage lid): blind mice do not reach out until forelimbs or whiskers touch (0), normal mice start to reach toward the surface well before touching it (1).
Whisker response (0–3; vibrissae are stimulated using a cotton-tipped applicator; touching vibrissae should elicit a response, including cessation of “whisking” or a subtle responsive nose quiver): no response (0), response difficult to elicit (1), normal response (2), hyperactive response (3).
Ear twitch (0–3; a cotton-tipped applicator is used to gently touch the ear pinna; a normal response is a rapid ear twitch): no response (0), difficult to elicit response (1), obvious response (2), hyper-repetitive response (3).
Palpebral reflex (0–3; a cotton-tipped applicator is used to gently touch the cornea): no reaction (0), slow blink (1), quick blink (2), hyper-repetitive blinking (3).
Forelimb place (0–3; mouse is held by the tail on a hard surface and a forelimb is gently moved out to the side using a cotton-tipped applicator; a normal response is to return the limb under the body immediately): leg stays where placed (0), slow or incomplete return (1), promptly returns the leg to normal position (2), hyperactive response (3).
Withdrawal (0–3; mouse is held by the tail on a hard surface and the hindlimb is picked up and pulled out at a 45° angle until it is stretched and then let go; a normal mouse rapidly returns the hindlimb to normal position): leg drops to ground and does not return to normal position (0), leg slow to return (1), rapid return (2), hyperactive response (3).
Biting (0–1; a wooden stick is placed in front of the mouse's mouth; the most common reaction is to ignore or turn away from the stick): no biting (0), biting (1).
Clicker (hearing test; 0–3; mouse is held by the tail base on a hard surface and a clicker is used once after a moment of silence to monitor for an ear flick or stop response): no response (0), difficulty in eliciting response (1), immediate response (2), abnormal response (3).
Grip: mouse is placed on a wire metal grid 1–2 feet above ground, a timer is started, the grid shaken gently, and then rapidly flipped over. The time until the mouse falls off the grid is measured (in seconds).
Flying saucer (running wheel) test.
A plastic flying saucer disk (∅ = 13 cm) connected to an odometer (Model #SD-548B; Shenzhen Sunding Electron) was positioned in a standard rat cage. The distance and time spent on the flying saucer were monitored over a period of 30 min.
Open-field test.
In the open-field test, we monitored the position of a mouse freely moving in a white Plexiglas box (L 46 cm × W 46 cm × H 38 cm). Each mouse was video monitored for 15 min using a Live! Cam Sync HD webcam (Model #VF0770; Creative Labs). Videos were analyzed using AnyMaze (Stoelting).
Elevated plus maze test.
The elevated plus maze consisted of 2 open and 2 closed arms (L 35.6 cm × W 5 cm) that extended from a center platform (L 5 cm × W 5 cm) elevated 52 cm from the floor. Each mouse was placed in the center area of the elevated plus maze facing an open arm and allowed to move freely between the arms for 15 min. Each mouse was video monitored for 15 min using a Live! Cam Sync HD webcam (Model #VF0770; Creative Labs). Videos were analyzed using AnyMaze (Stoelting). The number of entries and the amount of time spent in the open and closed arms were assessed as indices of anxiety-like behaviors.
Marble-burying test.
A mouse cage was filled with 5 cm bedding material and on top of it were arranged 24 glass marbles (∅ = 0.6 cm) in a 4 × 6 grid (distance from cage walls = 1.3 cm; distance between marbles = 3.8 cm). Each mouse spent 30 min in this cage. At the end of this time, the marbles that had ≥50% of their top surface covered with bedding material were counted.
Real-time quantitative PCR
Acute brain slices were prepared from WT and EAAC1−/− mice of either sex (P16–P24), which were deeply anesthetized with isoflurane and decapitated in accordance with SUNY–Albany Animal Care and Use Committee guidelines. The brain was rapidly removed and placed in ice-cold slicing solution bubbled with 95% O2/5% CO2 containing the following (in mm): 119 NaCl, 2.5 KCl, 0.5 CaCl2, 1.3 MgSO4 · H2O, 4 MgCl2, 26.2 NaHCO3, 1 NaH2PO4, and 22 glucose, 320 mOsm, pH 7.4. Coronal brain slices (250 μm thick) were prepared using a vibrating blade microtome (VT1200S; Leica Microsystems). The slices were transferred to an ice-cold RNA stabilizing solution (catalog #76106; Qiagen) in which the dorsolateral striatum (DLS) was separated from the ventromedial striatum (VMS). The total RNA was purified and transcribed into cDNA using TaqDNA polymerase (catalog #201205; Qiagen) according to the manufacturer's instructions. We measured transcriptional levels of Drd1a and Drd2 in triplicate samples using the TaqMan gene expression assays (Thermo Fisher Scientific). Each PCR was run as a duplex reaction using the housekeeping gene Hprt1 as an internal control. We used the following primers to measure the amount of cDNA for Drd1a, Drd2 and Hprt: Drd1a (catalog #Mm02620146_s1, FAM-MGB), Drd2 (catalog #Mm00438545_m1, FAM-MGB), Slc1a1 (catalog #Mm00436587_m1, FAM-MGB), Hprt1 (catalog #Mm00446968_m1, VIC-MGB) (Thermo Fisher Scientific). All reactions were either performed using the TaqMan Universal Master Mix II (catalog #4440042; Thermo Fisher Scientific) or nuclease-free water (Millipore catalog #W4502 Sigma). Initial validation experiments were performed using a range of cDNA dilutions to ensure similar amplification efficiency of all target cDNAs. A no-template control (NTC) in which cDNA was omitted from the reaction mixture was used to monitor contamination and primer–dimer formation that could produce false-positive results. In each experiment, the threshold cycle (CT) at which fluorescence from amplification exceeded the background fluorescence values was set within the exponential growth region of the amplification curve. qRT-PCR data were analyzed using the comparative CT method as described by Schmittgen and Livak (2008). In each sample, we calculated the difference between the CT values (ΔCT) for Drd1a, Drd2, or Slc1a1 and the housekeeping gene Hprt. Then, we calculated the difference in the ΔCT values between the test and NTC samples and calculated 2−ΔCT. The ratio of these values was used to calculate the relative expression of different genes in samples from WT and EAAC1−/− mice (see Fig. 6).
Figure 6.
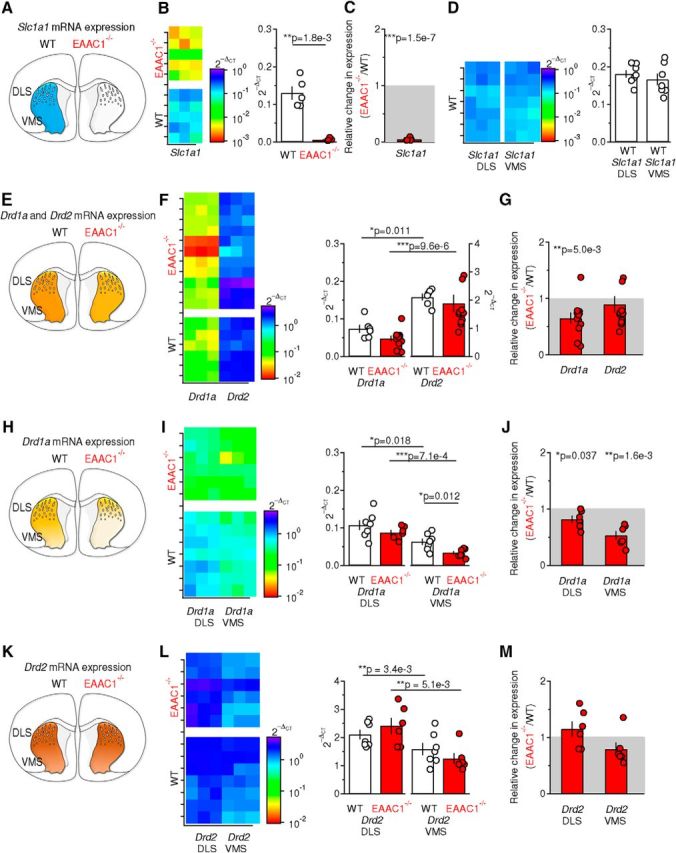
mRNA levels of D1R are reduced in the DLS and VMS of EAAC1−/− mice. A, Schematic representation of a coronal section of the mouse brain. The blue region defines the WT striatum, in which the Slc1a1 gene encoding EAAC1 is abundantly expressed. B, Left, Color map representation of the Slc1a1 levels in striatal samples from WT mice (n = 5) and EAAC1−/− mice (n = 5) measured in qRT-PCR experiments. Each sample was run in triplicates (x-axis). Right, Relative amount of the Slc1a1 gene with respect to the Hprt housekeeping gene in WT and EAAC1−/− mice, measured as 2−ΔCT (**p = 1.8e-3). C, Fold change in Slc1a1 expression in EAAC1−/− versus WT mice (2−ΔCT). Negligible levels of Slc1a1 (***p = 1.5e-7) are detected in EAAC1−/− mice. D, Left, Same experiments as described in B, left, performed on samples from the DLS or VMS of WT mice (n = 7). Right, As in B, right, bit for samples from the DLS and VMC. No significant difference was detected in the expression levels of Slc1a1 between the WT DLS and VMS (p = 0.42). E, Schematic representation of a coronal section of the mouse brain in which the striatum from which we extracted the mRNA, is highlighted in yellow. The lighter shade of yellow indicates lower Drd1a gene expression levels in EAAC1−/− mice. F, Left, Color map representation of the Drd1a and Drd2 levels in WT mice (n = 6) and EAAC1−/− mice (n = 10) measured in qRT-PCR experiments. Each sample was run in triplicate (x-axis). Right, Relative amount of the Drd1a and Drd2 gene with respect to the Hprt housekeeping gene in WT and EAAC1−/− mice, measured as 2−ΔCT. Higher levels of Drd2 are detected in WT mice (*p = 0.011) and EAAC1−/− mice (***p = 9.6e-6). G, Fold change in Drd1a and Drd2 expression in EAAC1−/− versus WT mice (2−ΔCT). Reduced levels of Drd1a (**p = 5.0e-3), not Drd2 (p = 0.48), are detected in EAAC1−/− mice. H–J, As in E–G but on samples from the DLS and VMS of WT mice (n = 7) and EAAC1−/− mice (n = 6). Lower levels of Drd1a were detected in the VMS of WT mice (*p = 0.018) and EAAC1−/− mice (***p = 7.1e-4). In the VMS, there was a significant reduction in the level of Drd1a (*p = 0.012). A significant WT-fold change inDrd1a was detected in the DLS (*p = 0.037) and VMS (**p = 1.6e-3) of EAAC1−/− mice. K–M, As in E–G but for Drd2. The level of Drd2 was lower in the VMS compared with the DLS in WT mice (n = 7, **p = 3.4e-3) and EAAC1−/− mice (n = 6, **p = 5.1e-3). No significant WT-fold change was detected in the expression level of Drd2 in the DLS and VMS of EAAC1−/− mice.
Fluorescence labeling and imaging
D1Cre/+:Ai9Tg/0, D1tdTomato/+, A2ACre/+:Ai9Tg/0, D1Cre/+:Ai9Tg/0:EAAC1−/−, D1tdTomato/+:EAAC1−/−, and A2ACre/+:Ai9Tg/0:EAAC1−/− mice (P21–P37) were deeply anesthetized with an intraperitoneal injection of pentobarbital (4 mg/g, w/w; catalog #54925-045-10; Med-Pharmex) and transcardially perfused with 20 ml of PBS 0.1 m and 20 ml of 4% paraformaldehyde in PBS (4% PFA/PBS) at 4°C. The dissected brains were postfixed overnight at 4°C in 4% PFA/PBS and cryoprotected at 4°C in 30% sucrose/PBS. Coronal sections (40 μm thick) were prepared using a vibrating blade microtome (VT1200S; Leica Microsystems). All sections were postfixed for 20 min at 4°C in 4% PFA/PBS. Sections used for cell density measures were then washed in PBS and mounted onto microscope slides using ProLong Gold anti-fade mounting medium (catalog #P36934; Thermo Fisher Scientific) or DAPI Fluoromount-G (catalog #0100–20; Southern Biotech). The sections were then blocked and permeabilized for 1 h at room temperature (RT) in a solution of PBS containing horse serum 10%, BSA 3%, and Triton X-100 0.5%. The primary antibody incubation was performed by incubating the sections overnight at 4°C in a solution of PBS containing horse serum 3%, BSA 1%, and Triton X-100 0.3% and one or more of the following primary antibodies: polyclonal rabbit anti-D1- or D2 dopamine receptor (1:100, RRID:AB_2039826 and RRID:AB_2039828, respectively; Alomone Labs). The secondary antibody incubation was performed for 2 h at RT using Alexa Fluor 488 goat anti-rabbit IgG (RRID:AB_2576217; Thermo Fisher Scientific) diluted to 1:500 in 0.1% Triton X-100/PBS. The brain sections were mounted onto microscope slides using ProLong Gold antifade mountant (catalog #P36934, Thermo Fisher Scientific) or DAPI Fluoromount-G (catalog #0100–20; Southern Biotech). Confocal images were acquired using a Zeiss LSM710 inverted microscope equipped with 405 nm diode and 488 nm Ar and 561 nm DPSS lasers. All images (1024 × 1024 pixels) were acquired using a 63× oil-immersion objective (numerical aperture = 1.4) as averages of 16 consecutive images.
The image analysis was performed using Fiji software (https://fiji.sc/). Cell density measures were obtained by counting the number of immunolabeled D1R- and D2R-expressing medium spiny neurons (D1- and D2-MSNs, respectively) in matrix areas of the DLS and VMS. The proportion of D1- and D2-MSNs was calculated as the ratio of D1Cre/+:Ai9Tg/0 or A2ACre/+:Ai9Tg/0 and the total number of cell nuclei labeled with DAPI (data not shown). The n values reported in the text refer to the number of mice used for these experiments. Data were collected from at least three sections from each mouse.
Western blot
Western blot experiments were performed on protein extracts from the striatum of WT and EAAC1−/− mice of either sex (P21–P36). Membrane and cytoplasmic protein extracts were obtained using the Mem-PER Plus Membrane Protein Extraction Kit (catalog #89842; Thermo Fisher Scientific) according to the manufacturer's instructions using a mixture of protease and phosphatase inhibitors (10 μl/ml, catalog #78441; Thermo Fisher Scientific). The membrane protein extracts were used to measure protein levels of D1R and D2R (see Figs. 7, 10, 11), mGluRIs (see Fig. 4K), GLAST, and GLT-1 (data not shown). The cytoplasmic protein extracts were used to measure protein levels of the Dopamine- And cAMP-Regulated Phospho Protein 32 kDa (DARPP-32) and of its phosphorylated version (pDARPP-32; see Figs. 7, 10, 11). The protein concentration was determined using spectrophotometer measures. We loaded equal amounts of proteins from WT and EAAC1−/− mice in acrylamide gels (50–100 μg of proteins in 10–12% acrylamide gels). The proteins were blotted onto PVDF membranes (catalog #P2563; Millipore Sigma) using a semidry blotting approach. The membranes were then blocked with 5% nonfat milk in TBST, pH 7.6, and probed using a primary antibody solution in which milk was replaced by BSA (5% BSA in TBST; pH 7.6). We used the following primary antibodies: rabbit anti D1R and D2R (1:200, RRID:AB_2039826 and RRID:AB_2039828 respectively; Alomone Labs); rabbit anti mGluR5/1a (1:500, RRID:AB_2492152; PhosphoSolutions); rabbit anti GLAST (1:1000, RRID:AB_10695722; Cell Signaling Technology); rabbit anti GLT-1 (1:1000, RRID:AB_2190743; Cell Signaling Technology); rabbit anti DARPP-32 (1:1000, RRID:AB_823479; Cell Signaling Technology); rabbit antibodies against different pDARPP-32 isoforms (pDARPP-32T34, 1:500, catalog #12438; Cell Signaling Technology), (pDARPP-32T75 and pDARPP-32S97, 1:1000, RRID:AB_2169010 and RRID:AB_11217633, respectively; Cell Signaling Technology), (pDARPP-32S130, 1:500, RRID:AB_2492070; PhosphoSolutions), mCherry (RRID:AB_2614470; Rockland Antibodies and Assays), and β-actin (1:1000, RRID:AB_2223172; Cell Signaling Technology). The membranes were incubated with the primary antibodies overnight. The pDARPP-32S130 antibody was incubated at RT; all other antibodies were incubated at 4°C. The secondary antibody incubation (biotinylated horse anti-rabbit IgG, RRID:AB_2336201; Vector Laboratories) was performed for 1–2 h at RT with 5% nonfat milk in TBST, pH 7.6. The following secondary antibody dilutions were used for different proteins: 1:200 pDARPP-32T34; 1:500 mCherry; 1:1000 for D2R, GLAST, GLT-1, and pDARPP-32S130; 1:2000 mGluRI; 1:3000 pDARPP-32T75; 1:4000 D1R; and 1:5000 pDARPP-32S97 and β-actin). Preadsorption experiments were performed using the control antigen provided by the supplier of the primary antibodies (Alomone Labs) according to the manufacturer's instructions (1 μg/μg antibody). We amplified the immunolabeling reactions with the Vectastain ABC kit (1:1000 for pDARPP-32T34 and 1:2000 for all other proteins, RRID:AB_2336819; Vector Laboratories) and the Clarity Western ECL (catalog #170–5060; Bio-Rad) as a substrate for the peroxidase enzyme. For semiquantitative analysis, protein band images were collected as 16-bit images using a digital chemiluminescence imaging system (ChemiDoc, Bio-Rad or c300, Azure Biosystems) at different exposures (0.5–200 s). Each image was converted to an 8-bit image for image analysis, which was performed using Fiji software. Only images collected at exposure times that did not lead to pixel saturation were included in the analysis. The intensity of each band was calculated as the mean gray value in an ROI surrounding each band of interest in three images collected using different exposure times. All band intensity values were normalized for the band intensity of β-actin in the same sample.
Figure 7.
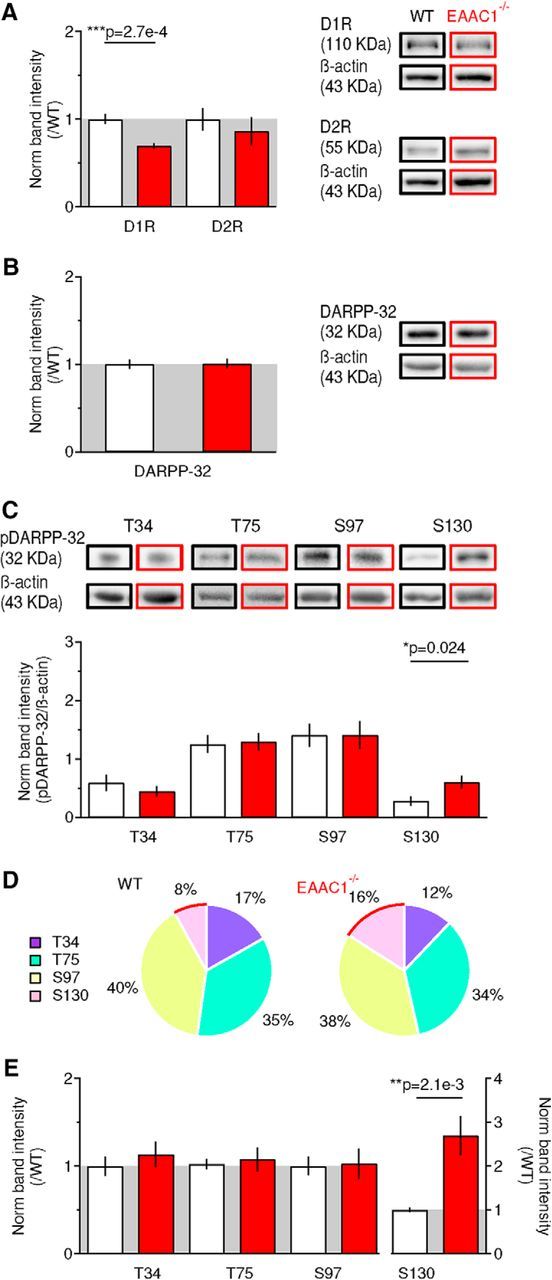
Reduced expression of D1R in EAAC1−/− mice is associated with altered phosphorylation of DARPP-32. A, Western blots for D1R, D2R, and β-actin in WT mice (n = 11) and EAAC1−/− mice (n = 8) show decreased levels of D1R (***p = 2.7e-4), not D2R (p = 0.51), in EAAC1−/− mice. B, Western blot analysis for DARPP-32 showing no significant difference in its expression between WT mice (n = 15) and EAAC1−/− mice (n = 12, p = 0.92). C, Western blot analysis for pDARPP-32T34 [WT mice (n = 10), EAAC1−/− mice (n = 10), p = 0.41), pDARPP-32T75 (WT mice (n = 13), EAAC1−/− mice (n = 14), p = 0.84), pDARPP-32S97 (WT mice (n = 13), EAAC1−/− mice (n = 13), p = 0.98), pDARPP-32S130 (WT mice (n = 14), EAAC1−/− mice (n = 17), *p = 0.024]. D, Pie chart representation of the phosphorylation distribution on the T34, T75, S97, and S130 sites of DARPP-32. The red curve highlights the S130 site, which shows increased phosphorylation in EAAC1−/− mice. E, As in C but after data normalization by the average band intensity values measured in WT mice [pDARPP-32T34 WT mice (n = 10), EAAC1−/− mice (n = 10), p = 0.46; pDARPP-32T75 WT mice (n = 13), EAAC1−/− mice (n = 14), p = 0.72; pDARPP-32S97 WT mice (n = 13), EAAC1−/− mice (n = 13), p = 0.89; pDARPP-32S130 WT mice (n = 14), EAAC1−/− mice (n = 15), **p = 2.1e-3]. Data in A, B, and E represent the band intensity ratio between the target protein and β-actin in samples from WT versus EAAC1−/− mice in the same blotting membrane.
Figure 10.
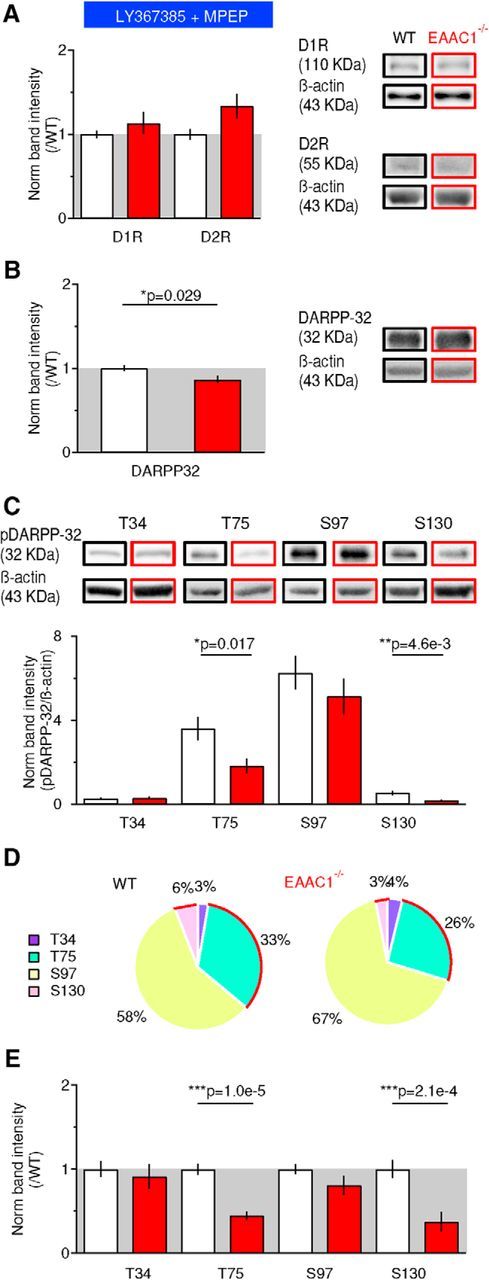
Blocking mGluRI activation rescues D1R expression and alters the phosphorylation pattern of DARPP-32. A, Western blots for D1R, D2R, and β-actin in the presence of the mGluRI blockers LY367385 (50 μm) and MPEP (10 μm) show no significant difference in the expression of D1R and D2R [D1R: WT mice (n = 9), EAAC1−/− mice (n = 9), p = 0.35; D2R: WT mice (n = 7), EAAC1−/− mice (n = 7), p = 0.064]. B, mGluRI blockade induces a slight reduction in DARPP-32 expression between WT mice (n = 9) and EAAC1−/− mice (n = 9) (*p = 0.029). C, Western blot analysis for pDARPP-32T34 [WT mice (n = 5), EAAC1−/− mice (n = 6), p = 0.98], pDARPP-32T75 [WT mice (n = 6), EAAC1−/− mice (n = 7), *p = 0.017], pDARPP-32S97 [WT mice (n = 9), EAAC1−/− mice (n = 9), p = 0.34], and pDARPP-32S130 [WT mice (n = 12), EAAC1−/− mice (n = 9), **p = 4.6e-3]. D, Pie chart representation of the phosphorylation distribution on the T34, T75, S97, and S130 sites of DARPP-32 in the presence of mGluRI blockers. The red curves highlight the T75 and S130 site, which show reduced phosphorylation in EAAC1−/− mice. E, As in C but after data normalization by the average band intensity values measured in WT mice [WT mice (n = 5), EAAC1−/− mice (n = 6), p = 0.62], pDARPP-32T75 [WT mice (n = 9), EAAC1−/− mice (n = 7), ***p = 1.0e-5], pDARPP-32S97 [WT mice (n = 9), EAAC1−/− mice (n = 9), p = 0.16], and pDARPP-32S130 [WT mice (n = 12), EAAC1−/− mice (n = 9), ***p = 2.1e-4]. Data in A, B, and E represent the band intensity ratio between the target protein and β-actin measured in samples from EAAC1−/− mice and normalized by analogous measures in samples from WT mice blotted in the same membrane.
Figure 11.
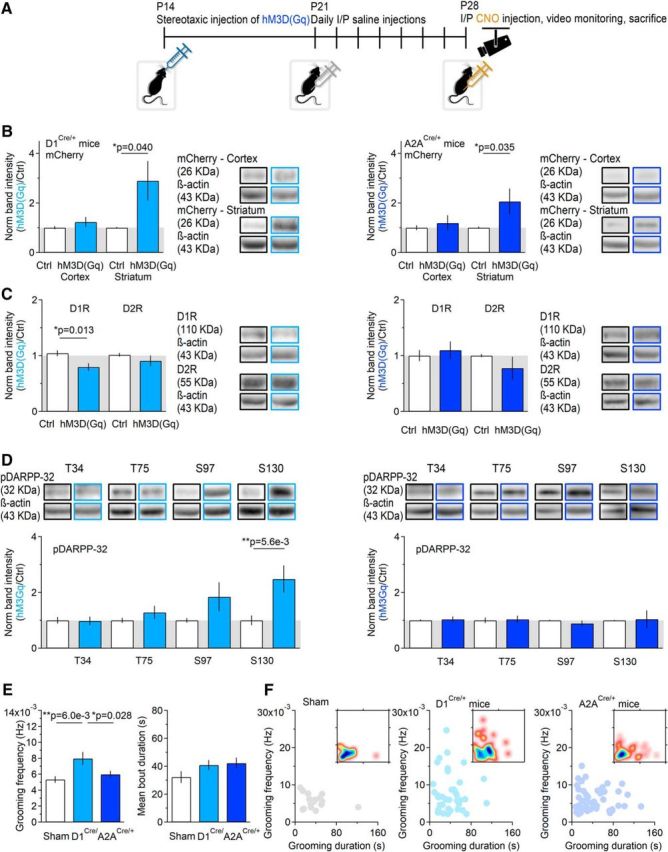
Cell-specific activation of Gq signaling pathway induces decreased D1R expression and increased pDARPP-32S130 phosphorylation. A, Timeline of the experimental design. At P14–P16, mice received a unilateral stereotaxic injection of hM3D(Gq). After 1 week, they started receiving daily intraperitoneal saline injections. At P28–P30, they received intraperitoneal injections of CNO (5 mg/kg). One hour after the CNO injections, they were video-monitored to examine their grooming behavior. Two hours after the CNO injections, they were killed. Proteins for Western blot analysis were extracted from the control and injected striatum and from the adjacent cortices. B, Left, mCherry expression in D1Cre/+ mice. A significant increase in mCherry expression was detected only in the striatum of D1Cre/+ mice (n = 10, *p = 0.040). Right, mCherry expression in A2ACre/+ mice. A significant increase in mCherry expression was detected only in the striatum of A2ACre/+ mice (n = 23, *p = 0.035). C, Left, D1R and D2R expression in D1Cre/+ mice (D1R: n = 9, *p = 0.013; D2R: n = 8, p = 0.35). The expression of D1R is significantly reduced in the injected striatum. Right, D1R and D2R expression in A2ACre/+ mice (D1R: n = 9, p = 0.63; D2R: n = 5, p = 0.34). The expression of D1R and D2R is similar in the injected and noninjected striatum. D, Left, hM3D(Gq) injection in D1Cre/+ mice leads to increased pDARPP-32S130 [pDARPP-32T34 (n = 10), p = 0.92]; pDARPP-32T75 (n = 11), p = 0.18; pDARPP-32S97 (n = 11), p = 0.13, pDARPP-32S130 (n = 11), **p = 5.6e-3). Right, hM3D(Gq) injection in A2ACre/+ mice leads to no change in pDARPP-32 [pDARPP-32T34 (n = 9), p = 0.75; pDARPP-32T75 (n = 8), p = 0.84; pDARPP-32S97 (n = 8), p = 0.31; pDARPP-32S130 (n = 6), p = 0.89]. E, Summary of the frequency [frequency: sham (n = 25), D1Cre/+ (n = 39), sham vs D1Cre/+ **p = 6.0e-3, A2ACre/+ (n = 49), sham vs A2ACre/+ p = 0.28] and duration of grooming episodes in sham and D1Cre/+ mice injected with hM3D(Gq) [duration: sham (n = 34), D1Cre/+ (n = 44), sham vs D1Cre/+ p = 0.12, A2ACre/+ (n = 58), sham vs A2ACre/+ p = 0.08]. F, Relationship between the frequency and duration of grooming episodes in sham (left), D1Cre/+ (middle), and A2ACre/+ mice (right). The inset represents a density plot of the data, with blue areas corresponding to the duration and frequency of the most commonly observed grooming episodes.
Figure 4.
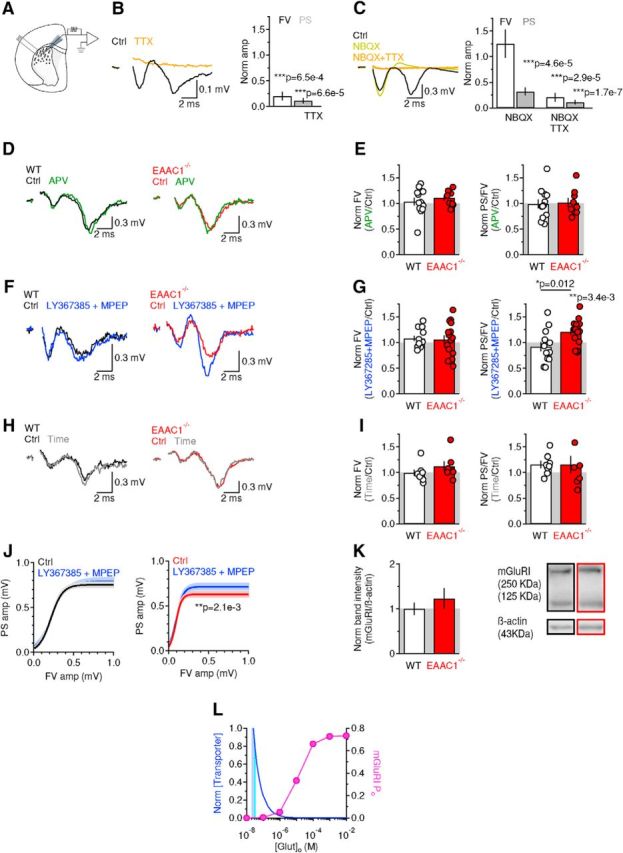
Excitatory field recordings in the DLS of EAAC1−/− mice show increased sensitivity to mGluRI blockers. A, Schematic illustration of the experimental design. The bipolar stimulating electrode and the extracellular field recording electrode were positioned in the DLS. B, Left, Extracellular recordings of FV and PS in the DLS of WT mice in control conditions (black trace) and in the presence of the voltage-gated sodium channel blocker TTX (1 μm, orange trace). Right, Summary graph showing the effect of TTX on the FV amp [white bar (n = 5), ***p = 6.5e-4] and PS amplitude [gray bar (n = 5), ***p = 6.6e-5]. C, Left, Extracellular recordings in the DLS of WT mice in control conditions (black trace), in the presence of the GluA antagonist NBQX (10 μm, yellow trace), and in the additional presence of TTX (1 μm, orange trace). Right, Summary graph showing that NBQX reduces the PS amplitude [gray bars (n = 8), ***p = 4.6e-5] without affecting the FV amplitude (white bars, p = 0.39). The FV and PS are blocked in the presence of both NBQX and TTX (***p = 2.9e-5 and ***p = 1.7e-7, respectively). D, Left, Extracellular recordings in the DLS of WT mice, in control conditions (black trace), and in the presence of the GluN antagonist APV (50 μm, green trace). Right, Extracellular recordings in the DLS of EAAC1−/− mice, in control conditions (red trace), and in the presence of APV (50 μm, green trace). Each trace represents the average of 20 consecutive sweeps. E, Left, Summary graph showing the effect of APV on the FV in WT mice (n = 12) and EAAC1−/− mice (n = 9) (WT vs EAAC1−/− p = 0.41). Right, Effect of APV on the PS/FV ratio recorded in WT mice (n = 12) and EAAC1−/− mice (n = 9) (WT vs EAAC1−/− p = 0.37). F, As in D but for recordings obtained in control conditions and in the presence of the mGluRI blockers LY367385 (50 μm) and MPEP (10 μm; blue traces). G, Left, Summary graph showing the effect of LY367385 and MPEP on the FV in WT mice (n = 13) and EAAC1−/− mice (n = 16) (WT vs EAAC1−/− p = 0.85). Right, Effect of LY367385 and MPEP on the PS/FV ratio recorded in WT mice (n = 13) and EAAC1−/− mice (n = 16) (WT vs EAAC1−/− *p = 0.012). H, As in D but for recordings obtained in time-dependent control experiments. I, Left, Summary graph showing the effect on the FV in WT mice (n = 8) and EAAC1−/− mice (n = 7) (WT vs EAAC1−/− p = 0.28). Right, Effect on the PS/FV ratio recorded in WT mice (n = 8) and EAAC1−/− mice (n = 7) (WT vs EAAC1−/− p = 1.00). J, Input/output relationship between the PS and FV amplitudes evoked by stimulating excitatory afferents to the DLS. Left, mGluRI block does not alter the input/output curves in WT mice (n = 13, p = 0.57). Right, mGluRI block increases the PS amp over a range of stimulus intensities and FV amplitudes in EAAC1−/− mice (n = 16, **p = 2.1e-3). K, Western blot analysis showing similar levels of mGluRI expression in WT mice (n = 6) and EAAC1−/− mice (n = 8) (p = 0.41). L, We used a kinetic model of mGluRI (Marcaggi et al., 2009) to determine the open probability of these receptors at a range of extracellular glutamate concentrations (pink). The striatum maintains the extracellular glutamate concentration at ∼25 nm (Chiu and Jahr, 2017) in the presence of ∼140 μm glutamate transporters (Lehre and Danbolt, 1998). Reducing the concentration of glutamate transporters leads to increased extracellular glutamate concentrations (blue). EAAC1 accounts for <5–10% of all glutamate transporters. According to our model (see Materials and Methods), loss of EAAC1 can cause a <10 nm increase in the ambient glutamate concentration (cyan). This change in the extracellular glutamate concentration can only cause a marginal increase in the mGluRI open probability.
Acute slice preparation, electrophysiology experiments, and data analysis
Acute coronal slices of the mouse striatum were obtained from WT and EAAC1−/− mice of either sex (P16–P24) that were deeply anesthetized with isoflurane and decapitated in accordance with SUNY–Albany Animal Care and Use Committee guidelines. The brain was rapidly removed and placed in ice-cold slicing solution bubbled with 95% O2/5% CO2 containing the following (in mm): 119 NaCl, 2.5 KCl, 0.5 CaCl2, 1.3 MgSO4·H2O, 4 MgCl2, 26.2 NaHCO3, 1 NaH2PO4, and 22 glucose, 320 mOsm, pH 7.4. The slices (250 μm thick) were prepared using a vibrating blade microtome (VT1200S; Leica Microsystems). Once prepared, the slices were stored in this solution in a submersion chamber at 36°C for 30 min and at RT for at least 30 min and up to 5 h. Unless otherwise stated, the recording solution contained the following (in mm): 119 NaCl, 2.5 KCl, 1.2 CaCl2, 1 MgCl2, 26.2 NaHCO3, and 1 NaH2PO4, 22 glucose, 300 mOsm, pH 7.4. This solution was also used to fill the glass capillaries used for extracellular field recordings. We identified the DLS under bright-field illumination using an upright fixed-stage microscope (BX51 WI; Olympus). Stimulating and recording electrodes were both placed in the DLS ∼100 μm away from each other. Postsynaptic responses were evoked by delivering constant voltage electrical pulses (50 μs) through a stimulating bipolar stainless steel electrode [catalog #MX21AES(JD3); Frederick Haer]. The resistance of the recording electrode was ∼1.5 MΩ and was monitored throughout the experiments. Data were discarded if the resistance changed >20% during the course of the experiment. Picrotoxin (100 μm) was added to the recording solution to block GABAA receptors. All recordings were obtained using a Multiclamp 700B amplifier and filtered at 10 kHz (Molecular Devices), converted with an 18-bit 200 kHz A/D board (HEKA), digitized at 10 kHz, and analyzed offline with custom-made software (A.S.) written in IgorPro 6.36 (Wavemetrics). Tetrodotoxin (TTX) was purchased from Alomone Labs (catalog #T-550). NBQX, APV, (S)-(+)-α-Amino-4-carboxy-2-methylbenzeneaceticacid (LY367385), and 2-Methyl-6-(phenylethynyl)pyridine hydrochloride (MPEP) were purchased from Tocris Bioscience (catalog #1044, 0105/10, 1237/10, and 1212/10) and Hello Bio (catalog #HB0443, HB0251, HB0398, HB0426). All other chemicals were purchased from Millipore Sigma. All recordings were performed at RT.
Stereotaxic intracranial injections
Male and female D1Cre/+ and WT mice (P14–P16) were anesthetized with isoflurane (induction: 5% in 100% O2 at 1–2 l/min; maintenance: 3% in 100% O2 at 1–2 l/min) and placed in the stereotaxic frame of a motorized drill and injection robot (Neurostar). After making a skin incision and thinning the skull under aseptic conditions, we injected 100 nl of the AAV construct AAV-hSyn-DIO-hM3D(Gq)-mCherry (University of North Carolina, Chapel Hill, NC) unilaterally in either the left or right DLS using a Hamilton syringe at a rate of 100 nl/min. The noninjected striatum was used as an internal control. The injection coordinates from lambda were AP: −2.5 mm, ML: ±2.0 mm, DV: +5.0 mm. After the stereotaxic injections, the mice were returned to their home cage for 7 d and then received daily intraperitoneal injections of NaCl 0.9% (10 μl/g, v/w) for 7 d. Two weeks after the stereotaxic surgery, mice received a single intraperitoneal injection of CNO (5 mg/kg in NaCl 0.9%; catalog #BML-NS105-0005; Enzo Life Sciences). One hour after the CNO injection, we acquired videos to monitor the grooming behavior of the mice. Two hours after the CNO injections, we euthanized the mice to isolate the left and right striatum and cortex to be used for Western blot analysis.
Computer modeling
Kinetic model of mGluRI.
We used ChanneLab (Synaptosoft) to estimate the mGluRI open probability using a kinetic scheme of mGluRI activation (Marcaggi et al., 2009). An analytic approach was used to determine the relationship between glutamate transporter concentration and ambient glutamate concentration (see Fig. 4L). Briefly, under steady-state conditions, the relationship between glutamate transporter and extracellular glutamate concentration can be described by a modified version of the Michaelis–Menten equation (Sun et al., 2014), as follows:
 |
In this equation, KM = 27 μm (Sun et al., 2014). The proportionality constant A can be calculated by setting [glutamate] = 25 nm (the experimentally measured ambient glutamate concentration in the striatum; Chiu and Jahr, 2017) and [transporter] = 140 μm (the estimated concentration of glutamate transporters in the brain; Lehre and Danbolt, 1998). The data shown in Figure 4L (blue) were normalized to obtain the normalized transporter concentration (y-axis) at different steady-state ambient glutamate concentrations (x-axis). The analysis of this relationship was performed using custom software written in IgorPro (Wavemetrics; A.S.).
3D Monte Carlo model of pDARPP-32 phosphorylation.
We used Blender (2.75) to create a simplified 3D mesh geometry, which we used as an in silico representation of an excitatory postsynaptic terminal (i.e., spine head). This 3D geometry was shaped as a 1 μm3 volume sphere of radius r = 0.62 μm with reflective properties for any diffusing molecule (i.e., a diffusing molecule contacting the sphere bounces back without disappearing from the simulation environment). This geometry was exported into Model Description Language and was used in the MCell (3.4) 3D Monte Carlo simulation environment. At the beginning of each simulation, we released DARPP-32 and other protein kinases and phosphatases in the sphere, at the concentrations specified in Table 6. We let the system equilibrate for 150 s to allow all molecules to diffuse evenly and equilibrate throughout the entire simulation environment (i.e., the sphere). After this equilibration time, we released Ca2+ (1 μm–1 mm) from the center of the sphere using single pulses or trains of 10 pulses (0.1–10 Hz) as described in Figure 8. The diffusion coefficient of Ca2+ was set to D* = 2.2e-6 cm2/s (Allbritton et al., 1992). The diffusion coefficient of all other molecules was set to D* = 5e-8 cm2/s (Li et al., 2015). The initial conditions (Table 6) and reactions (Table 7) were modeled according to the kinetic schemes reported by Fernandez et al. (2006) to which we added new reactions for pDARPP-32S97. Briefly, DARPP-32 is phosphorylated in position T34 by the cAMP-dependent protein kinase A (PKA; pDARPP-32T34), in position T75 by the cyclin-dependent kinase 5 (CdK5; pDARPP-32T75), in position S97 by casein kinase 2 (CK2; pDARPP-32S97), and in position S130 by casein kinase 1 (CK1; pDARPP-32S130). The phosphorylation of each position was independent of the phosphorylation state of other positions, as specified by the available kinetic parameters. Each simulation was run 100 times. Each run lasted 500 s and consisted of 5000 iterations with a time step Δt = 0.1 s. The concentration of each molecule in the sphere was monitored at every Δt. We used custom-made scripts written in Python 3.5 (A.S.) to execute each run and averaged the results obtained over multiple runs, which are shown in Figure 8. In this figure, pDARPP-32S130 represents the sum of all pDARPP-32 states that have one phosphate group attached to position S130 regardless of the phosphorylation state of other sites.
Table 6.
Initial conditions used in the 3D Monte Carlo model
| Molecule name | No. of molecules | Concentration (μm) |
|---|---|---|
| DARPP-32 | 3,000 | 4.98 |
| CdK5 | 120 | 0.2 |
| CK1 | 100 | 0.166 |
| CK2 | 100 | 0.166 |
| PDE | 1,204 | 2 |
| PP2A | 120 | 0.2 |
| PP2B (inactive) | 200 | 0.332 |
| PP2C | 80 | 0.133 |
| R2C2 | 4,000 | 6.64 |
| Ca2+ | 60 | 0.1 |
Figure 8.
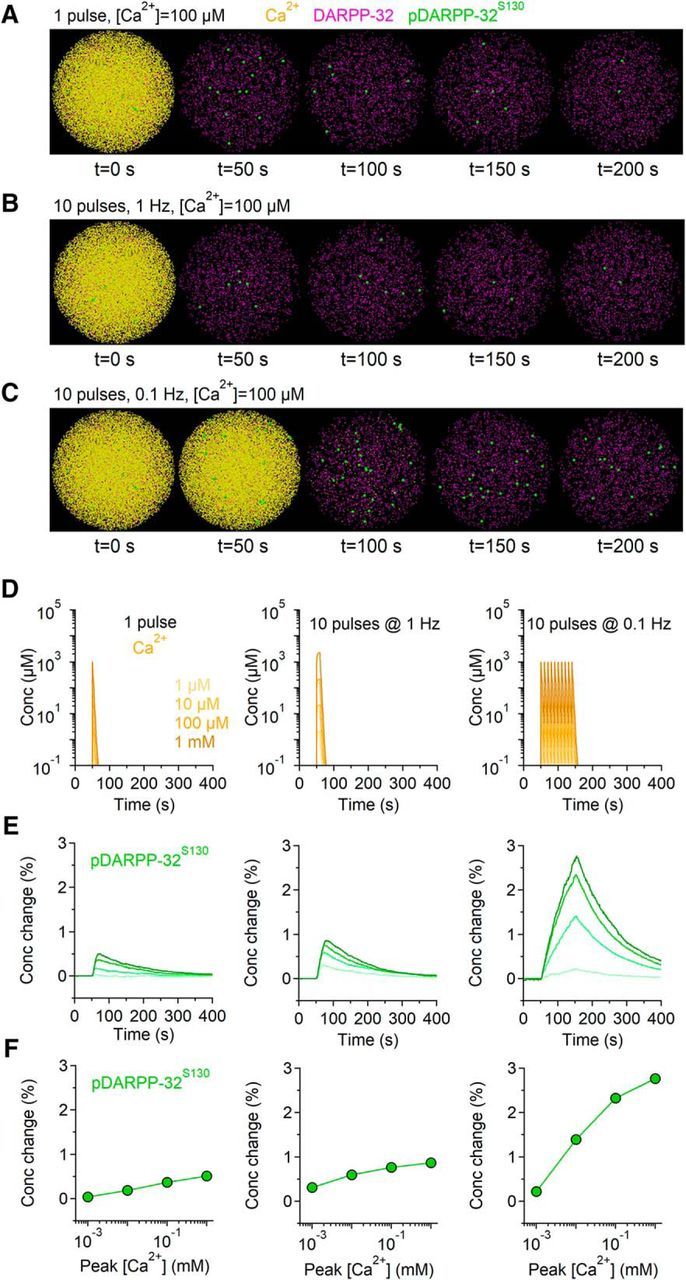
Modeling the effect of Gq signaling cascade activation on DARPP-32 phosphorylation. A–C, Snapshots showing the effect of different patterns of intracellular calcium rise (yellow) on the total concentration of DARPP-32 (magenta) and of pDARPP-32S130 (green). D, Time course of intracellular calcium concentration evoked by single (left) or 10 pulse trains of intracellular calcium rise at 1 Hz (middle) and 0.1 Hz (right). Darker colors correspond to higher intracellular calcium concentrations. E, Relative change in intracellular pDARPP-32S130. Darker colors correspond to the changes evoked by higher intracellular calcium concentration. F, Summary graph of the change in the peak pDARPP-32S130 concentration evoked by increasing concentrations (x-axis) and different patterns of intracellular calcium rise (left to right). Transient increase in the intracellular calcium concentration cause a substantial increase in the intracellular pDARPP-32S130 concentration.
Table 7.
Reaction parameters used in the models
| Reaction | kon (M−1 s−1) | k-off (s−1) | α (s−1) |
|---|---|---|---|
| DARPP-32 + CdK5 → DARPP-32 - CdK5 | 5.6e + 06 | 12 | |
| DARPP-32 - CdK5 → DARPP-32T75 + CdK5 | 3 | ||
| DARPP-32 + CK1 → DARPP-32 - CK1 | 4.4e + 06 | 12 | |
| DARPP-32 - CK1 → DARPP-32S130 + CK1 | 3 | ||
| DARPP-32 + PKA → DARPP-32 - PKA | 5.6e + 06 | 10.8 | |
| DARPP-32 - PKA → DARPP-32T34 + PKA | 2.7 | ||
| DARPP-32T34 + CdK5 → DARPP-32T34 - CdK5 | 5.6e + 06 | 12 | |
| DARPP-32T34 - CdK5 → DARPP-32T34,T75 + CdK5 | 3 | ||
| DARPP-32T34 + CK1 → DARPP-32T34 - CK1 | 4.4e + 06 | 12 | |
| DARPP-32T34 - CK1 → DARPP-32T34,S130 + CK1 | 3 | ||
| DARPP-32T34 + PP2B → DARPP-32T34 - PP2B | 1e + 08 | 16 | |
| DARPP-32T34 - PP2B → DARPP-32 + PP2B | 4 | ||
| DARPP-32T75 + CK1 → DARPP-32T75 - CK1 | 4.4e + 06 | 12 | |
| DARPP-32T75 - CK1 → DARPP-32T75,S130 + CK1 | 3 | ||
| DARPP-32T75 + PKA → DARPP-32T75 - PKA | 5.6e + 06 | 10.8 | |
| DARPP-32T75 - PKA → DARPP-32T34,T75 + PKA | 0 | ||
| DARPP-32T75 + PP2A → DARPP-32T75 - PP2A | 3.8e + 06 | 24 | |
| DARPP-32T75 - PP2A → DARPP-32 + PP2A | 10 | ||
| DARPP-32T75 + PP2AP → DARPP-32T75 - PP2AP | 1.7e + 07 | 24 | |
| DARPP-32T75 - PP2AP → DARPP-32T75 + PP2AP | 40 | ||
| DARPP-32S130 + CdK5 → DARPP-32S130 - CdK5 | 5.6e + 06 | 12 | |
| DARPP-32S130 - CdK5 → DARPP-32T75,S130 + CdK5 | 3 | ||
| DARPP-32S130 + PKA → DARPP-32S130 - PKA | 5.6e + 06 | 10.8 | |
| DARPP-32S130 - PKA → DARPP-32T34,S130 + PKA | 2.7 | ||
| DARPP-32S130 + PP2C → DARPP-32S130 - PP2C | 7.5e + 06 | 12 | |
| DARPP-32S130 - PP2C → DARPP-32 + PP2C | 3 | ||
| DARPP-32T34,T75 + CK1 → DARPP-32T34,T75 - CK1 | 4.4e + 06 | 12 | |
| DARPP-32T34,T75 - CK1 → DARPP-32T34,T75,S130 + CK1 | 3 | ||
| DARPP-32T34,T75 + PP2A → DARPP-32T34,T75 - PP2A | 3.8e + 06 | 24 | |
| DARPP-32T34,T75 - PP2A → DARPP-32T34 + PP2A | 10 | ||
| DARPP-32T34,T75 + PP2AP → DARPP-32T34,T75 - PP2AP | 1.7e + 07 | 40 | |
| DARPP-32T34,T75 - PP2AP → DARPP-32T34 + PP2AP | 24 | ||
| DARPP-32T34,T75 + PP2B → DARPP-32T34,T75 - PP2B | 1e + 08 | 1,600 | |
| DARPP-32T34,T75 - PP2B → DARPP-32T75 + PP2B | 4 | ||
| DARPP-32T34,S130 + CdK5 → DARPP-32T34,S130 - CdK5 | 5.6e + 06 | 12 | |
| DARPP-32T34,S130 - CdK5 → DARPP-32T34,T75,S130 + CdK5 | 3 | ||
| DARPP-32T34,S130 + PP2B → DARPP-32T34,S130 - PP2B | 7.5e + 04 | 0.12 | |
| DARPP-32T34,S130 - PP2B → DARPP-32S130 + PP2B | 0.03 | ||
| DARPP-32T34,S130 + PP2C → DARPP-32T34,S130 - PP2C | 7.5e + 06 | 12 | |
| DARPP-32T34,S130 - PP2C → DARPP-32T34 + PP2C | 3 | ||
| DARPP-32T75,S130 + PKA → DARPP-32T75,S130 - PKA | 5.6e + 06 | 10.8 | |
| DARPP-32T75,S130 - PKA → DARPP-32T34,T75,S130 + PKA | 0 | ||
| DARPP-32T75,S130 + PP2A → DARPP-32T75,S130 - PP2A | 3.8e + 06 | 24 | |
| DARPP-32T75,S130 - PP2A → DARPP-32S130 + PP2A | 10 | ||
| DARPP-32T75,S130 + PP2AP → DARPP-32T75,S130 - PP2AP | 1.7e + 07 | 40 | |
| DARPP-32T75,S130 - PP2AP → DARPP-32S130 + PP2AP | 24 | ||
| DARPP-32T75,S130 + PP2C → DARPP-32T75,S130 - PP2C | 7.5e + 06 | 12 | |
| DARPP-32T75,S130 - PP2C → DARPP-32T75 + PP2C | 3 | ||
| DARPP-32T34,T75,S130 + PP2A → DARPP-32T34,T75,S130 - PP2A | 3.8e + 06 | 24 | |
| DARPP-32T34,T75,S130 - PP2A → DARPP-32T34,S130 + PP2A | 10 | ||
| DARPP-32T34,T75,S130 + PP2AP → DARPP-32T34,T75,S130 - PP2AP | 1.7e + 07 | 40 | |
| DARPP-32T34,T75,S130 - PP2AP → DARPP-32T34,S130 + PP2AP | 24 | ||
| DARPP-32T34,T75,S130 + PP2B → DARPP-32T34,T75,S130 - PP2B | 7.5e + 04 | 120 | |
| DARPP-32T34,T75,S130 - PP2B → DARPP-32T75,S130 + PP2B | 0.03 | ||
| DARPP-32T34,T75 + PP2C → DARPP-32T34,T75,S130 - PP2C | 7.5e + 06 | 3 | |
| DARPP-32T34,T75,S130 - PP2C → DARPP-32T34,T75,S130 + PP2C | 12 | ||
| CK1P + PP2B → CK1P - PP2B | 3e + 08 | 24 | |
| CK1P - PP2B → CK1 + PP2B | 6 | ||
| CK1 → CK1P | 1 | ||
| PDE + PKA → PDE - PKA | 6e + 06 | 36 | |
| PDE - PKA → PDEP + PKA | 9 | ||
| PDEP → PDE | 0.1 | ||
| PP2A + PKA → PP2A - PKA | 1e + 08 | 16 | |
| PP2A - PKA → PP2AP + PKA | 4 | ||
| PP2AP → PP2A | 5 | ||
| PP2B (inactive) + Ca2+ → PP2B (inactive) - Ca2+ | 1e + 15 | 1 | |
| PP2B (inactive) - Ca2+ + Ca2+ → PP2B | 3e + 15 | 1 | |
| R2C2 + cAMP → cAMP - R2C2 | 5.4e + 07 | 33 | |
| cAMP - R2C2 + cAMP → cAMP2 - R2C2 | 5.4e + 07 | 33 | |
| cAMP2 - R2C2 + cAMP → cAMP3 - R2C2 | 7.5e + 07 | 110 | |
| cAMP3 - R2C2 + cAMP → cAMP4 - R2C2 | 7.5e + 07 | 32.5 | |
| cAMP4-R2C + PKA → cAMP4 - R2C2 | 1.8e + 07 | 60 | |
| cAMP4-R2 + PKA → cAMP4 - R2C | 1.8e + 07 | 60 | |
| cAMP + PDE → cAMP - PDE | 2.52e + 06 | 40 | |
| cAMP-PDE → AMP + PDE | 10 | ||
| cAMP + PDEP → cAMP -PDEP | 5.04e + 06 | 80 | |
| cAMP-PDEP → AMP + PDEP | 20 | ||
| Ca2+ → NULL | 0.6 | ||
| Ca2+ + CK2 → CK2-Ca2+ | 1e + 15 | 3e + 15 | |
| CK2-Ca2+ + DARPP-32 → DARPP-32 - CK2 - Ca2+ | 4.4e5 | 12 | |
| DARPP-32-CK2-Ca2+ → DARPP-32S97 + CK2 - Ca2+ | 3 | ||
| DARPP-32S97 + PP2A → DARPP-32S97 - PP2A | 3.8e + 06 | 24 | |
| DARPP-32S97 - PP2A → DARPP-32 + PP2A | 10 | ||
| DARPP-32T34,S97 + PP2A → DARPP-32T34,S97 - PP2A | 3.8e + 06 | 24 | |
| DARPP-32T34,S97 - PP2A → DARPP-32T34 + PP2A | 10 | ||
| DARPP-32T34,S97 - PP2A → DARPP-32S97 + PP2A | 10 | ||
| DARPP-32T75,S97 + PP2A → DARPP-32T75,S97 - PP2A | 3.8e + 06 | 24 | |
| DARPP-32T75,S97 - PP2A → DARPP-32T75 + PP2A | 10 | ||
| DARPP-32T75,S97 - PP2A → DARPP-32S97 + PP2A | 10 | ||
| DARPP-32S97,S130 + PP2A → DARPP-32S97,S130 - PP2A | 3.8e + 06 | 24 | |
| DARPP-32S97,S130 - PP2A → DARPP-32S130 + PP2A | 10 | ||
| DARPP-32S97,S130 - PP2A → DARPP-32S97 + PP2A | 10 | ||
| DARPP-32T34,T75,S97 + PP2A → DARPP-32T34,T75,S97 - PP2A | 3.8e + 06 | 24 | |
| DARPP-32T34,T75,S97 - PP2A → DARPP-32T75,S97 + PP2A | 10 | ||
| DARPP-32T34,T75,S97 - PP2A → DARPP-32T34,S97 + PP2A | 10 | ||
| DARPP-32T34,T75,S97 - PP2A → DARPP-32T34,T75 + PP2A | 10 | ||
| DARPP-32T75,S97,S130 + PP2A → DARPP-32T75,S97,S130 - PP2A | 3.8e + 06 | 24 | |
| DARPP-32T75,S97,S130 - PP2A → DARPP-32S97,S130 + PP2A | 10 | ||
| DARPP-32T75,S97,S130 - PP2A → DARPP-32T75,S130 + PP2A | 10 | ||
| DARPP-32T75,S97,S130 - PP2A → DARPP-32T75,S97 + PP2A | 10 | ||
| DARPP-32T34,S97,S130 + PP2A → DARPP-32T34,S97,S130 - PP2A | 3.8e + 06 | 24 | |
| DARPP-32T34,S97,S130 - PP2A → DARPP-32S97,S130 + PP2A | 10 | ||
| DARPP-32T34,S97,S130 - PP2A → DARPP-32T34,S130 + PP2A | 10 | ||
| DARPP-32T34,S97,S130 - PP2A → DARPP-32T34,S97 + PP2A | 10 | ||
| DARPP-32T34,T75,S130 + PP2A → DARPP-32T34,T75,S130 - PP2A | 3.8e + 06 | 24 | |
| DARPP-32T34,T75,S130 - PP2A → DARPP-32T75,S130 + PP2A | 10 | ||
| DARPP-32T34,T75,S130 - PP2A → DARPP-32T34,S130 + PP2A | 10 | ||
| DARPP-32T34,T75,S130 - PP2A → DARPP-32T34,T75 + PP2A | 10 | ||
| DARPP-32T34,T75,S97,S130 + PP2A → DARPP-32T34,T75,S97,S130 - PP2A | 3.8e + 06 | 24 | |
| DARPP-32T34,T75,S97,S130 - PP2A → DARPP-32T75,S97,S130 + PP2A | 10 | ||
| DARPP-32T34,T75,S97,S130 - PP2A → DARPP-32T34,S97,S130 + PP2A | 10 | ||
| DARPP-32T34,T75,S97,S130 - PP2A → DARPP-32T34,T75,S130 + PP2A | 10 | ||
| DARPP-32T34,T75,S97,S130 - PP2A → DARPP-32T34,T75 + PP2A | 10 | ||
| DARPP-32S97 + CdK5 → DARPP-32S97 - CdK5 | 5.6e + 06 | 12 | |
| DARPP-32S97 - CdK5 → DARPP-32T75,S97 + CdK5 | 3 | ||
| DARPP-32T34,S97 + CdK5 → DARPP-32T34,S97 - CdK5 | 5.6e + 06 | 12 | |
| DARPP-32T34,S97 - CdK5 → DARPP-32T34,T75,S97 + CdK5 | 3 | ||
| DARPP-32S97,S130 + CdK5 → DARPP-32S97,S130 - CdK5 | 5.6e + 06 | 12 | |
| DARPP-32S97,S130 - CdK5 → DARPP-32T75,S97,S130 + CdK5 | 3 | ||
| DARPP-32T34,S97,S130 + CdK5 → DARPP-32T34,S97,S130 - CdK5 | 5.6e + 06 | 12 | |
| DARPP-32T34,S97,S130 - CdK5 → DARPP-32T34,T75,S97,S130 + CdK5 | 3 | ||
| DARPP-32S97 + CK1 → DARPP-32S97 - CK1 | 4.4e + 06 | 12 | |
| DARPP-32S97 - CK1 → DARPP-32S97,S130 + CK1 | 3 | ||
| DARPP-32T34,S97 + CK1 → DARPP-32T34,S97 - CK1 | 4.4e + 06 | 12 | |
| DARPP-32T34,S97 - CK1 → DARPP-32T34,S97,S130 + CK1 | 3 | ||
| DARPP-32T75,S97 + CK1 → DARPP-32T75,S97 - CK1 | 4.4e + 06 | 12 | |
| DARPP-32T75,S97 - CK1 → DARPP-32T75,S97,S130 + CK1 | 3 | ||
| DARPP-32T34,T75,S97 + CK1 → DARPP-32T34,T75,S97 - CK1 | 4.4e + 06 | 12 | |
| DARPP-32T34,T75,S97 - CK1 → DARPP-32T34,T75,S97,S130 + CK1 | 3 | ||
| DARPP-32T34,S97 + PP2B → DARPP-32T34,S97 - PP2B | 7.5e + 04 | 120 | |
| DARPP-32T34,S97 - PP2B → DARPP-32S97 + PP2B | 0.03 | ||
| DARPP-32T34,T75,S97 + PP2B → DARPP-32T34,T75,S97 - PP2B | 7.5e + 04 | 120 | |
| DARPP-32T34,T75,S97 - PP2B → DARPP-32T75,S97 + PP2B | 0.03 | ||
| DARPP-32T34,S97,S130 + PP2B → DARPP-32T34,S97,S130 - PP2B | 7.5e + 04 | 120 | |
| DARPP-32T34,S97,S130 - PP2B → DARPP-32S97,S130 + PP2B | 0.03 | ||
| DARPP-32T34,T75,S130 + PP2B → DARPP-32T34,T75,S130 - PP2B | 7.5e + 04 | 120 | |
| DARPP-32T34,T75,S130 - PP2B → DARPP-32T75,S130 + PP2B | 0.03 | ||
| DARPP-32T34,T75,S97,S130 + PP2B → DARPP-32T34,T75,S97,S130 - PP2B | 7.5e + 04 | 120 | |
| DARPP-32T34,T75,S97,S130 - PP2B → DARPP-32T75,S97,S130 + PP2B | 0.03 | ||
| DARPP-32S97,S130 + PP2C → DARPP-32S97,S130 - PP2C | 7.5e + 06 | 12 | |
| DARPP-32S97,S130 - PP2C → DARPP-32S97 + PP2C | 3 | ||
| DARPP-32T34,S97,S130 + PP2C → DARPP-32T34,S97,S130 - PP2C | 7.5e + 06 | 12 | |
| DARPP-32T34,S97,S130 - PP2C → DARPP-32T34,S97 + PP2C | 3 | ||
| DARPP-32T75,S97,S130 + PP2C → DARPP-32T75,S97,S130 - PP2C | 7.5e + 06 | 12 | |
| DARPP-32T75,S97,S130 - PP2C → DARPP-32T75,S97 + PP2C | 3 | ||
| DARPP-32T34,T75,S97,S130 + PP2C → DARPP-32T34,T75,S97,S130 - PP2C | 7.5e + 06 | 12 | |
| DARPP-32T34,T75,S97,S130 - PP2C → DARPP-32T34,T75,S97 + PP2C | 3 |
Experimental design and statistical analysis
Data are presented as mean ± SEM unless otherwise stated. All experiments were performed on multiple mice of either sex. Statistical significance was determined by Student's paired or unpaired t test, as appropriate (IgorPro 6.36). Differences were considered significant at p < 0.05 (*p < 0.05; **p < 0.01; ***p < 0.001).
Results
Behavioral phenotype of EAAC1−/− mice
As a first step in our analysis, we performed a comprehensive behavioral assay of constitutive EAAC1 knock-out mice (EAAC1−/−). These mice, originally developed by (Peghini et al., 1997), were obtained by inserting a pgk neomycin resistance cassette in the Slc1a1 gene, which encodes the neuronal glutamate transporter EAAC1. We assessed their general phenotype and tested for the presence of traits that might be indicative of compulsive behaviors. In the SHIRPA screen, we assessed the presence of disturbances in gait, posture, muscle tone deficits, and abnormalities in motor control and coordination (Fig. 1). We performed this analysis on mice aged P14–P35 to cover a wide range of ages, starting when EAAC1 reaches its peak expression in the striatum at P14 (Furuta et al., 1997) and ending 2 weeks after glutamatergic corticostriatal synapses and dopamine receptors and terminals complete their maturation at P21 (Hattori and McGeer, 1973; Stamford, 1989; Teicher et al., 1995; Sharpe and Tepper, 1998). The results of the SHIRPA screen evidenced subtle motor deficits that had not been reported when the mice were first generated and characterized (Peghini et al., 1997). These subtle abnormalities were present throughout the entire P14–P35 age range and could be detected when pooling data from EAAC1−/− mice of either sex (Fig. 1) and when analyzing male and female mice separately (Fig. 1-1).
Figure 1.
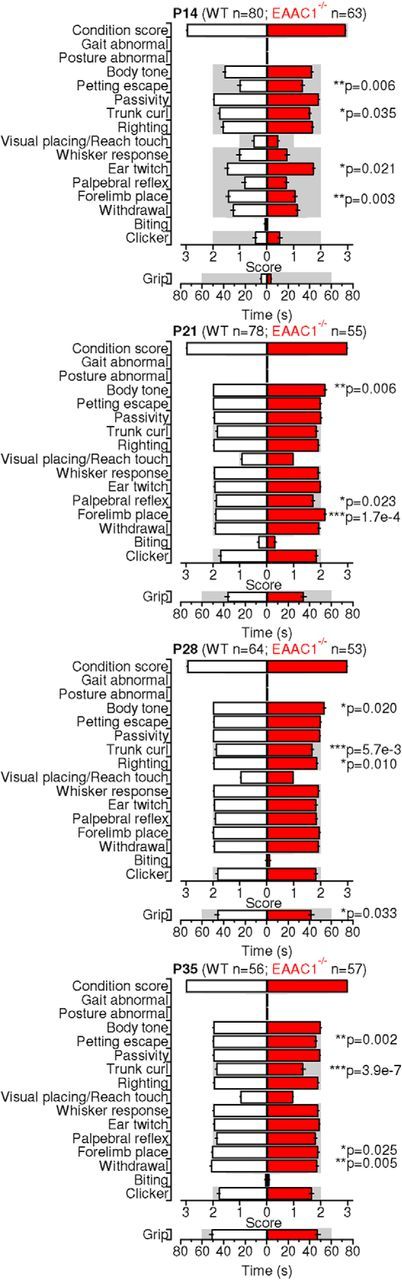
A battery of SHIRPA tests reveals subtle abnormalities in male and female EAAC1−/− mice. Parameter scores for a battery of SHIRPA primary screen test in male and female WT (white bars) and EAAC1−/− mice (red bars) aged P14–P35. See Figure 1-1 for separate analysis of male and female mice.
A battery of SHIRPA tests reveals subtle abnormalities in male and female EAAC1-/- mice. This dataset includes the parameter scores for a battery of SHIRPA primary screen test in female and male WT and EAAC1-/- mice aged P14-35. Download Figure 1-1, XLSX file (17.3KB, xlsx)
The overall level of motor activity, measured as distance traveled and time spent on a running wheel, was similar in WT and EAAC1−/− mice (p = 0.35 and p = 0.12, respectively; Fig. 2A). Consistent with these findings, the total distance traveled by WT and EAAC1−/− mice in an open-field test was also similar (p = 0.28; Fig. 2B, middle). What we noticed while performing this test, however, was that the EAAC1−/− mice were less immobile (**p = 4.6e-3) because they fidgeted when they resided in a given spot of the open-field arena (Fig. 2B, right). This restless behavior can be indicative of increased anxiety-like and motor behaviors in EAAC1−/− mice. This hypothesis was supported by data collected using the elevated plus maze test. EAAC1−/− mice showed an increased proportion of entries in the closed arms (**p = 0.006; Fig. 2C) and spent more time there than in the open arms (*p = 0.019; Fig. 2D). These results suggest that EAAC1−/− mice show increased anxiety-like behaviors. Consistent with these findings, EAAC1−/− mice buried more marbles than age-matched WT mice in the marble-burying test (***p = 3.9e-11; Fig. 2E), another test used to detect anxiety-like behaviors in mice (Angoa-Perez et al., 2013). The different behavior of WT and EAAC1−/− mice could be detected across the entire age range of mice that we tested (**p = 5.5e-3; Fig. 2F). Similar results to the ones described in Figure 2 were also observed when analyzing male and female mice separately (Fig. 2-1. Together, the results described so far, which were collected using different and complementary behavioral tests, indicate that EAAC1−/− mice have increased anxiety-like behaviors compared with WT mice. However, none of these tests points to the presence of specific abnormalities in behaviors controlled specifically by the striatum.
Figure 2.
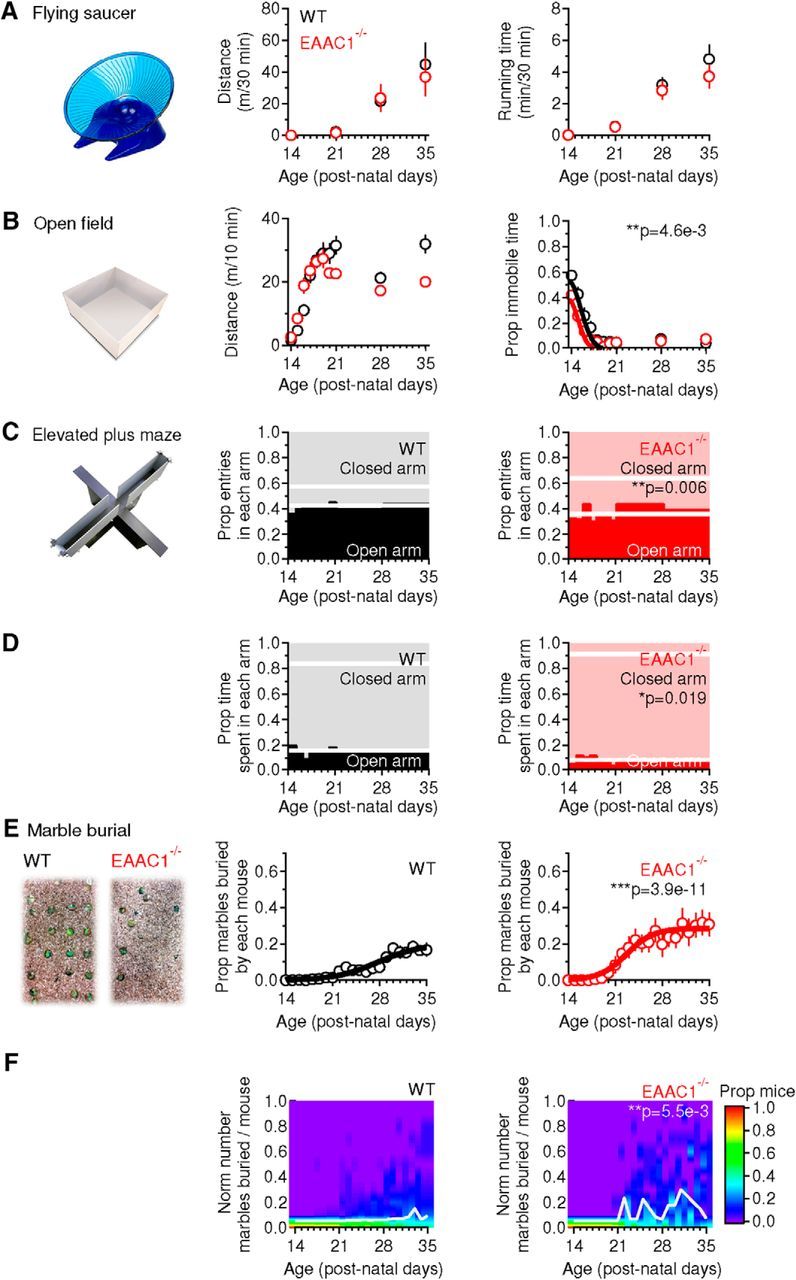
EAAC1−/− mice show similar levels of motor activity but increased anxiety-like behaviors compared with WT mice. A, Summary of spontaneous locomotor activity in a free-spinning flying saucer (left) in WT mice (n = 137) and EAAC1−/− mice (n = 150) aged P14–P35. No significant difference was detected in the mean distance (middle) and running time (right) between WT and EAAC1−/− mice (p = 0.35 and p = 0.12, respectively). B, In the open-field test (left), WT mice (n = 153) and EAAC1−/− mice (n = 149) traveled the same distance (p = 0.28; middle), but EAAC1−/− mice showed a significant decrease in the proportion of immobile time (**p = 4.6e-3; right). C, In the elevated plus maze (left), EAAC1−/− mice (n = 90) showed a larger proportion of entries in closed arms compared with WT mice (n = 118, **p = 0.006; left). The thick white lines represent the mean proportion of entries in each arm. D, EAAC1−/− mice spent a larger proportion of time in the closed arms than WT mice (*p = 0.019; right). E, In the marble-burying test (left), EAAC1−/− mice (n = 15; right) dug a significantly larger proportion of marbles than WT mice (n = 36, middle; ***p = 3.9e-11). F, Color coding representing the proportion of mice digging a given proportion of marbles (y-axis). The white line describes the behavior of 50% of the mouse population. There is an average increase in the proportion of EAAC1−/− mice digging a larger proportion of marbles (**p = 5.5e-3). See Figure 2-1 for separate analysis of female and male mice.
Female EAAC1-/- mice show increased anxiety-like behaviors. Summary of spontaneous locomotor activity in a free-spinning flying saucer, open field test, elevated plus maze and marble burying test in female and male WT and EAAC1-/- mice. Download Figure 1-1, XLSX file (17.3KB, xlsx)
The striatum exerts a unique role in the control of rule-governed sequential behaviors, including sequential patterned strokes performed during grooming, which are reminiscent of the ritual hand-washing behaviors of patients with OCD (Berridge and Whishaw, 1992; Kalueff et al., 2016). Interestingly, the striatum is also one of the brain regions that shows hyperactivity in patients with OCD and that has the highest expression levels of EAAC1 (Danbolt, 2001; Holmseth et al., 2012). When monitoring mice using a video camera positioned below the behavioral arena, we noticed that EAAC1−/− mice groomed more frequently than WT mice [WT: 6.7 ± 0.7e-3 Hz (n = 23), EAAC1−/−: 11.3 ± 0.8e-3 Hz (n = 42), ***p = 4.9e-5]. The duration of each grooming episode was similar to that of WT mice [WT: 55.2 ± 6.7 s (n = 42), EAAC1−/−: 45.4 ± 3.5 s (n = 72), p = 0.200; Fig. 3A–D]. These results could not be attributed to the use of behavioral arenas with transparent floors (see Materials and Methods) because similar results were obtained when the mice were monitored using a camera positioned above standard mouse cages [grooming frequency WT: 7.6 ± 0.5e-3 Hz (n = 39), p = 0.34; EAAC1−/−: 9.5 ± 0.6e-3 Hz (n = 89), p = 0.07; WT vs EAAC1−/− *p = 0.024; data not shown]. The increased grooming frequency in EAAC1−/− mice did not lead to consistent hair loss or skin lesions associated with other pathological conditions, including trichotillomania (Welch et al., 2007; Feusner et al., 2009). When grooming, the paws of EAAC1−/− mice performed shorter trajectories [WT: 153.3 ± 14.3 mm (n = 36), EAAC1−/−: 47.9 ± 6.0 mm (n = 43), ***p = 1.6e-6; Fig. 3E,F], suggesting that the execution of fine movements performed during grooming is disrupted in these mice.
Figure 3.
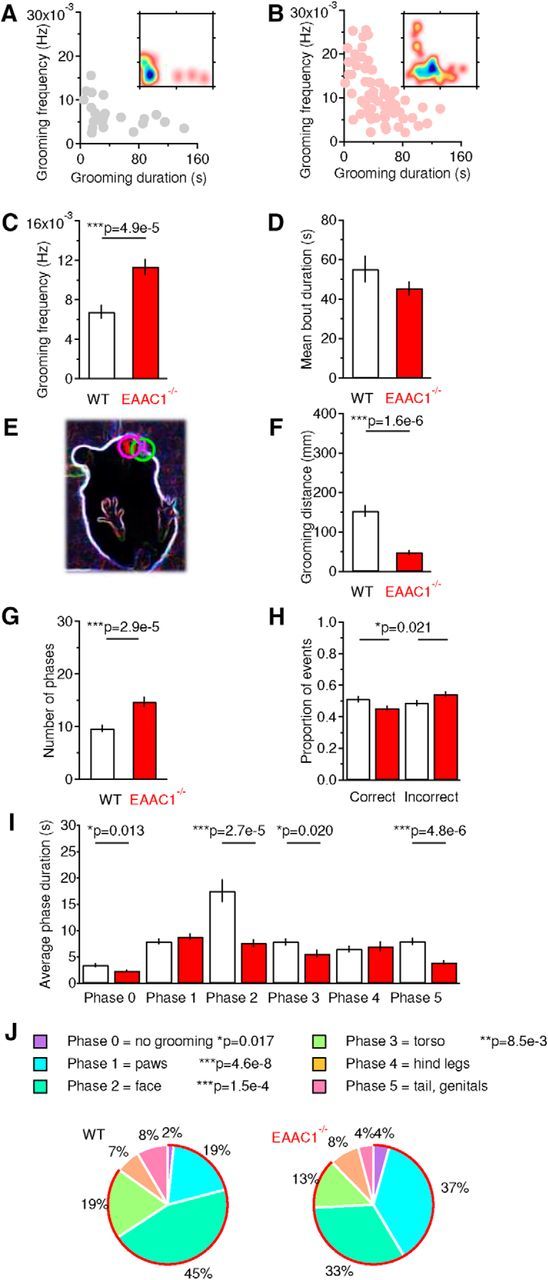
EAAC1−/− mice show disrupted grooming behaviors. A, Relationship between the frequency and duration of grooming episodes in WT mice. The inset represents a density plot of the data, with areas color coded in blue identifying the duration and frequency of the most commonly observed grooming episodes. B, As in A but for EAAC1−/− mice. C, Summary bar graph of the frequency of grooming episodes [WT mice (n = 23), EAAC1−/− mice (n = 68), ***p = 4.9e-5]. D, Summary bar graph of the mean duration of individual grooming episodes [WT mice (n = 42), EAAC1−/− mice (n = 72), p = 0.200]. E, Contour of the mouse body (white) and of the mouse paws (magenta and green circles) detected by M-Track software and used to perform the analysis of paw trajectories (Reeves et al., 2016). F, Summary bar graph of the mean trajectory length of mice paws as they move to execute a grooming episode [WT mice (n = 36), EAAC1−/− mice (n = 43), ***p = 1.6e-6]. G, Summary bar graph of the mean number of grooming phases represented in each grooming episode [WT mice (n = 87), EAAC1−/− mice (n = 86), ***p = 2.9e-5]. H, Proportion of correct (left) and incorrect phase transitions in each grooming episode [WT mice (n = 83), EAAC1−/− mice (n = 85), *p = 0.021]. I, Summary of the average duration of distinct phases represented in each grooming episode. A decreased representation of Phases 0, 2, 3, and 5 is detected in EAAC1−/− mice [Phase 0 WT mice (n = 22), EAAC1−/− mice (n = 34), *p = 0.013; Phase 1 WT mice (n = 71), EAAC1−/− mice (n = 79), p = 0.301; Phase 2 WT mice (n = 73), EAAC1−/− mice (n = 82), ***p = 2.7e-5; Phase 3 WT mice (n = 64), EAAC1−/− mice (n = 65), *p = 0.020; Phase 4 WT mice (n = 39), EAAC1−/− mice (n = 35), p = 0.650; Phase 5 WT mice (n = 30), EAAC1−/− mice (n = 29), ***p = 4.8e-6]. J, Pie charts representing the normalized distribution of different phases in each grooming episode. A proportional increase in the representation of Phases 0–3 is detected in EAAC1−/− mice. Significant p-values are included in the figure color legend.
Previous work in rats and mice indicates that each grooming episode consists of distinct phases characterized by the execution of specific types of patterned strokes (Kalueff et al., 2007). These different strokes can be classified in six different phases through which mice groom in an orderly sequence along the rostrocaudal axis of their body, from paws to tail (Kalueff et al., 2007). According to this classification, Phase 0 includes the time intervals during which mice do not groom and Phases 1–5 describe phases during which mice groom their front paws, face, toes, hind legs, and tail/genitals, respectively (Kalueff et al., 2007). The grooming episodes of EAAC1−/− mice contained a larger number of phases than in WT mice [WT: 9.6 ± 0.6 (n = 87), EAAC1−/−: 14.7 ± 1.0 (n = 86), ***p = 2.9e-5; Fig. 3G]. The order of progression from one phase to the next one was disrupted in EAAC1−/− mice due to the presence of an increased proportion of incorrect transitions [WT: 0.49 ± 0.02 (n = 83), EAAC1−/−: 0.54 ± 0.01 (n = 85), *p = 0.021; Fig. 3H]. EAAC1−/− mice spent less time in Phase 0 [WT: 3.4 ± 0.3 s (n = 22), EAAC1−/−: 2.3 ± 0.2 (n = 34), *p = 0.013), Phase 2 (WT: 17.5 ± 2.1 s (n = 73), EAAC1−/−: 7.6 ± 0.7 s (n = 82), ***p = 2.7e-5), Phase 3 (WT: 7.9 ± 0.6 s (n = 64), EAAC1−/−: 5.6 ± 0.7 s (n = 65), *p = 0.020), and Phase 5 (WT: 8.0 ± 0.7 (n = 30), EAAC1−/−: 3.9 ± 0.4 s (n = 29), ***p = 4.8e-6; Fig. 3I]. WT mice spent most of their grooming time rubbing their torso, whereas EAAC1−/− mice mostly licked their paws (Fig. 3J). The increased grooming frequency and the disrupted syntactic structure of grooming episodes point to potential functional abnormalities in the striatum of EAAC1−/− mice and suggest that EAAC1 might contribute to altered execution of stereotyped motor behaviors largely controlled by the striatum.
EAAC1 shapes synaptic transmission and plasticity in the striatum
We tested directly the hypothesis that EAAC1 controls striatal function ex vivo by obtaining extracellular field recordings in acute brain slices containing the DLS, a domain of the striatum specifically implicated with habit learning (Barnes et al., 2005; Yin et al., 2005; Yin et al., 2006). We stimulated excitatory synaptic afferents by positioning a bipolar stimulating electrode in the DLS 100–200 μm away from the recording electrode (Fig. 4A) and added the GABAA receptor blocker picrotoxin (100 μm) to the extracellular solution to isolate excitatory from inhibitory responses. The extracellular recordings consist of a short-latency fiber volley (FV) followed by a longer lasting population spike (PS), as described by Misgeld et al. (1979). We first confirmed that: (1) blocking action potential propagation with the voltage-gated sodium channel blocker TTX (1 μm) abolished both the FV and PS (Fig. 4B); (2) the GluA antagonist NBQX (10 μm) blocked the PS but not the FV (Fig. 4C); and (3) TTX, applied in the presence of NBQX, blocked the FV (Fig. 4C).
In the hippocampus, EAAC1 limits extrasynaptic GluN activation (Scimemi et al., 2009). To test for a similar role of EAAC1 in the DLS, we monitored the effect of the competitive, high-affinity GluN antagonist APV (50 μm) on field recordings (Fig. 4D,E). APV did not induce a significant change in the FV [Norm FV amp WT: 1.03 ± 0.08 (n = 12), EAAC1−/−: 1.10 ± 0.05 (n = 9), p = 0.41; Fig. 4D,E] and PS/FV amplitude ratio [Norm PS/FV amp WT: 0.99 ± 0.09 (n = 12), EAAC1−/−: 1.02 ± 0.08 (n = 9), p = 0.82; Fig. 4D,E], consistent with the limited involvement of GluN receptors in mediating synaptic transmission at excitatory synapses in the striatum (Sung et al., 2001). We performed additional control experiments to determine whether this result could be due to compensatory upregulation of glial glutamate transporters in the absence of EAAC1, which could also limit GluN activation. However, we did not find any significant difference in the protein expression level of glial glutamate transporters GLAST [Norm GLAST EAAC1−/−/WT: 1.02 ± 0.09 (n = 10), p = 0.81] and GLT-1 [Norm GLT-1 EAAC1−/−/WT: 1.07 ± 0.23 (n = 8), p = 0.77] in protein extracts from the striatum of WT and EAAC1−/− mice (data not shown).
The results of the electrophysiology experiments are important because they suggest that the mechanisms by which EAAC1 controls excitatory transmission in the DLS may be different from the ones described in the hippocampus (Scimemi et al., 2009). Other types of glutamate receptors, such as the mGluRIs, are expressed at high levels in extrasynaptic regions along the plasma membrane of striatal neurons (Paquet and Smith, 2003). These receptors are known to modulate cell excitability through a variety of mechanisms including suppression of potassium channels (e.g., IAHP, IM, Ileak, and Islow) (Charpak et al., 1990; Womble and Moises, 1994; Ikeda et al., 1995; Lüthi et al., 1997) and calcium channels (Crépel et al., 1994; Kammermeier et al., 2000). Although blocking mGluRI with type 1 and 5 mGluR antagonists did not affect the amplitude of the FV and PS in WT mice [Norm FV amp WT: 1.08 ± 0.05 (n = 13), EAAC1−/−: 1.06 ± 0.08 (n = 16), p = 0.85; Fig. 4F,G], it significantly increased the PS/FV amplitude ratio in EAAC1−/− mice [Norm FV amp WT: 0.91 ± 0.09 (n = 13), EAAC1−/−: 1.21 ± 0.06 (n = 16), **p = 3.4e-3, WT vs EAAC1−/− *p = 0.012; Fig. 4F,G]. We used separate control experiments to rule out that these results were due to time-dependent changes in the FV and PS/FV amplitude over the course of our experiments (Fig. 4H,I). To do this, we obtained extracellular recordings without adding any drug to the external solution apart from picrotoxin. There was no significant time-dependent change in the FV amplitude [Norm FV amp WT: 0.99 ± 0.06 (n = 8), p = 0.93; Norm FV amp EAAC1−/−: 1.12 ± 0.09 (n = 7), p = 0.24; WT vs EAAC1−/− p = 0.28] and PS/FV amplitude ratio in WT and EAAC1−/− mice [Norm PS/FV amp WT: 1.16 ± 0.07 (n = 8), p = 0.058; Norm PS/FV amp EAAC1−/−: 1.16 ± 0.17 (n = 7), p = 0.38; WT vs EAAC1−/− p = 1.00; Fig. 4H,I]. This suggests that the different sensitivity to mGluRI antagonists of the PS/FV ratio in EAAC1−/− mice is not biased by potential time-dependent changes in our recordings. By obtaining input/output curves, we confirmed that the effect of mGluRI antagonists could be detected over a broad range of stimulus intensities in EAAC1−/− mice (n = 16) but not in WT mice (n = 13, **p = 2.1e-3; Fig. 4J).
The increased PS/FV sensitivity to mGluRI antagonists might be explained by increased mGluRI expression or by increased extracellular glutamate concentration in EAAC1−/− mice. However, Western blot analysis showed that the mGluRI protein expression level is similar in WT and EAAC1−/− mice [Norm band intensity WT: 1 ± 0.13 (n = 6), EAAC1−/−: 1.23 ± 0.23 (n = 8), p = 0.41; Fig. 4K]. To determine whether there might be an increase in the extracellular glutamate concentration in the absence of EAAC1, we measured tonic GluN currents at hyperpolarized potentials to ensure glutamate transport via postsynaptic EAAC1 (Wadiche et al., 1995; Zerangue and Kavanaugh, 1996). Briefly, we voltage clamped MSNs at −70 mV in the presence of Mg2+-free external solution containing blockers of GABAA (picrotoxin, 100 μm) and GluA receptors (NBQX, 10 μm) and measured the change in the holding current evoked by blocking GluN receptors with APV (50 μm). We did not detect any significant change in the tonic GluN current [WT: 10.1 ± 4.1 pA (n = 6), EAAC1−/−: 15.8 ± 9.3 pA (n = 6), p = 0.59] and tonic GluN current density (tonic current/cell capacitance) in WT and EAAC1−/− mice [WT: 0.55 ± 0.43 pA/pF (n = 6), EAAC1−/−: 0.36 ± 0.19 pA/pF (n = 6), p = 0.70]. Is this result consistent with our knowledge of mGluRI kinetics of activation and of glutamate transporter control of ambient glutamate concentration? We addressed this question using a modeling approach. First, we estimated the mGluRI open probability over a broad range of extracellular glutamate concentrations using a kinetic model of mGluRI (Marcaggi et al., 2009; Fig. 4L). Second, we calculated the mGluRI open probability at the experimentally measured extracellular glutamate concentration in the striatum (∼25 nm; Chiu and Jahr, 2017) and the estimated concentration of glutamate transporters (∼140 μm; Lehre and Danbolt, 1998). Third, we used steady-state equations to determine the effect of a progressive reduction in the glutamate transporter concentration on the extracellular glutamate concentration and the mGluRI open probability. The results show that the mGluRI open probability is very low (Po ∼6e-4) when the glutamate transporter concentration is 140 μm (i.s. Norm [Transporter = 1]) and the extracellular glutamate concentration is 25 nm. Reducing the glutamate transporter concentration by 5%, consistent with the expected change in glutamate transporter concentration in the absence of EAAC1 (Danbolt, 2001), would cause at most a 10 nm increase in the ambient glutamate concentration (Fig. 4L). This increase in ambient glutamate concentration does not cause a significant change in the mGluRI open probability. Therefore, the results of the Western blot analysis and the modeling suggest that the increased contribution of mGluRI to the PS/FV ratio in EAAC1−/− mice is not due to either increased mGluRI expression or increased tonic mGluRI activation. Instead, it is consistent with increased phasic activation of mGluRI in the absence of EAAC1.
The effect of EAAC1 on mGluRI activation is noteworthy because the activation of different types of glutamate receptors in the DLS is crucial for the expression of long-term plasticity. Here, long-term potentiation (LTP) relies on GluN and D1R activation (Calabresi et al., 1992a; Partridge et al., 2000; Spencer and Murphy, 2000). Long-term depression (LTD) relies on mGluRI and D2R activation and on postsynaptic calcium influx via l-type calcium channels (Calabresi et al., 1992b; Gubellini et al., 2001; Sung et al., 2001). In our experiments, high-frequency stimulation (HFS; 100 Hz × 1 s) of the DLS evoked LTD or LTP, depending on the extracellular calcium concentration ([Ca2+]o; Fig. 5A). In WT mice, HFS induced LTP at a calcium concentration that mimics the one found in the CSF {[Ca2+]o = 1.2 mm; Norm PS/FV amp WT: 1.21 ± 0.09 (n = 7), *p = 0.047}. HFS did not induce long-term plasticity at [Ca2+]o = 2.5 mm [Norm PS/FV amp WT: 1.09 ± 0.07 (n = 7), p = 0.22]. Increasing the extracellular calcium concentration to [Ca2+]o = 3.5 mm led to a robust LTD, likely because of the increased driving force for postsynaptic calcium influx [Norm PS/FV amp WT: 0.84 ± 0.06 (n = 11), *p = 0.032; Fig. 5A,C]. In EAAC1−/− mice, HFS did not induce any form of plasticity at any of the tested extracellular calcium concentrations {Norm PS/FV amp [Ca2+]o = 1.2 mm EAAC1−/−: 1.04 ± 0.06 (n = 8), p = 0.50; [Ca2+]o = 2.5 mm EAAC1−/−: 0.96 ± 0.04 (n = 12), p = 0.28; [Ca2+]o = 3.5 mm EAAC1−/−: 1.05 ± 0.06 (n = 7), p = 0.46; Fig. 5B,D}. Loss of LTD in EAAC1−/− mice is consistent with altered mGluRI activation. However, loss of LTP suggests that other receptors, in addition to mGluRI, might be disrupted in the absence of EAAC1. Therefore, we performed additional experiments to determine what molecular mechanism could account for the loss of LTP in the DLS of EAAC1−/− mice.
Figure 5.

Ca2+ dependence of long-term plasticity is lost in EAAC1−/− mice. A, Left, Extracellular recordings obtained 5 min before (black trace) and 30 min after applying a HFS protocol (100 Hz, 1 s) to the DLS of WT mice (gray trace). The recordings were obtained in the presence of extracellular solutions containing [Ca2+] = 1.2 mm (top panel), [Ca2+] = 2.5 mm (middle panel), and [Ca2+] = 3.5 mm (bottom panel). Each trace represents the average of 20 consecutive sweeps. The shaded area represents the SEM. Right, Time course of baseline-normalized field recordings. Each symbol represents the average of three consecutive time points. The notation “Norm PS/FV” on the y-axis refers to the amplitude ratio of the population spike and fiber volley normalized by the one measured before applying the HFS protocol. B, As in A but for EAAC1−/− mice. C, Summarized effect of HFS on the PS/FV ratio in WT mice at three different extracellular [Ca2+] [1.2 mm: (n = 7) *p = 0.047; 2.5 mm: (n = 7) p = 0.22; 3.5 mm: (n = 11) *p = 0.032]. D, Summarized effect of HFS on the PS/FV ratio in EAAC1−/− mice at three different extracellular [Ca2+] [1.2 mm: (n = 8) p = 0.50; 2.5 mm: (n = 12) p = 0.28; 3.5 mm: (n = 7) p = 0.46].
EAAC1 promotes dopamine receptor expression
Loss of LTP in EAAC1−/− mice is surprising because this form of plasticity in the striatum does not require mGluRI, but rather GluN and D1R activation. The electrophysiology experiments in Figure 4 do not support a different contribution of GluN receptors to excitatory synaptic transmission in the DLS of EAAC1−/− mice,and therefore point to an effect of EAAC1 on D1Rs. To test this hypothesis, we measured the mRNA (Fig. 6) and protein levels (Fig. 7) of D1R and D2R in the striatum of WT and EAAC1−/− mice, using qRT-PCR and Western blot analysis, respectively. The sensitivity of the qRT-PCR technique was validated by measuring mRNA levels for the Slc1a1 gene, encoding EAAC1, in the striatum of WT and EAAC1−/− mice (Fig. 6A–D). We confirmed that the mRNA level of EAAC1 was negligible in EAAC1−/− mice [Fig. 6A–C; Norm Slc1a1 EAAC1−/−/WT: 0.05 ± 0.01 (n = 5), ***p = 1.5e-7} and that the mRNA levels of EAAC1 were similar in the DLS and VMS (p = 0.42; Fig. 6D). The mRNA level of D1R in the entire striatum, but not the D2R, was significantly reduced in EAAC1−/− compared with WT mice [Norm Drd1a EAAC1−/−/WT: 0.65 ± 0.10 (n = 11), **p = 5.0e-3; Norm Drd2 EAAC1−/−/WT: 0.89 ± 0.14 (n = 11), p = 0.48; Fig. 6E–G]. Similar results were obtained when we analyzed the DLS and VMS separately for D1R [Norm DLS Drd1a EAAC1−/−/WT: 0.82 ± 0.06 (n = 6), *p = 0.037; Norm VMS Drd1a EAAC1−/−/WT: 0.53 ± 0.08 (n = 6), **p = 1.6e-3; Fig. 6H–J] and D2R [Norm DLS Drd2 EAAC1−/−/WT: 1.15 ± 0.33 (n = 6), p = 0.32; Norm VMS Drd2 EAAC1−/−/WT: 0.79 ± 0.29 (n = 6), p = 0.14; Fig. 6K–M], suggesting that they are widespread throughout the entire striatal formation.
Changes in D1R mRNA might be associated with altered D1R protein expression, which we tested using Western blot analysis. As a first step, we validated the sensitivity and specificity of the antibodies directed against D1R and D2R. First, we performed immunolabeling experiments on striatal sections from mice in which the genetically encoded red fluorescent protein (RFP) mCherry was selectively expressed either in D1- or D2-MSNs (data not shown). In the DLS, the anti-D1R antibody labeled a significant proportion of RFP-expressing cells in sections from D1Cre/+:Ai9Tg/0 mice (0.70 ± 0.08, n = 4) and a very small proportion of RFP-expressing cells in sections from A2ACre/+:Ai9Tg/0 mice (0.09 ± 0.03, n = 3). The vast majority of immunolabeled cells were RFP-expressing D1-MSNs (0.84 ± 0.04, n = 4), not D2-MSNs (0.13 ± 0.03, n = 3). Likewise, the anti-D2R antibody labeled a significant proportion of RFP-expressing cells in sections from A2ACre/+:Ai9Tg/0 mice (0.83 ± 0.07, n = 4) and a very small proportion of RFP-expressing cells in sections from D1Cre/+:Ai9Tg/0 mice (0.08 ± 0.04, n = 3). The vast majority of immunolabeled cells were RFP-expressing D2-MSNs (0.89 ± 0.07, n = 4), not D1-MSNs (0.14 ± 0.05, n = 3). These data showed that the anti-D1R/D2R antibodies are sensitive and specific. To validate their specificity in Western blot analysis, we compared the D1R protein expression in the striatum and in the cortex, where D1R and D2R are less abundantly expressed (Gong et al., 2003; Gong et al., 2007) (data not shown). Accordingly, the protein expression of D1R was significantly lower in the cortex compared with the striatum [Norm D1R striatum: 1.00 ± 0.15 (n = 8), Norm D1R cortex: 0.60 ± 0.08 (n = 8), *p = 0.037]. Similar results were obtained when using the anti-D2R antibody [Norm D2R striatum: 1.00 ± 0.10 (n = 14), Norm D2R cortex: 0.69 ± 0.08 (n = 16), *p = 0.022]. If the antibodies used for these experiments specifically labeled D1R or D2R bands, then these bands should no longer be detected after preincubating the antibodies with their corresponding control peptide antigen. Consistent with this hypothesis, no band was detected by either antibody in preadsorption experiments [Norm D1R peptide: 0.07 ± 0.01 (n = 7), ***p = 3.7e-4, Norm D2R peptide: 0.13 ± 0.07 (n = 7), ***p = 1.1e-6]. Having confirmed the specificity of our antibodies, we investigated whether the reduced D1R mRNA levels were associated with altered D1R protein levels in EAAC1−/− mice. Consistent with the qRT-PCR data, we detected lower levels of D1R in protein extracts from the entire striatum of EAAC1−/− mice, whereas there was no change in D2R expression [Norm D1R EAAC1−/−/WT: 0.69 ± 0.03 (n = 8), ***p = 2.7e-4; Norm D2R EAAC1−/−/WT: 0.86 ± 0.16 (n = 8), p = 0.51; Fig. 7A].
To determine whether the reduced of D1R protein expression could be consequent to loss of D1-MSNs in EAAC1−/− mice, we compared the proportion and density of RFP-expressing cells in D1Cre/+:Ai9Tg/0 and D1Cre/+:Ai9Tg/0:EAAC1−/− mice, D1tdTomato/+ and D1tdTomato/+:EAAC1−/− mice, and A2ACre/+:Ai9Tg/0 and A2ACre/+:Ai9Tg/0:EAAC1−/− mice (data not shown). The proportion of RFP-expressing cells was calculated as the ratio between red cells (expressing RFPs) and blue cells (labeled with DAPI), whereas the density of RFP-expressing cells was calculated as the number of red cells in the matrix region of the DLS. There was no significant difference in the density of RFP-expressing D1-MSNs in WT and EAAC1−/− mice, in the DLS [WT: 0.81e-3 ± 7.10e-5 μm−2 (n = 11), EAAC1−/− 0.83e-3 ± 0.12e-3 μm−2 (n = 6), p = 0.90] and VMS [WT: 0.69e-3 ± 0.11e-3 μm−2 (n = 6), EAAC1−/− 0.99e-3 ± 8.15e-5 μm−2 (n = 6), p = 0.073]. The proportion of D1-MSNs was also similar in WT and EAAC1−/− mice in the DLS [WT: 0.39 ± 0.03 (n = 11), EAAC1−/−: 0.41 ± 0.03 (n = 6), p = 0.64] and VMS [WT: 0.31 ± 0.06 (n = 7), EAAC1−/−: 0.45 ± 0.02 (n = 6), p = 0.055]. Similar results were obtained when measuring the density of RFP-expressing D2-MSNs in the presence and absence of EAAC1, in the DLS [WT: 1.12e-3 ± 3.78e-5 μm−2 (n = 6), EAAC1−/− 1.07e-3 ± 5.94e-5 μm−2 (n = 5), p = 0.14] and VMS [WT: 0.89e-3 ± 3.38e-5 μm−2 (n = 6), EAAC1−/− 0.86e-3 ± 2.61e-5 μm−2 (n = 5), p = 0.58]. The density of D2-MSNs was larger in the DLS than in the VMS, but this difference was present in both WT mice [WT DLS: 1.2e-3 ± 3.8e-5 (n = 6), VMS: 3.9e-4 ± 3.4e-5 (n = 6), **p = 1.7e-4] and EAAC1−/− mice [EAAC1−/− DLS: 1.1e-3 ± 5.9e-5 (n = 5), VMS: 0.9e-3 ± 2.6e-5 (n = 5), *p = 0.022] and the proportion of D2-MSNs was also similar in WT and EAAC1−/− mice in the DLS [WT: 0.40 ± 0.01 (n = 6), EAAC1−/−: 0.40 ± 0.02 (n = 5), p = 0.93] and VMS [WT: 0.38 ± 0.02 (n = 6), EAAC1−/−: 0.40 ± 0.01 (n = 5), p = 0.31]. Together, these results suggest that loss of EAAC1 is not associated with altered density of D1- or D2-MSNs. Therefore, the reduced D1R expression in EAAC1−/− mice might be due to altered trafficking and internalization of D1R from the cell membrane.
The expression of dopamine receptors is subject to intracellular regulation by a variety of signaling molecules including the phosphoprotein DARPP-32, which has been suggested to act as a robust integrator of glutamatergic and dopaminergic transmission (Gould and Manji, 2005; Fernandez et al., 2006). Although the total level of DARPP-32 was similar in WT and EAAC1−/− mice [Norm DARPP-32 EAAC1−/−/WT: 1.00 ± 0.05 (n = 12), p = 0.92; Fig. 7B], the ability of this protein to modulate dopaminergic and glutamatergic signaling depends, not only on its abundance, but also on its phosphorylation state (Greengard et al., 1999). The signaling cascades that modulate the phosphorylation state of DARPP-32 include the Gq signaling cascades activated by mGluRI (Liu et al., 2001; Liu et al., 2002; Svenningsson et al., 2004; Nishi et al., 2005). Of the four known phosphorylation sites of DARPP-32 (T34, T75, S97, and S130), the only one differentially phosphorylated in EAAC1−/− mice was pDARPP-32S130 [pDARPP-32S130 WT: 0.28 ± 0.08 (n = 14), EAAC1−/−: 0.60 ± 0.10 (n = 17), *p = 0.024; Fig. 7C]. The almost threefold increase in pDARPP-32S130 phosphorylation indicates that the phosphorylation pattern of pDARPP-32 is profoundly disrupted in the absence of EAAC1 [Norm pDARPP-32S130 EAAC1−/−/WT: 2.70 ± 0.44 (n = 14), **p = 2.1e-3; Fig. 7D,E].
Is it plausible that changes in signaling pathways coupled to mGluRI, known to activate phospholipase C, to stimulate the generation of inositol 1,4,5-trisphosphate, and to mobilize calcium from internal stores (Casabona et al., 1997), would increase pDARPP-32S130 phosphorylation? We addressed this question using a modeling approach based on 3D reaction–diffusion Monte Carlo simulations of calcium diffusion and DARPP-32 phosphorylation (Fig. 8). We modeled the geometry of the postsynaptic terminal as a 1 μm3 sphere, consistent with the average volume of spine heads of striatal neurons (Forlano and Woolley, 2010). At the beginning of each simulation, the sphere contained 3000 DARPP-32 molecules and a number of protein kinases and phosphatases known to modulate the phosphorylation state of DARPP-32 (Table 6). We then allowed the system to equilibrate for 150 s. Under these baseline conditions, the resting concentration of pDARPP-32S130 was 10 nm. We then released variable amounts of calcium (1 μm–1 mm) from the center of the sphere to simulate the intracellular calcium rise coupled to mGluRI activation. Single pulses or trains of 10 pulses (0.1–10 Hz) evoked a detectable increase pDARPP-32S130, suggesting that the altered activation of Gq signaling pathways coupled to mGluRI and the consequent increase in intracellular calcium concentration can alter pDARPP-32S130 phosphorylation.
EAAC1 controls plasticity and dopamine receptor expression via signaling pathways coupled to mGluRI activation
If the loss of synaptic plasticity (Fig. 5), reduced D1R expression (Figs. 6, 7A), altered phosphorylation of DARPP-32 (Fig. 7B–E), and disrupted grooming behaviors in EAAC1−/− mice (Fig. 3) were all triggered by increased mGluRI activation (Fig. 4), then we would expect to convert the functional phenotype of EAAC1−/− into that of WT mice by blocking mGluRI. Consistent with this hypothesis, blocking mGluRI with LY367385 (50 μm) and MPEP (10 μm) rescued LTP and LTD in EAAC1−/− mice [Norm PS/FV amp [Ca2+]o = 1.2 mm: 1.28 ± 0.11 (n = 22), *p = 0.015; Norm PS/FV amp [Ca2+]o = 2.5 mm: 1.08 ± 0.08 (n = 12), p = 0.36; Norm PS/FV amp [Ca2+]o = 3.5 mm: 0.84 ± 0.05 (n = 8), *p = 0.018; Fig. 9]. This pharmacological treatment also rescued D1R expression [Norm D1R EAAC1−/−: 1.13 ± 0.13 (n = 9), p = 0.35; Norm D2R EAAC1−/−: 1.33 ± 0.14 (n = 7), p = 0.06; Fig. 10A] and reduced pDARPP-32S130 phosphorylation [Norm pDARPP-32S130 EAAC1−/−/WT: 0.37 ± 0.11 (n = 9), ***p = 2.1e-4; Fig. 10C–E]. These findings are consistent with an effect of mGluRI on pDARPP-32S130 phosphorylation (Liu et al., 2001; Liu et al., 2002). However, this broad pharmacological approach also induced a significant reduction in the total level of DARPP-32 [Norm DARPP-32: 0.87 ± 0.04 (n = 9), *p = 0.029; Fig. 10B] and a decrease in pDARPP-32T75–phosphorylation [Norm pDARPP-32T75 EAAC1−/−/WT: 0.45 ± 0.05 (n = 12), ***p = 1.0e-5; Fig. 10C–E]. These effects were not detected in EAAC1−/− mice (Fig. 7) and may be consequent to the widespread blockade of mGluRI in multiple regions of the brain still present in slice preparations. For this reason, we felt compelled to test more specific approaches that could recapitulate more faithfully the molecular and behavioral phenotype of EAAC1−/− mice.
Figure 9.
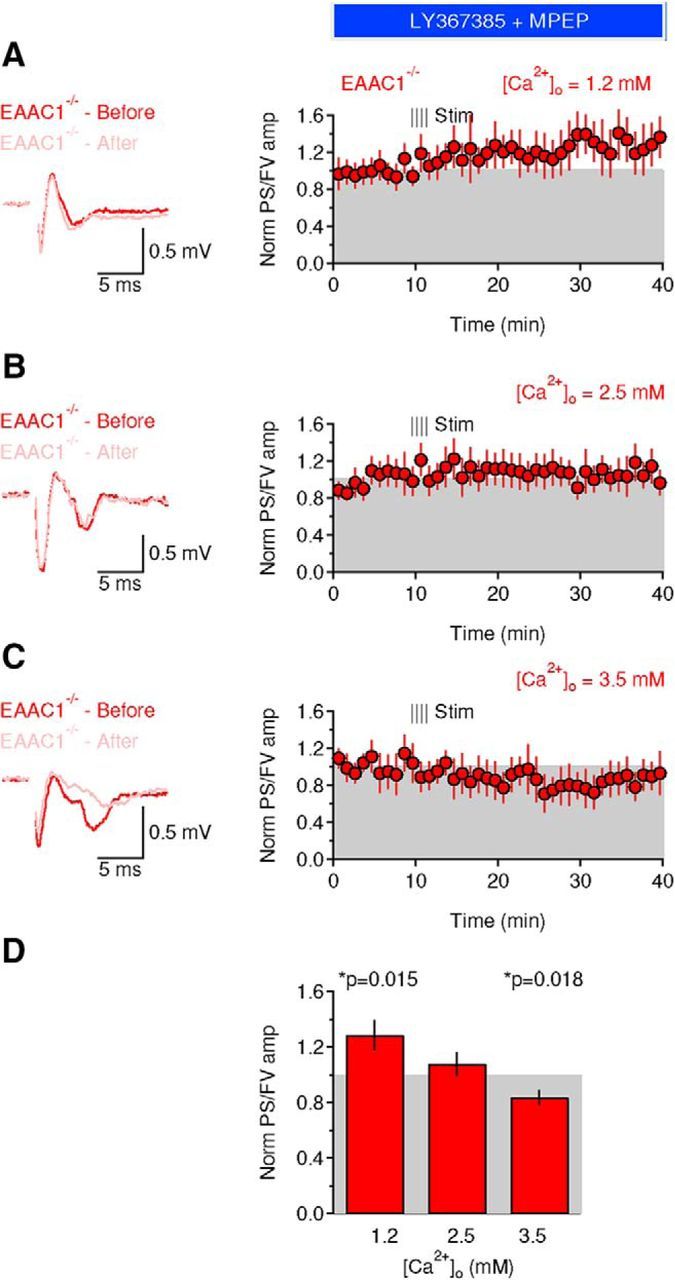
Blocking mGluRI activation rescues the Ca2+ dependence of long-term plasticity in EAAC1−/− mice. A, Left, Extracellular recordings performed in the presence of the mGluRI blockers LY367385 (50 μm) and MPEP (10 μm) obtained 5 min before (red trace) and 30 min after applying an HFS protocol (100 Hz, 1 s) to the DLS of EAAC1−/− mice (pink trace). The recordings were obtained in the presence of extracellular solutions containing [Ca2+] = 1.2 mm. Each trace represents the average of 20 consecutive sweeps. The shaded area represents the SEM. Right, Time course of baseline-normalized field recordings. Each symbol represents the average of three consecutive time points. The notation “Norm PS/FV” on the y-axis refers to the amplitude ratio of the population spike and fiber volley normalized by the one measured before applying the HFS protocol. B, As in A but in the presence of extracellular solutions containing [Ca2+] = 2.5 mm. C, As in A but in the presence of extracellular solutions containing [Ca2+] = 3.5 mm. D, Summarized effect of HFS on the PS/FV ratio in EAAC1−/− mice in the presence of mGluRI blockers and at three different extracellular [Ca2+] [1.2 mm (n = 22), *p = 0.015; 2.5 mm (n = 12), p = 0.36; 3.5 mm (n = 8), *p = 0.018].
Activation of signaling pathways coupled to mGluRI recapitulates the molecular and behavioral phenotype of EAAC1−/− mice in WT mice
In the striatum, mGluRI are expressed in both D1- and D2-MSNs (Tallaksen-Greene et al., 1998). The observed reduction of D1R expression in EAAC1−/− mice (Fig. 7A), however, suggests a higher sensitivity to mGluRI activation in D1-MSNs compared with D2-MSNs. If this were true, then we would expect cell-specific activation of G-protein-coupled signaling cascades activated by mGluRI in D1-MSNs to mimic closely the molecular and behavioral phenotype of EAAC1−/− mice. This hypothesis can be tested using a chemogenetic approach based on the combined use of BAC transgenic mouse lines and Designer Receptors Exclusively Activated by Designer Drugs (DREADDs) (Armbruster et al., 2007). The conditional expression of DREADDS in D1Cre/+ mice allowed us to activate Gq signaling cascades like those coupled to mGluRI exclusively in D1-MSNs. To accomplish this goal, we performed unilateral stereotaxic injections of AAV-hSyn-DIO-hM3D(Gq)-mCherry in the DLS of D1Cre/+ mice aged P14–P16 (Fig. 11, left). We confirmed the successful DREADD transfection of the injected striatum by measuring the expression of the mCherry protein in the striatum and cortex of the injected and noninjected brain. The noninjected striatum and the adjacent cortex were not expected to express mCherry and were used as internal controls to confirm the accuracy of the stereotaxic injections in the DLS, not in the adjacent cortex. One week after the surgery, the mice were habituated to daily intraperitoneal saline injections to prevent any bias of our results due to acute stress responses to the intraperitoneal injections of the DREADD activator CNO 2 weeks after surgery. DREADD activation is maximal 1–1.5 h after the CNO injection and starts declining after 3 h (Gomez et al., 2017; Raper et al., 2017). Therefore, any effect of CNO is likely to happen within this time window. One hour after the CNO injections, we video monitored the mice to measure their grooming activity and then killed them 2 h after the CNO injection to extract the striatum for Western blot analysis (Fig. 11A). We then measured the protein levels of mCherry, D1R, D2R, and pDARPP-32 and compared their expression levels in the injected and noninjected striatum and cortex (Fig. 11B–D, left). We detected a substantial increase in mCherry expression only in the injected striatum of D1Cre/+ mice, not in the adjacent cortex, confirming the accuracy of our stereotaxic injections [hM3D(Gq) cortex: 1.22 ± 0.20 (n = 10), p = 0.28; hM3D(Gq) striatum: 2.89 ± 0.80 (n = 10), *p = 0.040; Fig. 11B, left]. DREADD-mediated activation of Gq signaling cascades led to reduced D1R expression [hM3D(Gq): 0.79 ± 0.07 (n = 9), *p = 0.013] without affecting D2R expression [hM3D(Gq): 0.91 ± 0.10 (n = 8), p = 0.35; Fig. 11C, left]. Gq signaling activation in D1-MSNs also caused a significant and specific increase in the phosphorylation of pDARPP-32S130 in D1Cre/+ mice [hM3D(Gq): 2.48 ± 0.49 (n = 11), **p = 5.6e-3; Fig. 11D, left]. These results show that D1-MSN, cell-specific activation of Gq signaling cascades like the ones activated by mGluRI can lead to increased phosphorylation of pDARPP-32S130 and reduced D1R expression similar to what we observed in EAAC1−/− mice, possibly because of increased D1R internalization.
As an additional test of our hypothesis, we performed stereotaxic injections of AAV-hSyn-DIO-hM3D(Gq)-mCherry in the DLS of A2ACre/+ mice. We confirmed the increase in mCherry expression in the injected striatum and not in the adjacent cortex in A2ACre/+ mice [hM3D(Gq) cortex: 1.18 ± 0.31 (n = 8), p = 0.59; hM3D(Gq) striatum: 2.06 ± 0.52 (n = 23), *p = 0.035; Fig. 11B, right]. DREADD-mediated activation of Gq signaling cascades in D2-MSNs did not alter D1R expression [hM3D(Gq): 1.10 ± 0.15 (n = 9), p = 0.63] and D2R expression [hM3D(Gq): 0.78 ± 0.20 (n = 5), p = 0.34; Fig. 11C, right] and did not cause any significant change in the phosphorylation of pDARPP-32S130 [hM3D(Gq): 1.04 ± 0.32 (n = 6), p = 0.89; Fig. 11D, right]. These results showed that activation of Gq signaling cascades in D2-MSNs does not induce any of the changes in D1R expression and pDARPP-32phosphorylation detected in EAAC1−/− mice.
If the cell-specific activation of Gq signaling cascades in D1-MSNs recapitulates the molecular phenotype of EAAC1−/− mice, then does it also reproduce the behavioral phenotype of EAAC1−/− mice? To address this question, we repeated our grooming analysis in DREADD-injected D1Cre/+ and A2ACre/+ mice (Fig. 11E,F). As a control, to rule out potential off-target effects of CNO or its metabolites on endogenous receptors (Gomez et al., 2017), we performed stereotaxic injections of the DREADD construct or of saline solution and intraperitoneal CNO injections on age-matched WT mice (here referred to as sham; Fig. 11E,F). Gq signaling activation caused an increase in the grooming frequency in D1Cre/+ mice versus sham mice [sham: 5.3 ± 0.4e-3 Hz (n = 25); D1Cre/+: 8.0 ± 0.8e-3 Hz (n = 39); D1Cre/+ vs sham: **p = 6.0e-3; Fig. 11E,F] without changing the duration of grooming episodes [sham: 32.2 ± 4.2 s (n = 34); D1Cre/+: 40.9 ± 3.5 s (n = 44), p = 0.12; Fig. 11E,F]. Gq signaling activation in the DLS of A2ACre/+ mice did not alter the grooming frequency or duration [6.0 ± 0.4e-3 Hz (n = 49), p = 0.28; 42.3 ± 3.9 s (n = 58), p = 0.08; Fig. 11E,F]. The grooming behavior of D1Cre/+ mice that received DREADD activation was reminiscent of that of EAAC1−/− mice, whereas the behavior of A2ACre/+ mice was similar to that of WT mice shown in Figure 3, A and B. Therefore, cell-specific activation of Gq signaling cascades in D1-MSNs recapitulates the molecular and behavioral phenotype of EAAC1−/− mice. These findings identify EAAC1 as a key regulator of glutamatergic and dopaminergic transmission and of repeated motor behaviors.
Discussion
Glutamate transporters play a fundamental role in shaping excitatory synaptic transmission in the brain. This knowledge largely relies on numerous and detailed studies of glial transporters that are abundantly expressed in the neuropil (Danbolt, 2001). The neuronal glutamate transporter EAAC1 accounts for a small fraction of all glutamate transporters in the brain (Holmseth et al., 2012). Therefore, its functional role has long remained enigmatic (Scimemi et al., 2009; Holmseth et al., 2012) despite evidence of a genetic association between polymorphisms in the gene encoding EAAC1 and OCD (Dickel et al., 2006; Porton et al., 2013; Zike et al., 2017). In the hippocampus, EAAC1 limits extrasynaptic GluN activation by rapidly binding synaptically released glutamate (Scimemi et al., 2009). The striatum is one of the brain regions where EAAC1 is most abundantly expressed (Danbolt, 2001; Kanai and Hediger, 2004) and is part of a polysynaptic circuit that shows patterns of hyperactivity in patients with OCD (Ting and Feng, 2011; Ahmari et al., 2013). In the striatum, excitatory synaptic transmission is largely mediated by GluA receptors, with very little involvement of GluN receptors (Sung et al., 2001). mGluRI glutamate receptors are abundantly expressed in the striatum (Albin et al., 1992; Shigemoto et al., 1992; Shigemoto et al., 1993; Testa et al., 1998; Ferraguti and Shigemoto, 2006) and their activation is crucial for the induction of long-term synaptic plasticity (Calabresi et al., 1992b; Anwyl, 1999; Sung et al., 2001). Small changes in the excitatory drive onto distinct populations of striatal neurons is important in the context of OCD because they can exert a powerful control of the dynamics of neuronal circuits that are dysfunctional in OCD (Klaus and Plenz, 2016; O'Donnell et al., 2017; Rădulescu et al., 2017).
Here, we show that EAAC1 limits mGluRI activation in the striatum. By limiting mGluRI activation, EAAC1 promotes D1R expression and long-term plasticity. An interesting implication of our work is that intracellular Gq signaling cascades coupled to mGluRI activation are able to regulate both D1R expression and the phosphorylation state of DARPP-32 rapidly, within a 2 h time window (Fig. 11). These findings are consistent with evidence showing that D1R internalization from the cell membrane can be modified within minutes using different pharmacological manipulations (Dumartin et al., 1998; Rassu et al., 2017).
An important insight of our work is that the functional role of EAAC1 differs across brain regions and therefore cannot rely exclusively on previous work in the hippocampus (Scimemi et al., 2009). Not only are there regional differences in the density of expression of EAAC1, but there are also regional differences in the distribution of other molecules susceptible to the activity of EAAC1 (e.g., GluN and mGluRI). The distinctive neuronal localization of EAAC1 puts it at an important positional advantage with respect to glial glutamate transporters, allowing it to be the first transporter to bind glutamate as it diffuses out of the synaptic cleft. Although previous work hypothesized that loss of EAAC1 may lead to increased glutamate concentration in the CSF (Chakrabarty et al., 2005; Porton et al., 2013), our experimental and modeling data suggest that this is an unlikely scenario mainly because the expression of EAAC1 is significantly lower than that of glial glutamate transporters (Holmseth et al., 2012). In the striatum and hippocampus, EAAC1 is not implicated in the regulation of the steady-state ambient glutamate concentration, but rather in the control of phasic synaptic transmission and long-term plasticity.
The findings that EAAC1−/− mice show reduced D1R expression is consistent with recent radiolabeling assays showing decreased D1R density in the DLS of mice with constitutively reduced EAAC1 expression via prolonged exposure to amphetamine (Zike et al., 2017). The DARPP-32 phosphoprotein is abundantly but not exclusively expressed in D1-MSNs (Ouimet et al., 1984; Anderson and Reiner, 1991) and is known to integrate glutamatergic and dopaminergic transmission in the striatum (Svenningsson et al., 2004). Our findings do not allow us to distinguish whether the effect of EAAC1 on D1R expression is mediated directly by DARPP-32 or by other molecules that are part of the Gq signaling cascades activated by mGluRI. However, they raise the possibility that these intracellular mechanisms may have different functional implications for integrating glutamatergic and dopaminergic signals in D1- and D2-MSNs.
Although many of the effects described here may appear subtle, they are noteworthy, not only because they are statistically robust, but alaso because they yield novel insights into the physiological and pathological implications of EAAC1 for neuropsychiatric disorders that still lack effective pharmacological treatments. Loss of EAAC1 is associated with a distinctive behavioral phenotype, which includes increased anxiety-like and disrupted grooming behaviors. The altered motor behaviors of EAAC1−/− mice can be recapitulated by cell-specific activation of mGluRI-activated signaling cascades in D1-MSNs. The finding that increased mGluRI activation contributes to increased anxiety-like behaviors and repeated movement execution in EAAC1−/− mice is consistent with a key role for these neuronal glutamate transporters in the modulation of motor function and perseverative behaviors. Our data are consistent with previous work in Sapap3 knock-out mice, in which increased mGluRI activation drives OCD-like behaviors via disruption of mGluR5-Homer interaction and constitutive mGluR5 signaling (Wan et al., 2011; Ade et al., 2016). Interestingly, PET studies in humans show that the mGluRI distribution volume ratio in brain regions that show functional abnormalities in OCD (e.g., the corticostriatal-thalamo-cortical pathway) is positively correlated with the patients' Y-BOCS obsession scores (Akkus et al., 2014). Increased expression and activation of mGluRI has also been observed in patients affected by other types of autism spectrum disorders (e.g., fragile X syndrome, tuberous sclerosis complex) and intellectual disability (Boer et al., 2008; Maccarrone et al., 2010; Lohith et al., 2013), suggesting a possible common etiology for a broad range of neuropsychiatric diseases (D'Antoni et al., 2014). Currently, many patients diagnosed with OCD are treated with cognitive behavioral therapy and/or serotonin reuptake inhibitors, but these approaches do not improve the symptoms of the disease for ∼50% of the patients (Dougherty et al., 2004; Koran et al., 2007). One important implication of our work is that the treatment of neuropsychiatric disorders such as OCD may be particularly challenging because it may require either cell-specific targeting of mGluRI or pharmacological manipulations that affect both glutamatergic and dopaminergic transmission in specific regions of the brain.
Footnotes
This work was supported by the State University of New York (SUNY)–Albany, the SUNY–Albany Research Foundation, and the National Science Foundation (Grant IOS 1655365). We thank Dimitri M. Kullmann and Marco Beato for comments on the manuscript.
The authors declare no competing financial interests.
References
- Ade KK, Wan Y, Hamann HC, O'Hare JK, Guo W, Quian A, Kumar S, Bhagat S, Rodriguiz RM, Wetsel WC, Conn PJ, Dzirasa K, Huber KM, Calakos N (2016) Increased metabotropic glutamate receptor 5 signaling underlies obsessive-compulsive disorder-like behavioral and striatal circuit abnormalities in mice. Biol Psychiatry 80:522–533. 10.1016/j.biopsych.2016.04.023 [DOI] [PMC free article] [PubMed] [Google Scholar]
- Ahmari SE, Spellman T, Douglass NL, Kheirbek MA, Simpson HB, Deisseroth K, Gordon JA, Hen R (2013) Repeated cortico-striatal stimulation generates persistent OCD-like behavior. Science 340:1234–1239. 10.1126/science.1234733 [DOI] [PMC free article] [PubMed] [Google Scholar]
- Akkus F, Terbeck S, Ametamey SM, Rufer M, Treyer V, Burger C, Johayem A, Mancilla BG, Sovago J, Buck A, Hasler G (2014) Metabotropic glutamate receptor 5 binding in patients with obsessive-compulsive disorder. Int J Neuropsychoparmacol 17:1915–1922. 10.1017/S1461145714000716 [DOI] [PubMed] [Google Scholar]
- Albin RL, Makowiec RL, Hollingsworth ZR, Dure LS 4th, Penney JB, Young AB (1992) Excitatory amino acid binding sites in the basal ganglia of the rat: a quantitative autoradiographic study. Neuroscience 46:35–48. 10.1016/0306-4522(92)90006-N [DOI] [PubMed] [Google Scholar]
- Allbritton NL, Meyer T, Stryer L (1992) Range of messenger action of calcium ion and inositol 1,4,5-trisphosphate. Science 258:1812–1815. 10.1126/science.1465619 [DOI] [PubMed] [Google Scholar]
- Anderson KD, Reiner A (1991) Immunohistochemical localization of DARPP-32 in striatal projection neurons and striatal interneurons: implications for the localization of D1-like dopamine receptors on different types of striatal neurons. Brain Res 568:235–243. 10.1016/0006-8993(91)91403-N [DOI] [PubMed] [Google Scholar]
- Angoa-Perez M, Kane MJ, Briggs DI, Francescutti DM, Kuhn DM (2013) Marble burying and nestlet shredding as tests of repetitive, compulsive-like behaviors in mice. J Vis Exp 82:50978. 10.3791/50978 [DOI] [PMC free article] [PubMed] [Google Scholar]
- Anwyl R. (1999) Metabotropic glutamate receptors: electrophysiological properties and role in plasticity. Brain Res Brain Res Rev 29:83–120. 10.1016/S0165-0173(98)00050-2 [DOI] [PubMed] [Google Scholar]
- Armbruster BN, Li X, Pausch MH, Herlitze S, Roth BL (2007) Evolving the lock to fit the key to create a family of G protein-coupled receptors potently activated by an inert ligand. Proc Natl Acad Sci U S A 104:5163–5168. 10.1073/pnas.0700293104 [DOI] [PMC free article] [PubMed] [Google Scholar]
- Arnold PD, Sicard T, Burroughs E, Richter MA, Kennedy JL (2006) Glutamate transporter gene SLC1A1 associated with obsessive-compulsive disorder. Arch Gen Psychiatry 63:769–776. 10.1001/archpsyc.63.7.769 [DOI] [PubMed] [Google Scholar]
- Barnes TD, Kubota Y, Hu D, Jin DZ, Graybiel AM (2005) Activity of striatal neurons reflects dynamic encoding and recoding of procedural memories. Nature 437:1158–1161. 10.1038/nature04053 [DOI] [PubMed] [Google Scholar]
- Berridge KC, Whishaw IQ (1992) Cortex, striatum and cerebellum: control of serial order in a grooming sequence. Exp Brain Res 90:275–290. [DOI] [PubMed] [Google Scholar]
- Boer K, Troost D, Timmermans W, Gorter JA, Spliet WG, Nellist M, Jansen F, Aronica E (2008) Cellular localization of metabotropic glutamate receptors in cortical tubers and subependymal giant cell tumors of tuberous sclerosis complex. Neuroscience 156:203–215. 10.1016/j.neuroscience.2008.06.073 [DOI] [PubMed] [Google Scholar]
- Calabresi P, Pisani A, Mercuri NB, Bernardi G (1992a) Long-term potentiation in the striatum is unmasked by removing the voltage-dependent magnesium block of NMDA receptor channels. Eur J Neurosci 4:929–935. 10.1111/j.1460-9568.1992.tb00119.x [DOI] [PubMed] [Google Scholar]
- Calabresi P, Maj R, Pisani A, Mercuri NB, Bernardi G (1992b) Long-term synaptic depression in the striatum: physiological and pharmacological characterization. J Neurosci 12:4224–4233. [DOI] [PMC free article] [PubMed] [Google Scholar]
- Casabona G, Knöpfel T, Kuhn R, Gasparini F, Baumann P, Sortino MA, Copani A, Nicoletti F (1997) Expression and coupling to polyphosphoinositide hydrolysis of group I metabotropic glutamate receptors in early postnatal and adult rat brain. Eur J Neurosci 9:12–17. 10.1111/j.1460-9568.1997.tb01348.x [DOI] [PubMed] [Google Scholar]
- Cavelier P, Attwell D (2005) Tonic release of glutamate by a DIDS-sensitive mechanism in rat hippocampal slices. J Physiol 564:397–410. 10.1113/jphysiol.2004.082131 [DOI] [PMC free article] [PubMed] [Google Scholar]
- Chakrabarty K, Bhattacharyya S, Christopher R, Khanna S (2005) Glutamatergic dysfunction in OCD. Neuropsychopharmacology 30:1735–1740. 10.1038/sj.npp.1300733 [DOI] [PubMed] [Google Scholar]
- Charpak S, Gähwiler BH, Do KQ, Knöpfel T (1990) Potassium conductances in hippocampal neurons blocked by excitatory amino-acid transmitters. Nature 347:765–767. 10.1038/347765a0 [DOI] [PubMed] [Google Scholar]
- Chiu DN, Jahr CE (2017) Extracellular glutamate in the nucleus accumbens is nanomolar in both synaptic and non-synaptic compartments. Cell Rep 18:2576–2583. 10.1016/j.celrep.2017.02.047 [DOI] [PMC free article] [PubMed] [Google Scholar]
- Crépel V, Aniksztejn L, Ben-Ari Y, Hammond C (1994) Glutamate metabotropic receptors increase a Ca(2+)-activated nonspecific cationic current in CA1 hippocampal neurons. J Neurophysiol 72:1561–1569. [DOI] [PubMed] [Google Scholar]
- Danbolt NC. (2001) Glutamate uptake. Prog Neurobiol 65:1–105. 10.1016/S0301-0082(00)00067-8 [DOI] [PubMed] [Google Scholar]
- D'Antoni S, Spatuzza M, Bonaccorso CM, Musumeci SA, Ciranna L, Nicoletti F, Huber KM, Catania MV (2014) Dysregulation of group-I metabotropic glutamate (mGlu) receptor mediated signalling in disorders associated with intellectual disability and autism. Neurosci Biobehav Rev 46:228–241. 10.1016/j.neubiorev.2014.02.003 [DOI] [PMC free article] [PubMed] [Google Scholar]
- Dickel DE, Veenstra-VanderWeele J, Cox NJ, Wu X, Fischer DJ, Van Etten-Lee M, Himle JA, Leventhal BL, Cook EH Jr, Hanna GL (2006) Association testing of the positional and functional candidate gene SLC1A1/EAAC1 in early-onset obsessive-compulsive disorder. Arch Gen Psychiatry 63:778–785. 10.1001/archpsyc.63.7.778 [DOI] [PubMed] [Google Scholar]
- Dougherty DD, Rauch SL, Jenike MA (2004) Pharmacotherapy for obsessive-compulsive disorder. J Clin Psychol 60:1195–1202. 10.1002/jclp.20083 [DOI] [PubMed] [Google Scholar]
- Dumartin B, Caillé I, Gonon F, Bloch B (1998) Internalization of D1 dopamine receptor in striatal neurons in vivo as evidence of activation by dopamine agonists. J Neurosci 18:1650–1661. [DOI] [PMC free article] [PubMed] [Google Scholar]
- Fernandez E, Schiappa R, Girault JA, Le Novère N (2006) DARPP-32 is a robust integrator of dopamine and glutamate signals. PLoS Comput Biol 2:e176. 10.1371/journal.pcbi.0020176 [DOI] [PMC free article] [PubMed] [Google Scholar]
- Ferraguti F, Shigemoto R (2006) Metabotropic glutamate receptors. Cell Tissue Res 326:483–504. 10.1007/s00441-006-0266-5 [DOI] [PubMed] [Google Scholar]
- Feusner JD, Hembacher E, Phillips KA (2009) The mouse who couldn't stop washing: pathologic grooming in animals and humans. CNS Spectr 14:503–513. 10.1017/S1092852900023567 [DOI] [PMC free article] [PubMed] [Google Scholar]
- Forlano PM, Woolley CS (2010) Quantitative analysis of pre- and postsynaptic sex differences in the nucleus accumbens. J Comp Neurol 518:1330–1348. 10.1002/cne.22279 [DOI] [PMC free article] [PubMed] [Google Scholar]
- Furuta A, Rothstein JD, Martin LJ (1997) Glutamate transporter protein subtypes are expressed differentially during rat CNS development. J Neurosci 17:8363–8375. [DOI] [PMC free article] [PubMed] [Google Scholar]
- Gomez JL, Bonaventura J, Lesniak W, Mathews WB, Sysa-Shah P, Rodriguez LA, Ellis RJ, Richie CT, Harvey BK, Dannals RF, Pomper MG, Bonci A, Michaelides M (2017) Chemogenetics revealed: DREADD occupancy and activation via converted clozapine. Science 357:503–507. 10.1126/science.aan2475 [DOI] [PMC free article] [PubMed] [Google Scholar]
- Gong S, Zheng C, Doughty ML, Losos K, Didkovsky N, Schambra UB, Nowak NJ, Joyner A, Leblanc G, Hatten ME, Heintz N (2003) A gene expression atlas of the central nervous system based on bacterial artificial chromosomes. Nature 425:917–925. 10.1038/nature02033 [DOI] [PubMed] [Google Scholar]
- Gong S, Doughty M, Harbaugh CR, Cummins A, Hatten ME, Heintz N, Gerfen CR (2007) Targeting Cre recombinase to specific neuron populations with bacterial artificial chromosome constructs. J Neurosci 27:9817–9823. 10.1523/JNEUROSCI.2707-07.2007 [DOI] [PMC free article] [PubMed] [Google Scholar]
- Goubard V, Fino E, Venance L (2011) Contribution of astrocytic glutamate and GABA uptake to corticostriatal information processing. J Physiol 589:2301–2319. 10.1113/jphysiol.2010.203125 [DOI] [PMC free article] [PubMed] [Google Scholar]
- Gould TD, Manji HK (2005) DARPP-32: A molecular switch at the nexus of reward pathway plasticity. Proc Natl Acad Sci U S A 102:253–254. 10.1073/pnas.0408700102 [DOI] [PMC free article] [PubMed] [Google Scholar]
- Greengard P, Allen PB, Nairn AC (1999) Beyond the dopamine receptor: the DARPP-32/protein phosphatase-1 cascade. Neuron 23:435–447. 10.1016/S0896-6273(00)80798-9 [DOI] [PubMed] [Google Scholar]
- Gubellini P, Saulle E, Centonze D, Bonsi P, Pisani A, Bernardi G, Conquet F, Calabresi P (2001) Selective involvement of mGlu1 receptors in corticostriatal LTD. Neuropharmacology 40:839–846. 10.1016/S0028-3908(01)00021-1 [DOI] [PubMed] [Google Scholar]
- Hanna GL, Veenstra-VanderWeele J, Cox NJ, Boehnke M, Himle JA, Curtis GC, Leventhal BL, Cook EH Jr (2002) Genome-wide linkage analysis of families with obsessive-compulsive disorder ascertained through pediatric probands. Am J Med Genet 114:541–552. 10.1002/ajmg.10519 [DOI] [PubMed] [Google Scholar]
- Hattori T, McGeer PL (1973) Synaptogenesis in the corpus striatum of infant rat. Exp Neurol 38:70–79. 10.1016/0014-4886(73)90008-3 [DOI] [PubMed] [Google Scholar]
- Holmseth S, Dehnes Y, Huang YH, Follin-Arbelet VV, Grutle NJ, Mylonakou MN, Plachez C, Zhou Y, Furness DN, Bergles DE, Lehre KP, Danbolt NC (2012) The density of EAAC1 (EAAT3) glutamate transporters expressed by neurons in the mammalian CNS. J Neurosci 32:6000–6013. 10.1523/JNEUROSCI.5347-11.2012 [DOI] [PMC free article] [PubMed] [Google Scholar]
- Ikeda SR, Lovinger DM, McCool BA, Lewis DL (1995) Heterologous expression of metabotropic glutamate receptors in adult rat sympathetic neurons: subtype-specific coupling to ion channels. Neuron 14:1029–1038. 10.1016/0896-6273(95)90341-0 [DOI] [PubMed] [Google Scholar]
- Jabaudon D, Shimamoto K, Yasuda-Kamatani Y, Scanziani M, Gähwiler BH, Gerber U (1999) Inhibition of uptake unmasks rapid extracellular turnover of glutamate of nonvesicular origin. Proc Natl Acad Sci U S A 96:8733–8738. 10.1073/pnas.96.15.8733 [DOI] [PMC free article] [PubMed] [Google Scholar]
- Kalueff AV, Aldridge JW, LaPorte JL, Murphy DL, Tuohimaa P (2007) Analyzing grooming microstructure in neurobehavioral experiments. Nat Protoc 2:2538–2544. 10.1038/nprot.2007.367 [DOI] [PubMed] [Google Scholar]
- Kalueff AV, Stewart AM, Song C, Berridge KC, Graybiel AM, Fentress JC (2016) Neurobiology of rodent self-grooming and its value for translational neuroscience. Nat Rev Neurosci 17:45–59. 10.1038/nrn.2015.8 [DOI] [PMC free article] [PubMed] [Google Scholar]
- Kammermeier PJ, Xiao B, Tu JC, Worley PF, Ikeda SR (2000) Homer proteins regulate coupling of group I metabotropic glutamate receptors to N-type calcium and M-type potassium channels. J Neurosci 20:7238–7245. [DOI] [PMC free article] [PubMed] [Google Scholar]
- Kanai Y, Hediger MA (2004) The glutamate/neutral amino acid transporter family SLC1: molecular, physiological and pharmacological aspects. Pflugers Arch 447:469–479. 10.1007/s00424-003-1146-4 [DOI] [PubMed] [Google Scholar]
- Kessler RC, Berglund P, Demler O, Jin R, Merikangas KR, Walters EE (2005) Lifetime prevalence and age-of-onset distributions of DSM-IV disorders in the National Comorbidity Survey Replication. Arch Gen Psychiatry 62:593–602. 10.1001/archpsyc.62.6.593 [DOI] [PubMed] [Google Scholar]
- Klaus A, Plenz D (2016) A low-correlation resting state of the striatum during cortical avalanches and its role in movement suppression. PLoS Biol 14:e1002582. 10.1371/journal.pbio.1002582 [DOI] [PMC free article] [PubMed] [Google Scholar]
- Koran LM, Hanna GL, Hollander E, Nestadt G, Simpson HB; American Psychiatric Association (2007) Practice guideline for the treatment of patients with obsessive-compulsive disorder. Am J Psychiatry 164:5–53. [PubMed] [Google Scholar]
- Lehre KP, Danbolt NC (1998) The number of glutamate transporter subtype molecules at glutamatergic synapses: chemical and stereological quantification in young adult rat brain. J Neurosci 18:8751–8757. [DOI] [PMC free article] [PubMed] [Google Scholar]
- Le Meur K, Galante M, Angulo MC, Audinat E (2007) Tonic activation of NMDA receptors by ambient glutamate of non-synaptic origin in the rat hippocampus. J Physiol 580:373–383. 10.1113/jphysiol.2006.123570 [DOI] [PMC free article] [PubMed] [Google Scholar]
- Li L, Gervasi N, Girault JA (2015) Dendritic geometry shapes neuronal cAMP signalling to the nucleus. Nat Commun 6:6319. 10.1038/ncomms7319 [DOI] [PMC free article] [PubMed] [Google Scholar]
- Liu F, Ma XH, Ule J, Bibb JA, Nishi A, DeMaggio AJ, Yan Z, Nairn AC, Greengard P (2001) Regulation of cyclin-dependent kinase 5 and casein kinase 1 by metabotropic glutamate receptors. Proc Natl Acad Sci U S A 98:11062–11068. 10.1073/pnas.191353898 [DOI] [PMC free article] [PubMed] [Google Scholar]
- Liu F, Virshup DM, Nairn AC, Greengard P (2002) Mechanism of regulation of casein kinase I activity by group I metabotropic glutamate receptors. J Biol Chem 277:45393–45399. 10.1074/jbc.M204499200 [DOI] [PMC free article] [PubMed] [Google Scholar]
- Lohith TG, Osterweil EK, Fujita M, Jenko KJ, Bear MF, Innis RB (2013) Is metabotropic glutamate receptor 5 upregulated in prefrontal cortex in fragile X syndrome? Mol Autism 4:15. 10.1186/2040-2392-4-15 [DOI] [PMC free article] [PubMed] [Google Scholar]
- Lüthi A, Gähwiler BH, Gerber U (1997) 1S, 3R-ACPD induces a region of negative slope conductance in the steady-state current-voltage relationship of hippocampal pyramidal cells. J Neurophysiol 77:221–228. [DOI] [PubMed] [Google Scholar]
- Maccarrone M, Rossi S, Bari M, De Chiara V, Rapino C, Musella A, Bernardi G, Bagni C, Centonze D (2010) Abnormal mGlu 5 receptor/endocannabinoid coupling in mice lacking FMRP and BC1 RNA. Neuropsychopharmacology 35:1500–1509. 10.1038/npp.2010.19 [DOI] [PMC free article] [PubMed] [Google Scholar]
- Madisen L, Zwingman TA, Sunkin SM, Oh SW, Zariwala HA, Gu H, Ng LL, Palmiter RD, Hawrylycz MJ, Jones AR, Lein ES, Zeng H (2010) A robust and high-throughput Cre reporting and characterization system for the whole mouse brain. Nat Neurosci 13:133–140. 10.1038/nn.2467 [DOI] [PMC free article] [PubMed] [Google Scholar]
- Marcaggi P, Mutoh H, Dimitrov D, Beato M, Knöpfel T (2009) Optical measurement of mGluR1 conformational changes reveals fast activation, slow deactivation, and sensitization. Proc Natl Acad Sci U S A 106:11388–11393. 10.1073/pnas.0901290106 [DOI] [PMC free article] [PubMed] [Google Scholar]
- Misgeld U, Okada Y, Hassler R (1979) Locally evoked potentials in slices of rat neostriatum: a tool for the investigation of intrinsic excitatory processes. Exp Brain Res 34:575–590. [DOI] [PubMed] [Google Scholar]
- Nishi A, Watanabe Y, Higashi H, Tanaka M, Nairn AC, Greengard P (2005) Glutamate regulation of DARPP-32 phosphorylation in neostriatal neurons involves activation of multiple signaling cascades. Proc Natl Acad Sci U S A 102:1199–1204. 10.1073/pnas.0409138102 [DOI] [PMC free article] [PubMed] [Google Scholar]
- O'Donnell C, Goncalves JT, Portera-Cailliau C, Sejnowski TJ (2017) Beyond excitation/inhibition imbalance in multidimensional models of neural circuit changes in brain disorders. Elife 6. pii: e26724. 10.7554/eLife.26724 [DOI] [PMC free article] [PubMed] [Google Scholar]
- Ouimet CC, Miller PE, Hemmings HC Jr, Walaas SI, Greengard P (1984) DARPP-32, a dopamine- and adenosine 3′:5′-monophosphate-regulated phosphoprotein enriched in dopamine-innervated brain regions. III. Immunocytochemical localization. J Neurosci 4:111–124. [DOI] [PMC free article] [PubMed] [Google Scholar]
- Paquet M, Smith Y (2003) Group I metabotropic glutamate receptors in the monkey striatum: subsynaptic association with glutamatergic and dopaminergic afferents. J Neurosci 23:7659–7669. [DOI] [PMC free article] [PubMed] [Google Scholar]
- Partridge JG, Tang KC, Lovinger DM (2000) Regional and postnatal heterogeneity of activity-dependent long-term changes in synaptic efficacy in the dorsal striatum. J Neurophysiol 84:1422–1429. [DOI] [PubMed] [Google Scholar]
- Peghini P, Janzen J, Stoffel W (1997) Glutamate transporter EAAC-1-deficient mice develop dicarboxylic aminoaciduria and behavioral abnormalities but no neurodegeneration. EMBO J 16:3822–3832. 10.1093/emboj/16.13.3822 [DOI] [PMC free article] [PubMed] [Google Scholar]
- Piras F, Piras F, Chiapponi C, Girardi P, Caltagirone C, Spalletta G (2015) Widespread structural brain changes in OCD: a systematic review of voxel-based morphometry studies. Cortex 62:89–108. 10.1016/j.cortex.2013.01.016 [DOI] [PubMed] [Google Scholar]
- Porton B, Greenberg BD, Askland K, Serra LM, Gesmonde J, Rudnick G, Rasmussen SA, Kao HT (2013) Isoforms of the neuronal glutamate transporter gene, SLC1A1/EAAC1, negatively modulate glutamate uptake: relevance to obsessive-compulsive disorder. Transl Psychiatry 3:e259. 10.1038/tp.2013.35 [DOI] [PMC free article] [PubMed] [Google Scholar]
- Rădulescu A, Herron J, Kennedy C, Scimemi A (2017) Global and local excitation and inhibition shape the dynamics of the cortico-striatal-thalamo-cortical pathway. Sci Rep 7:7608. 10.1038/s41598-017-07527-8 [DOI] [PMC free article] [PubMed] [Google Scholar]
- Raper J, Morrison RD, Daniels JS, Howell L, Bachevalier J, Wichmann T, Galvan A (2017) Metabolism and distribution of clozapine-N-oxide: implications for nonhuman primate chemogenetics. ACS Chem Neurosci 8:1570–1576. 10.1021/acschemneuro.7b00079 [DOI] [PMC free article] [PubMed] [Google Scholar]
- Rassu M, Del Giudice MG, Sanna S, Taymans JM, Morari M, Brugnoli A, Frassineti M, Masala A, Esposito S, Galioto M, Valle C, Carri MT, Biosa A, Greggio E, Crosio C, Iaccarino C (2017) Role of LRRK2 in the regulation of dopamine receptor trafficking. PLoS One 12:e0179082. 10.1371/journal.pone.0179082 [DOI] [PMC free article] [PubMed] [Google Scholar]
- Reeves SL, Fleming KE, Zhang L, Scimemi A (2016) M-Track: a new software for automated detection of grooming trajectories in mice. PLoS Comput Biol 12:e1005115. 10.1371/journal.pcbi.1005115 [DOI] [PMC free article] [PubMed] [Google Scholar]
- Rogers DC, Fisher EM, Brown SD, Peters J, Hunter AJ, Martin JE (1997) Behavioral and functional analysis of mouse phenotype: SHIRPA, a proposed protocol for comprehensive phenotype assessment. Mamm Genome 8:711–713. 10.1007/s003359900551 [DOI] [PubMed] [Google Scholar]
- Rogers DC, Jones DN, Nelson PR, Jones CM, Quilter CA, Robinson TL, Hagan JJ (1999) Use of SHIRPA and discriminant analysis to characterise marked differences in the behavioural phenotype of six inbred mouse strains. Behav Brain Res 105:207–217. 10.1016/S0166-4328(99)00072-8 [DOI] [PubMed] [Google Scholar]
- Samuels J, Wang Y, Riddle MA, Greenberg BD, Fyer AJ, McCracken JT, Rauch SL, Murphy DL, Grados MA, Knowles JA, Piacentini J, Cullen B, Bienvenu OJ 3rd, Rasmussen SA, Geller D, Pauls DL, Liang KY, Shugart YY, Nestadt G (2011) Comprehensive family-based association study of the glutamate transporter gene SLC1A1 in obsessive-compulsive disorder. Am J Med Genet B Neuropsychiatr Genet 156B:472–477. 10.1002/ajmg.b.31184 [DOI] [PMC free article] [PubMed] [Google Scholar]
- Schmittgen TD, Livak KJ (2008) Analyzing real-time PCR data by the comparative C(T) method. Nat Protoc 3:1101–1108. 10.1038/nprot.2008.73 [DOI] [PubMed] [Google Scholar]
- Scimemi A, Tian H, Diamond JS (2009) Neuronal transporters regulate glutamate clearance, NMDA receptor activation, and synaptic plasticity in the hippocampus. J Neurosci 29:14581–14595. 10.1523/JNEUROSCI.4845-09.2009 [DOI] [PMC free article] [PubMed] [Google Scholar]
- Sharpe NA, Tepper JM (1998) Postnatal development of excitatory synaptic input to the rat neostriatum: an electron microscopic study. Neuroscience 84:1163–1175. 10.1016/S0306-4522(97)00583-6 [DOI] [PubMed] [Google Scholar]
- Shigemoto R, Nakanishi S, Mizuno N (1992) Distribution of the mRNA for a metabotropic glutamate receptor (mGluR1) in the central nervous system: an in situ hybridization study in adult and developing rat. J Comp Neurol 322:121–135. 10.1002/cne.903220110 [DOI] [PubMed] [Google Scholar]
- Shigemoto R, Nomura S, Ohishi H, Sugihara H, Nakanishi S, Mizuno N (1993) Immunohistochemical localization of a metabotropic glutamate receptor, mGluR5, in the rat brain. Neurosci Lett 163:53–57. 10.1016/0304-3940(93)90227-C [DOI] [PubMed] [Google Scholar]
- Shugart YY, Wang Y, Samuels JF, Grados MA, Greenberg BD, Knowles JA, McCracken JT, Rauch SL, Murphy DL, Rasmussen SA, Cullen B, Hoehn-Saric R, Pinto A, Fyer AJ, Piacentini J, Pauls DL, Bienvenu OJ, Riddle MA, Liang KY, Nestadt G (2009) A family-based association study of the glutamate transporter gene SLC1A1 in obsessive-compulsive disorder in 378 families. Am J Med Genet B Neuropsychiatr Genet 150B:886–892. 10.1002/ajmg.b.30914 [DOI] [PubMed] [Google Scholar]
- Spencer JP, Murphy KP (2000) Bi-directional changes in synaptic plasticity induced at corticostriatal synapses in vitro. Exp Brain Res 135:497–503. 10.1007/s002210000523 [DOI] [PubMed] [Google Scholar]
- Stamford JA. (1989) Development and ageing of the rat nigrostriatal dopamine system studied with fast cyclic voltammetry. J Neurochem 52:1582–1589. 10.1111/j.1471-4159.1989.tb09212.x [DOI] [PubMed] [Google Scholar]
- Stewart SE, Fagerness JA, Platko J, Smoller JW, Scharf JM, Illmann C, Jenike E, Chabane N, Leboyer M, Delorme R, Jenike MA, Pauls DL (2007) Association of the SLC1A1 glutamate transporter gene and obsessive-compulsive disorder. Am J Med Genet B Neuropsychiatr Genet 144B:1027–1033. 10.1002/ajmg.b.30533 [DOI] [PubMed] [Google Scholar]
- Sun W, Shchepakin D, Kalachev LV, Kavanaugh MP (2014) Glutamate transporter control of ambient glutamate levels. Neurochem Int 73:146–151. 10.1016/j.neuint.2014.04.007 [DOI] [PubMed] [Google Scholar]
- Sung KW, Choi S, Lovinger DM (2001) Activation of group I mGluRs is necessary for induction of long-term depression at striatal synapses. J Neurophysiol 86:2405–2412. [DOI] [PubMed] [Google Scholar]
- Svenningsson P, Nishi A, Fisone G, Girault JA, Nairn AC, Greengard P (2004) DARPP-32: an integrator of neurotransmission. Annu Rev Pharmacol Toxicol 44:269–296. 10.1146/annurev.pharmtox.44.101802.121415 [DOI] [PubMed] [Google Scholar]
- Tallaksen-Greene SJ, Kaatz KW, Romano C, Albin RL (1998) Localization of mGluR1a-like immunoreactivity and mGluR5-like immunoreactivity in identified populations of striatal neurons. Brain Res 780:210–217. 10.1016/S0006-8993(97)01141-4 [DOI] [PubMed] [Google Scholar]
- Teicher MH, Andersen SL, Hostetter JC Jr (1995) Evidence for dopamine receptor pruning between adolescence and adulthood in striatum but not nucleus accumbens. Brain Res Dev Brain Res 89:167–172. 10.1016/0165-3806(95)00109-Q [DOI] [PubMed] [Google Scholar]
- Testa CM, Friberg IK, Weiss SW, Standaert DG (1998) Immunohistochemical localization of metabotropic glutamate receptors mGluR1a and mGluR2/3 in the rat basal ganglia. J Comp Neurol 390:5–19. [DOI] [PubMed] [Google Scholar]
- Ting JT, Feng G (2011) Neurobiology of obsessive-compulsive disorder: insights into neural circuitry dysfunction through mouse genetics. Curr Opin Neurobiol 21:842–848. 10.1016/j.conb.2011.04.010 [DOI] [PMC free article] [PubMed] [Google Scholar]
- Wadiche JI, Amara SG, Kavanaugh MP (1995) Ion fluxes associated with excitatory amino acid transport. Neuron 15:721–728. 10.1016/0896-6273(95)90159-0 [DOI] [PubMed] [Google Scholar]
- Wan Y, Feng G, Calakos N (2011) Sapap3 deletion causes mGluR5-dependent silencing of AMPAR synapses. J Neurosci 31:16685–16691. 10.1523/JNEUROSCI.2533-11.2011 [DOI] [PMC free article] [PubMed] [Google Scholar]
- Welch JM, Lu J, Rodriguiz RM, Trotta NC, Peca J, Ding JD, Feliciano C, Chen M, Adams JP, Luo J, Dudek SM, Weinberg RJ, Calakos N, Wetsel WC, Feng G (2007) Cortico-striatal synaptic defects and OCD-like behaviours in Sapap3-mutant mice. Nature 448:894–900. 10.1038/nature06104 [DOI] [PMC free article] [PubMed] [Google Scholar]
- Wendland JR, Moya PR, Timpano KR, Anavitarte AP, Kruse MR, Wheaton MG, Ren-Patterson RF, Murphy DL (2009) A haplotype containing quantitative trait loci for SLC1A1 gene expression and its association with obsessive-compulsive disorder. Arch Gen Psychiatry 66:408–416. 10.1001/archgenpsychiatry.2009.6 [DOI] [PMC free article] [PubMed] [Google Scholar]
- Womble MD, Moises HC (1994) Metabotropic glutamate-receptor agonist Acpd inhibits some, but not all, muscarinic-sensitive K+ conductances in basolateral amygdaloid neurons. Synapse 17:69–75. 10.1002/syn.890170202 [DOI] [PubMed] [Google Scholar]
- Yin HH, Ostlund SB, Knowlton BJ, Balleine BW (2005) The role of the dorsomedial striatum in instrumental conditioning. Eur J Neurosci 22:513–523. 10.1111/j.1460-9568.2005.04218.x [DOI] [PubMed] [Google Scholar]
- Yin HH, Knowlton BJ, Balleine BW (2006) Inactivation of dorsolateral striatum enhances sensitivity to changes in the action-outcome contingency in instrumental conditioning. Behav Brain Res 166:189–196. 10.1016/j.bbr.2005.07.012 [DOI] [PubMed] [Google Scholar]
- Zerangue N, Kavanaugh MP (1996) Flux coupling in a neuronal glutamate transporter. Nature 383:634–637. 10.1038/383634a0 [DOI] [PubMed] [Google Scholar]
- Zike ID, Chohan MO, Kopelman JM, Krasnow EN, Flicker D, Nautiyal KM, Bubser M, Kellendonk C, Jones CK, Stanwood G, Tanaka KF, Moore H, Ahmari SE, Veenstra-VanderWeele J (2017) OCD candidate gene SLC1A1/EAAT3 impacts basal ganglia-mediated activity and stereotypic behavior. Proc Natl Acad Sci U S A 114:5719–5724. 10.1073/pnas.1701736114 [DOI] [PMC free article] [PubMed] [Google Scholar]
Associated Data
This section collects any data citations, data availability statements, or supplementary materials included in this article.
Supplementary Materials
A battery of SHIRPA tests reveals subtle abnormalities in male and female EAAC1-/- mice. This dataset includes the parameter scores for a battery of SHIRPA primary screen test in female and male WT and EAAC1-/- mice aged P14-35. Download Figure 1-1, XLSX file (17.3KB, xlsx)
Female EAAC1-/- mice show increased anxiety-like behaviors. Summary of spontaneous locomotor activity in a free-spinning flying saucer, open field test, elevated plus maze and marble burying test in female and male WT and EAAC1-/- mice. Download Figure 1-1, XLSX file (17.3KB, xlsx)