Abstract
Morphological changes in the outer retina such as drusen are established biomarkers to diagnose age-related macular degeneration. However, earlier diagnosis might be possible by taking advantage of more subtle changes that accompany tissues that bear polarization-altering properties. To test this hypothesis, we developed a method based on polarizationsensitive optical coherence tomography with which volumetric data sets of the macula were obtained from 10 young (<25 years) and 10 older (>54 years) subjects. All young subjects and 5 of the older subjects had retardance values induced by the retinal pigment epithelium and Bruch’s membrane (RPE-BM) complex that were just above the noise floor measurement (5°−13° at 840 nm). In contrast, elevated retardance, up to 180°, was observed in the other 5 older subjects. Analysis of the degree of polarization uniformity (DOPU) demonstrates that reduced DOPU (<0.4) in the RPE is associated with elevated double pass phase retardation (DPPR) below the RPE-BM complex, suggesting that the observed elevated DPPR in older subjects is the result of increased scattering or polarization scrambling. Collectively, our measurements show that the outer retina can undergo dramatic change in its polarization properties with age, and in some cases still retain its clinically normal appearance.
Keywords: age-related macular degeneration, aging, optical coherence tomography, polarization-sensitive optical coherence tomography, retinal imaging
Graphical Abstract
1 |. INTRODUCTION
Morphological changes in the retina such as drusen are established biomarkers to diagnose age-related macular degeneration (AMD), the leading cause of irreversible visual loss in the developed world. As each retinal pigment epithelium (RPE) cell can be in contact with multiple rod and cone photoreceptors, one RPE cell engulfs millions of photoreceptor outer-segment disks over a lifetime [1, 2]. These disks are phagocytozed and processed with enzymes so that waste material can be recycled through Bruch’s membrane (BM) into the choriocapillaris [2, 3]. Using electron microscopy, vesicular and tube-like structures (remnants of the disks) were not found in BM of a 2-year-old, but the number of these structures in BM increased with age [4]. Disks are not always fully digested, leading to an accumulation of partially digested debris in RPE and BM, which is one potential factor in the onset of AMD. The RPE-BM complex also is altered by the response to inflammation, which is one of the important factors in the development of AMD [5].
There are several hints that it should be possible to assess debris accumulation in the RPE-BM complex with polarization-sensitive imaging techniques. Measurements performed with scanning laser polarimetry have identified changes to the cone axons in aging and AMD, and structural changes to the RPE-BM in AMD [6–9]. While en face polarization imaging techniques using scanning laser [6–10] and flood illumination [11] provide quantitative metrics based on polarization retaining or scrambling properties of retinal and subretinal tissues, the axial resolution is insufficient to isolate specific layers of cells.
In contrast, polarization-sensitive optical coherence tomography (PS-OCT) is a noninvasive, depth-sensitive imaging modality that measures polarization properties in vivo, most notably in the living human retina [12]. The technology has been used to measure the birefringence of the retinal nerve fiber layer (RNFL) [12–21], scattering and degree of polarization uniformity (DOPU) of the RPE [22–28], phase retardation and fast axis orientation of theHenle fiber layer (HFL) [29–31], and imaging of fibrosis in neovascular AMD [32]. Relevant to the RPE-BM complex, PS-OCT based on a circularly polarized input state showed an increase in retardance below the RPE-BM complex coupled with a decrease in DOPU in the RPE of a healthy subject of unspecified age [24]. Similar observations using the same PS-OCT method were reported in a second healthy subject, but not confirmed in 2 albino subjects, suggesting melanin present in the RPE (absent in albinos) might be a common source of both polarization effects [26].
Given this possible relation between DOPU and retardance generated in the RPE-BM complex, we aimed to test this hypothesis and extend it to include the influence of aging and disease, specifically drusen in early AMD. To do so, we used PS-OCT, based on 2 input states orthogonal in a Poincaré sphere representation [33], to measure polarization changes induced solely by the RPE-BM complex. Changes were measured relative to the polarization state at the inner-segment and outer-segment junction (IS/OS) of the photoreceptor layer, a strong reflection band that lies immediately anterior to the RPE. Thus use of IS/OS as a reference isolated the polarization properties of the RPEBM complex from retinal sources, most notably the HFL and RNFL. This approach allowed us to measure and compare retardance and DOPU generated by the RPE-BM complex and to apply it in 2 age groups: 10 younger subjects (age < 25 years) and 10 older subjects (age > 54 years). Two of the older subjects had early AMD and one an epiretinal membrane.
2 |. METHOD
Earlier versions of the PS-OCT system used in this study can be found elsewhere [29, 34]. In short, a single-mode-fiber-based PS-OCT system with a spectrometer built around a single line scan camera and a Wollaston prism was used to create images with an axial resolution of 6 μm in retinal tissue [34]. The acquisition rate of this system was22.7 kHz, and the retina was probed with 2 states that are orthogonal in a Poincaré sphere representation. The power sent into the eye was 600 μW, which is safe according toANSI light exposure limits for near-infrared light at 840 nm [35]. Measurements were performed in 4.4 seconds over an area of 15°by 15°, centered at the fovea, in 100 horizontal B-scans of each 1000 A-scans.
This system was previously used to quantify the retardance induced by the Henle fiber layer [29]. In that study, a reference for retardance calculations was set above the HFL, but below the nerve fiber layer, to avoid the inclusion of RNFL birefringence in double pass phase retardation (DPPR) measurements. A comparison of Stokes vectors as a function of depth quantified the DPPR accumulation induced by the HFL, and its relative fast axis orientation in a Poincaré sphere representation [33, 36]. Total accumulation in retardance was realized by comparing Stokes vectors at the reference to that at the IS/OS of the photoreceptors (IS/OS), which lies below the HFL. An error propagation analysis showed that use of the bright IS/OS reflection as a measurement point gave the most reliable results [29], as tissues with higher reflectivity provide more accurate phase measurements and DPPR estimates owing to the smaller phase error [37].
Here, we applied a similar approach, but used a different combination of segmented layers for retardation calculation. The IS/OS reflection was used as the reference and the posterior side of the RPE-BM complex as the second measurement. First, the spectra were mapped to k-space and dispersion compensated. The real and imaginary parts of the horizontally and vertically polarized spectra were converted to Stokes vectors, with each pixel having a value for I, Q, U and V. Then, each individual Stokes component was spatially averaged with a kernel that measured 5 by 7 pixels (corresponding to 22.5 and 63 μm in depth and width, respectively), meaning that for instance the Q value of a certain pixel was determined by averaging its value with the34 Q values of surrounding pixels. The lateral resolution was estimated at approximately 25 μm. The width of the 63 μm averaging kernel was, therefore, slightly larger than 2 times the system point-spread function. By averaging over 5 pixels (~22.5 μm) in depth, data from BM was only marginally averaged with data from the choriocapillaris, assuming a RPE-to-choriocapillaris depth separation of 17.5 μm as measured in vivo [38]. On the other hand, a reduction of the number of pixels in the averaging led to a noisier and less reliable result. Empirically, we found that a 5 by 7 pixel kernel was a compromise between the reduction of noise and the inclusion of tissues with different polarization properties.
Using image segmentation developed in Matlab, which was integrated into the analysis software, the IS/OS was segmented and then used as the reference for PS-OCT calculations. The posterior side of the RPE-BM complex was found empirically to lie on average 66 μm below (posterior to) the IS/OS for all subjects involved in this study. Although this depth did not always provide the best match to the RPE-BM complex, the difference between the segmented line and the actual bottom of the RPE-BM complex was for most of the tissue well within the averaging kernel that was used for Stokes-vector averaging. In case of drusen, this distance was sometimes larger. The 66-μm offset was used to capture the cumulated DPPR induced by the outer tips of the photoreceptors (which are not known to alter polarization), the RPE and BM. The DPPR accumulated by these layers was recorded and displayed as en face images, color-coded over 180 °.
In a previous study, the Stokes vectors of all pixels at the reference were spatially averaged to reduce the influence of noise in the DPPR calculation [29]. As the light beam of the PS-OCT instrument pivots through the center of the pupil [13], the variation in birefringence that is contributed by the cornea during a B-scan is minimal. The retardance induced by the thin RNFL in the fovea is fairly low [28], and spatial averaging of all pixels at the reference will, therefore, not induce artifacts. With a reference measurement at the IS/OS below the birefringent HFL, however, Stokes vector averaging over the width of the image could locally induce significant retardance differences, which caused us to avoid such averaging. Instead, a local averaging approach with the same kernel size as explained previously was adopted. Furthermore, to improve understanding of the origin of the measured signal, an error propagation analysis was performed on the DPPR data recorded immediately below the RPE-BM interface [29]. Finally, a DOPU analysis was performed on the PS-OCT measurements [16, 23, 24, 26–28] and compared to DPPR in the same eyes.
Subjects were recruited from the staff and student population at the School of Optometry of Indiana University. The measurement protocol was approved by the Institutional Review Board of Indiana University, and all measurements adhered to the tenets of the declaration of Helsinki. Subjects provided informed consent prior to the imaging session. Measurements were obtained over a 4-year period; 2 subjects were imaged at 2 different points in time to track the potential development of subretinal deposits. Eyes were not dilated, and subjects used a chin- and fore-head rest and a fixation target to minimize motion artifacts. For this study, the data sets of 10 subjects aged 25 years and younger and 10 subjects aged 54 years and older were selected for analysis. In 18 of the 20 subjects, the right eye (OD) was imaged with the fast axis of the raster scan in the horizontal direction. The left eyes (OS) of Subjects 16 and 17 were imaged; subject 17 with a fast axis scan in the vertical direction. This scan orientation, while different from the other subjects, had no influence on the study results. The 10 young subjects were ranked by age and numbered 1 to 10, with Subject 10 being the oldest subject in this group. Similarly, the 10 older subjects were ranked and numbered 11 to 20.
Although subjects self-reported that they had a medical history free of retinal disease, the masked intensity OCT images of all eyes were graded by an optometrist and ophthalmologist who are highly experienced in OCT grading (BK, TT, respectively). The outcome of the grading was as follows. Subject 13 had soft drusen, up to approximately 150 μm in diameter, which is common in this age group, and was diagnosed as early AMD. Subject 14 was identified with reticular pseudodrusen and deposits within BM, also diagnosed as early AMD. Subject 16 had an epiretinal membrane. All young eyes and 7 of the 10 older eyes were graded as normal.
3 |. RESULTS
3.1 |. Young subjects
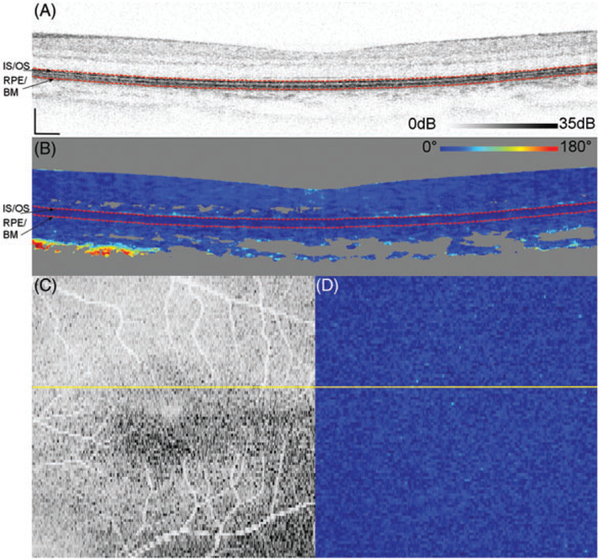
Figure 1 shows representative measurements on Subject 10, a 25-year-old, acquired over 15 ° by 15° and centered at the fovea. DPPR pixels at the IS/OS reference in Figure 1B, the upper red dashed line, have a value of 0°. The en face intensity scan (Figure 1C) shows the location of the B-scan, marked with a yellow horizontal line, and its DPPR counterpart (Figure 1D) shows the en face DPPR image, recorded at the lower red dashed line directly below the RPE-BM complex (Figure 1B). Measurements at this location should indicate whether the RPE-BM complex induces retardance. Few data points with elevated DPPR can be seen in the DPPR B-scan (Figure 1B). On average, the accumulated DPPR in the en face image is 15° [notdef] 7°, with a maximumvalue of 67°.
FIGURE 1.
(A) Logarithmic intensity B-scan of the right eye of Subject 10, a 25-year-old. Scale bars in the lower left corner are 200 μm long. Panel (B) shows the cumulative DPPR encoded over 180°, and pixels near the noise floor were colored gray. A reference measurement was positioned at the segmented IS/OS (upper dashed red line). The DPPR induced between the IS/OS reference and the bottom of the RPE-BM complex (lower dashed red line) was measured. Panel (C) shows an intensity en face scan, which was obtained by averaging pixel values within an A-scan, covering all layers of the retina. An en face DPPR measurement (D) using the same color scale as in panel (B) was obtained by recording the lower red dashed line of (B) in each B-scan. Segmentation for this data set was performed with an earlier developed algorithm [29]. The accumulated DPPR at the basal side of the RPE-BM complex was on average 15° ± 7°. In the lower left corner of panel (B), a sharp increase in DPPR with depth is apparent and believed to originate from form birefringence in the collagen that is present in the sclera
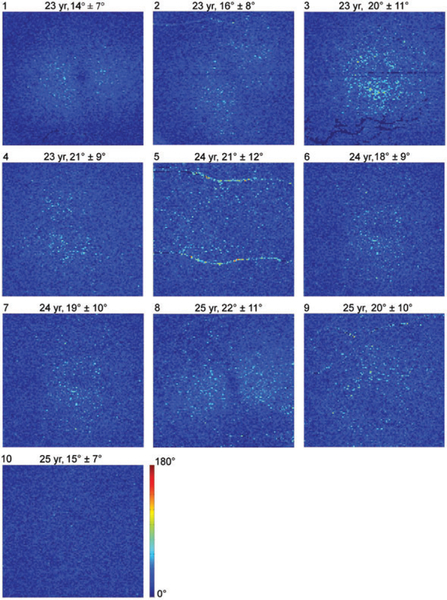
Figure 2 shows en face DPPR images of all 10 young subjects, displayed over a range from 0° to 180°. Averaged over the young subjects, a mean DPPR of 19°+10° is found. All young subjects have similar DPPR values, wellbelow 90°.
FIGURE 2.
DPPR results in the 10 younger subjects. En face images color-code DPPR measured below the RPE-BM complex. Subject identification is in the upper-left corner of each panel, followed by subject age, and DPPR mean and SD. Subjects 5 and 9 contain DPPR artifacts due to retinal blood vessels. DPPR is color-coded over 180° to facilitate comparison with data obtained from older subjects (Figure 7)
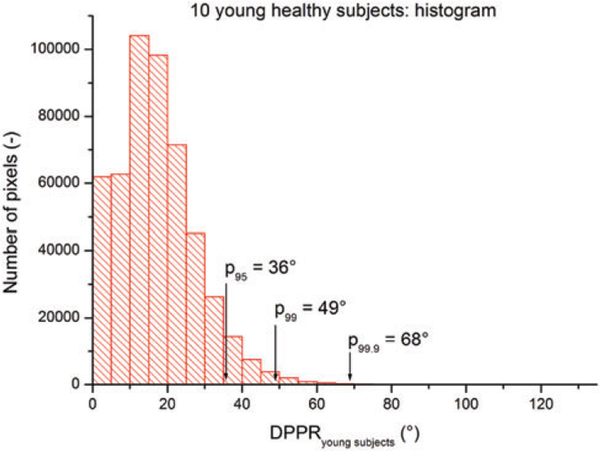
Using the data of the 10 young subjects, a distribution of the DPPR was generated (Figure 3). The DPPR is 49° atthe 99th percentile, that is, 99% of all image pixels have a DPPR below 49°. In the data of the older subjects, which will be discussed in the following section, this cut-off will be used to identify DPPR points that are suspect, as they only occurred in less than 1% of the young population measurements.
FIGURE 3.
Histogram of the DPPR collected from the 10 young healthy subjects. The mean DPPR is 19° ± 10°. The cut-off at the 95th, 99th and 99.9th percentile are at a DPPR of 36°, 49° and 68°, respectively
3.2 |. Older subjects
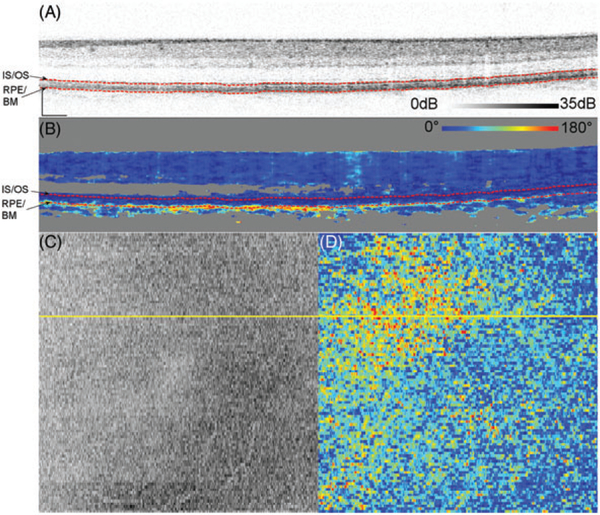
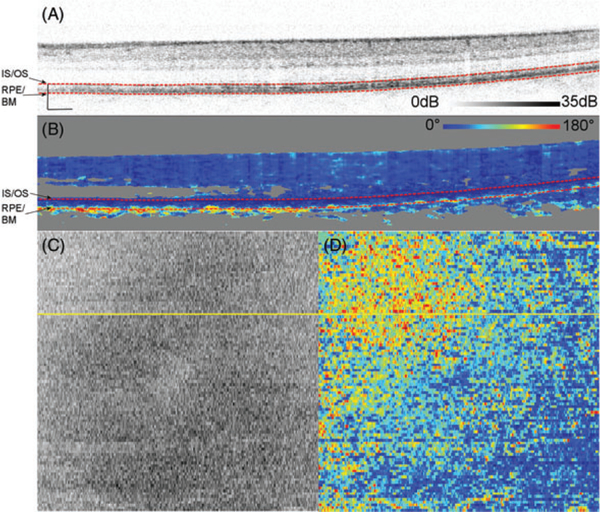
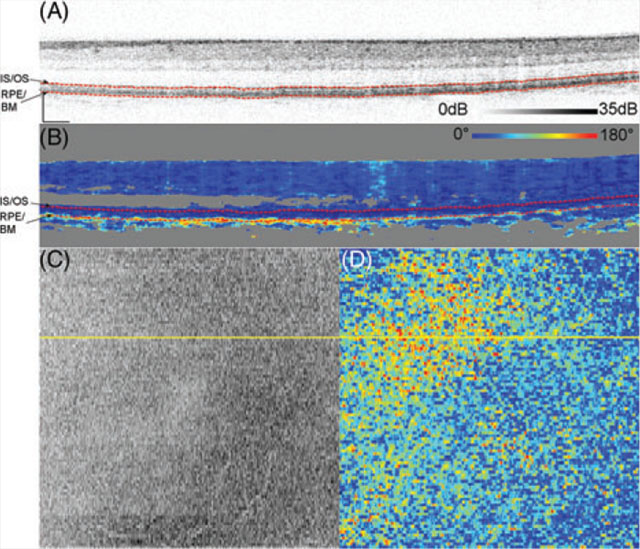
Figure 4A shows a representative logarithmic intensity B-scan of Subject 14, a 59-year-old who was diagnosed with reticular pseudodrusen and deposits in BM. Unlike the younger subjects, some of the pixels immediately below the RPE-BM complex in the cross sectional DPPR image show a shift to warmer colors. This effect is quite varied across pixels with some retaining dark blue (0 °), indicating little to no cumulative DPPR, while others shifting all the way to red (180 °), indicating large cumulative DPPR.
FIGURE 4.
Logarithmic intensity B-scan of the right eye of Subject 14, a 59-year-old (A). Scale bars in the lower left corner are 200 μm long. Panel (B) shows the cumulative DPPR encoded over 180°, and pixels that are near the noise floor are colored gray. A reference measurement was positioned at the segmented IS/OS (upper dashed red line). The DPPR induced between the IS/OS reference and the bottom of the RPE-BM complex (lower dashed red line) was measured. On the bottom left, an intensity C-scan (C) and bottom right an en face DPPR measurement (D) are shown. Segmentation for this data set was performed with a previously developed algorithm [29]
Interestingly, this increase in DPPR accumulation is often followed by a decrease (return to dark blue [~0 ° or light blue) deeper in the tissue (see Figure 4B). Cumulative DPPR that is the result of tissue birefringence can only increase with depth [12, 13, 16, 17], and therefore, this decrease that is observed cannot be the result of birefringence. While we do not know the source of this decrease, the observed fluctuation (rise and fall) of DPPR occurs, strikingly, over a narrow depth range, as shown in Figure 4B; is consistently localized near BM and appears to match that reported previously in three other subjects [24, 26, 28]. The magnitude of the DPPR increase accumulates over a depth of only a few microns in the RPE-BM complex and is much larger than what we have measured previously for birefringent tissue in the RNFL and the HFL [12–14, 29, 34].
To test repeatability, a second set was obtained several minutes later from the same subject following the same measurement and analysis protocol (Figure 5). The results are comparable to those in Figure 4, with both exhibiting elevated accumulated DPPR in the upper-left quadrant of the image. The DPPR observed in Figures 4D and 5D are 70°+30 ° and 68±34° (mean ± SD), respectively, with mean difference of 3%.
FIGURE 5.
A second data set obtained from Subject 14 several minutes after the set shown in Figure 4. See the caption of Figure 4 for a description of the 4 panels. While the second data set had more motion artifacts as evident in (C, D), the distribution of DPPR values (D) was similar
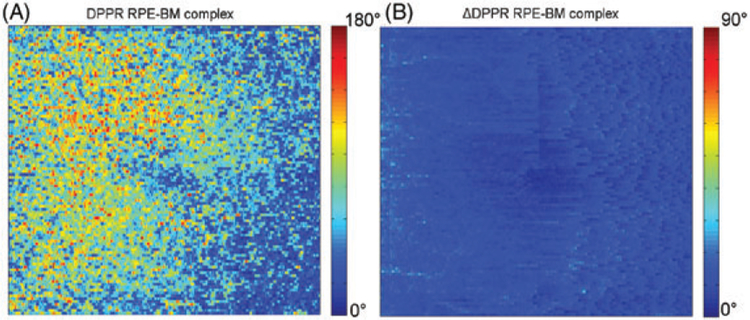
Pixels with a relatively low-intensity induce more phase noise, which can cause unreliable DPPR estimates [37]. Since DPPR measurements were recorded directly below the RPE-BM complex, the relatively low reflectance there could have contributed to the high-DPPR values owing to increased phase noise. To address this concern, an error propagation analysis was applied to determine the SD in DPPR due to noise (Figure 6B) [29]. The result of this analysis was compared with the original DPPR data (Figure 6A). The mean ΔDPPR in Figure 6B is equal to 13° ± 4 °, well below the signal that is observed in Figure 6A, which can reach values up to 180°, thus indicating phase noise is an unlikely contributor of the accumulated DPPR we observed.
FIGURE 6.
DPPR accumulation between the IS/OS and basal side of the RPE-BM complex in Subject 14 (A), and predicted ΔDPPR due to phase noise based on intensity (B). Note that the ΔDPPR image is color-coded over a smaller range to better visualize the low noise in the image. Comparing the 2, we conclude the DPPR accumulation cannot be attributed to noise, as it is considerably larger in magnitude than the predicted noise level in the image, that is, ΔDPPR
A similar phase-noise analysis was performed for the younger Subject 10 (Figure 1), whose data had a higher signal-to-noise ratio and resulted in a ΔDPPR of 5° + 2°. The older subject had relatively weak tissue reflection (Figure 4A, left side of the image) and the ΔDPPR shown in Figure 6B is likely to be representative for the ΔDPPR observed in older subjects.
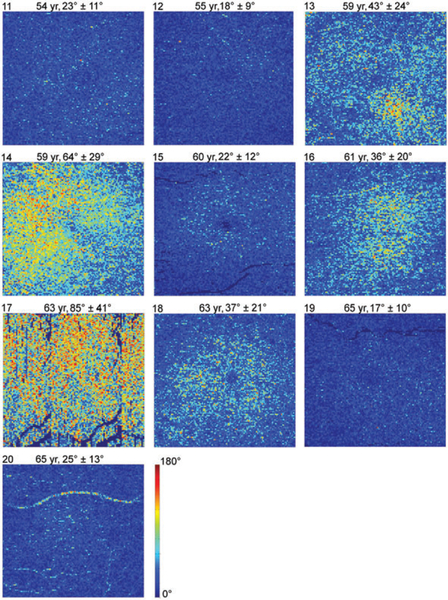
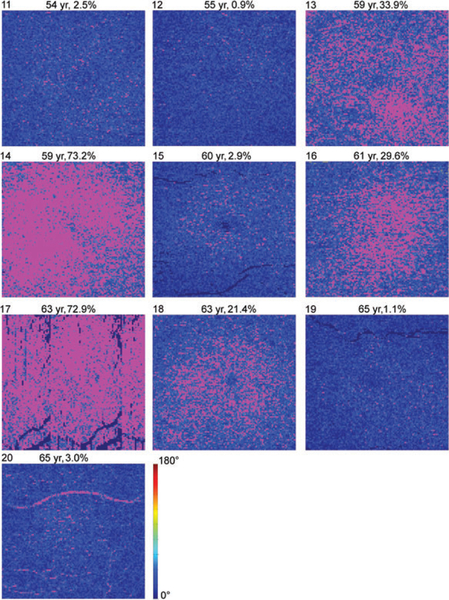
Figure 7 shows en face DPPR images of all 10 older subjects, displayed on a 0° to 180° range. Using the 99th percentile DPPR value (49°) for young eyes in Figure 3, a threshold was applied to the images of Figure 7 to identify data points that only occurred in 1% of the young healthy subjects. These points are set to magenta in Figure 8. In 5 out of 10 older subjects, the percentage of data points that are magenta is below 3%, indicating DPPR distributions that are similar to the distribution found in young retinas. In the other 5 older subjects, more than 20% of the data points have DPPR that is higher than the 99th percentile cut-off of the young subjects.
FIGURE 7.
DPPR results in the 10 older subjects. En face images color-code DPPR measured below the RPE-BM complex. Subject identification is in the upper-left corner of each panel, followed by subject age, and DPPR mean and SD. Subject 17 was imaged with a fast axis scan in the vertical direction, and did not maintain fixation, as is evident from the repeating blood vessel pattern in the image. Subjects 13 (drusen) and 14 (reticular pseudodrusen/deposits in BM) had early AMD; Subject16 had an epiretinal membrane. All other subjects were graded “normal”. DPPR is color-coded over 180°
FIGURE 8.
Thresholded DPPR results in the 10 older subjects. DPPR measurements are masked magenta at a threshold of 49°, which is the 99th percentile obtained from the 10 younger subjects. Subject identification is in the upper-left corner of each panel, followed by subject age, and percentage of pixels above the threshold. Magenta data points are considered suspect. DPPR is color-coded up to the 49° threshold
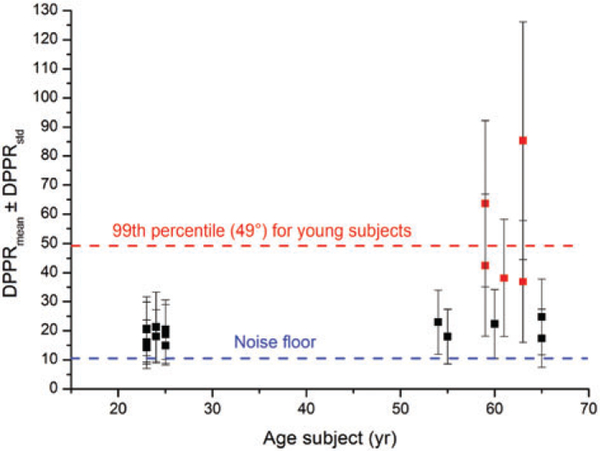
In Figure 9, the mean DPPR of all 20 subjects is plotted as a function of age. Red markers identify those subjects with more than 20% of their DPPR pixels above the 99th percentile threshold (49°). Not only do these subjects have a higher mean DPPR, the SD in DPPR, indicated by the error bars, is also larger than that of the younger subjects.
FIGURE 9.
Mean DPPR of the 20 subjects as a function of age. Error bars represent the SD in the DPPR measurement. Many of the older subjects have DPPR values comparable to the younger subjects, but not all. Roughly half have elevated DPPR (color-coded red), with more than 20% of their pixels above the 99th percentile threshold of 49° that was found in the 10 younger subjects (horizontal red line, dashed). This elevated group includes the 2 subjects with AMD. Subjects with a mean DPPR below 25°are present in both age groups, indicating that increased DPPR values are not caused solely by aging
Given that the DPPR variance of the older group is significantly higher than the mean of the younger group, Welch’s t test was used to compare the DPPR means of the younger (18.5° ± 2.5 °) vs older (37.2°+ 21.0°) groups. The older subjects had a significantly greater mean DPPR, P = .0245, but the individual differences were so large that a measure of central tendency does not fully characterize the data. Forming a 1-tail, 95% confidence limit from the DPPR means of all 10 younger subjects, 6 of the older subjects fell outside the confidence interval of the younger group. Subjects 13 (t = 9.71, P = .000003), 14 (t = 18.29, P < .0000005), 16 (t = 7.96, P = .000012), 17 (t = 27.08, P < .0000005), 18 (t = 7.44, P = .00002) and 20 (t = 2.53, P = .016237) fall outside the confidence limits of the younger group. Five of these subjects are marked in red in Figure 9, and only Subject 20 with the smallest difference from the younger subjects is marked black (along with the 4 other subjects who fell inside the confidence interval).
3.3 |. The relationship between retardance and DOPU
Approximately half of the older subjects show elevated retardance. Cumulative retardance follows a characteristic depth pattern in these subjects: low values in the photoreceptor (below IS/OS reference) and RPE layers, and a spike at the inferior edge of the RPE-BM complex. In some subjects, the retardance spike reaches values up to 180° (eg, Figures 4B and 5B). To assess whether this retardance spike is caused by increased scattering and polarization scrambling in the RPE, we analyzed DOPU (a biomarker for scattering and polarization scrambling) [16, 23, 24, 26–28] in our 20 subjects.
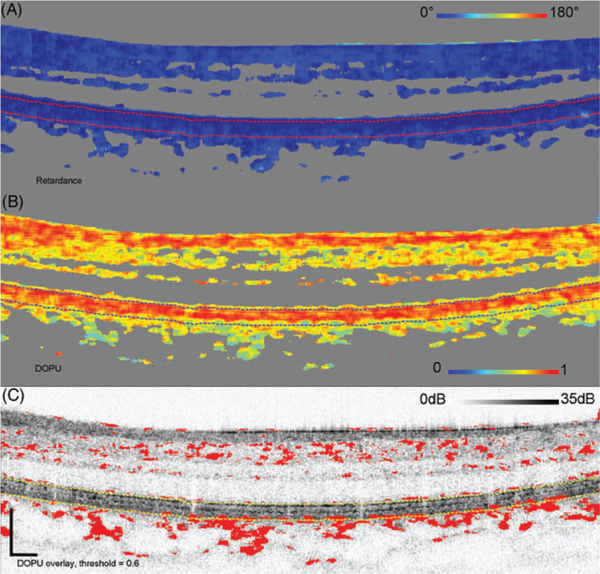
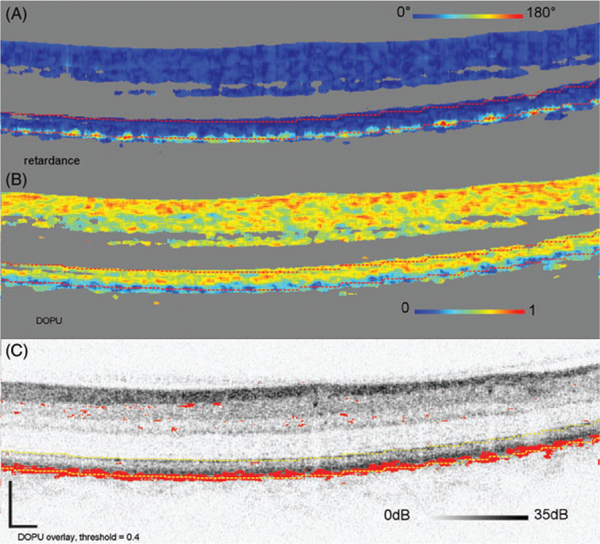
Figures 10–13 show the results of this analysis on 4 representative subjects (10 and 12–14) with different levels ofDPPR and DOPU. Three of the subjects are in the older age group. Figure 10 shows retardance and DOPU B-scans of the young subject (10). Most of the DOPU values are near 1, indicating small changes in polarization, as seen in tissue that is not highly scattering or highly birefringent. Interestingly, DOPU in the RPE is not much lower than that in the upper retinal layers. Using a relatively high threshold of 0.6 (which marks red all data points with a DOPU of 0.6 or lower), it was not possible to segment the RPE (Figure 10C), which demonstrates that the RPE is not highly scattering. Consistent with the high-DOPU, the cumulative retardance below the RPE-BM complex is low (see also Subject 10 in Figure 2).
FIGURE 10.
Cumulative retardance (A), DOPU (B), and DOPU thresholded at 0.6, projected on top of the log intensity (C). The threshold marks red DOPU values equal or lower than 0.6. B-scan is from Subject 10, a young subject with low-retardance levels below the RPE-BM complex. The IS/OS and bottom of the RPE-BM complex are segmented with dashed lines. Scale bars in (C) are 200 μm
FIGURE 13.
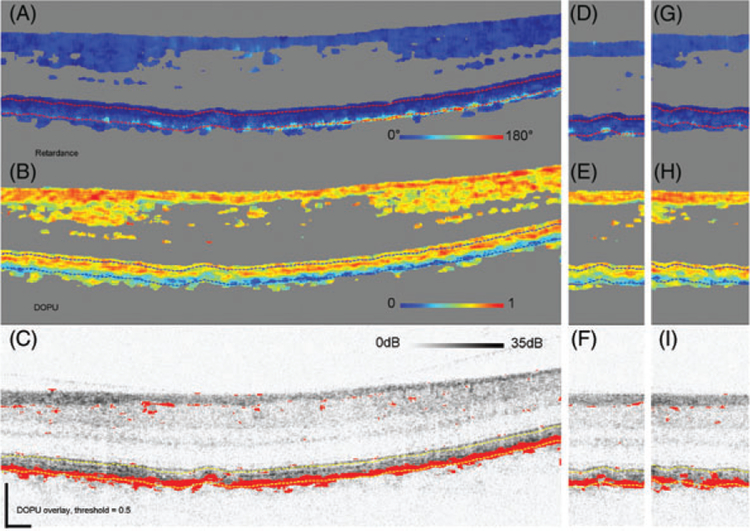
Cumulative retardance (A, D, G), DOPU (B, E, H) and thresholded DOPU at 0.5, projected on top of the log intensity image (C, F, I). The threshold marks red DOPU values equal or lower than 0.5. B-scan is from Subject 13, an older subject with high retardance below the RPEBM complex and reaching values up to 180°. Consistently low-DOPU values are present in the RPE. Panels (D-F) are of an adjacent B-scan (separated by 47 μm) that sections the same drusen, panels (G-I) show a B-scan through a second, more shallow, drusen
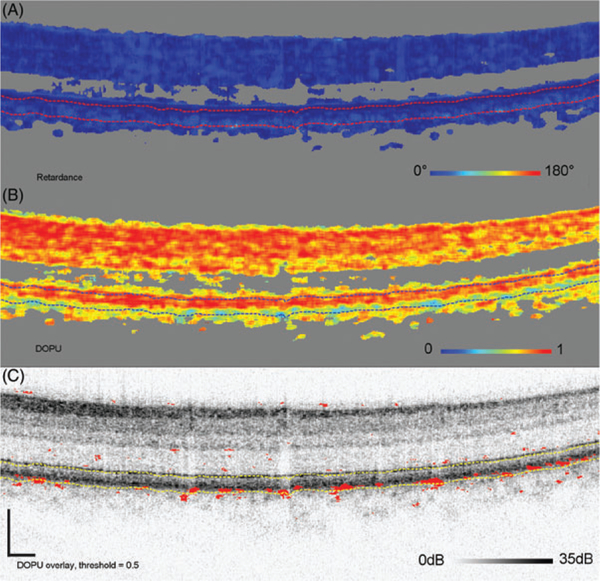
Figure 11 shows an older subject (12) and reveals isolated clusters of reduced DOPU (<0.5) in the RPE, which were absent in the previous subject. The number of clusters, however, remains insufficient to segment the RPE as evident in the DOPU thresholded (<0.5) B-scan. Consistent with the reduced DOPU, isolated clusters of elevated DPPR are present (see also Subject 12 in Figure 7). Figure 12 shows Subject 14 who has extensive areas of both reduced DOPU (<0.4) and elevated DPPR (see also Subject 14 in Figure 7). DOPU is sufficiently reduced that the RPE can be segmented using a DOPU threshold of 0.4, which indicates a low uniformity in the degree of polarization. Setting the threshold to 0.5 would still segment the RPE, but it would also add more red dots in the upper layers. Figure 13 shows the final subject (13) with B-scan images that cross section 2 small drusen. Like Subjects 14, 13 have extensive areas of both reduced DOPU (<0.5) and elevated DPPR (see also Subject 13 in Figure 7).
FIGURE 11.
Cumulative retardance (A), DOPU (B), and thresholded DOPU at 0.5, projected on top of the log intensity image (C). The threshold marks red DOPU values equal or lower than 0.5. B-scan is from Subject 12, one of the older subjects with low retardance below the RPEBM complex. Retardance is similar, yet elevated, to the low-retardance observed in young Subject 10. Consistent with this slight increase in retardance, the subject has several localized areas in or near the RPE with low-DOPU (<0.5)
FIGURE 12.
Cumulative retardance (A), DOPU (B), and thresholded DOPU at 0.4, projected on top of the log intensity image (C). The threshold marks red DOPU values equal or lower than 0.4. B-scan is from Subject 14, one of the older subjects with high retardance below the RPEBM complex and reaching values up to 180°. These are associated with low-DOPU values (<0.4) in the RPE
The DPPR and DOPU trends observed in subjects 10, 12, 13 and 14 cover the range of observations found in the other 16 subjects of our study. We conclude that DPPR below the RPE-BM complex follows an inverse relation with DOPU in the RPE. That is, DPPR increases as DOPU decreases. Or equivalently, DPPR increases as scattering and polarization scrambling in the RPE increases.
3.4 |. Following older subjects over time
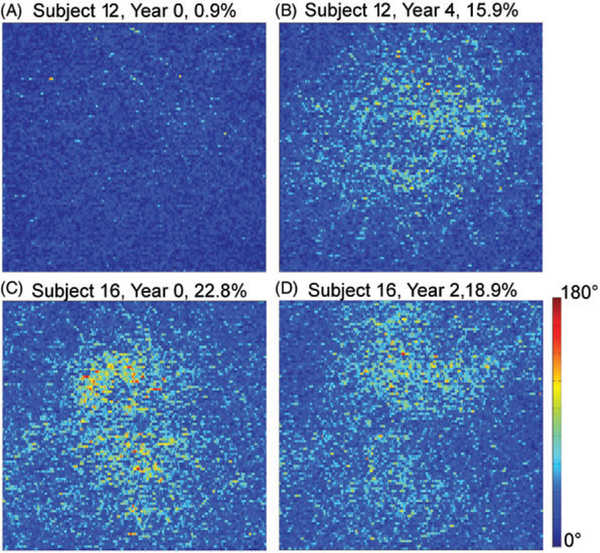
DPPR measurements were repeated on 2 subjects of similar age: Subject 12 aged 55 years and Subject 16 aged 61 years. Figure 14A,B shows measurements 4 years apart on the right eye (OD) of Subject 12. This eye was graded as normal. Figure 14C,D shows measurements 2 years apart on the right eye (OD) of Subject 16. This eye was graded as normal by TT, while BK noticed a mild epiretinal membrane. No evidence of AMD was found. The percentage of pixels above the 49° DPPR threshold is displayed over each panel.
FIGURE 14.
(A) The DPPR recorded below the RPE-BM complex in a 55-year-old subject and (B) again 4 years later. The percentages above the images indicate the number of pixels above the 99% cut-off of the10 younger subjects. Averaged over the image (A), the mean DPPR increases from 9° ± 9° to 32° ± 18°. Note that this increase is well abovethe 3% repeatability that was measured for subject 14 (see Figures 4 and 5). Similarly, (C) the DPPR was recorded below BM in a 61-year-old and (D) again 2 years later. For this subject, the mean DPPR decreased slightly from 38° ± 21° to 35° ± 18°. The OD eye of this subject in year 0 had aDPPR of 36° ± 20°, which is very similar to the numbers occurring in theOS eye
In Subject 12, only 0.9% of pixels were suspect in year 0, and this number increased to 15.9% in year 4, putting this eye in the suspect category, as marked in red in Figure 9. Subject 16 on the other hand was already suspect in year 0 with 22.8% of pixels above the threshold, and remained so in year 2, with 18.9% of pixels above the threshold. The dynamic range in the year 0 data set was approximately 31 dB, which is high enough for accurate layer segmentation and retardance calculation. In year 2, however, the average dynamic range of the collected data set dropped by approximately 4 dB, which made both the segmentation and the retardance analysis less reliable. This may explain why areas with high retardance in year 0 saw a loss in retardance in year 2, and vice versa. It should be noted that the data sets in Figures 2 and 7 had dynamic ranges of 30 dB or higher, high enough for reliable segmentation and data processing. An analysis on more subjects, preferably with data sets that have similar high-dynamic ranges, will be needed to separate changes in retardance caused by poor segmentation from actual changes in retardance caused by aging.
4 |. DISCUSSION
4.1 |. Young subjects
In all the young subjects, the DPPR (induced between the IS/OS and immediately below BM) was above the measurement noise floor, thus indicating the DPPR to be real and originating from between these retinal layers. The average DPPR of the 10 young subjects was 19° ± 10°, which is well above the noise floor of approximately 11°.
4.2 |. Older subjects
Large individual differences in the health of the RPE are known to occur with aging [39]. Consistent with this, we found large individual differences in DPPR below the RPEBM complex to also occur with aging. Our older subjects had a significantly greater mean DPPR, but with considerable intersubject variability (Figure 9). Six out of 10 older subjects fell outside the 95% confidence interval of the younger group. Of these 6, 5 had at least 20% of their pixels with DPPR above the 99th percentile threshold of the younger subjects. Thus, we conclude that aging is associated with considerably higher levels of DPPR in some subjects, while in others youthful levels of DPPR are preserved.
Three types of tissue changes in the RPE-BM complex present possible reasons for an increase in DPPR with age.
Collagen in BM, which increasingly cross-links with age [3, 40], may cause elevated DPPR. While this connection remains unclear, cross-linking of collagen fibers in other tissues is known to generate abnormal birefringence. Any consistent cross-linking with age, however, would have led to consistent elevated DPPR measurements in the group of older subjects, and such an increase was not observed (Figures 8 and 9), as half of the older subjects had DPPR values that were similar to the DPPR in the younger group. Moreover, such cross-linking is likely to have induced birefringence, meaning that the induced cumulative DPPR should have been preserved with depth, something that cannot be seen in our data.
Above age 50, the concentration of lipids in BM increases exponentially [41, 42], and the hydraulic conductivity decreases [2]. As waste material and nutrients are exchanged through BM, poor hydraulic conductivity may lead to the aggregation of lipids and formulation of additional molecular products. Similar to the cross-linking, it may be possible that the aggregation of lipids starts in different subjects at different ages, and that it induces elevated DPPR. A consistent increase in DPPR in all 10 older subjects, however, is missing (Figures 8 and 9).
As investigated in Section 3.3, increased scattering and polarization scrambling in the RPE was found associated with elevated retardance below the RPE-BM complex. Specifically, we found retardance follows an inverse relation with DOPU, which incidentally suggests that DPPR or DOPU could be separately used to identify suspect locations in the RPE-BM complex.
Why elevated DPPR below the RPE-BM complex is associated with increased scattering and polarization scrambling in the RPE is unclear. It might originate in how our PS-OCT algorithm calculates retardance. However, we have not observed this effect in numerous other applications of our algorithm including those applied to the eye. More critically a similar DPPR effect has been reported with PS-OCT based on a circularly polarized input state, thus employing a fundamentally different principle of operation and algorithm [24, 26]. It is possible that other polarization properties such as diattenuation are altered in the RPE and play a role. As these properties cannot be measured directly with our method, imaging modalities sensitive to them will be necessary to test, as for example methods based on Jones-vector or Mueller-matrix imaging.
It is worth noting that the vast majority of our subjects exhibited high-DOPU in the RPE, with values around 0.7. Apparently, the RPE of these subjects do not contain sufficient intracellular material that scatters or scrambles the light to reduce DOPU. As to what that scattering organelle might be, previous DOPU measurements of isolated melanin, and the RPE in normals and albinos implicate melanin [26]. Our data, however, does not fully support this. Absence of low-DOPU in our young subjects (an age when melanin concentrations are typically high) and presence of low-DOPU in half our older subjects (an age when melaninconcentrations are typically lower) indicate that the relationship between melanin and DOPU is more complicated. This should not be too surprising given how varied RPE composition can be. Looking at just one organelle, melanin, its granules are known to vary in size among ethnic groups, vary in depth location with age, clump, and are substantially altered by other RPE changes.
Our results provide evidence that DPPR may be a sensitive biomarker of early morphological changes in the RPEBM complex. Two of the 5 subjects with elevated DPPR (Figure 9) were graded as normal, and demonstrate that retinas with elevated DPPR can appear clinically normal in OCT intensity images. These elevated DPPR signals may reflect optical changes associated with the first steps in thickening of BM, or the build-up of inflammatory products [5], before such a thickening can be detected with standard OCT.
Finally, we note a few observations of DOPU and DPPR around drusen, using Subjects 13 and 14 as examples. In Subject 13 (Figure 13) the left and right edges of drusen were observed to typically have moderate DPPR, with values of approximately 90°, while the center of the drusen showed no visible increase in DPPR. A possible explanation for this difference is that hyalinization of BM [43], which is described in the literature as “glassy or without structure” and hyalinization of the druse leads to a reduction of scattering. It may, therefore, induce less or no DPPR in comparison to more freshly deposited material, such as the material that is found at the edge of a druse. The higher DOPU, indicating less polarization scrambling, above the RPE-BM complex in the druse seems to corroborate this explanation. In one adjacent B-scan (Figure 13DF), the same druse is seen, with again elevated values at the edge of the druse, and low values in the center. A similar distribution of DPPR can be seen in other smaller and shallower drusen in the same subject (Figure 13G–I) as well as in Subject 14.
5 |. CONCLUSION
DPPR induced by the RPE-BM complex was successfully measured in 20 subjects. These retardance measurements provide new insight into the impact of aging and disease on this critical layer that supports photoreceptors. All young subjects and 5 of the older subjects had retardance values induced by the RPE-BM complex that were just above the noise floor measurement (5° −13° at 840 nm). In contrast, elevated retardance, up to 180°, was observed in the other 5 older subjects. Analysis of the DOPU demonstrates that reduced DOPU (<0.4) in the RPE is associated with elevated DPPR below the RPE-BM complex, suggesting that the observed elevated DPPR in older subjects is the result of increased scattering or polarization scrambling.
Collectively, our measurements show that the outer retina can undergo dramatic change in its polarization properties with age, and in some cases still retain its clinically normal appearance. Longitudinal studies of healthy, older individuals will substantiate whether DPPR is a sensitive bio-marker to predict the manifestation of AMD.
ACKNOWLEDGMENTS
The authors would like to thank the subjects that were imaged for this study. They also thank Qiang Wang for collecting several of the PS-OCT data sets. Funding: NIH NEI EY007624 (AEE), P30 EY019008 (AEE, DTM), R01-EY014743 (DTM) and R01-EY018339 (DTM).
Funding information
National Eye Institute, Grant/Award numbers: EY007624, EY019008, EY018339, EY014743
REFERENCES
- [1].Young RW, Bok D, Metabolism of the Retinal Pigment Epithelium, Harvard University Press, Washington, DC: 1979, p. 103. [Google Scholar]
- [2].Guymer R, Luthert P, Bird A, Prog. Retin Eye Res. 1999, 18, 59. [DOI] [PubMed] [Google Scholar]
- [3].Feeney L, Invest. Ophthalmol. Vis. Sci 1973, 12, 635. [PubMed] [Google Scholar]
- [4].Hogan MJ, Alvarado Arch J. Ophthalmol. Chic 1967, 77, 410. [DOI] [PubMed] [Google Scholar]
- [5].Anderson DH, Radeke MJ, Gallo NB, Chapin EA, Johnson PT, Curletti CR, Hancox LS, Hu J, Ebright JN, Malek G, Prog. Retin. Eye Res 2010, 29, 95. [DOI] [PMC free article] [PubMed] [Google Scholar]
- [6].Elsner AE, Weber A, Cheney MC, VanNasdale DA, Miura M, JOSA A 2007, 24, 1468. [DOI] [PMC free article] [PubMed] [Google Scholar]
- [7].Miura M, Yamanari M, Iwasaki T, Elsner AE, Makita S, Yatagai T, Yasuno Y, Invest. Ophthalmol. Vis. Sci 2008, 49, 2661. [DOI] [PMC free article] [PubMed] [Google Scholar]
- [8].VanNasdale DA, Elsner AE, Hobbs T, Burns SA, Vision Res. 2011, 51, 2263. [DOI] [PMC free article] [PubMed] [Google Scholar]
- [9].VanNasdale DA, Elsner AE, Peabody TD, Kohne KD, Malinovsky VE, Haggerty BP, Weber A, Clark CA, Burns SA, Invest. Ophthalmol. Vis. Sci 2015, 56, 284. [DOI] [PMC free article] [PubMed] [Google Scholar]
- [10].Twietmeyer KM, Chipman RA, Elsner AE, Zhao Y, VanNasdale D, Opt. Express 2008, 16, 21339. [DOI] [PMC free article] [PubMed] [Google Scholar]
- [11].Bueno JM, Vis. Res 2001, 41, 2687. [DOI] [PubMed] [Google Scholar]
- [12].Cense B, Chen TC, Park BH, Pierce MC, de Boer JF, Opt Lett. 2002, 27, 1610. [DOI] [PubMed] [Google Scholar]
- [13].Cense B, Chen TC, Park BH, Pierce MC, de Boer JF, Journal of Biomedical Optics 2004, 9, 121. [DOI] [PubMed] [Google Scholar]
- [14].Cense B, Chen TC, Park BH, Pierce MC, de Boer JF, Investigative Ophthalmology & Visual Science 2004, 45, 2606. [DOI] [PubMed] [Google Scholar]
- [15].Mujat M, Park BH, Cense B, Chen TC, de Boer JF. J.Biomed. Opt 2007, 12, 041205–041205–041206. [DOI] [PubMed] [Google Scholar]
- [16].Götzinger E, Pircher M, Baumann B, Hirn C, Vass C, Hitzenberger CK, J. Biophotonics 2008, 1, 129. [DOI] [PubMed] [Google Scholar]
- [17].Yamanari M, Miura M, Makita S, Yatagai T, Yasuno Y, J. Biomed. Opt 2008, 13, 10. [DOI] [PubMed] [Google Scholar]
- [18].Elmaanaoui B, Wang B, Dwelle JC, McElroy AB, Liu SS, Rylander HG, Milner TE, Opt. Express 2011, 19, 10252. [DOI] [PMC free article] [PubMed] [Google Scholar]
- [19].Dwelle J, Liu S, Wang BQ, McElroy A, Ho D, Markey MK, Milner T, Rylander HG, Invest. Ophthalmol. Vis. Sci 2012, 53, 4380. [DOI] [PMC free article] [PubMed] [Google Scholar]
- [20].Zotter S, Pircher M, Götzinger E, Torzicky T, Yoshida H, Hirose F, Holzer S, Kroisamer J, Vass C, Schmidt-Erfurth U, Hitzenberger CK, Invest. Ophthalmol. Vis. Sci 2013, 54, 72. [DOI] [PubMed] [Google Scholar]
- [21].Sugita M, Pircher M, Zotter S, Baumann B, Roberts P, Makihira T, Tomatsu N, Sato M, Vass C, Hitzenberger CK, Biomed. Opt. Express 2015, 6, 1030. [DOI] [PMC free article] [PubMed] [Google Scholar]
- [22].Pircher M, Götzinger E, Leitgeb R, Hitzenberger CK, Phys. Med. Biol 2004, 49, 1257. [DOI] [PubMed] [Google Scholar]
- [23].Pircher M, Götzinger E, Findl O, Michels S, Geitzenauer W, Leydolt C, Schmidt-Erfurth U, Hitzenberger CK, Invest. Ophthalmol. Vis. Sci 2006, 47, 5487. [DOI] [PubMed] [Google Scholar]
- [24].Götzinger E, Pircher M, Geitzenauer W, Ahlers C, Baumann B, Michels S, Schmidt-Erfurth U, Hitzenberger CK, Opt. Express 2008, 16, 16410. [DOI] [PMC free article] [PubMed] [Google Scholar]
- [25].Torzicky T, Marschall S, Pircher M, Baumann B, Bonesi M, Zotter S, Gotzinger E, Trasischker W, Klein T, Wieser W, Biedermann B, Huber R, Andersen P, Hitzenberger CK, J. Biomed. Opt 2013, 18, 026008. [DOI] [PubMed] [Google Scholar]
- [26].Baumann B, Baumann SO, Konegger T, Pircher M, Götzinger E, Schlanitz F, Schütze C, Sattmann H, Litschauer M, Schmidt-Erfurth U, Biomed. Opt. Express 2012, 3, 1670. [DOI] [PMC free article] [PubMed] [Google Scholar]
- [27].Schlanitz FG, Sacu S, Baumann B, Bolz M, Platzer M, Pircher M, Hitzenberger CK, Schmidt-Erfurth U, Am. J. Ophthalmol 2015, 160, 335. [DOI] [PMC free article] [PubMed] [Google Scholar]
- [28].Cense B, Gao W, Brown JM, Jones SM, Jonnal RS, Mujat M, Park BH, de Boer JF, Miller DT, Opt. Express 2009, 17, 21634. [DOI] [PMC free article] [PubMed] [Google Scholar]
- [29].Cense B, Wang Q, Lee S, Zhao L, Elsner AE, Hitzenberger CK, Miller DT, Biomed. Opt. Express 2013, 4, 2296. [DOI] [PMC free article] [PubMed] [Google Scholar]
- [30].Braaf B, Vermeer KA, de Groot M, Vienola KV, de Boer JF, Biomed. Opt. Express 2014, 5, 2736. [DOI] [PMC free article] [PubMed] [Google Scholar]
- [31].Sugita M, Zotter S, Pircher M, Makihira T, Saito K, Tomatsu N, Sato M, Roberts P, Schmidt-Erfurth U, Hitzenberger CK, Biomed. Opt. Express 2014, 5, 106. [DOI] [PMC free article] [PubMed] [Google Scholar]
- [32].Roberts P, Sugita M, Deák G, Baumann B, Zotter S, Pircher M, Sacu S, Hitzenberger CK, Schmidt-Erfurth U, Invest. Ophthalmol. Vis. Sci 2016, 57, 1699. [DOI] [PubMed] [Google Scholar]
- [33].Saxer CE, de Boer JF, Park BH, Zhao YH, Chen ZP, Nelson JS, Opt. Lett 2000, 25, 1355. [DOI] [PubMed] [Google Scholar]
- [34].Cense B, Mujat M, Chen TC, Park BH, de Boer JF, Opt. Express 2007, 15, 2421. [DOI] [PubMed] [Google Scholar]
- [35].A.N.S.I. 2014.
- [36].Park BH, Pierce MC, Cense B, Yun SH, Mujat M, Tearney GJ, Bouma BE, de Boer JF, Opt. Express 2005, 13, 3931. [DOI] [PubMed] [Google Scholar]
- [37].Park BH, Pierce MC, Cense B, de Boer JF, Opt. Lett 2005, 30, 2587. [DOI] [PubMed] [Google Scholar]
- [38].Kurokawa K, Liu Z, Miller DT, Biomed. Opt. Express 2017, 8, 1803. [DOI] [PMC free article] [PubMed] [Google Scholar]
- [39].Delori FC, Goger DG, Dorey CK, Invest. Ophthalmol. Vis. Sci 2001, 42, 1855. [PubMed] [Google Scholar]
- [40].Booij JC, Baas DC, Beisekeeva J, Gorgels TG, Bergen AA, Prog Retin Eye Res 2010, 29, 1. [DOI] [PubMed] [Google Scholar]
- [41].Holz FG, Sheraidah G, Pauleikhoff D, Bird AC, Arch Ophthalmol. Chic 1994, 112, 402. [DOI] [PubMed] [Google Scholar]
- [42].Moore DJ, Hussain AA, Marshall J, Invest. Ophthalmol. Vis. Sci 1995, 36, 1290. [PubMed] [Google Scholar]
- [43].Sarks S, Brit J Ophthalmol. 1976, 60, 324. [DOI] [PMC free article] [PubMed] [Google Scholar]


