

SUMMARY
Interleukin-1 beta (IL-1β) is a pleiotropic mediator of inflammation and is produced in response to a wide range of stimuli. During infection, IL-1β production occurs in parallel with the onset of innate antimicrobial defenses, but the contribution of IL-1β signaling to cell-intrinsic immunity is not defined. Here, we report that exogenous IL-1β induces interferon regulatory factor 3 (IRF3) activation in human myeloid, fibroblast, and epithelial cells. IRF3 activation by IL-1β is dependent upon the DNA-sensing pathway adaptor, stimulator of interferon genes (STING), through the recognition of cytosolic mtDNA by cyclic guanosine monophosphate (GMP)-AMP synthase (cGAS). IL-1β treatment results in interferon (IFN) production and activation of IFN signaling to direct a potent innate immune response that restricts dengue virus infection. This study identifies a new function for IL-1β in the onset or enhancement of cell-intrinsic immunity, with important implications for cGAS-STING in integrating inflammatory and microbial cues for host defense.
In Brief
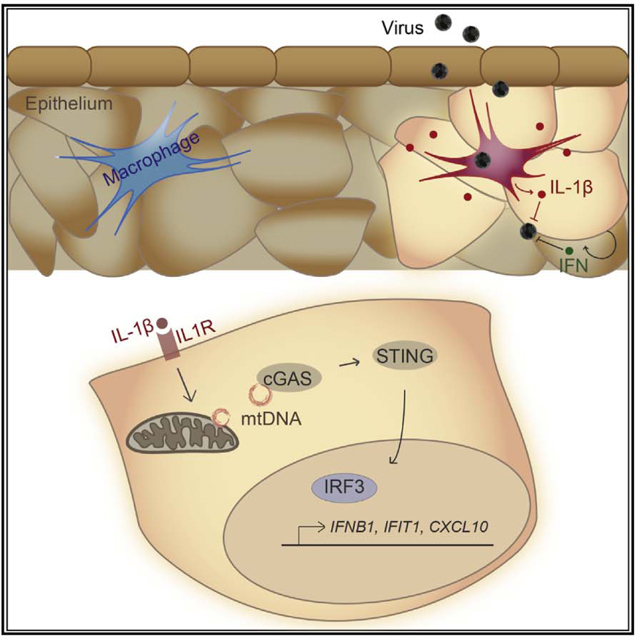
Aarreberg et al. report that the inflammatory cytokine IL-1β exerts cell-intrinsic immune protection by upregulation of antimicrobial genes. This signaling program is mediated by the release and detection of mtDNA by the cytosolic sensor cGAS and reveals a new stress-induced pathway of STING and IRF3 activation.
Graphical abstract
INTRODUCTION
A timely and potent response to pathogens is critical for host defense against infection. Microbial and cellular cues of infection are detected by immune and non-immune cells via pattern recognition receptors (PRRs) to initiate innate immune and inflammatory cascades. PRRs include Toll-like receptors (TLRs), RIG-l-like receptors, nucleotide-binding oligomerization domain (NOD)-like receptors (NLRs), and cytosolic DNA sensors, such as cyclic GMP-AMP synthase (cGAS) (Paludan and Bowie, 2013; Takeuchi and Akira, 2010). Differential expression of PRRs across cell types directs cell-specific innate immunity. PRRs recognize a broad array of structural and biochemical motifs that originate from the pathogen itself (pathogen-associated molecular patterns [PAMPs]) or are cellular products from infection-or stress-induced damage (danger-associated molecular patterns [DAMPs]). In homeostasis, DAMPs are sequestered from PRRs, or are otherwise structurally unrecognizable, and do not stimulate innate immune responses. Liberation or modification of the DAMP can result in its recognition by PRRs (Schaefer, 2014). The spectrum of PRRs engaged during infection and responses to stress serve to direct the outcome of infection and immunity (Brubaker et al., 2015). PRR signaling converges on latent transcription factors, such as nuclear factor κB (NF-κB), interferon regulatory factors (IRFs), and signal transducer and activator of transcription (STAT) proteins, for the induction of genes involved in immune cell recruitment, signal transduction, and direct antimicrobial activities (Paludan and Bowie, 2013; Takeuchi and Akira, 2010).
Cytokine production and response comprise an important arm of host defense. Interferon beta (IFNβ), interferon lambda (IFNλ), and interleukin-1β (IL-1β) are pivotal cytokines of innate immunity and inflammation in the control of infection. IFNs are produced as a result of PRR signaling that drives IRF3 activation and, upon their release from infected cells, bind their cognate receptors for transcriptional induction of IFN-stimulated genes (ISGs). ISG products promote an antimicrobial state in infected and bystander cells (Brierley and Fish, 2002). IL-1β, a product of inflammasome activation, is a potent inducer of NF-κB-dependent gene transcription and can propagate inflammation, recruit immune cells, and modulate adaptive immune responses (Dinarello, 2009; Sims and Smith, 2010).
IL-1β can initiate cell-intrinsic host restriction pathways against bacterial and viral infections, but the intracellular mechanisms thereof are not fully defined (Copenhaver et al., 2015; Mayer-Barber et al., 2014; Ramos et al., 2012). We recently demonstrated that IL-1 receptor (IL-1R) signaling in primary murine myeloid cells regulates transcriptional activation to initiate or maintain ISG expression and limit West Nile virus infection (Aarreberg et al., 2018). Moreover, an intriguing recent study by Orzalli et al. (2018) defined the presence of an IL-1-induced, IRF1-dependent antiviral program in human fibroblasts and endothelial cells. Here, we examined innate immune defense programs downstream of IL-1R in various cell types and reveal that exogenous IL-1β triggers IRF3 activation through the DNA-sensing pathway components cGAS and stimulator of IFN genes (STING). This response depends upon the liberation and cytosolic sensing of mtDNA and functions to potentiate pathogen-induced IFN production and ISG expression. We also found that IL-1R1 is required for maximal IRF-directed innate immune responses to inflammasome-activating microbial products and dengue virus infection. Our observations present a new mechanism in which IL-1β modulates STING activity for cell-intrinsic protection against microbial pathogens.
RESULTS
Exogenous IL-1β Activates IRF3
To determine the impact of IL-1β on the cell-intrinsic innate immune response, we analyzed IRF3 activation and immune gene expression upon IL-1β treatment of various cell types. Treatment of human A549 epithelial cells with exogenous IL-1β resulted in phosphorylation of IRF3 at the essential activating residue serine-386 (S386) (Mori et al., 2004), followed by increased abundance of IFIT1, a known IRF3 target (Grandvaux et al., 2002; Figure 1A). Transcriptional induction of antiviral response genes IFIT1 and MX1 by IL-1β was lost in CRISPR-targeted A549 cells lacking IRF3, but induction of the NF-κB-responsive gene, CCL4, was unaffected by the loss of IRF3 (Figure 1B). Additionally, we found that IRF3 is phosphorylated in response to IL-1β treatment in primary human foreskin fibroblasts (Figure 1C).
Figure 1. Exogenous IL-1β Activates IRF3.
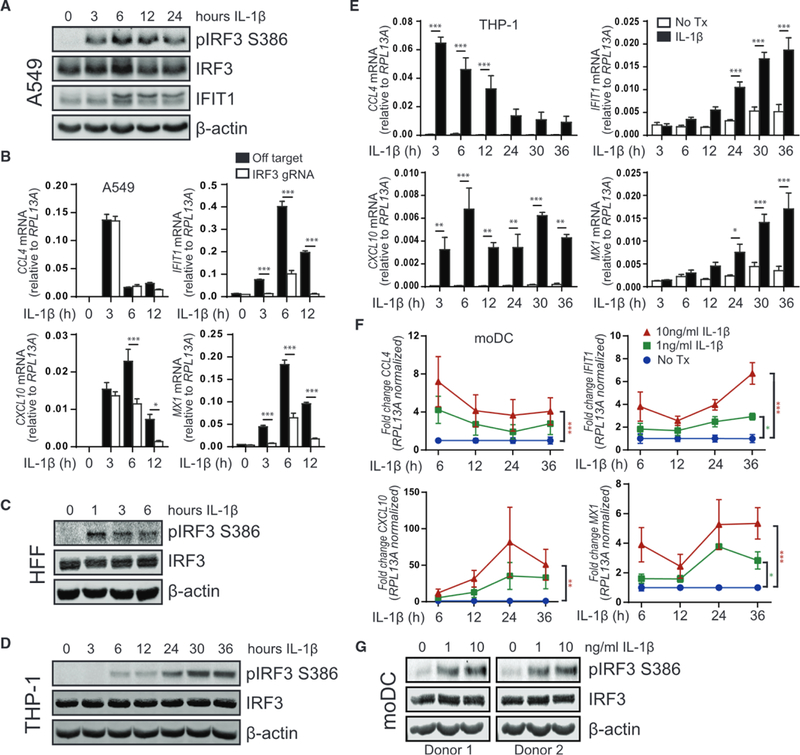
(A) A549 was treated with media (0, denoting non-treated control) or 10 ng/mL IL-1β for 3–24 h before protein analysis by immunoblot, n = 4.
(B) A549 transduced with lentiCRISPR/Cas9 and off-target gRNA or IRF3-gRNA was treated with media (0) or 10 ng/mL IL-1β for 3–12 h before qRT-PCR analysis. Statistical analysis was performed using Student’s t test and Holm-Sidak to compare genotypes; n = 6 with mean ± SEM.
(C) Human foreskin fibroblasts were treated with media (0) or 10 ng/mL IL-1β for 1–6 h before protein analysis by immunoblot, n = 3.
(D) THP-1 was treated with media (0) or 10 ng/mL IL-1β for 3–36 h before protein analysis by immunoblot, n = 4.
(E) THP-1 was treated with media or 10 ng/mL IL-1β for 3–36 h before qRT-PCR analysis. Statistical analysis was performed using Student’s t test and Holm-Sidak to compare treatments; n = 3 with mean ± SEM.
(F) Primary human-monocyte-derived dendritic cells (moDCs) were treated with media or the indicated concentrations of IL-1β for 6–36 h before qRT-PCR analysis. Statistical analysis was performed using two-way ANOVA and Dunnett’s to compare mock to IL-1β treatments; n = 3 with mean ± SEM.
(G) moDCs were treated with media or the indicated concentrations of IL-1 β for 36 h before protein analysis by immunoblot, n = 2. *p < 0.05; **p < 0.01; ***p < 0.001. See also Figures S1, S2, and S3 and Table S1.
In phorbol 12-myristate 13-acetate (PMA)-differentiated THP-1 (a human monocytic leukemia cell line) macrophages, IL-1β treatment resulted in delayed plRF3 (Figure 1D). In THP-1 cells, we found that IL-1β-induced CCL4 expression occurs rapidly after IL-1β treatment and then subsides over 36 h and antiviral response genes increase in expression over this period (Figure 1E). Of note, CXCL10 is both IRF3-and NF-κB responsive (Ohmori and Hamilton, 1995). Consistent with this dual induction program, CXCL10 demonstrates a bimodal expression pattern in IL-1β-treated THP-1 macrophages (Figure 1E) and is only partially reduced in IRF3-deficient, IL-1β-treated A549 cells (Figure 1B). These responses were absent in IL-1R1-deficient cells, demonstrating that pathways of IRF3 and NF-κB activation are induced in response to IL-1β engagement of IL-1R (Figure S1).
We then evaluated the response to IL-1β in primary human-monocyte-derived dendritic cells (moDCs). moDCs treated with IL-1β express antiviral genes in a dose-response manner, with similar trends of immediate NF-κB activation that wanes over time and a gradual increase in IRF3 target genes and ISGs over 36 h (Figure 1F). Notably, IL-1β-induced plRF3 is only detectable at 30–36 h post-treatment of primary moDCs (Figure 1G). The delayed kinetics of IRF3-responsive gene expression in human macrophages and dendritic cells match the kinetics of IL-1β-induced antiviral gene expression that occurs in primary murine macrophages and dendritic cells (Aarreberg et al., 2018). Together, these observations demonstrate that exogenous IL-1β induces functional IRF3 activation in human cell lines of epithelial and myeloid origin as well as primary human fibroblasts and myeloid cells.
Differential IRF Requirements for IL-1β-lnduced Antiviral Gene Induction
To broaden our characterization of IL-1β-induced antiviral gene programs, we utilized droplet-based, single-cell RNA sequencing (scRNA-seq), wherein we identified heterogeneous responses in A549 cells treated with IL-1β over 3, 6, or 12 h (Figures S2A and S2B). In total, we sequenced 7,547 cells that passed knee filtering (1,825 cells at 3 h, 3,278 cells at 6 h, and 2,444 cells at 12 h; see STAR Methods). Of note, genes that were measured by qRT-PCR (see Figure 1) fell below the range of detection by this method. However, scRNA-seq revealed that several other ISGs, genes involved in innate intracellular signaling, and pro-and anti-apoptotic genes are induced or “up-regulated” by IL-1β (Figure S2B; Table S1). Upregulated genes follow four general patterns of expression: (1) immediate and transient (e.g., BCL3 and IRF1), (2) immediate and sustained (e.g., CXCL1 and CXCL2), (3) delayed and transient (e.g., GBP1 and ISG20), or (4) gradual (e.g., B2M and CCL5). We next examined predicted activation of upstream transcriptional regulators associated with significant change in measured gene expression at each time point. Transcriptional repressors, such as estrogen receptor 1 (ESR1) and nuclear receptor sub-family 3 group C member 1 (NR3C1), were predicted as inactivated upon IL-1β treatment (Figure S2C). Consistent with our signaling data (see Figure 1), NF-κB family members, IRF3, and other IFNβ enhanceosome members are predicted to be active by 3 h post-IL-1β treatment in A549 cells. Although STAT1 is a predicted positive regulator at all three time points, STAT3 is predicted to be active late in the response to IL-1β.
The IRF family of transcription factors IRF1, IRF3, IRF5, and IRF7 has redundant promoter-binding sites (Harada et al., 1989; Taniguchi et al., 2001), and we found that IRF1 is highly up-regulated by IL-1β treatment (Figure S2B). We therefore ablated the expression of each IRF to determine their relative contributions to this IL-1β-induced antiviral gene signature. CRISPR targeting of each IRF member in A549 cells revealed that both IRF1 and IRF3 contribute to IL-1β-mediated antiviral transcriptional responses, with also a partial reduction of IFIT1 transcription observed in IRF7-deficient cells (Figures S3A and S3B). Immunoblot analysis revealed that exogenous IL-1β results in increased abundance of IRF1, IRF7, and IFIT1, but neither IRF7 nor IFIT1 are produced in the absence of IRF3 (Figure S3C). Similarly, CRISPR targeting of each IRF member in THP-1 macrophages showed differential requirements for each in the induction of antiviral response genes and a complete loss of signaling in the absence of IRF3 (Figures S3D and S3E). Our data also indicate that IRF1 plays a role in the induction of CXCL10 by IL-1β in either cell type, which is consistent with previous reports on the transcriptional regulation of this gene (Yarilina et al., 2008; Zaheer and Proud, 2010). Notably, CRISPR targeting of IRF5 resulted in enhanced expression of IL-1β-induced genes, revealing a potential negative regulatory role for IRF5 in these cells. These observations confirm that exogenous IL-1β can orchestrate complex transcriptional changes, including the activation of IRF1 (Orzalli et al., 2018) and IRF3, wherein IRF3 plays an essential role to direct the expression of target genes in both human epithelial and myeloid cells.
IRF3 Activation in Response to IL-1β Is cGAS and STING Dependent
During PRR signaling, IRF3 activation is conferred by the TBK1 and IKKε protein kinases, which coordinate with mitochondrial activator of virus signaling (MAVS) adaptor molecules, STING, or TIR-domain-containing adapter-inducing interferon-β (TRIF) to gain proximity to downstream substrates (Liu et al., 2015). These kinases are essential for phosphorylation of IRF3 (Fitzgerald et al., 2003; Sharma et al., 2003), which then dimerizes and translocates to the nucleus to initiate transcription of IFNB1, IFIT1, and other IRF3-responsive genes. Therefore, we examined IL-1β-induced activation of TBK1/IKKε in epithelial cells and macrophages. Coincident with detectable plRF3 (see Figures 1A and 1D), we observed sustained activation of TBK1/IKKε in response to IL-1β treatment, as shown by phosphorylation at the activating residue Ser-172 on each protein (Figures S4A and S4B; Kishore et al., 2002; Shimada et al., 1999). To confirm the role of these kinases in IL-1β-mediated IRF3 phosphorylation, we used an inhibitor of TBK1/IKKε kinase activity. Control cells treated with lipopolysaccharide (LPS) exhibited robust activation of IRF3 that was suppressed by inhibitor treatment (Figure S4D). Pretreatment with inhibitor also prevented IL-1β-induced plRF3, thereby expanding the critical role for these kinases to include IL-1β-induced IRF3 phosphorylation (Figures S4C and S4D).
We next tested whether the innate immune adaptor proteins MAVS, STING, or TRIF were necessary to engage TBK1/IKKε-mediated activation of IRF3 in response to IL-1β-Remarkably, we found that macrophages lacking STING were unable to express IRF3-responsive genes upon IL-1β treatment, although MAVS-or TRIF-deficient cells fully respond to IL-1β (Figure 2A). CRISPR targeting was confirmed at the protein level and with ablated signaling downstream of relevant stimuli (Figure S5). STING is activated by cyclic dinucleotides synthesized by the cytosolic DNA sensor cGAS (Sun et al., 2013). We therefore treated cGAS and STING CRISPR-targeted THP-1 macrophages with IL-1β and examined plRF3 by immunoblot to assess the role of these DNA-sensing pathway components in IL-1β-induced IRF3 activation. cGAS deficiency resulted in greatly reduced plRF3 compared to control cells, and STING-deficient cells showed a complete loss of plRF3 in response to IL-1β (Figure 2B). Importantly, cGAS or STING deficiency significantly reduced IL-1β-induced IRF3 target gene expression compared to control cells (Figure 2C). Activation of NF-κB was apparent in cGAS-and STING-deficient cells at 6 and 12 h post-treatment with IL-1β, with no detection of pNF-κB by 24 h (Figure 2B). Of note, cGAS-deficient cells demonstrated prolonged pNF-κB and enhanced expression of CCL4 compared to control cells, and STING-deficient cells showed delayed pNF-κB and slightly reduced expression of CCL4. We also confirmed the requirement for STING in the non-myeloid response to IL-1β-STING CRISPR-targeted A549 cells showed a slight decrease in NF-κB-responsive gene, CCL4, a complete loss of ISGs IFIT1 and MX1, and a partial loss of CXCL10 induction compared to control cells (Figure 2D).
Figure 2. IRF3 Activation in Response to IL-1β Is cGAS and STING Dependent.
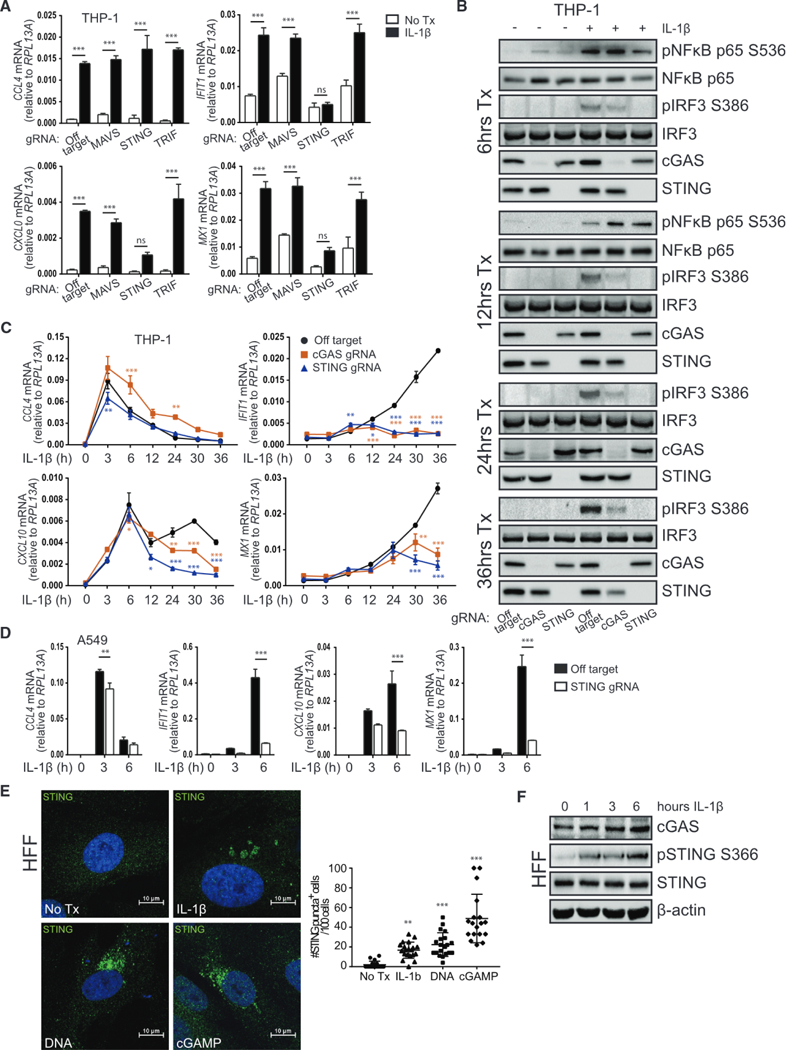
(A) THP-1 transduced with lentiCRISPR/Cas9 and off-target gRNA or MAVS-, STING-or TRIF-gRNA was treated with media or 10 ng/mL IL-1β for 30 h before qRT-PCR analysis. Statistical analysis was performed using two-way ANOVA and Bonferroni’s to compare treatments; n = 3 with mean ± SEM.
(B) THP-1 transduced with lentiCRISPR/Cas9 and off-target gRNA or cGAS-or STING-gRNA was treated with media or 10 ng/mL IL-1β for 6–36 h before protein analysis by immunoblot, n = 2.
(C) THP-1 transduced with lentiCRISPR/Cas9 and off-target gRNA or cGAS-or STING-gRNA was treated with media (0) or 10 ng/mL IL-1β for 3–36 h before qRT-PCR analysis. Statistical analysis was performed using two-way ANOVA with Bonferroni’s to compare knockouts to control cells; n = 4 with mean ± SEM.
(D) A549 transduced with lentiCRISPR/Cas9 and off-target gRNA or STING-gRNA was treated with media (0) or 10 ng/mL IL-1β for 3–6 h before qRT-PCR analysis. Statistical analysis was performed using Student’s t test and Holm-Sidak to compare genotypes; n = 3 with mean ± SEM.
(E) Left: HFFs were treated with media or 10 ng/mL IL-1β, transfected with 1 μg/mL calf thymus DNA, or transfected with 10 μg/mL cGAMP for 3 h on coverslips. Cells were fixed and stained for confocal imaging of STING (green). Nuclei were counterstained with DAPI (blue). Right: quantification of cells positive for STING puncta where each dot represents one field of view. Statistical analysis was performed using one-way ANOVA and Holm-Sidak; n = 4 with mean ± SD.
(F) HFF were treated with media (0) or 10 ng/mL IL-1β for 1–6 h before protein analysis by immunoblot, n = 2. *p < 0.05; **p < 0.01; ***p < 0.001. See also Figures S4 and S5.
To examine whether IL-1β treatment drives translocation of endogenous STING as another indicator of its activation (Ishikawa et al., 2009; Saitoh et al., 2009), we utilized primary human foreskin fibroblasts, which express high levels of STING protein. As shown in previous reports, cytosolic DNA or exposure to the second messenger cyclic GMP-AMP (cGAMP) resulted in perinuclear relocalization of STING (Figure 2E). Importantly, aggregation of STING also occurred following IL-1β treatment. In agreement with these data, IL-1β signaling resulted in the phosphorylation of STING at the critical residue Ser-366 (Liu et al., 2015; Figure 2F), coincident with detectable plRF3 (see Figure 1C). Together, these data show that exogenous IL-1β drives cGAS-and STING-dependent innate immune activation.
IL-1R Signaling Induces Release of mtDNA to Initiate Innate Immune Activation
Previous studies have described a role for the DNA-sensing pathway in the immunological response to dying cells (Ahn et al., 2012; Marichal et al., 2011). To determine whether the IL-1β-cGAS-STING axis was a response to IL-1β-induced cell death, we assessed cell viability over a time course of IL-1β treatment in real time using IncuCyte live-cell imaging. Although cell death was readily induced by pyroptotic or apoptotic stimuli, we observed no cell death in response to IL-1β treatment of either THP-1 macrophages or A549 cells (Figure S6).
Noting that liberated mtDNA is shown to induce STING-dependent innate immune activation in response to microbial products and virus infection (Aguirre et al., 2017; Rongvaux et al., 2014; Sun et al., 2017; West et al., 2015; White et al., 2014), we examined the possibility that IL-1β treatment induced mtDNA release to the cytoplasm as a DAMP sensed by cGAS. Cells were treated with IL-1β or a positive control for mtDNA release, tunicamycin (Sun et al., 2017), then subsequently fractionated to examine cytosolic mtDNA content (Figure 3A). Immunoblot analysis confirmed the isolation of pure subcellular fractions of cytosolic, crude mitochondria and nuclear compartments, with no cross-contamination of mitochondria-associated proteins in the cytosolic fractions (Figures 3B and S7). Cytosolic and nuclear fractions were then used to quantitate the level of DNA containing specific mitochondrial (MT-ND1, D-loop, MT-C02, and MT-ATP6) and nuclear (RPL13A) genes by qPCR. IL-1β-treated cells demonstrated a significant 3-to 6-fold enrichment of mtDNA in the cytosolic fraction compared to mock-treated cells, indicating IL-1β induced the release of mtDNA (Figures 3C and S7). A549 cells treated with IL-1β reached peak enrichment of cytosolic DNA accumulation by 3 h post-treatment, and THP-1 cells demonstrated a bimodal release of mtDNA into the cytoplasm, peaking at 36 h post-treatment (Figure S7). Of note, the mitochondrial intermembrane space-resident protein, cytochrome c, was not detectable in the cytosol upon treatment with IL-1β (Figure S7), which is consistent with IL-1β-mediated release of mtDNA in the absence of cell death. Interestingly, mtDNA detection in the cytosol coincided with a loss of mitochondrial membrane potential and increase in mitochondrial mass, as determined by flow cytometry analysis of JC-1 and Mitotracker Green staining, respectively (Figure 3D).
Figure 3. IL-1R Signaling Induces Release of mtDNA to Initiate Innate Immune Activation.
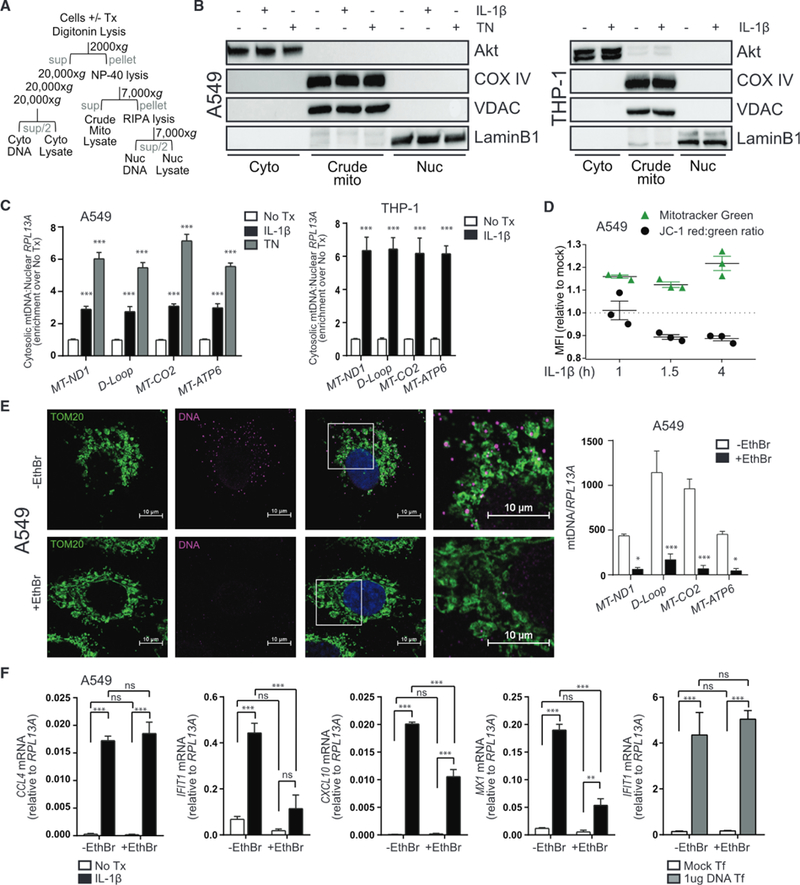
(A) Schematic of cell lysis and centrifugation for subcellular fractionation.
(B) Left: A549 was treated with media, 10 ng/mL IL-1β, or 4 μg/mL tunicamycin (TN) for 3 h before fractionation and protein analysis by immunoblot. Right: THP-1 was treated with media or 10 ng/mL IL-1β for 36 h before fractionation and protein analysis by immunoblot.
(C) Total DNA was harvested from cytosolic and nuclear fractions of A549 (left) or THP-1 (right) treated as in (B) and analyzed by qPCR. Cytosolic mtDNA genes were normalized to respective nuclear RPL13A and presented as fold enrichment over media-treated controls. Statistical analysis was performed using Student’s t test and Holm-Sidak to compare treatments; n = 3 with mean ± SEM.
(D) A549 was treated with media or 10 ng/mL IL-1β for 0.5,1, or 3.5 h before incubation with Mitotracker Green or JC-1 dye for an additional 0.5 h. Cells were analyzed by flow cytometry to determine median fluorescence intensity (MFI) of the indicated dyes; n = 3 with mean ± SEM.
(E) A549 was cultured for 4 days ± ethidium bromide (EthBr) to deplete mtDNA. Left: untreated and treated cells were fixed on coverslips and stained for confocal imaging of mitochondria (TOM20, green) or DNA (magenta). Nuclei were counterstained with DAPI (blue). Right: treated and untreated cells were subjected to total DNA extraction followed by qPCR analysis for quantification of mtDNA genes. Statistical analysis was performed using Student’s t test and Holm-Sidak to compare treatments; n = 4 with mean ± SEM.
(F) EthBr-treated and untreated A549 were exposed to media or 10 ng/mL IL-1β or transfected with 1 μg/mL calf thymus DNA for 6 h before qRT-PCR analysis. Statistical analysis was performed using two-way ANOVA and Bonferroni’s to compare the indicated treatments; n = 4 with mean ± SEM. Cyto, cytoplasm; Mito, mitochondria; Nuc, nucleus; Sup, supernatant; Tf, transfection; *p < 0.05; **p < 0.01; ***p < 0.001. See also Figures S6 and S7.
To determine whether mtDNA served as a DAMP to stimulate STING activation in response to IL-1β, A549 cells were depleted of mtDNA using ethidium bromide to inhibit mtDNA replication (Hashiguchi and Zhang-Akiyama, 2009). After confirming by confocal microscopy and qPCR that ethidium-bromide-treated cells were depleted of mtDNA (Figure 3E), we exposed both treated and untreated cells to IL-1β and examined the induction of NF-κB-and IRF3-responsive genes. mtDNA-deficient cells exposed to IL-1β show a significant reduction in IRF3-responsive genes, although expression of the NF-κB gene, CCL4, was fully induced by IL-1β (Figure 3F). Importantly, mtDNA-deficient cells responded normally to cytosolic DNA treatment, indicating the DNA-sensing pathways were intact.
To examine whether canonical IL-1R signaling via NF-κB contributes to mtDNA release, cells were pretreated with inhibitors of IKKα/β (Figure 4A), IKKβ (Figure 4B), or TBK1/IKKε (Figure 4C) before exposure to IL-1β, subcellular fractionation, and cytosolic mtDNA quantification. All IKKα/β and IKKβ inhibitors reduced pNF-κB, although TBK1/IKKε inhibition had no effect (Figure 4D). Loss of IKKα/β activity resulted in a significant reduction in mtDNA release, coincident with a reduction in plRF3 (Figures 4D and 4E). Use of the TBK1/IKKε inhibitor also reduced mtDNA release, suggesting a dual role for IKKα/β and TBK1/IKKε in this process. Of note, treatment with another NF-κB activator, tumor necrosis factor alpha (TNF-α), induced the release of cytochrome c to the cytosol without detectable enrichment of mtDNA (Figures 4F and 4G). Collectively, these results show that IL-1β induces the release of mtDNA to the cytosol, which can then be detected by cGAS for activation of STING and IRF3.
Figure 4. IL-1β-Induced mtDNA Release Is NF-κB Dependent.
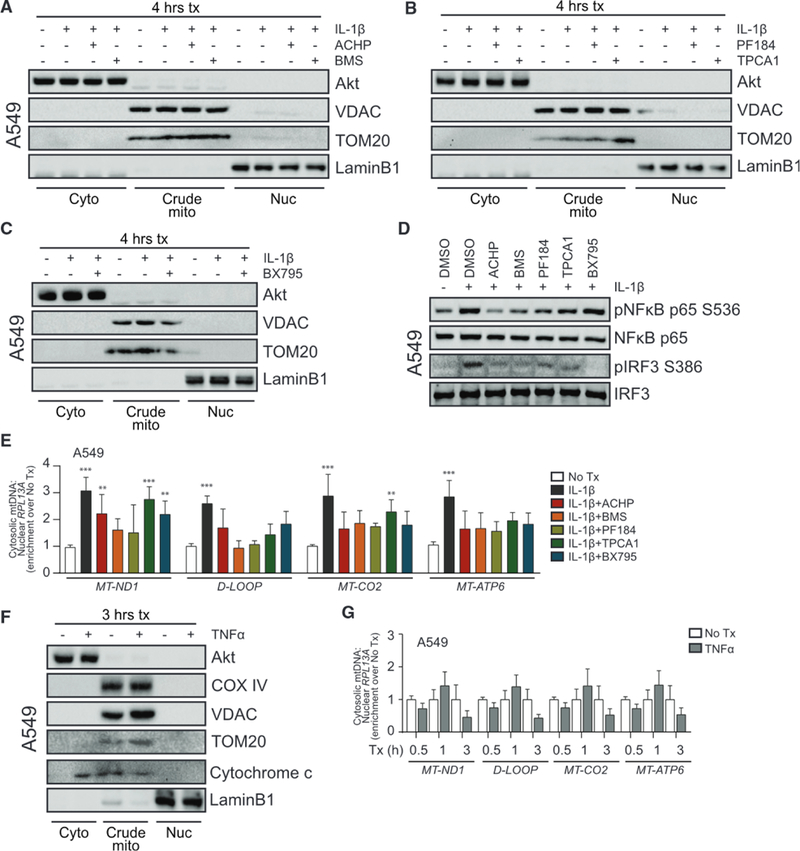
(A) A549 was treated with media (0) or 10 ng/mL IL-1β for 3 h ± 1 h pretreatment with DMSO or 10 μM IKKα/β inhibitor (2-amino-6-[2-(cyclopropylmethoxy)-6-hydroxyphenyl]-4-piperidin-4-yl nicotinonitrile [ACHP] from Bristol-Meyers Squibb [BMS]) before fractionation and protein analysis by immunoblot.
(B) A549 was treated as in (A) with 500 nM IKKβ inhibitor (PF184 and TPCA1).
(C) A549 was treated as in (A) with 1 μM TBK1/IKKε inhibitor (BX795).
(D) A549 was treated with media or 10 ng/mL IL-1β for 3 h ± 1 h pretreatment with DMSO or the indicated inhibitors before protein analysis by immunoblot.
(E) Total DNA was harvested from cytosolic and nuclear fractions of A549 treated as in (A)–(C) and analyzed by qPCR. Cytosolic mtDNA genes were normalized to respective nuclear RPL13A and presented as fold enrichment over media-treated controls. Statistical analysis was performed using two-way ANOVA with Bonferroni’s to compare each treatment to mock; n = 3 with mean ± SEM.
(F) A549 was treated with media or 10 ng/mL TNF-α for 3 h before fractionation and protein analysis by immunoblot.
(G) Total DNA was harvested from cytosolic and nuclear fractions of A549 treated as in (F) and analyzed by qPCR. Statistical analysis was performed using Student’s t test and Holm-Sidak to compare treatments; n = 3 with mean ± SEM. **p < 0.01; ***p < 0.001.
IL-1β Treatment Drives IFN Production and ISG Expression
In line with our observation of IRF3 activation, exogenous IL-1β treatment resulted in the transcriptional induction of IFNB1 and IFNL1 in a STING-and IRF3-dependent manner (Figures 5A and 5B). We also noted a partial role for IRF1 in the induction of these transcripts. Peak IFN expression after 3 h of IL-1β treatment in A549 cells is consistent with our observation of ISG expression at 3–6 h in these cells (see Figures 1B and S2B; Table S1). Immunoblot analysis of STAT1 and STAT2 revealed IL-1β-induced phosphorylation at activating residues in A549 and THP-1 cells, albeit with differing kinetics in each (Figure 5C). To affirm that pSTAT in IL-1β-treated cells was occurring in response to IFN3 production, cells were co-treated with IL-1β and neutralizing antibody against IFNαβ receptor 2 (IFNAR2). Treatment with neutralizing antibody reduced but did not fully prevent IL-1β-induced pSTAT1, although pSTAT2 was completely inhibited (Figure 5D). IFNAR2 neutralization completely ablated pSTAT in control cells co-treated with LPS. We also found that IFNAR1-deficient A549 cells treated with IL-1β completely lost IFIT1 and MX1 induction and exhibited a partial reduction in CCL4 and CXCL10 expression compared to control cells (Figure 5E). Thus, IL-1β drives mtDNA DAMP accumulation to activate cGAS-STING for the production of IFN, modulation of STAT activity, and expression of ISGs.
Figure 5. IL-1β Treatment Drives IFN Production and ISG Expression.
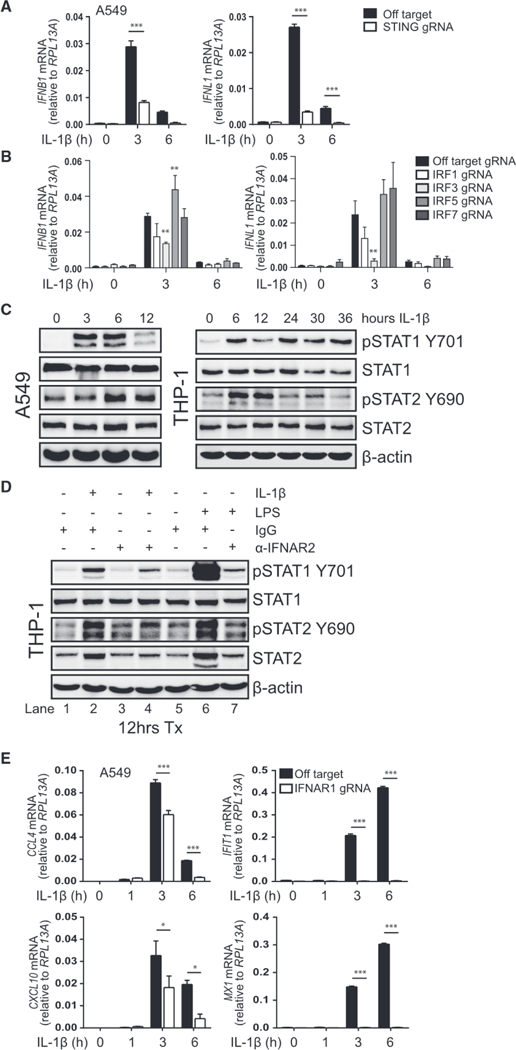
(A) A549 transduced with lentiCRISPR/Cas9 and off-target gRNA or STING-gRNA was treated with media (0) or 10 ng/mL IL-1β for 3–6 h before qRT-PCR analysis. Statistical analysis was performed using Student’s t test and Holm-Sidak to compare genotypes; n = 3 with mean ± SEM.
(B) A549 transduced with lentiCRISPR/Cas9 and off-target gRNA or IRF1-, IRF3-, IRF5-, or IRF7-gRNA was treated with media (0) or 10 ng/mL IL-1β for 3–6 h before qRT-PCR analysis. Statistical analysis was performed using two-way ANOVA with Dunnett’s to compare knockouts to control cells; n = 3 with mean ± SEM.
(C) A549 (left) or THP-1 (right) was treated with media (0) or 10 ng/mL IL-1β for the indicated time before protein analysis by immunoblot; n = 2 (A549) or n = 3 (THP-1).
(D) THP-1 was treated with media, 10 ng/mL IL-1β, or 0.5 μg/mL LPS in the presence of 0.5 μg/mL immunoglobulin G (IgG) control or 0.5 μg/mL anti-IFNAR2 for 12 h before protein analysis by immunoblot, n = 2. Lanes 1 and 5 are redundant.
(E) A549 transfected with CRISPR/Cas9 and off-target gRNA or IFNAR1-gRNA was treated with media (0) or 10 ng/mL IL-1β for 1–6 h before qRT-PCR analysis. Statistical analysis was performed using Student’s t test and Holm-Sidak to compare genotypes; n = 3 with mean ± SEM. *p < 0.05; **p < 0.01; ***p < 0.001.
Synergistic Response to IL-1β and PAMPs
As IL-1β is produced in response to inflammatory stimuli, including microbial infection (Jorgensen and Miao, 2015), the release of IL-1β may serve to prime or amplify IRF3-directed immune responses against pathogens. We therefore assessed the response to various PAMPs in combination with IL-1β to examine how IL-1β modulates pathogen recognition and response. We found that, although IL-1β alone induces low levels of antiviral gene expression, IL-1β treatment in combination with PAMP activates NF-κB and IRF3 signaling at levels significantly above an additive response to IL-1β or PAMP. This innate activation synergy is observed when IL-1β treatment accompanies stimulation with cytosolic RNA, which signals through MAVS; cGAMP, which signals through STING; and LPS, which signals through TRIF (Figure 6A).
Figure 6. Synergistic Response to IL-1β and PAMPs.
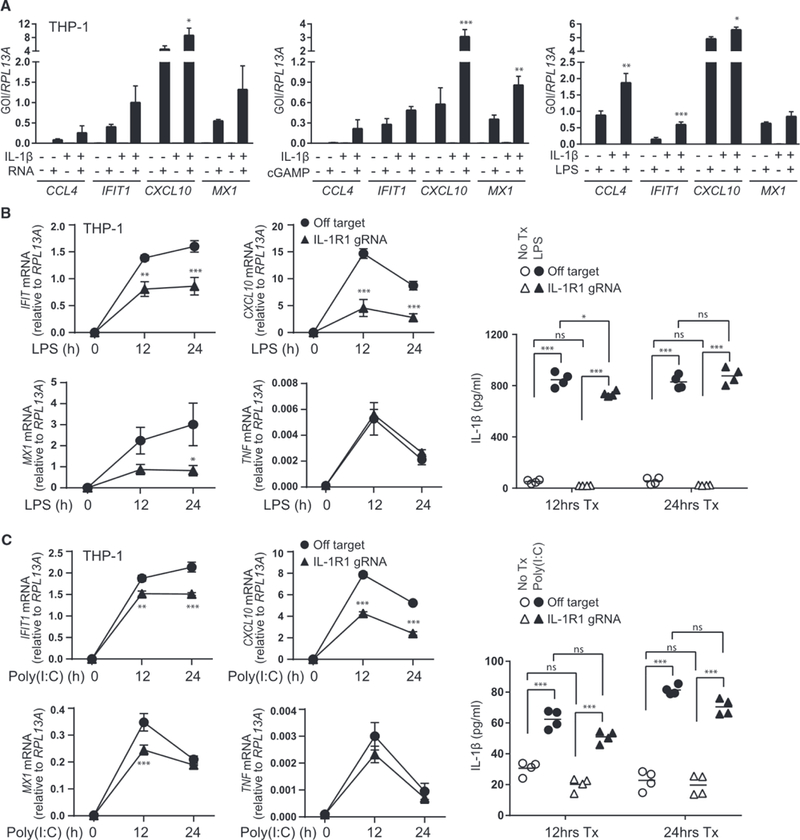
(A) THP-1 was treated with media or 10 ng/mL IL-1β for 30 h before the addition of media or 0.1 μg/mL PAMP RNA (left, transfected), 25 μg/mL cGAMP (middle, exogenous), or 0.5 μg/mL LPS (right) for 6 h followed by qRT-PCR analysis. Statistical analysis was performed using one-way ANOVA and Holm-Sidak to compare the sum of monotreatments to cotreatment; n = 4 (PAMP RNA) or n = 3 (cGAMP and LPS) with mean ± SEM.
(B and C) THP-1 transduced with lentiCRISPR/Cas9 and off-target gRNA or IL-1R1-gRNA was treated with media (0) or 0.5 μg/mL LPS (B) or transfected with 1 μg/mL poly(l:C) (C) for 12–24 h. Left: the indicated transcripts were analyzed by qRT-PCR. Statistical analysis was performed using Student’s t test and Holm-Sidak to compare genotypes, n = 4 with mean ± SEM. Right: cell-free supernatants were analyzed for IL-1β secretion by ELISA. Statistical analysis was performed using two-way ANOVA and Bonferroni’s to compare the indicated treatments; n = 4 with mean indicated. GOI, gene of interest; *p < 0.05; **p < 0.01; ***p < 0.001.
To evaluate how IL-1R imparts regulation of innate immune signaling when both IL-1β and IFN are induced by microbial products, we examined the response to PAMPs that induce both cytokines in IL-1R1-sufficient or deficient macrophages. Expression of IRF3-and IFN-responsive genes driven by LPS (Figure 6B) or cytosolic poly(l:C) (Figure 6C) were significantly reduced in the absence of IL-1R1, despite the production of comparable amounts of IL-1β. Notably, TNF expression, which is not regulated by IRF3, was not affected by the absence of IL-1R1. These results demonstrate that IL-1R signaling is required for maximal IRF3-mediated immune activation against PAMPs that induce both IL-1β and IFN. These actions are consistent with observations that IL-1β enhances the innate response against West Nile virus infection in vivo and in vitro (Aarreberg et al., 2018; Ramos et al., 2012).
IL-1β-cGAS-STING-IRF3 Axis Restricts Dengue Virus Infection
RNA viruses produce no DNA intermediate but have been shown to be sensitive to STING signaling (Aguirre and Fernandez-Sesma, 2017; Ishikawa et al., 2009; Sun et al., 2017). To examine this newly defined IL-1β-cGAS-STING-IRF3 innate immune program in the control of viral infection, we assessed this pathway in dengue virus 2 (DENV-2) infection. In particular, DENV-2 induces both IL-1β production and STING signaling linked with the accumulation and sensing of mtDNA DAMPs (Aguirre and Fernandez-Sesma, 2017; Sun et al., 2017; Wu et al., 2013). Exposure of A549 cells to IL-1β before infection was protective against DENV-2, as indicated by reduced infectious virus production at 24 and 48 h post-infection (Figure 7A). IL-1β-mediated protection against DENV-2 infection was comparable to IFN pretreatment at 24 h but was less effective by 48 h, confirming the importance of this signaling axis in early viral control. Of note, pretreatment with either cytokine was slightly cytoprotective at 24 h post-infection, but cell death was comparable between all groups by 48 h post-infection, despite the reduction in infectious virus production with cytokine pretreatment (Figure 7B). Cells that were responsive to IL-1β showed a 45%–70% reduction in viral RNA and a large reduction in viral E protein production, although the protective effect of IL-1β was completely absent in IL-1R1-or STING-deficient cells (Figure 7C). Importantly, primary human moDCs pretreated with IL-1β and infected with DENV-2 showed a reduction in viral E protein production at 24 and 48 h post-infection compared to nontreated cells (Figure 7D). Treatment with a neutralizing antibody against IL-1R1 in the absence of exogenous IL-1β treatment had little effect on viral production in moDCs, indicating that these cells may not produce high enough IL-1β themselves to mediate protection against DENV-2 infection through IL-1β autocrine signaling in vitro. These data provide evidence for an IL-1β-driven antiviral program that is dependent on the activities of STING, thereby expanding the mechanisms in which the DNA-sensing pathway imparts innate immune protection against RNA virus infection.
Figure 7. IL-1 β-cGAS-STING-IRF3 Axis Restricts Dengue Virus Infection.
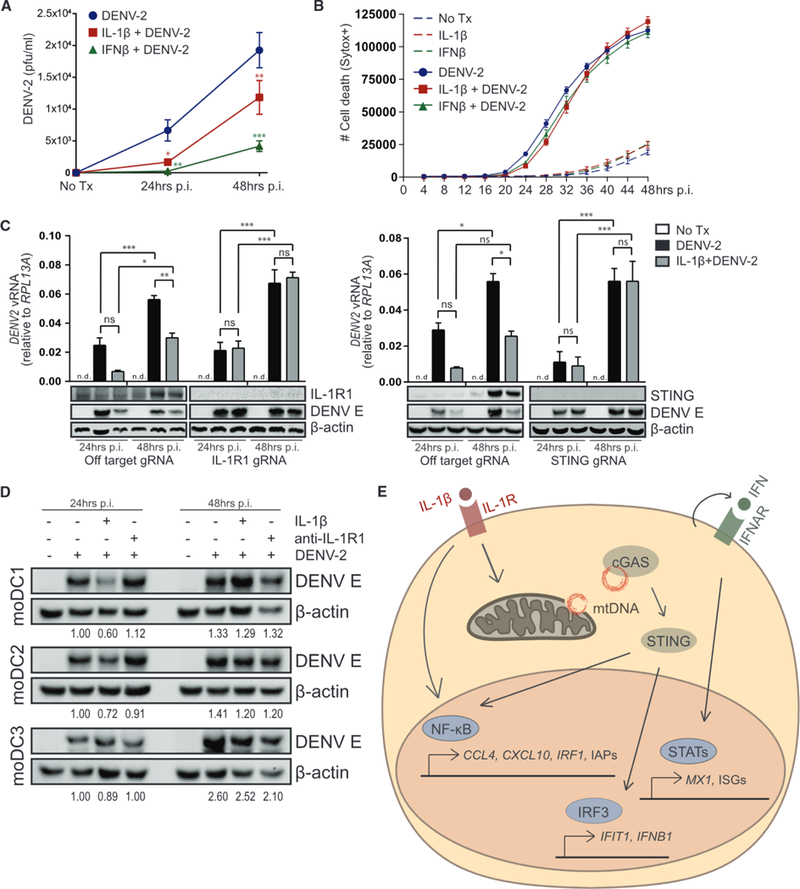
(A) Analysis of DENV-2 infectious virus by plaque assay using cell-free supernatants from A549 pretreated with media, 10 ng/mL IL-1β, or 50 lU/mL IFNβ for 6 h before DENV-2 infection for 24–48 h (MOI = 0.5). Statistical analysis was performed using two-way ANOVA and Bonferroni’s to compare media to cytokine pretreatment; n = 3 with mean ± SEM.
(B) A549 pretreated with media, 10 ng/mL IL-1β, or 50 lU/mL IFNβ for 6 h were mock or DENV-2 infected (MOI = 0.5) and imaged by IncuCyte live-cell imaging to quantify cell death over 48 h. Data represent technical triplicates with mean ± SEM.
(C) A549 transduced with lentiCRISPR/Cas9 and off-target gRNA or IL-1R1-gRNA (left) or STING-gRNA (right) was pretreated with media or 10 ng/mL IL-1β for 6 h before DENV-2 infection for 24–48 h (MOI = 0.5). (Upper) Viral RNA was analyzed by qRT-PCR. Statistical analysis was performed using two-way ANOVA and Bonferroni’s to compare the indicated treatments; n = 5 (IL-1R1) or n = 3 (STING) with mean ± SEM. (Lower) Protein analysis by immunoblot is shown; n = 3 (IL-1 R1) or n = 2 (STING). (D) Primary human moDCs were pretreated with media or 10 ng/mL IL-1β for 6 h before DENV-2 infection (MOI = 1). 2 h post-adsorption, media were replaced ±1 μg/mL anti-IL-1R1. Protein analysis by immunoblot 24–48 h p.i. DENV E was normalized to actin and quantified relative to 24 h DENV-2 infection; n = 3. (E) Model of IL-1β-cGAS-STING-IRF3 axis in which IL-1R signaling leads to the cytosolic release and detection of mtDNA, activation of STING and IRF3, and downstream production and response to IFN. pfu, plaque forming unit; p.i., post-infection; vRNA, viral RNA; *p < 0.05; **p < 0.01; ***p < 0.001.
DISCUSSION
Inflammasome activation and the synthesis of IL-1β are common features of the immunological response to bacterial and viral infections (Mayer-Barber and Yan, 2017). Immune protection provided by IL-1β has commonly been attributed to cell-extrinsic mechanisms, such as the recruitment and activation of neutrophils and lymphocytes or the production of acute phase proteins that mediate antimicrobial defense (Dinarello, 2009; Sims and Smith, 2010). Few studies have focused on IL-1R signaling in the initiation of cell-intrinsic defense (Co-penhaver et al., 2015; Mayer-Barber et al., 2014; Orzalli et al., 2018). Our observations support a model in which IL-1R signaling initiates innate defense programs through a cGAS-STING-IRF3 axis to drive the expression of IRF-and IFN-responsive genes (see Figures 1, 5, 7E, and S2B). Importantly, we have demonstrated a cell-intrinsic, antiviral effect of IL-1β against dengue virus (see Figure 7). Dengue was of interest in this study due to its known induction of IL-1β, as well as its proven antagonism of cGAS, STING, and the IFN pathway (Aguirre and Fernandez-Sesma, 2017; Wu et al., 2013). Our study is consistent with the concept that indirect sensing of viral infection is a critical component of innate immune defense. Moreover, synergy of IL-1β and IFN in bystander cells can be essential to overcome pathogen subversion of innate immune signaling and suppress viral spread.
Although our data demonstrate that IL-1β induces IRF3 activation in cells of myeloid, stromal, and epithelial origin, this program is not universal across all cell types. Liu et al. (2015) did not observe plRF3 in mouse embryonic fibroblasts (MEFs) treated with IL-1β for 15 min, and Orzalli et al. (2018) did not observe appreciable ISG expression in MEFs treated with IL-1β for 3 or 6 h. In contrast, a report by Rivieccio et al. (2005) showed that cultured human fetal astrocytes respond to IL-1β with IRF3 activation and relocalization to the nucleus and induction of ISGs. It remains to be seen whether the IL-1β-induced pathway in astrocytes is STING dependent. Additionally, Orzalli et al. (2018) recently defined an IRF1-dependent antiviral program elicited by IL-1R signaling in primary human fibroblasts and endothelial cells. Cells with demonstrable IL-1R-to-IRF signaling, including epithelial cells, fibroblasts, and myeloid cells, provide important protection at barrier surfaces, and this may prove to be a critical process of innate immune protection and immune priming at these sites. The differential kinetics of response to IL-1β is also of interest, as epithelial and fibroblast cells demonstrate early IRF3 activation and ISG expression and myeloid cells have a delayed response that builds over time (see Figure 1). Although we cannot discount the contribution of newly synthesized cytokines and growth factors, we demonstrate a marked requirement for cGAS, STING, TBK1, and IRF3 in the THP-1 macrophage response to IL-1β at 36 h.
Some evidence exists for infection-independent, inflammation-directed cytokine crosstalk. Yarilina et al. (2008) characterized a TNF-IRF1-IFN signaling loop in which the inflammatory cytokine TNF induces and synergizes with autocrine IFN to initiate expression of ISGs. In contrast to our data, which support a partial role for IRF1 and a primary role for IRF3 in IL-1β-induced ISG production in a range of cell types (see Figures S3 and 5), Yarilina et al. emphasize that IRF1 is the chief driver of TNF-mediated ISG expression. However, their study also showed plRF3 in human monocytes and a partial dependence on IRF3 for ISG expression in bone-marrow-derived macrophages treated with TNF. In the report by Orzalli et al. (2018), IL-1-induced ISG expression is shown to be IRF1 dependent yet occurs independent of TNF. These data warrant further investigation into whether and how IL-1 and TNF signaling may converge on IRF activation. These studies and our current study support a model of innate immune defense, in which inflammatory cues prime cells for detection and response to invading pathogens and DAMPs by inducing PRRs, their key signaling molecules, and antimicrobial effector genes.
PAMP recognition and cytokine signaling do not act in isolation in vivo such that integrative signaling can have important effects on disease outcome. Here, we have described a synergistic response to IL-1β and diverse PAMPs, with differential effects on NF-κB and IRF signaling (see Figure 6). Although we reveal a protective role of IL-1β in cytokine crosstalk against flavivirus infection, we acknowledge also that both IL-1β and IFN are implicated in autoimmune disorders in which chronic cytokine production is linked with inflammatory disease and interferonopathies (Crow, 2011; Hall and Rosen, 2010). Indeed, anti-IL-1β treatment has been effective against several autoimmune disorders (Lopalco et al., 2015), but the specific influence of IL-13 β on the dysregulation of IFN has not been investigated in this context. Of note, hyperactivity of STING is implicated in several autoinflammatory diseases (Ahn et al., 2012; Gall et al., 2012; Gao et al., 2015; Jeremiah et al., 2014). Our identification of another mechanism of STING activation will be important in understanding autoinflammatory disorders for which the etiology is not fully defined.
IL-1β and stress-associated DAMPs can serve to contextualize stimuli perceived by the cell and ultimately direct defensive or repair responses (Brubaker et al., 2015). We and others have shown that mitochondria are an important source of cellular DAMPs, and the detection of such initiates critical innate immune signaling programs (see Figures 3, 4, and S7; Krysko et al., 2011; Rongvaux et al., 2014; West et al., 2015; White et al., 2014). Although our study demonstrates that IL-1β-driven IRF3 activation is dependent upon cytosolic detection of mtDNA, we note that the mechanism by which mtDNA is liberated is not yet known. Mitochondrial outer membrane permeabilization (MOMP) can result in the release of intermembrane space proteins and the initiation of intrinsic apoptosis (Tait and Green, 2013). Two groups demonstrated that MOMP also allows for mtDNA release into the cytosol, which, in the absence of apoptotic caspase activation, is detected by cGAS for activation of STING (Rongvaux et al., 2014; White et al., 2014). Interestingly, our scRNA-seq analysis predicts that Forkhead box O3 (FOXO3) is activated upon IL-1β treatment; F0XO3 has been shown to induce transient MOMP, thus linking possible MOMP production with mtDNA release (see Figure S2C; Hagenbuchner and Ausserlechner, 2013). Our study suggests that IL-1β can augment mitochondrial mass, decrease mitochondrial membrane potential, and induce mtDNA release without detectable cytochrome c release or cell death (see Figures 3, S6, and S7). Indeed, limited mitochondrial permeabilization can occur without triggering cell death (Ichim et al., 2015; Minamikawa et al., 1999; Tait and Green, 2013). In our model, we might expect that IL-1R signaling results in NF-κB-dependent upregulation of inhibitor of apoptosis proteins (lAPs) to promote cell survival (Stehlik et al., 1998; Wang et al., 1998). In fact, we found several anti-apoptotic genes to be upregulated by exogenous IL-1β (see Figure S2B; Table S1). Whether and how IL-1β may initiate MOMP still need to be resolved.
In conclusion, we have described a mechanism in which IL-1β signaling drives mtDNA release and detection by the cytosolic DNA sensor cGAS for activation of STING and IRF3. Resultant signaling leads to the synthesis and autocrine response to IFN for the basal elevation of ISGs. In addition to the production of cell-autonomous defense proteins, the temporary upregulation of PRRs, IRFs, and STATs may sensitize cells for subsequent pathogen detection and response. This report provides mechanistic insight into a stress-induced pathway of STING activation that can restrict microbial infection, shape adaptive immunity, and potentially exacerbate autoinflammatory and autoimmune diseases.
STAR ★METHODS
KEY RESOURCES TABLE
| REAGENT or RESOURCE | SOURCE | IDENTIFIER |
|---|---|---|
| Antibodies | ||
| Rabbit monoclonal anti-plRF3 (S386) | AbCam | Cat# ab76493; RRID:AB_1523836 |
| Mouse monoclonal anti-IRF3 (clone AR-1) | In-house | Rustagi et al. (2013) |
| Rabbit polyclonal anti-IFIT1 (971) | In-house | N/A |
| Mouse monoclonal anti-Actin (clone C4) | Millipore | Cat# MAB1501; RRID:AB_2223041 |
| Rabbit monoclonal anti-IRF1 | Abeam | Cat# 186384; RRID:AB_2737059 |
| Rabbit polyclonal anti-IRF5 | Bethyl | Cat# A303–386A; RRID:AB_10952692 |
| Rabbit polyclonal anti-IRF7 | Cell Signaling Technology | Cat# 13014; RRID:AB_2737060 |
| Rabbit monoclonal anti-pNFkB p65 (S536) | Abeam | Cat# ab76302; RRID: AB_1524028 |
| Mouse monoclonal anti-NFkB p65 | Cell Signaling Technology | Cat# 6956; RRID:AB_10828935 |
| Rabbit monoclonal anti-pTBK1 (S172) | Cell Signaling Technology | Cat# 5483; RRID:AB_10693472 |
| Rabbit anti-TBK1 (89246) | Provided by Dr. Tom Maniatis | N/A |
| Rabbit monoclonal anti-plKKe (S172) | Cell Signaling Technology | Cat# 8766; RRID:AB_2737061 |
| Mouse monoclonal anti-IKKe | IMGENEX | Cat# IMG-270A; RRID:AB_316980 |
| Rabbit polyclonal anti-MAVS | Enzo Life Sciences | Cat# ALX-210–929; RRID:AB_10541431 |
| Rabbit monoclonal anti-STING | Cell Signaling Technology | Cat# 13647; RRID:AB_2732796 |
| Rabbit anti-TRIF | Cell Signaling Technology | Cat# 4596S; RRID:AB_2256555 |
| Rabbit monoclonal anti-cGAS | Cell Signaling Technology | Cat# 15102; RRID:AB_2732795 |
| Rabbit anti-pSTING (S366) | Cell Signaling Technology | Cat# 19781; RRID:AB_2737062 |
| Rabbit anti-STING (IF) | Provided by Dr. Glen Barber | N/A |
| Rabbit polyclonal anti-Akt | Cell Signaling Technology | Cat# 9272; RRID:AB_329827 |
| Mouse monoclonal anti-COX IV | Thermo Fisher Scientific | Cat# 459600; RRID:AB_2532240 |
| Rabbit polyclonal Anti-VDAC | Abeam | Cat# ab15895; RRID:AB_2214787 |
| Mouse monoclonal anti-LaminB1 | Santa Cruz Biotechnology | Cat# sc-374015; RRID:AB_10947408 |
| Mouse monoclonal anti-TOM20 | Santa Cruz Biotechnology | Cat# sc-17764; RRID:AB_628381 |
| Mouse monoclonal anti-Cytochrome c (6H2.B4) | Thermo Fisher Scientific | Cat# MA1 −12882; RRID:AB_1073967 |
| Mouse monoclonal anti-DNA | Millipore | Cat# CBL186; RRID:AB_93367 |
| Rabbit monoclonal anti-pSTAT1 (Y701) | Cell Signaling Technology | Cat# 9167; RRID:AB_561284 |
| Rabbit polyclonal anti-STAT1 | Cell Signaling Technology | Cat# 9172; RRID:AB_2198300 |
| Rabbit polyclonal anti-pSTAT2 (Y690) | Millipore | Cat# 07–224; RRID:AB_2198439 |
| Mouse monoclonal anti-STAT2 | Abeam | Cat# ab106094; RRID:AB_10934082 |
| Mouse monoclonal anti-IL1R1 | Santa Cruz Biotechnology | Cat# sc-393998; RRID:AB_2737063 |
| Mouse monoclonal anti-Flavivirus E protein (4G2) | In-house purification from D1 – 4G2–4-15 mouse hybridoma | See below, Cell lines |
| Mouse monoclonal anti-IFNAR2 | R&D Systems | Cat# 21385–1; RRID:AB_354167 |
| IgG Isotype control | Sigma Aldrich | Cat# M5284; RRID:AB_1163685 |
| Goat polyclonal anti-IL1R1 | R&D Systems | Cat# AF269; RRID:AB_355286 |
| Bacterial and Virus Strains | ||
| Dengue virus type 2 New Guinea C | This paper | N/A |
| Biological Samples | ||
| Human peripheral blood | N/A | N/A |
| Human foreskin fibroblasts | Provided by Dr. Daniel Stetson | N/A |
| Chemicals, Peptides, and Recombinant Proteins | ||
| Recombinant human IL-1β | Enzo Life Sciences | Cat# ALX-520–001-C010 |
| Recombinant human IFNβ | Provided by Toray Industries | N/A |
| Recombinant human TNFα | Peprotech | Cat# AF-300–01 AB |
| ACHP | Tocris | Cat# 4547 |
| BMS | Tocris | Cat# 4806 |
| PF184 | Tocris | Cat# 4238 |
| TPCA1 | Tocris | Cat# 2559 |
| BX795 | Invivogen | Cat# tlrl-bx7 |
| Cyclohexamide solution | Sigma Aldrich | Cat# C4859 |
| SytoGreen fluorescent nucleic acid stain | ThermoFisher | Cat# S7559 |
| SytoxGreen nucleic acid stain | ThermoFisher | Cat# S7020 |
| Recombinant human IL-4 | Peprotech | Cat# 200–04 |
| Recombinant human GM-CSF | Peprotech | Cat# 300–03 |
| LPS from S. abortus equi | Adipogen | Cat# IAX-100–009-M001 |
| cGAMP | Provided by Dr. Pingwei Li | N/A |
| HCV PAMP RNA | In-house | N/A |
| Calf Thymus DNA | Thermo Fisher | Cat# 15633–019 |
| Poly(l:C) | Invivogen | Cat# Tlrl-picb |
| Tunicamycin | Sigma | Cat# T7765 |
| ATP disodium salt solution | Sigma | Cat# A6559 |
| RIPA Buffer | Sigma | Cat# R0278 |
| Protease Inhibitor Cocktail | Sigma | Cat# P8340 |
| Phosphatase Inhibitor Cocktail | VWR | Cat# 80501–130 |
| Okadaic Acid | Fisher Scientific | Cat# 49–560-4100UG |
| JC-1 Dye (Mitochondrial membrane potential probe) | Invitrogen | Cat# T-3168 |
| MitoTracker Green FM | Invitrogen | Cat# M-7514 |
| Critical Commercial Assays | ||
| Human IL-1β ELISA MAX | Biolegend | Cat# 437005 |
| In-Fusion HD Cloning Kit | Clontech | Cat# 638909 |
| ProFection Mammalian Transfection System | Promega | Cat# E1200 |
| Lipofectamine 3000 | ThermoFisher | Cat# L3000008 |
| TranslT-LT1 Transfection Reagent | Mirus | Cat# MIR2304 |
| iScript cDNA synthesis kit | BioRad | Cat# 1708897BUN |
| SYBR Green PCR Master Mix | ThermoFisher | Cat# 4312704 |
| ECL prime western blotting reagent | Fisher Scientific | Cat# RPN2232 |
| Neutral Red | Sigma | Cat# N2889 |
| GE Healthcare Ficoll-Paque PLUS Media | Fisher Scientific | Cat# 17144002 |
| SureCell WTA 3′ Library Prep Kit for the ddSEQ system | Illumina | Cat# 20014279 |
| QIAmp DNA Mini kit | QIAGEN | Cat# 51306 |
| Deposited Data | ||
| Raw and analyzed scSeq data | This paper | GEO: GSE120269 |
| All source images, Mendeley data | This paper | https://d0i.0rg/d0i:10.17632/sr2stby4yh.1 |
| Experimental Models: Cell Lines | ||
| A549 | ATCC | Cat# CCL-185; RRID:CVCL_0023 |
| THP-1 | ATCC | Cat# TIB-202; RRID:CVCL_0006 |
| HEK293T | ATCC | Cat# CRL-3216; RRID:CVCL_0063 |
| Vero | ATCC | Cat# CRL-1586; RRID:CVCL_0574 |
| D1–4G2–4-15 mouse hybridoma | ATCC | Cat# HB-112; RRID:CVCL_J890 |
| A549 off-target gRNA (GACGGAGGCTAAGCGTCGCAA) | This paper | N/A |
| A549 IRF1 gRNA1 (GCTCAGCTGTGCGAGTGTAC) | This paper | N/A |
| A549 IRF3 gRNA1 (GAGGTGACAGCCTTCTACCG) | This paper | N/A |
| A549 IRF5 gRNA1 (AGGGCTTCAGCCGCACGCGG) | This paper | N/A |
| A549 IRF7 gRNA1 (TACACCTTGTGCGGGTCGGC) | This paper | N/A |
| A549 STING gRNA57 (TTTCAACGTGGCCCATGGGC) | This paper | N/A |
| A549 IL1R1 gRNA3 (GTTTGTGTTGATGAATCCTGG) | This paper | N/A |
| A549 IFNAR1 gRNA1 (GACCCTAGTGCTCGTCGCCG) | Provided by Dr. Ram Savan | N/A |
| THP-1 IL1R1 gRNA3 (GTTTGTGTTGATGAATCCTGG) | This paper | N/A |
| THP-1 IRF1 gRNA1 (GCTCAGCTGTGCGAGTGTAC) | Provided by Dr. DeFilippis | N/A |
| THP-1 IRF3 gRNA1 (GAGGTGACAGCCTTCTACCG) | Provided by Dr. DeFilippis | N/A |
| THP-1 IRF5 gRNA1 (AGGGCTTCAGCCGCACGCGG) | Provided by Dr. DeFilippis | N/A |
| THP-1 IRF7 gRNA1 (TACACCTTGTGCGGGTCGGC) | Provided by Dr. DeFilippis | N/A |
| THP-1 MAVS gRNA4 (GTCCTGCTCCTGATGCCCGC) | Provided by Dr. Daniel Stetson | N/A |
| THP-1 STING gRNA15 (GGTGCCTGATAACCTGAGTA) | Provided by Dr. Daniel Stetson | N/A |
| THP-1 TRIF gRNA2 (GGCATTGAAGGCCGATGCGG) | This paper | N/A |
| THP-1 cGAS gRNA | Provided by Dr. Daniel Stetson | N/A |
| Oligonucleotides | ||
| Primer Human CCL4 | QIAGEN | Cat# PPH00563A |
| Primer Human IFIT1 | QIAGEN | Cat# PPH01332F |
| Primer Human CXCL10 | QIAGEN | Cat# PPH00765E |
| Primer Human MX1 | QIAGEN | Cat# PPH01325A |
| Primer Human TNF | QIAGEN | Cat# PPH00341F |
| Primer Human IFNB1 | QIAGEN | Cat# PPH00384F |
| Primer Human IFNL1 | QIAGEN | Cat# PPH05849A |
| Primer Human RPL13A Fwd (GCCCTACGACAAGAA AAAGCG) |
https://pga.mgh.harvard.edu/ primerbank/index.html |
PrimerBank ID 14591905c2 |
| Primer Human RPL13A Rev (TACTTCCAGCCAACCTCGTGA) |
https://pga.mgh.harvard.edu/ primerbank/index.html |
PrimerBank ID 14591905c2 |
| See Table S2 for additional oligonucleotides | ||
| Recombinant DNA | ||
| pRRL-Cas9-Puro | Provided by Dr. Daniel Stetson | N/A |
| psPAX2 | Provided by Dr. Daniel Stetson | N/A |
| pVSV-G | Provided by Dr. Daniel Stetson | N/A |
| Off-target gRNA (GACGGAGGCTAAGCGTCGCAA) | Provided by Dr. Daniel Stetson | N/A |
| IRF1 gRNA1 (GCTCAGCTGTGCGAGTGTAC) | Provided by Dr. DeFilippis | N/A |
| IRF3 gRNA1 (GAGGTGACAGCCTTCTACCG) | Provided by Dr. DeFilippis | N/A |
| IRF5 gRNA1 (AGGGCTTCAGCCGCACGCGG) | Provided by Dr. DeFilippis | N/A |
| IRF7 gRNA1 (TACACCTTGTGCGGGTCGGC) | Provided by Dr. DeFilippis | N/A |
| STING gRNA15 (GGTGCCTGATAACCTGAGTA) | Provided by Dr. Daniel Stetson | N/A |
| STING gRNA57 (TTTCAACGTGGCCCATGGGC) | Provided by Dr. Daniel Stetson | N/A |
| IL1R1 gRNA3 (GTTTGTGTTGATGAATCCTGG) | This paper | N/A |
| MAVS gRNA4 (GTCCTGCTCCTGATGCCCGC) | Provided by Dr. Daniel Stetson | N/A |
| TRIF gRNA2 (GGCATTGAAGGCCGATGCGG) | This paper | N/A |
CONTACT FOR REAGENT AND RESOURCE SHARING
Further information and requests for resources and reagents should be directed to and will be fulfilled by the Lead Contact, Michael Gale, Jr. (mgale@uw.edu).
METHOD DETAILS
Cells and virus
A549, THP-1, HEK293T and Vero cells were obtained from the American Type Culture Collection (ATCC). TERT-immortalized human foreskin fibroblasts were provided by Dr. Daniel Stetson (University of Washington). THP-1 cells were cultured in RPMI medium supplemented with 10% heat-inactivated fetal bovine serum (HI-FBS), 2mM L-glutamine, 1 mM sodium pyruvate, 1x nonessential amino acids and antibiotic-antimycotic solution (Fisher), while all other cells were cultured in Dulbecco’s modified Eagle medium (DMEM) supplemented as above. THP-1 monocytes were differentiated to macrophages in 40nM PMA (Sigma) for 36 h and rested for 36 h without PMA before experiments were performed. Human whole blood was collected from six independent donors using an IRB-approved protocol. Whole blood was centrifuged using Ficoll-Paque PLUS (Fisher) to obtain peripheral blood mononuclear cells (PBMCs). 6–10×106 PBMCs were rested in 15cm non-TC-treated plates (VWR) for 2 h. After 2 h, non-and semi-adherent cells were collected and cultured in complete RPMI medium supplemented with 50ng/ml GM-CSF and 100ng/ml IL-4 (Peprotech) for 6 days, replacing 2/3 media with complete RPMI+GM-CSF+IL-4 every other day to prepare monocyte-derive dendritic cells (MoDC). On day 6, MoDC were collected by gently scrapping. Cells were counted and seeded at 1×10⁶/ml with the indicated treatments. Dengue virus type 2 New Guinea C (DENV-2) was propagated on Vero cells (MOI = 0.05) for 5 days before cell-free supernatants were aliquoted and frozen at −80C. Thawed aliquots were used to determine viral titer by plaque assay on Vero cells.
Cell treatment and analysis
Recombinant human IL-1β (Enzo Life Sciences) was reconstituted in sterile water at 100ug/ml and used at 10ng/ml unless otherwise indicated. ACHP (Tocris) was reconstituted in DMSO at 20mM and used at 10uM. BMS (Tocris) was reconstituted in DMSO at 100mM and used at 10uM. BX795 (Invivogen) was reconstituted in DMSO at 10mM and used at 1uM. PF184 (Tocris) was reconstituted at 100mM and used at 0.5uM. TPCA1 (Tocris) was reconstituted at 100mM and used at 0.5uM. Tunicamycin (Sigma) was reconstituted in DMSO at 10mg/ml and used at 4ug/ml. HCV polyU/UC PAMP RNA was synthesized via in vitro transcription (Saito et al., 2008) and transfected at 0.1ug/ml using TranslT-LT1 Transfection Reagents (Mirus). cGAMP was a kind gift from Pingwei Li (Texas A&M University), reconstituted in sterile water at 1 mg/ml and used exogenously at 25ug/ml (THP-1) or transfected at 10ug/ml using Lipofectamine 3000 reagents (A549, HFF). Calf thymus DNA solution (ctDNA, Life Technologies) was transfected at 1 ug/ml using Lipofectamine 3000 reagents (ThermoFisher). LPS (Adipogen) was used on its own at 0.5ug/ml or in combination with 1 mM ATP (Sigma). TNFα (Peprotech) was used on its own at 10ng/ml or in combination with 10uM Cyclohexamide (Sigma). Anti-IFNAR2 antibody (R&D Systems) was used to neutralize IFNα/β at 0.5ug/ml or mouse IgG (Sigma) was used as a control antibody at 0.5ug/ml. Recombinant human IFNβ (gift from Toray Industries, Japan) was used at 50,100 or 1000IU/ml. Anti-IL-1R1 antibody (R&D Systems) was used to at 1 ug/ml to neutralize endogenous IL-1. JC-1 (Invitrogen) was reconstituted at 5mM and used at 2.5uM. Mitotracker Green (Invitrogen) was reconstituted in DMSO at 1mM and used at 500nM.
LentiCRISPR
For CRISPR-targeting of the indicated genes, DNA oligos containing off target or targeting gRNAs were inserted into a Cas9-t2a-puro pRRL vector using the In-Fusion HD Cloning Kit (Clontech). Lentivirus pseudotyped with vesicular stomatitis virus envelope glycoprotein (VSV-G) was produced by transfection of 2×10⁶ HEK293T cells with the ProFection Mammalian Transfection System (Promega), 6ug gRNA-Cas9-t2a-puro pRRL lentivirus plasmid, 3ug psPAX-2 packaging plasmid and 1.5ug pVSV-G in 10cm plates for 48 h before filtration of infectious supernatants with a 0.45uM filter. Target cells were transduced with the filtered viral supernatants for 24 h, washed and cultured in fresh media for 24 h before selection with 1.5ug/ml Puro (A549) or 5ug/ml Puro (THP-1) for 3–4 days. Targeting was evaluated by immunoblot and ablated signaling downstream of relevant stimuli.
Viral infection and plaque assay
1×10⁵ A549 cells were seeded in 12-well dishes for 36 h before mock or cytokine treatment or 2×10⁶ moDC were seeded in 6-well dishes with mock or cytokine treatment. 6 h post-treatment, media was removed, cells were washed twice with 1x PBS and incubated on a rocker with infectious media (complete DMEM with DENV-2 at MOI = 0.5 for A549 or MOI = 1 for moDC) for 2 h. Infectious media was removed 2 h post-adsorption and cells were incubated with fresh media for 24 or 48 h before collection of infectious supernatants, total RNA or cellular lysates. 1.85×10⁵ Vero cells were seeded in 6-well dishes and mock-or virus-containing supernatants were serially diluted in complete DMEM. Vero cell monolayers were incubated in technical duplicate with dilutions, rocking for 1 h. Cells were overlaid with 1% agarose and 6 days later plaques were visualized with a 1% agarose overlay containing 3.5% Neutral Red.
Immunoblot
Cells were lysed in RIPA buffer (Sigma) with freshly added protease inhibitor cocktail (Sigma), phosphatase inhibitor cocktail (Millipore) and Okadaic acid (Thermo). Lysates were separated on 8% Bis-Acrylamide SDS gels and transferred onto nitrocellulose membranes (Fisher Scientific). Membranes were blocked in Odyssey TBS Blocking Buffer (LI-COR) for 1 h at room temperature (RT) before overnight 4C incubation with primary antibody diluted in blocking buffer. After washing, membranes were incubated for 1 h at RT with HRP-conjugated secondary antibodies diluted in TBS-tween. Membranes were incubated in ECL (Fisher Scientific) and detected using a ChemiDoc XRS+ System (Bio-Rad). Note: for detection of pSTING S366 in HFF or for detection of plRF3 S386 in THP-1, lysates were separated on 8% Bis-Acrylamide SDS gels, transferred onto PVDF membranes (Millipore) and blocked/probed with 4% BSA blocking buffer before incubation with secondary antibody and detection as described above.
qRT-PCR
Total RNA was isolated from cell lysates using the RNeasy Kit (QIAGEN) and digested with DNase I (QIAGEN) on column. 200ng total RNA was subjected to cDNA synthesis using the iScript cDNA Synthesis Kit (BioRad). cDNA was diluted 1:4 in H2O and qPCR was performed using SYBR Select Master Mix (Thermo) and gene specific primers on the ABI 7500 Real-Time PCR System.
Cell death assay
THP-1 macrophages and A549 cells were seeded at 1×10⁵ cells per well in 24-well dishes. 24 h after seeding, cells were treated with 1 ng/ml or 10 ng/ml IL-1β, 0.5ug/ml LPS (Adipogen) in combination with 1 mM ATP (Sigma) to induce pyroptosis, or 10uM Cycloheximide (Sigma) in combination with 10ng/ml TNFα (Peprotech) to induce apoptosis. Alternatively, A549 cells were seeded as above and treated with 10ng/ml IL-1β or 50IU/ml IFNβ for 6 h before infection with DENV-2 (MOI = 0.5). Additionally, cells were treated with 100nM of the green fluorescent nucleic acid stains Syto or Sytox to quantify total number of cells or dead cells, respectively (ThermoFisher). Cells were then imaged with the IncuCyte imaging platform (Essen Bioscience) up to 48 h post-treatment. At every 2 (THP-1) or 4 (A549) h, four images were taken per well. Each treatment was run in triplicate. The ratio of Sytox-Green to Syto-Green counts was used to calculate percent cell death.
Subcellular fractionation
Subcellular fractionation and mitochondrial DNA quantification was adapted from West et al. (2015) as follows: 4×10⁶ THP-1 or 2×10⁶ A549 cells were lysed in 100ul/5×105 cells Digitonin buffer (150mM NaCI, 50mM HEPES pH7.4, 25ug/ml Digitonin, Protease and phosphatase inhibitors) and incubated on a rotator at 4C for 10 min. Samples were centrifuged at 2,000xg for 10 min at 4C. Supernatants were transferred to fresh tubes and centrifuged three times at 20,000xg for 20 at 4C, transferring supernatants to fresh tubes between centrifugation steps to finally yield cytosolic fractions. The cytosolic fraction was split into two tubes (one for total DNA extraction and one for immunoblot analysis). The remaining pellet from the first spin was resuspended in ice-cold PBS to wash away Digitonin buffer. Samples were centrifuged at 2,000xg for 5 min at 4C. Wash was aspirated and samples were resuspended in 100ul/5×105 cells NP-40 buffer (150mM NaCI, 50mM HEPES pH7.4,1% NP-40, protease and phosphatase inhibitors) and incubated on ice for 30 min. Samples were centrifuged at 7,000xg for 10 min at 4C to yield the crude mitochondria fraction for immunoblot analysis. The remaining pellet was resuspended in ice-cold PBS to wash away NP-40 buffer. Samples were split into two tubes (one for total DNA extraction and one for cellular lysates). One tube was centrifuged at 2,000xg for 5 min at 4C. Wash was aspirated and samples were resuspended in 50ul/5×105 cells RIPA buffer (Sigma) to yield nuclear fraction for immunoblot analysis. DNA was subsequently extracted from the appropriate cytosolic and nuclear fractions using the QIAmp DNA Mini Kit (QIAGEN). 2ng cytosolic DNA was used for qPCR analysis of mitochondrial DNA using gene-specific primers (Aguirre et al., 2017); nuclear gene RPL13A was quantified from the respective nuclear fraction for normalization.
Flow cytometry
1×10⁵ A549 cells were seeded in 12-well dishes for 24 h before treatment with media or cytokine. 30 minutes before collection, cells were treated with media containing JC-1 (Invitrogen) or Mitotracker Green (Invitrogen) dye and incubated at 37C. Cells were washed with 1x PBS and trypsinized, followed by another PBS wash before analysis by flow cytometry. Data were acquired using a FACSCanto (BD Biosciences) and analyzed with FlowJo 10.5.0 software.
Mitochondrial depletion
A549 cells were cultured with or without 150ng/ml Ethidium Bromide for 4 days (Hashiguchi and Zhang-Akiyama, 2009). On Day 4, cells were washed with 1x PBS and trypsinized before counting and seeding for stimulation or microscopy. Total DNA was collected by alkaline extraction.
Immunofluorescence
1×10⁵ HFF or A549 cells were seeded on glass coverslips in a 24-well plate. For visualization of STING, 24 h after seeding HFF, cells were treated with media, treated with 10ng/ml IL-1β, transfected with 1ug/ml calf thymus DNA or transfected with 10ug/ml cGAMP for 3 h before fixation with 3% PFA for 15 min at RT. Cells were washed three times with 1x PBS before permeabilization with 0.5% Triton X-100 for 15 min at RT. Cells were washed three times with 1x PBS before blocking with 3% BSA in PBS for 30 min at RT. Cells were stained overnight at 4C with primary rabbit antibody directed against STING (diluted 1:100 in blocking solution). The next day, cells were washed three times with 1x PBS before incubation with FITC-conjugated, anti-Rabbit IgG secondary antibody (Thermo Fisher) for 1 h at RT. Nuclei were counterstain with DAPI (Thermo Fisher). Cells were washed four times with 1x PBS before coverslips were mounted onto glass slides using ProLong Gold (Thermo Fisher). STING slides were blinded before images were taken. Quantification of cells containing STING puncta was performed blinded using ImageJ software. For visualization of mitochondrial DNA, 24 h after seeding A549, cells were fixed with 3% PFA for 15 min. Cells were permeabilized with 0.5% Triton X-100 for 5 min (note the shorter permeabilization to prevent nuclear membrane permeabilization). Cells were washed three times with 1x PBS before blocking with 3% BSA in PBS for 30 min at RT. Cells were stained for 1 h at RT temperature with primary mouse antibodies directed against DNA and TOM20. Cells were washed three times with 1x PBS before incubation with fluorophore-conjugated, isotype specific secondary antibodies (Thermo Fisher) for 1 h at RT. Nuclei were counterstained with DAPI. Cells were washed and mounted as above. Images were acquired with a Nikon Eclipse Ti confocal microscope equipped with a 60x oil immersion objective using the Nikon confocal software. Images were merged and processed using the Nikon confocal analysis software.
IL-1 β ELISA
Cell-free supernatants were frozen and thawed before quantification of IL-1β was performed using a human IL-1β ELISA kit (BioLegend). Absorbance was read at 450nm and 570nm using the Epoch Microplate Spectrophotometer (BioTek). The absorbance at 570nm was subtracted from the absorbance at 450nm before calculating IL-1β concentration based upon a standard curve.
scRNA-seq
A549 cells were treated with media or 10ng/ml IL-1β in technical duplicate for 3, 6 or 12 h. Cells were isolated on the ddSEQ single-cell isolator, and samples prepared for sequencing using the SureCell WTA 3′ Library Prep Kit (lllumina/Bio-Rad). All samples were sequenced on a NextSeq 500 to a depth of > 20,000 reads/cell, and raw reads were submitted to GEO under accession GSE120269. Single-cell UMI counts were generated within lllumina’s SureCell RNA Single-Cell Basespace, where reads were mapped to the human genome version hg38 and only cells passing the knee-calling threshold were kept. All downstream filtering, normalization, and differential expression analyses were performed using the Seurat R package (Butler et al., 2018). Cells with fewer than 200 detected genes and greater than 5% of total reads assigned to ribosomal RNA were removed from the data, and expression was then log normalized with a scale factor of 10,000. Cellular counts were then batch-corrected for replicate variation and predicted cell cycle phase (Tirosh et al., 2016). At each time point, cells were clustered using PCA reduction with the first 20 principal components at 0.6 resolution and tSNE analysis was performed to visually identify homogeneous IL-1β-treated and media-treated clusters. Differentially expressed genes between IL-1β-treated and media-treated clusters were identified using the Wilcoxon rank sum test (q < 0.05) where genes showed expression in > 25% of all cells in each treatment group. Predicted transcriptional activators were identified using the Upstream Regulators analysis in Ingenuity Pathway Analysis (IPA; Krämer et al., 2014).
Statistical analysis
All statistical analyses were performed as indicated in figure legends using GraphPad Prism 7.04 software, where n represents the number of independent experiments, except in Figures 1F, 1G, and 7D where n represents the number of independent blood donors.
DATA AND SOFTWARE AVAILABILITY
Single-cell RNA-sequencing raw reads generated in this study have been deposited in the NCBI Gene Expression Omnibus under accession number GSE120269 in accordance with Minimum Information About a Microarray Experiment (MIAME) standards. All unprocessed and uncompressed imaging data included in this manuscript have been deposited in Mendeley Data: https://doi.org/10.17632/sr2stby4yh.1.
Supplementary Material
Highlights.
Exogenous IL-1β induces activation of IRF3 in human epithelial and myeloid cells
This cell-intrinsic response is cGAS and STING dependent
IL-1R signaling perturbs mitochondria for release and detection of cytosolic mtDNA
IL-1β potentiates innate immune responses to PAMPs and dengue virus infection
ACKNOWLEDGMENTS
We thank Daniel Stetson, Elizabeth Gray, Michael Davis, Richard Green, Sunil Thomas, Ram Savan, and Adriana Forero (University of Washington) for critical discussion and reagents. We thank Glen Barber (University of Miami) for STING antibody, Plngwei LI (Texas A&M University) for cGAMP, and Victor de Filippis (Oregon Health and Science University) for IRF1, IRF3, IRF5, and IRF7 CRISPR gRNAs. This project was funded by NIH grants AI27463, AI118916, AM 00625, AI104002, and AI083019. L.D.A. was supported by training grant T32Al106677–03.
Footnotes
SUPPLEMENTAL INFORMATION
Supplemental Information can be found online at https://doi.org/10.1016/j.molcel.2019.02.038.
DECLARATION OF INTERESTS
The authors declare no competing interests.
REFERENCES
- Aarreberg LD, Wilkins C, Ramos HJ, Green R, Davis MA, Chow K, and Gale M Jr. (2018). Interleukin-1β signaling in dendritic cells induces antiviral interferon responses. MBio 9, e00342–18. [DOI] [PMC free article] [PubMed] [Google Scholar]
- Aguirre S, and Fernandez-Sesma A (2017). Collateral damage during dengue virus infection: making sense of DNA by cGAS. J. Virol. 91, e01081–16. [DOI] [PMC free article] [PubMed] [Google Scholar]
- Aguirre S, Luthra P, Sanchez-Aparicio MT, Maestre AM, Patel J, Lamothe F, Fredericks AC, Tripathi S, Zhu T, Pintado-Silva J, et al. (2017). Dengue virus NS2B protein targets cGAS for degradation and prevents mitochondrial DNA sensing during infection. Nat. Microbiol. 2, 17037. [DOI] [PMC free article] [PubMed] [Google Scholar]
- Ahn J, Gutman D, Saijo S, and Barber GN (2012). STING manifests self DNA-dependent inflammatory disease. Proc. Natl. Acad. Sci. USA 109, 19386–19391. [DOI] [PMC free article] [PubMed] [Google Scholar]
- Brierley MM, and Fish EN (2002). Review: IFN-alpha/beta receptor interactions to biologic outcomes: understanding the circuitry. J. Interferon Cytokine Res. 22, 835–845. [DOI] [PubMed] [Google Scholar]
- Brubaker SW, Bonham KS, Zanoni I, and Kagan JC (2015). Innate immune pattern recognition: a cell biological perspective. Annu. Rev. Immunol. 33, 257–290. [DOI] [PMC free article] [PubMed] [Google Scholar]
- Butler A, Hoffman P, Smibert P, Papalexi E, and Satija R (2018). Integrating single-cell transcriptomic data across different conditions, technologies, and species. Nat. Biotechnol. 36, 411–420. [DOI] [PMC free article] [PubMed] [Google Scholar]
- Copenhaver AM, Casson CN, Nguyen HT, Duda MM, and Shin S (2015). IL-1R signaling enables bystander cells to overcome bacterial blockade of host protein synthesis. Proc. Natl. Acad. Sci. USA 112, 7557–7562. [DOI] [PMC free article] [PubMed] [Google Scholar]
- Crow YJ (2011). Type I interferonopathies: a novel set of inborn errors of immunity. Ann. N Y Acad. Sci. 1238, 91–98. [DOI] [PubMed] [Google Scholar]
- Dinarello CA (2009). Immunological and inflammatory functions of the interleukin-1 family. Annu. Rev. Immunol. 27, 519–550. [DOI] [PubMed] [Google Scholar]
- Fitzgerald KA, McWhirter SM, Faia KL, Rowe DC, Latz E, Golenbock DT, Coyle AJ, Liao SM, and Maniatis T (2003). IKKepsilon and TBK1 are essential components of the IRF3 signaling pathway. Nat. Immunol. 4, 491–496. [DOI] [PubMed] [Google Scholar]
- Gall A, Treuting P, Elkon KB, Loo YM, Gale M Jr., Barber GN, and Stetson DB (2012). Autoimmunity initiates in nonhematopoietic cells and progresses via lymphocytes in an interferon-dependent autoimmune disease. Immunity 36,120–131. [DOI] [PMC free article] [PubMed] [Google Scholar]
- Gao D, Li T, Li XD, Chen X, Li QZ, Wight-Carter M, and Chen ZJ (2015). Activation of cyclic GMP-AMP synthase by self-DNA causes autoimmune diseases. Proc. Natl. Acad. Sci. USA 112, E5699–E5705. [DOI] [PMC free article] [PubMed] [Google Scholar]
- Grandvaux N, Servant MJ, tenOever B, Sen GC, Balachandran S, Barber GN, Lin R, and Hiscott J (2002). Transcriptional profiling of interferon regulatory factor 3 target genes: direct involvement in the regulation of interferon-stimulated genes. J. Virol. 76, 5532–5539. [DOI] [PMC free article] [PubMed] [Google Scholar]
- Hagenbuchner J, and Ausserlechner MJ (2013). Mitochondria and FOXO3: breath or die. Front. Physiol. 4,147. [DOI] [PMC free article] [PubMed] [Google Scholar]
- Hall JC, and Rosen A (2010). Type I interferons: crucial participants in disease amplification in autoimmunity. Nat. Rev. Rheumatol. 6, 40–49. [DOI] [PMC free article] [PubMed] [Google Scholar]
- Harada H, Fujita T, Miyamoto M, Kimura Y, Maruyama M, Furia A, Miyata T, and Taniguchi T (1989). Structurally similar but functionally distinct factors, IRF-1 and IRF-2, bind to the same regulatory elements of IFN and IFN-inducible genes. Cell 58, 729–739. [DOI] [PubMed] [Google Scholar]
- Hashiguchi K, and Zhang-Akiyama QM (2009). Establishment of human cell lines lacking mitochondrial DNA. Methods Mol. Biol. 554, 383–391. [DOI] [PubMed] [Google Scholar]
- Ichim G, Lopez J, Ahmed SU, Muthalagu N, Giampazolias E, Delgado ME, Haller M, Riley JS, Mason SM, Athineos D, et al. (2015). Limited mitochondrial permeabilization causes DNA damage and genomic instability in the absence of cell death. Mol. Cell 57, 860–872. [DOI] [PMC free article] [PubMed] [Google Scholar]
- Ishikawa H, Ma Z, and Barber GN (2009). STING regulates intracellular DNA-mediated, type I interferon-dependent innate immunity. Nature 461, 788–792. [DOI] [PMC free article] [PubMed] [Google Scholar]
- Jeremiah N, Neven B, Gentili M, Callebaut I, Maschalidi S, Stolzenberg MC, Goudin N, Fremond ML, Nitschke P, Molina TJ, et al. (2014). Inherited STING-activating mutation underlies a familial inflammatory syndrome with lupus-like manifestations. J. Clin. Invest. 124, 5516–5520. [DOI] [PMC free article] [PubMed] [Google Scholar]
- Jorgensen I, and Miao EA (2015). Pyroptotic cell death defends against intracellular pathogens. Immunol. Rev. 265,130–142. [DOI] [PMC free article] [PubMed] [Google Scholar]
- Kishore N, Huynh QK, Mathialagan S, Hall T, Rouw S, Creely D, Lange G, Caroll J, Reitz B, Donnelly A, et al. (2002). IKK-i and TBK-1 are enzymatically distinct from the homologous enzyme IKK-2: comparative analysis of recombinant human IKK-i, TBK-1, and IKK-2. J. Biol. Chem. 277, 13840–13847. [DOI] [PubMed] [Google Scholar]
- Krämer A, Green J, Pollard J Jr., and Tugendreich S (2014). Causal analysis approaches in Ingenuity Pathway Analysis. Bioinformatics 30, 523–530. [DOI] [PMC free article] [PubMed] [Google Scholar]
- Krysko DV, Agostinis P, Krysko O, Garg AD, Bachert C, Lambrecht BN, and Vandenabeele P (2011). Emerging role of damage-associated molecular patterns derived from mitochondria in inflammation. Trends Immunol. 32, 157–164. [DOI] [PubMed] [Google Scholar]
- Liu S, Cai X, Wu J, Cong Q, Chen X, U T, Du F, Ren J, Wu YT, i NV, and Chen ZJ (2015). Phosphorylation of innate immune adaptor proteins MAVS, STING, and TRIF induces IRF3 activation. Science 347, aaa2630. [DOI] [PubMed] [Google Scholar]
- Lopalco G, Cantarini L, Vitale A, lannone F, Anelli MG, Andreozzi L, Lapadula G, Galeazzi M, and Rigante D (2015). Interleukin-1 as a common denominator from autoinflammatory to autoimmune disorders: premises, perils, and perspectives. Mediators Inflamm. 2015,194864. [DOI] [PMC free article] [PubMed] [Google Scholar]
- Marichal T, Ohata K, Bedoret D, Mesnil C, Sabatel C, Kobiyama K, Lekeux P, Coban C, Akira S, Ishii KJ, et al. (2011). DNA released from dying host cells mediates aluminum adjuvant activity. Nat. Med. 17, 996–1002. [DOI] [PubMed] [Google Scholar]
- Mayer-Barber KD, and Yan B (2017). Clash of the cytokine titans: counter-regulation of interleukin-1 and type I interferon-mediated inflammatory responses. Cell. Mol. Immunol. 14, 22–35. [DOI] [PMC free article] [PubMed] [Google Scholar]
- Mayer-Barber KD, Andrade BB, Oland SD, Amaral EP, Barber DL, Gonzales J, Derrick SC, Shi R, Kumar NP, Wei W, et al. (2014). Host-directed therapy of tuberculosis based on interleukin-1 and type I interferon crosstalk. Nature 511, 99–103. [DOI] [PMC free article] [PubMed] [Google Scholar]
- Minamikawa T, Williams DA, Bowser DN, and Nagley P (1999). Mitochondrial permeability transition and swelling can occur reversibly without inducing cell death in intact human cells. Exp. Cell Res. 246, 26–37. [DOI] [PubMed] [Google Scholar]
- Mori M, Yoneyama M, Ito T, Takahashi K, Inagaki F, and Fujita T (2004). Identification of Ser-386 of interferon regulatory factor 3 as critical target for inducible phosphorylation that determines activation. J. Biol. Chem. 279, 9698–9702. [DOI] [PubMed] [Google Scholar]
- Ohmori Y, and Hamilton TA (1995). The interferon-stimulated response element and a kappa B site mediate synergistic induction of murine IP-10 gene transcription by IFN-gamma and TNF-alpha. J. Immunol. 154, 5235–5244. [PubMed] [Google Scholar]
- Orzalli MH, Smith A, Jurado KA, Iwasaki A, Garlick JA, and Kagan JC (2018). An antiviral branch of the IL-1 signaling pathway restricts immune-evasive virus replication. Mol. Cell 71, 825–840.e6. [DOI] [PMC free article] [PubMed] [Google Scholar]
- Paludan SR, and Bowie AG (2013). Immune sensing of DNA. Immunity 38, 870–880. [DOI] [PMC free article] [PubMed] [Google Scholar]
- Ramos HJ, Lanteri MC, Blahnik G, Negash A, Suthar MS, Brassil MM, Sodhi K, Treuting PM, Busch MP, Norris PJ, and Gale M Jr. (2012). IL-1β signaling promotes CNS-intrinsic immune control of West Nile virus infection. PLoS Pathog. 8, e1003039. [DOI] [PMC free article] [PubMed] [Google Scholar]
- Rivieccio MA, John GR, Song X, Suh HS, Zhao Y, Lee SC, and Brosnan CF (2005). The cytokine IL-1 beta activates IFN response factor 3 in human fetal astrocytes in culture. J. Immunol. 174,3719–3726. [DOI] [PubMed] [Google Scholar]
- Rongvaux A, Jackson R, Harman CC U T, West AP, de Zoete MR., Wu Y, Yordy B, Lakhani SA, Kuan CY., et al. (2014). Apoptotic caspases prevent the induction of type I interferons by mitochondrial DNA. Cell 159, 1563–1577. [DOI] [PMC free article] [PubMed] [Google Scholar]
- Rustagi A, Doehle BP, McElrath MJ, and Gale M (2013). Two new monoclonal antibodies for biochemical and flow cytometric analyses of human interferon regulatory factor-3 activation, turnover, and depletion. Methods 59, 225–232. [DOI] [PMC free article] [PubMed] [Google Scholar]
- Saito T, Owen DM, Jiang F, Marcotrigiano J, and Gale M Jr. (2008). Innate immunity induced by composition-dependent RIG-I recognition of hepatitis C virus RNA. Nature 454, 523–527. [DOI] [PMC free article] [PubMed] [Google Scholar]
- Saitoh T, Fujita N, Hayashi T, Takahara K, Satoh T, Lee H, Matsunaga K, Kageyama S, Omori H, Noda T, et al. (2009). Atg9a controls dsDNA-driven dynamic translocation of STING and the innate immune response. Proc. Natl. Acad. Sci. USA 106, 20842–20846. [DOI] [PMC free article] [PubMed] [Google Scholar]
- Schaefer L (2014). Complexity of danger: the diverse nature of damage-associated molecular patterns. J. Biol. Chem. 289, 35237–35245. [DOI] [PMC free article] [PubMed] [Google Scholar]
- Sharma S, tenOever BR, Grandvaux N, Zhou GP, Lin R, and Hiscott J (2003). Triggering the interferon antiviral response through an IKK-related pathway. Science 300,1148–1151. [DOI] [PubMed] [Google Scholar]
- Shimada T, Kawai T, Takeda K, Matsumoto M, Inoue J, Tatsumi Y, Kanamaru A, and Akira S (1999). IKK-I, a novel lipopolysaccharide-inducible kinase that is related to IkappaB kinases. Int. Immunol. 11,1357–1362. [DOI] [PubMed] [Google Scholar]
- Sims JE, and Smith DE (2010). The IL-1 family: regulators of immunity. Nat. Rev. Immunol. 10, 89–102. [DOI] [PubMed] [Google Scholar]
- Stehlik C, de Martin R, Kumabashiri I, Schmid JA, Binder BR, and Lipp J (1998). Nuclear factor (NF)-kappaB-regulated X-chromosome-linked iap gene expression protects endothelial cells from tumor necrosis factor alpha-induced apoptosis. J. Exp. Med. 188, 211–216. [DOI] [PMC free article] [PubMed] [Google Scholar]
- Sun L, Wu J, Du F, Chen X, and Chen ZJ (2013). Cyclic GMP-AMP synthase is a cytosolic DNA sensor that activates the type I interferon pathway. Science 339, 786–791. [DOI] [PMC free article] [PubMed] [Google Scholar]
- Sun B, Sundström KB, Chew JJ, Bist P, Gan ES, Tan HC, Goh KC, Chawla T, Tang CK, and Ooi EE (2017). Dengue virus activates cGAS through the release of mitochondrial DNA. Sci. Rep. 7, 3594. [DOI] [PMC free article] [PubMed] [Google Scholar]
- Tait SW, and Green DR (2013). Mitochondrial regulation of cell death. Cold Spring Harb. Perspect. Biol. 5, a008706. [DOI] [PMC free article] [PubMed] [Google Scholar]
- Takeuchi O, and Akira S (2010). Pattern recognition receptors and inflammation. Cell 140, 805–820. [DOI] [PubMed] [Google Scholar]
- Taniguchi T, Ogasawara K, Takaoka A, and Tanaka N (2001). IRF family of transcription factors as regulators of host defense. Annu. Rev. Immunol. 19, 623–655. [DOI] [PubMed] [Google Scholar]
- Tirosh I, Izar B, Prakadan SM, Wadsworth MH 2nd, Treacy D, Trombetta JJ, Rotem A, Rodman C, Lian C, Murphy G, et al. (2016). Dissecting the multicellular ecosystem of metastatic melanoma by single-cell RNA-seq. Science 352,189–196. [DOI] [PMC free article] [PubMed] [Google Scholar]
- Wang CY, Mayo MW, Korneluk RG, Goeddel DV, and Baldwin AS Jr. (1998). NF-kappaB antiapoptosis: induction of TRAF1 and TRAF2 and c-IAPI and C-IAP2 to suppress caspase-8 activation. Science 281,1680–1683. [DOI] [PubMed] [Google Scholar]
- West AP, Khoury-Hanold W, Staron M, Tal MC, Pineda CM, Lang SM, Bestwick M, Duguay BA, Raimundo N, MacDuff DA, et al. (2015). Mitochondrial DNA stress primes the antiviral innate immune response. Nature 520, 553–557. [DOI] [PMC free article] [PubMed] [Google Scholar]
- White MJ, McArthur K, Metcalf D, Lane RM, Cambier JC, Herold MJ, van Delft MF, Bedoui S, Lessene G, Ritchie ME, et al. (2014). Apoptotic caspases suppress mtDNA-induced STING-mediated type I IFN production. Cell 159, 1549–1562. [DOI] [PMC free article] [PubMed] [Google Scholar]
- Wu MF, Chen ST, Yang AH, Lin WW, Un YL, Chen NJ, Tsai IS, Li L, and Hsieh SL (2013). CLEC5A is critical for dengue virus-induced inflammasome activation in human macrophages. Blood 121, 95–106. [DOI] [PubMed] [Google Scholar]
- Yarilina A, Park-Min KH, Antoniv T, Hu X, and Ivashkiv LB (2008). TNF activates an IRF1-dependent autocrine loop leading to sustained expression of chemokines and STAT1-dependent type I interferon-response genes. Nat. Immunol. 9, 378–387. [DOI] [PubMed] [Google Scholar]
- Zaheer RS, and Proud D (2010). Human rhinovirus-induced epithelial production of CXCL10 is dependent upon IFN regulatory factor-1. Am. J. Respir. Cell Mol. Biol. 43, 413–421. [DOI] [PubMed] [Google Scholar]
Associated Data
This section collects any data citations, data availability statements, or supplementary materials included in this article.
Supplementary Materials
Data Availability Statement
Single-cell RNA-sequencing raw reads generated in this study have been deposited in the NCBI Gene Expression Omnibus under accession number GSE120269 in accordance with Minimum Information About a Microarray Experiment (MIAME) standards. All unprocessed and uncompressed imaging data included in this manuscript have been deposited in Mendeley Data: https://doi.org/10.17632/sr2stby4yh.1.