Abstract
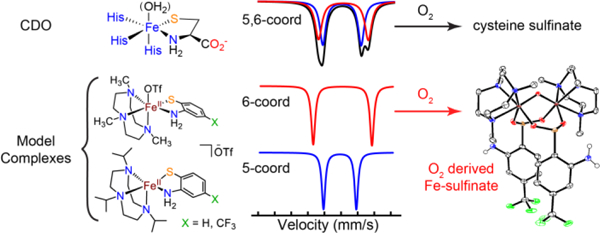
The synthesis of four new FeII(N4S(thiolate)) complexes as models of the thiol dioxygenases are described. They are composed of derivatives of the neutral, tridentate ligand triazacyclononane (R3TACN; R = Me, iPr) and 2-aminobenzenethiolate (abtx; X = H, CF3), a non-native substrate for cysteine dioxygenase (CDO). The coordination number of these complexes depends on the identity of the TACN derivative, giving 6-coordinate (6-coord) complexes for FeII(Me3TACN)(abtx)(OTf) (1: X = H; 2: X = CF3), and 5-coordinate (5-coord) complexes for [FeII(iPr3TACN)(abtx)](OTf) (3: X = H; 4: X = CF3). Complexes 1 – 4 were examined by UV-vis, 1H/19F NMR, and Mössbauer spectroscopies, and density functional theory (DFT) calculations were employed to support the data. Mössbauer spectroscopy reveals that the 6-coord 1 – 2 and 5-coord 3 – 4 exhibit distinct spectra, and these data are compared with that for cysteine-bound CDO, helping to clarify the coordination environment of the cys-bound FeII active site. Reaction of 1 or 2 with O2 at −95 °C leads to S-oxygenation of the abt ligand, and in the case of 2, a rare di(sulfinato)-bridged complex, [Fe2III(µ-O)(O2S(NH2)C6H3CF3)2](OTf)2 (5), was obtained. Parallel enzymatic studies on the CDO variant C93G were carried out with the abt substrate, and show that reaction with O2 leads to disulfide formation, as opposed to S-oxygenation. The combined model and enzyme studies show that the thiol dioxygenases can operate via a 6-coord FeII center, in contrast to the accepted mechanism for nonheme iron dioxygenases, and that proper substrate chelation to Fe appears to be critical for S-oxygenation..
Graphical Abstract
Introduction
Cysteine dioxygenase (CDO) is a nonheme iron oxygenase responsible for regulating human cysteine levels by breaking down cysteine (cys) to cysteine sulfinic acid.1 CDO represents one member of a family of thiol dioxygenases, which includes cysteamine dioxygenase (ADO) and 3-mercaptopropionic dioxygenase (3MDO). These enzymes convert sulfur substrates to sulfinic acids using O2 as the oxidant (Figure 1). The resting state of CDO is known to contain a high-spin ferrous center that is coordinated by three histidine residues in a facial arrangement. The evidence indicates that the other thiol dioxygenases have similar iron active sites bound by three His residues.2–3 The structure of substrate-bound CDO with cys coordinated to the iron center was obtained from single crystal X-ray diffraction (XRD) studies,4 and shows the expected 3-His ligand motif as well as the cys chelated through the sulfur atom and the nitrogen atom of the amino group. It is plausible that the other thiol dioxygenases exhibit similar substrate-bound structures, although they have not yet been characterized by XRD.2–3, 5
Figure 1.
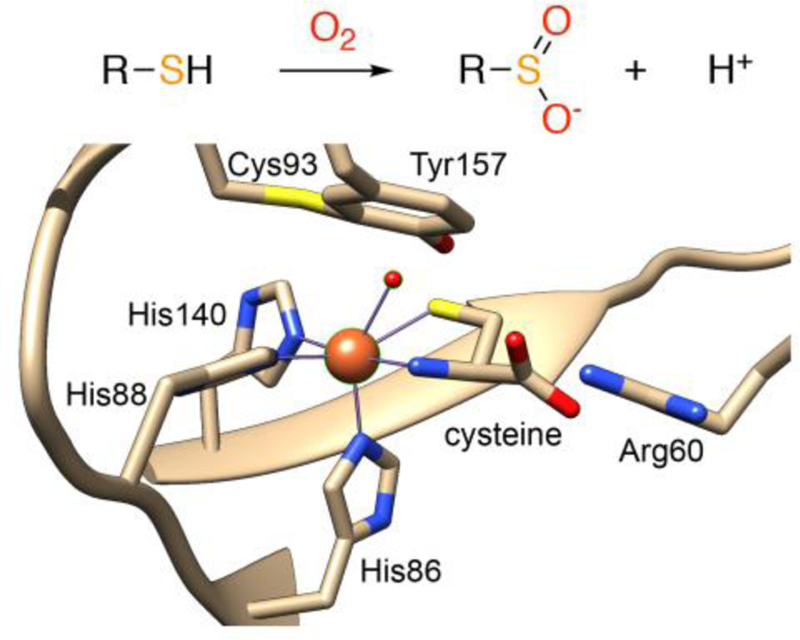
Crystal Structure of CDO variant C164S (PDB: 4Z82)
The 3-His coordination environment of CDO contrasts with the structures of other nonheme iron dioxygenases, which typically contain a 2-His-1-carboxylate motif (the “facial triad”).6 The significance of the unusual 3-His coordination environment, and the importance of these structural differences with regard to substrate binding and O2 activation, remains poorly understood.7–9 A second unusual finding for cys-bound CDO comes from recent Mössbauer studies, which shows two overlapping quadrupole doublets consistent with high-spin ferrous centers, indicating two distinct types of iron sites. Jameson and coworkers proposed that the two doublets correspond to a mixture of five-coordinate (5-coord) FeII, with an N4S primary coordination sphere, and a six-coordinate (6-coord) FeII, with a bound H2O molecule giving rise to N4SO coordination.10 The presence of the 6-coord FeII center is supported by data for a C164S variant, which has similar activity to wild-type (wt) CDO, and exhibits a 6-coord N4SO-ligated iron center with an H2O molecule occupying the putative O2-binding site (Figure 1).11 Similarly, the CDO variant H155A with cys was proposed to contain water as a sixth ligand on the basis of magnetic circular dichroism and computational studies.12
The presence of a 6-coord FeII center with H2O occupying the O2 binding site in substrate-bound, wt-CDO contradicts the accepted mechanism for O2 activation by nonheme Fe enzymes.13–14 In this mechanism, the initial resting state of a 6-coord FeII center ligated by the 2-His-1-carboxylate facial triad and three H2O molecules converts completely to a 5-coord site upon binding substrate/co-substrate, releasing all H2O ligands. The enzyme reacts with O2 only after loss of H2O and formation of the 5-coord iron center (Scheme 1).13 It is therefore of significant interest to determine if wild-type CDO is a rare example of a nonheme Fe dioxygenase that does not strictly follow these structural changes at the iron center.15 One possibility is that 5-coord and 6-coord FeII sites are in equilibrium following coordination of cys, and it is the 5-coord site that reacts with O2. However, it is also possible that O2 displaces the H2O molecule via direct attack on the 6-coord center. In addition to their unique active site structure, the thiol dioxygenases also exhibit a high degree of substrate specificity.16–17 For example, mammalian CDO will bind the non-native substrate homocysteine at the iron center, but will not oxygenate this substrate.17 A more recent study was carried out on the reactivity of MmCDO and Av3MDO (Mm: Mus musculus; Av: azotobacter vinelandii) with the non-native substrate 2-aminothiophenol (or if deprotonated, 2-aminobenzenethiolate (abt)). This substrate could not be S-oxygenated, but in the presence of both O2 and alcohol (MeOH, EtOH, BnOH), benzothiazole derivatives were formed. It was proposed that activation of O2 by the Fe center leads to oxidation of the alcohol solvent to aldehyde, which then reacts with abt to give the benzothiazole derivative. However, no direct information on the binding or structure of abt to the active site of CDO or Av3MDO was obtained.18
Scheme 1.
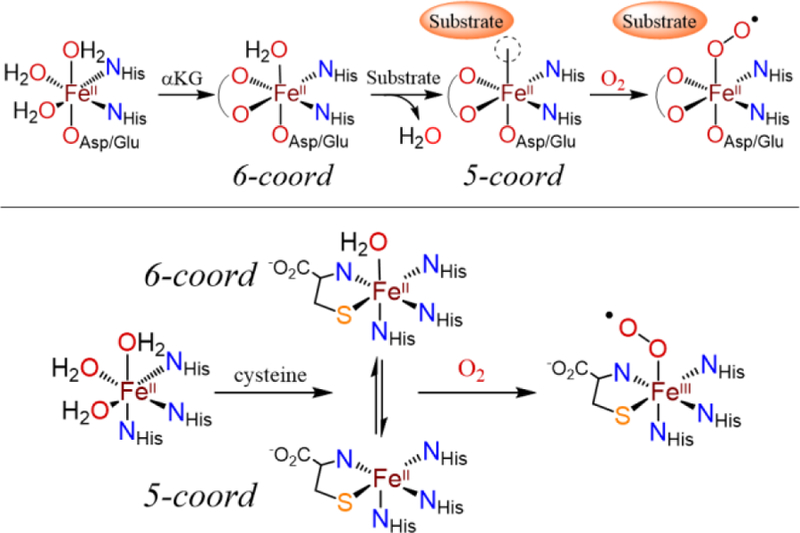
Proposed Mechanisms of O2 Activation by αKG-Dependent Iron Dioxygenases (top) and CDO (bottom)
To date there are no FeII thiol dioxygenase model complexes that utilize the non-native abt substrate.19 Herein we describe four new FeII(N4S(thiolate)) complexes that incorporate abt and a CF3-substituted derivative and include the same triazacyclononane (TACN) scaffold. These complexes form a series of closely related 5-coord and 6-coord FeII complexes in which the N4S ligand set is held constant, but where the sixth site is either unoccupied, or contains counterion or solvent. The structural and spectroscopic properties of these complexes, including both solid-state and solution Mössbauer spectra, as well as density functional theory (DFT) calculations, provide a new body of comparative data for analysis of the 5-coord/6-coord states proposed for cys-bound CDO.
The O2 reactivity of these complexes is also described. Previously we demonstrated that certain FeII(N4S(thiolate)) complexes react with O2 to give selective S-oxygenated products, and in one case formation of an iron-sulfinate complex was seen, similar to the thiol dioxygenases.20–21 Limberg and Fiedler have also prepared FeII models of CDO and ADO using trispyrazolylborate or tris(imidazolyl)phosphine ligands, and cysteine ester or cysteamine as the sulfur source.22–25 These complexes also reacted with O2, ultimately yielding organic sulfinate products, but the putative iron-sulfinate complexes were not crystallographically characterized. In the current work, it is shown that the bound abt ligands are S-oxygenated upon addition of O2 to the FeII model complexes. In the case of the CF3-substituted derivative, a dioxygenated sulfinate-iron complex is definitively characterized by XRD, and these results show that thiol dioxygenase activity does occur for FeII(abt) model complexes.
Parallel studies on CDO with the non-native abt and abtCF3 substrates were performed for direct comparison with the model complex studies, and as a comparative study to the earlier CDO/abt work of Pierce and coworkers.18 A C93G variant of CDO was employed because it is unable to form the thioether crosslink between tyrosine 157 and cysteine 93, and yet has comparable reactivity to wild-type.26 However, unlike wt-CDO, which exists as a ~1:1 mixture of crosslinked and uncrosslinked protein, C93G is present in only one form, thereby simplifying all binding and kinetic studies. In contrast to the model complexes, S-oxygenation does not occur with the enzyme, and only trace amounts of benzothiazole are detected. The first Mössbauer studies on CDO in the presence of the abt derivatives addresses the question of substrate binding to the active site. A rare combination of both model complexes and enzymatic studies are presented here in one report, and together the results point to a critical role for proper substrate binding in controlling thiol dioxygenase activity, as well as providing new insights regarding possible mechanisms for nonheme iron dioxygenases.
Results and Discussion
Synthesis and Structural Analysis.
The triazacyclononane (TACN) ligand was selected as a neutrally charged, tridentate nitrogen donor to model the neutral 3-His binding motif of the thiol dioxygenases. This ligand is well-known to give stable iron complexes in a range of oxidation states,27–29 and the steric properties of the ligand can be tuned by the substituents attached to the amine donors.30–32 The methyl-substituted Me3TACN is known to favor 6-coordinate ferrous complexes, whereas the isopropyl-substituted iPr3TACN is only known to give 5-coordinate FeII complexes. The lower coordination number favored by the iPr derivative was previously attributed to the steric encumbrance imposed by the ligand.30–31 The syntheses of 1 – 4 are shown in Scheme 2. Reaction of the FeII precursor30 [FeII(Me3TACN)(CH3CN)3](OTf)2 in acetonitrile with 2-aminothiophenol and triethylamine added as base in THF led to FeII(Me3TACN)(abt)(OTf) (1), which was isolated as colorless crystals in good yield (80%). Synthesis of the CF3-substituted abt analog (abtCF3) was accomplished by adding a THF solution of triethylammonium 2-amino-4-(trifluoromethyl)benzenethio-late to [FeII(Me3TACN)(CH3CN)3](OTf)2 in CH3CN. The same workup and crystallization as described for 1 led to FeII(Me3TACN)(abtCF3)(OTf) (2) in good yield (75%). The iPr3TACN complexes, [FeII(iPr3TACN)(abt)](OTf) (3) (50%) and [FeII(iPr3TACN)(abtCF3)](OTf) (4) (30%), were prepared in a similar fashion to 1 and 2.
Scheme 2.
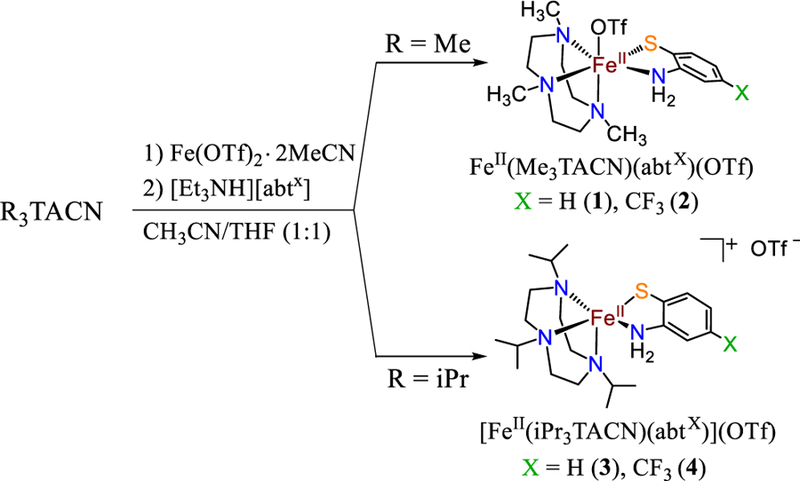
Synthesis of Complexes 1 – 4
The molecular structures of 1 – 4 were determined by single-crystal X-ray diffraction (XRD) and are shown together in Figure 2. Selected bond distances and bond angles for 1 – 4 are provided in Table 1. The ferrous center in each complex is facially ligated by the TACN ligand through the neutral N donors. The abt ligands coordinate through the anticipated bidentate bonding mode via the neutral N and anionic S donors. The first coordination spheres of 1 and 2 are saturated by triflate, leading to neutral complexes, whereas 3 and 4 remain 5-coordinate and cationic, with a triflate counterion outside the primary coordination sphere but hydrogen-bonded to the NH2 group of the abt ligand.
Figure 2.
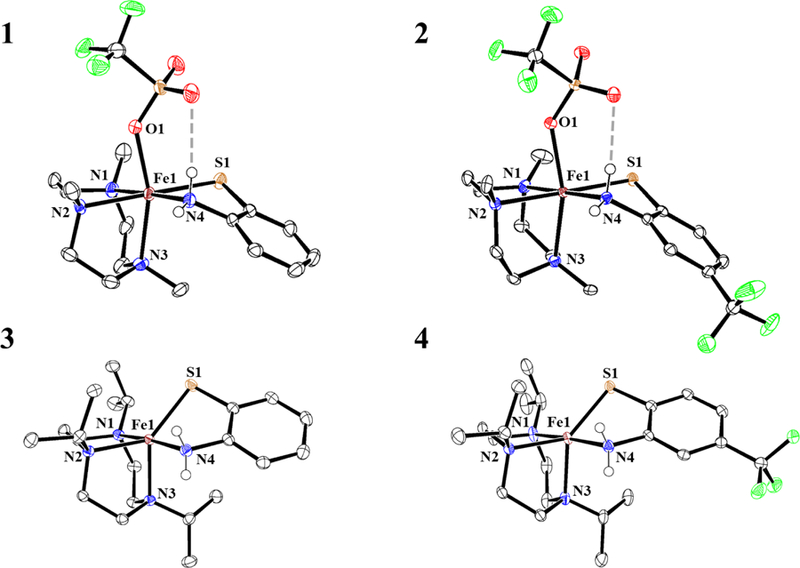
Displacement ellipsoid plots (50% probability level) for 1 – 4 at 110(2) K. The triflate counterions in 2 and 3, and hydrogen atoms in 1 – 4 (except those on N4) have been omitted for clarity.
Table 1.
Selected Bond Distances (Å) and Angles (deg) for Complexes 1 – 4
| 1 | 2 | 3 | 4 | |
|---|---|---|---|---|
| Bond Distances | ||||
| Fe1–S1 | 2.4352(4) | 2.4343(4) | 2.3573(4) | 2.3753(6) |
| Fe1–N1 | 2.225(6) | 2.220(5) | 2.2818(13) | 2.243(2) |
| Fe1–N2 | 2.274(6) | 2.256(5) | 2.1642(12) | 2.1920(18) |
| Fe1–N3 | 2.263(5) | 2.249(5) | 2.1651(12) | 2.1662(19) |
| Fe1–N4 | 2.2344(13) | 2.2393(12) | 2.2555(13) | 2.2656(19) |
| Fe1–O1 | 2.1497(11) | 2.2190(10) | ––– | ––– |
| Bond Angles | ||||
| S1–Fe1–N1 | 101.60(16) | 100.1(3) | 100.82(3) | 100.33(5) |
| S1–Fe1–N2 | 179.59(18) | 179.0(2) | 136.97(3) | 138.78(5) |
| S1–Fe1–N3 | 101.43(15) | 100.1(2) | 138.07(3) | 137.49(5) |
| S1–Fe1–N4 | 79.29(4) | 79.28(3) | 81.30(3) | 80.61(5) |
| S1–Fe1–O1 | 95.91(3) | 95.24(3) | ––––– | ––––– |
| N4–Fe1–N1 | 178.45(17) | 179.3(3) | 175.10(5) | 176.81(8) |
| N4–Fe1–N2 | 100.34(17) | 101.4(2) | 100.88(5) | 100.67(7) |
| N4–Fe1–N3 | 99.11(17) | 101.0(2) | 92.93(5) | 94.70(7) |
| N4–Fe1–O1 | 89.59(5) | 88.27(4) | ––– | ––– |
| N1–Fe1–O1 | 91.58(17) | 91.5(2) | ––– | ––– |
| N2–Fe1–O1 | 84.26(17) | 84.1(2) | ––– | ––– |
| N3–Fe1–O1 | 161.75(16) | 163.3(3) | ––– | ––– |
| N1–Fe1–N2 | 78.8(2) | 79.2(3) | 80.64(5) | 80.66(7) |
| N1–Fe1–N3 | 79.5(2) | 79.3(3) | 82.53(5) | 82.54(8) |
| N2–Fe1–N3 | 78.4(2) | 80.5(3) | 84.95(5) | 83.71(7) |
| Calculated Values | ||||
| λocta | 1.028 | 1.027 | ––– | ––– |
| τ5b | ––– | ––– | 0.62 | 0.63 |
Octahedral quadratic elongation, . l0 represents the center to vertex distance of an octahedron with Oh symmetry whose volume is equal to that of the distorted octahedron with distances li. λoct = 1 for an ideal octahedron.33
5-coordinate geometry index, τ5 = (β – α)/60. β is the largest bond angle observed, and α is the second largest bond angle.34
Complexes 1 and 2 both contain iron in a pseudo-octahedral geometry, with octahedral quadratic elongation parameters λoct = 1.028 and 1.027.33 The λoct parameter is a measure of octahedral distortion, with λoct = 1 representing an ideal octahedron, and values greater than 1 reflecting distortions from ideality. The λoct values for 1 and 2 are slightly greater than that calculated for the six-coordinate FeII center bound to the same TACN derivative in [(Me3TACN)FeII-(μ-OH)-FeIII(MST)]+ (λoct = 1.021).35 We hypothesize these distortions are due to the electron-donating thiolate donors in 1 and 2. All metal-ligand bond lengths for 1 and 2 are consistent with high-spin ferrous centers.30–31, 36 The Fe–S bonds in 1 and 2 are long compared to those typically observed for mononuclear iron thiolate complexes. A search of the Cambridge Structural Database (CSD)37 reveals that there are only three other iron complexes38–40 with longer terminal Fe–S bond distances, excluding those with partial thione character, and one of these systems is an Fe(abt) complex containing an oxidized ligand radical.39 The Fe–OTf bond length in 2 is 0.07 Å longer than that seen in 1, which seems opposite to what is expected given the electron-deficient thiolate donor in 2. This observation may be explained by the fact that the triflate ligand in both 1 and 2 forms a hydrogen bond with the nearby coordinated NH2 moiety. The latter group in 2 is expected to be a better H-bond donor because of the electron-withdrawing CF3 substituent, leading to a stronger TfO---NH2 interaction and consequently weakening the Fe–OTf bond. Indeed, we observe both shorter –NH2---O (1: d(N---O) = 3.147(2) Å; 2: d(N---O) = 3.070(2) Å) and longer S–O distances in 2 compared with 1.
The iPr3TACN complexes 3 and 4 are both 5-coordinate. For each complex, the unbound triflate counterion is hydrogen-bonded to the NH2 group of the abt ligand (3: TfO---N = 3.055(2) Å; 4: TfO---N = 3.110(3) Å). Complexes 3 and 4 exhibit geometries between square pyramidal (sp) and trigonal bi-pyramidal (tbp) (τ5 = 0.62 for 3 and τ5 = 0.63 for 4; where τ5 =0.0 for sp and τ5 =1.0 for tbp).34 Overall, the bond metrics for 3 and 4 are similar to each other. The Fe–N1 bond in 3 is slightly elongated (0.04 Å) compared to the Fe–N1 in 4 (Table 1). This elongation can be rationalized by the anticipated stronger trans-effect from the more electron-rich abt ligand in 3. Other bond lengths are nearly the same for 3 and 4.
UV-vis Spectroscopy.
Complexes 1 – 4 are colorless in solution, but exhibit intense absorbance features in the UV region (Figure 3). Similar features in other arylthiolate-ligated ferrous complexes have typically been assigned as S → Fe(II) charge transfer (CT) transitions based on spectroscopic and computational analyses (UV-vis, MCD, DFT).41–42 The spectrum for 1 is shown in Figure 3 (black line) and exhibits a peak at λmax = 269 nm, with a shoulder at 304 nm. In comparison, the CF3-substituted 2 (blue line) exhibits similar bands which are red-shifted by 17 and 5 nm, respectively. The spectra for the 5-coord complexes 3 – 4 give rise to similar charge transfer bands as seen in 1 – 2, and a similar red-shift is also observed when comparing the CF3-substituted 4 (272 nm) to unsubstituted 3 (259 nm). The red-shift in the LMCT band upon introduction of an electron-withdrawing group was initially unexpected and opposite to what has been seen for a series of Ni-arylthiolate complexes with varied aryl-group substituents43; however, this trend can be rationalized by a significant contribution of ligand-to-ligand charge transfer in the observed transitions. This hypothesis is supported by the UV-vis spectra of the free thiols (Figure S2), which exhibit a red shift in the CF3-substituted free ligand, and by time-dependent density functional theory (TD-DFT) calculations (vide infra).
Figure 3.
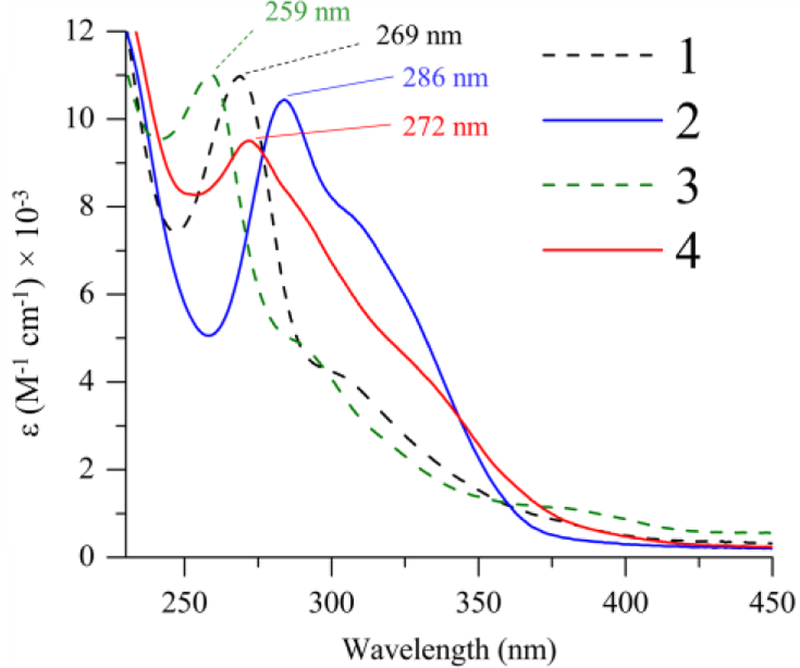
Electronic absorption spectra of 1 – 4 in CH3CN at 23 °C.
TD-DFT.
Complexes 1 – 4 were studied by DFT calculations to help explain the trends in the observed electronic absorbance spectra. The optimized geometries of 1 – 4 were calculated using the BP86/6–311G*/6–31G*(C, H atoms) functional/basis set combination and the conductor-like screening model (COSMO) to model CH3CN solvation. In all cases, the optimized geometries gave structural parameters that matched well with those determined by X-ray crystallography (Table S6).
Spectral excitations were simulated by the TD-DFT method using several functionals of varying Hartree-Fock (HF) exchange (TPSSh 10%, B3LYP 20%, PBE0 25%, CAM-B3LYP 19–65%). These were all paired with an Ahlrichs def2 family triple-ξ basis set (def2-TZVP).44–45 With the exception of PBE0, all functionals produced satisfactory results when compared to experimental data (Figure S3). However, in the region of interest, experimental features were best reproduced using the CAM-B3LYP range-separated functional. This result is to be expected as CAM-B3LYP extends the standard B3LYP functional to include long-range corrections and has been shown to more accurately estimate charge-transfer excitation energies.46
The theoretical and experimental spectra for complexes 1 – 4 are in good agreement; however, a systematic shifting of the calculated spectra by 20 nm is required to match the experimental spectra. Such a systematic overestimation of absolute transition frequency is a well-established problem inherent to TD-DFT calculations.47 The high-energy transitions from 250 – 350 nm, in particular, are well reproduced, and match the experimental trends in 1 – 4. These features are characteristic of Fe–S complexes and have been historically assigned as S → Fe(II) charge transfer (CT) bands.41–42, 48
Representative spectra for 3 – 4 are shown in Figure 4. The computed spectrum for each complex is dominated by a feature between 260 – 285 nm (Figures S4 – S7). For each case, this band contains a number of excitations in both the α and β spin manifolds that are close enough in energy to coalesce into one feature. Analysis of the transition difference density plots reveals that the vertical transitions in the region have very similar character across the series of complexes. At higher energies, an α to α excitation is observed from an admixed molecular orbital of Sp and Fed character into the π* manifold of the aromatic ring (Figure 4). Given the dominant sulfur character of the donor MO, we assign these transitions as ligand-to-ligand charge transfer (LLCT). Moving across the dominant band to lower energies, we note β to β transitions comprised mostly of Sp donor and Fed acceptor character (Figures S4 – S7). While these appear to be characteristic ligand-to-metal charge transfer (LMCT) transitions, the acceptor MOs also contain reduced, but non-negligible contributions from the aromatic ring of the abt ligand. At higher energies (300 – 325 nm), an absorption shoulder is seen in the experimental and simulated spectra for each complex. This feature arises from Sπ → Fe(dxz)/Fe(dyz) LMCT transitions and does not exhibit a major energy shift upon –CF3 substitution of the abt ligand.
Figure 4.
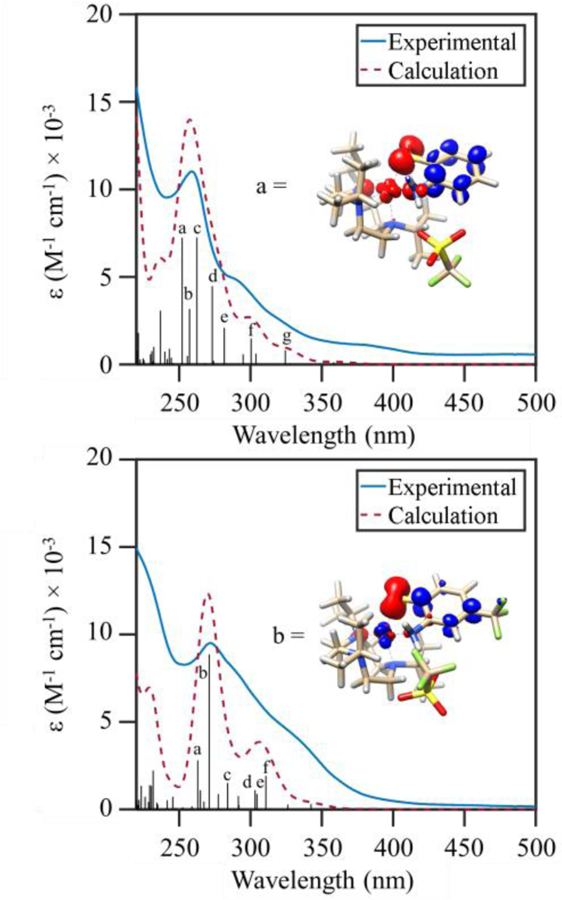
TD-DFT computed absorption spectra for 3 (top) and 4 (bottom) (red dashed line) overlaid with experimental spectra (blue line). The black sticks and letters mark the energies and intensities of specific vertical excitations. Electron density difference maps for representative computed transitions are shown with the blue and red regions indicating gain and loss of electron density, respectively.
Analysis of the calculated absorbance spectra for complexes 1 – 4 explains the observed red-shift between compounds 1 – 2 and 3 – 4. For 3 – 4, addition of an electron-withdrawing CF3 functional group para to the sulfur results in contraction of both the donor (Sp) and acceptor (ligand π*) MOs involved in the high-energy LLCT excitations (Figures S6 – S7). However, by examining the energies for 1 – 4, we conclude that the acceptor MOs are contracted to a greater degree and the overall orbital energy gap is diminished relative to the corresponding transition in 3. Thus, contributions from LLCT transitions, and their corresponding decrease in energy with –CF3 functionalization, result in the experimentally observed red-shift between complexes 3 and 4. Identical behavior is observed between 1 and 2 (Figures S4 – S5).
NMR Spectroscopy.
Complexes 1 – 4 exhibit paramagnetically shifted peaks between −10 – 140 ppm. The effective magnetic moments of 1 – 4 in CD3CN were determined by Evans method49–50 to be 5.37, 5.50, 5.52, and 5.46 μB, respectively, consistent with high-spin (S = 2) ferrous complexes. The 1H NMR spectra of 1 – 2 in CD3CN are shown in Figure 5. The spectrum of 2 is similar to 1 (Figure 5) with the exception of one less peak near 12 ppm, which can be assigned to the H atom para to the thiolate donor in 1. Other assignments can be made based on integrations and comparison with the selectively deuterated 1–d9 complex, which has the methyl groups on TACN replaced by CD3 groups (Figure S8).
Figure 5.
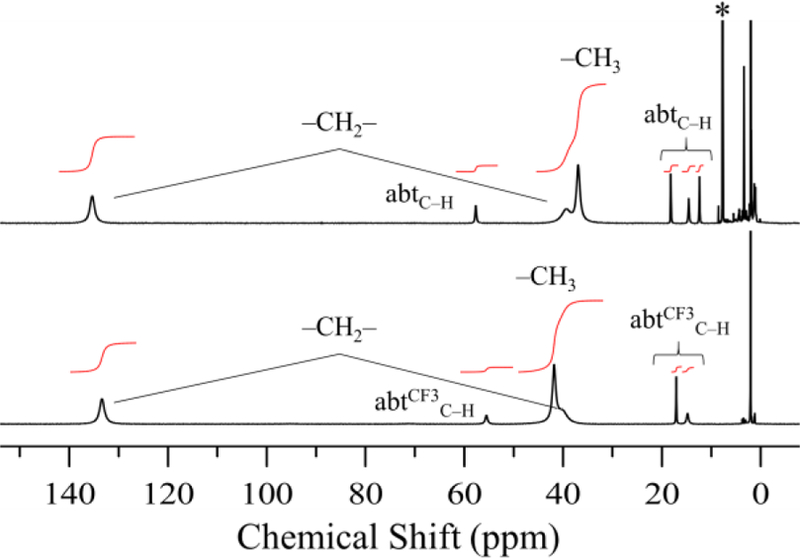
1H NMR spectra of 1 (top) and 2 (bottom) in CD3CN at 24 °C. 1,1,1-trifluorotoluene internal standard designated with an asterisk (*).
The 1H NMR spectra for the 5-coord iPr3TACN complexes 3 – 4 in CD3CN at 24 °C are shown in Figures S9. Peaks corresponding to the abt derivatives are observed, but no prominent peaks in either 3 or 4 could be attributed to the iPr3TACN ligand. However, paramagnetically shifted peaks (−15 – 180 ppm) appear in the spectra for 3 – 4 upon cooling to −40 °C, which can be assigned to iPr3TACN (Figures S10 – S11). These observations are consistent with significant conformational fluxionality in the iPr3TACN ligand at 24 °C, leading to severe line-broadening in the 1H NMR spectra. Similar observations have been made for Fe(iPr3TACN)(OTf)2.31
The 19F NMR spectra of 1 – 4 provide insight into the coordination of triflate in solution. All four complexes exhibit a sharp peak near −78 ppm in CD3CN at 24 °C, indicative of free OTf- anion (Figures 6, S12 – S14).30 The presence of free OTf- for 3 – 4 is expected given the lack of triflate coordination in the crystal structures of these complexes. In contrast, peaks for free OTf- in 1 – 2 implies dissociation of the anion in solution. Further examination at low temperature shows that there is an equilibrium between bound and unbound triflate for 1 – 2. Variable temperature data for 2 are shown in Figure 6. The peak for the CF3 group shifts and broadens from −25 to −12 ppm, while the sharp peak at −78 ppm assigned to free OTf- also shifts and broadens upon lowering the temperature to −40 °C. These changes can be attributed to a fast equilibrium between bound and unbound triflate, as has been reported for another high-spin iron(II)-triflate complex.51 In contrast, the OTf- peaks in 3 and 4 show no broadening with decreasing temperature (Figure S13 – S14). Changing the NMR solvent from CH3CN to butyronitrile allowed for data collection for 2 at temperatures down to −100 °C (Figure 7). A sharp peak is observed at −83 ppm for free OTf-, and two additional peaks are now seen at −18 and +61 ppm. These peaks can be assigned to terminal and bridging triflate ligands, respectively, from previous studies on FeII(Me3TACN) triflate complexes.30 The peak for the bridging OTf- is consistent with a μ–1,3 bonding mode between two FeII centers.
Figure 6.
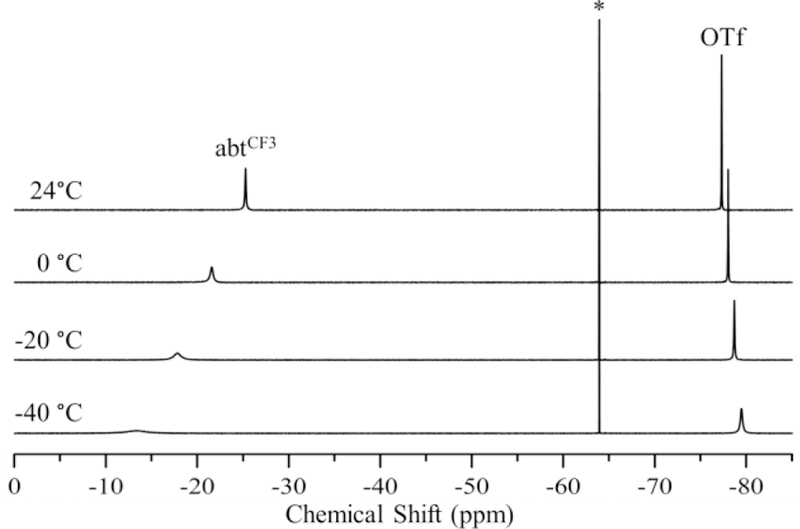
Variable temperature 19F NMR spectra of 2 in acetonitrile-d3. 1,1,1-trifluorotoluene internal standard designated with an asterisk (*).
Figure 7.
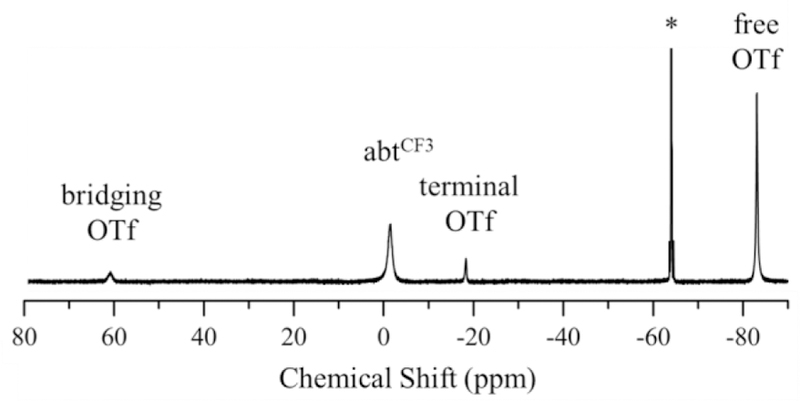
19F NMR spectrum of 2 in PrCN at −100 °C. 1,1,1-trifluorotoluene internal standard designated with an asterisk (*).
Integration of the free, terminal, and bridging OTf- peaks shows that these species exist in a 1:0.1:0.1 ratio at −100 °C. A variable temperature analysis for 1 also shows broadening for OTf- at lower temperatures, but no resolution of individual species is seen at −100 °C (Figure S15), indicating that the equilibrium for 1 remains in fast exchange. The difference in the exchange rates for 1 and 2 may arise from the stronger H-bonding interaction between OTf- and the NH2 group of the abt ligand seen in the solid-state structure for 2 (vide supra). Overall, the variable temperature 19F NMR data indicate that the OTf- ligand in 1 and 2 is labile, leading to the presence of either 5-coord or solvent-bound species together with OTf-bound species in solution.
Mössbauer spectroscopy.
The zero-field 57Fe Mössbauer spectra for crystalline samples of 1 – 4 dispersed in a boron nitride matrix are shown in Figure 8. Each complex exhibits a single, sharp quadrupole doublet that accounts for >95% total Fe. Fitting of the data gives the Mössbauer parameters listed in Table 2. All spectra are consistent with high-spin (S = 2) ferrous centers.52 There is a decrease of ~0.15 mm s−1 in the isomer shift (δ) for the five-coordinate complexes as compared to the six-coordinate complexes, consistent with a lowering in coordination number and a shortening of the average iron-ligand bond lengths (Figure S16). This trend is well-established for high-spin iron(II).52
Figure 8.
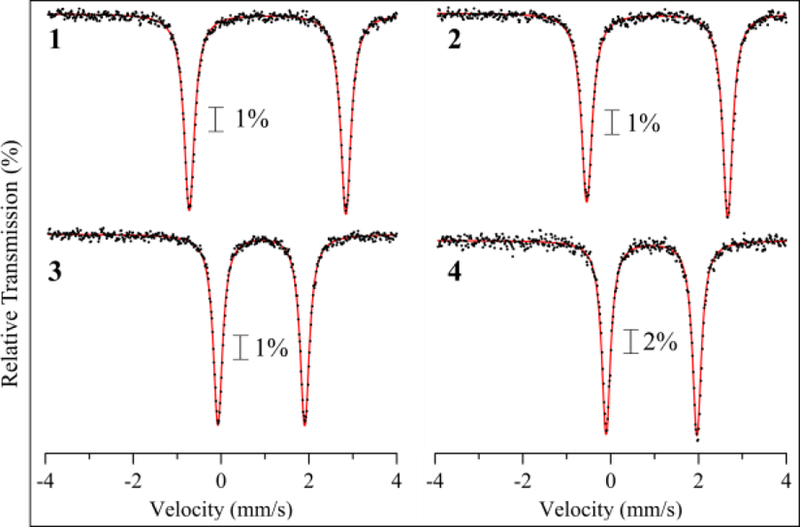
Zero-field 57Fe Mössbauer spectra for 1 – 4 as crystalline solids dispersed in BN matrix at 5 K. Fits shown in red.
Table 2.
| Complex | δ (Calcd)c | |ΔEQ| (Calcd)c |
|---|---|---|
| 1 | 1.07 (1.06) | 3.55 (3.35) |
| 2 | 1.08 (1.06) | 3.20 (3.26) |
| 3 | 0.93 (0.93) | 1.97 (2.34) |
| 4 | 0.95 (0.92) | 2.06 (2.33) |
Collected at 5 K.
All parameters in mm s−1.
Calculated by DFT using B3LYP/CP(PPP)(on Fe)/def2-TZVP/COSMO(MeOH).
The quadrupole splitting is different for 1 – 2, whereas it is the same in 3 and 4. The former difference in |ΔEQ| can be ascribed to slight differences in OTf- coordination for 1 and 2. The most significant difference seen in Figure 8 is a decrease in |ΔEQ| upon changing from 6-coord to 5-coord complexes. Trends in quadrupole splitting values as a function of Fe coordination number are, in general, not well-established, and typically only small differences are noted.53–55 In a recent report on a bis(thioether)amide-ligated iron complex derived from the abt ligand, it was proposed that five- versus six-coordination induced only a slight difference in |ΔEQ|.56 Thus 1 – 4 provide a unique set of FeII complexes in which 6-coord (FeII(N4SO)) versus 5-coord (FeII(N4S)) sites are easily identified by their large and small |ΔEQ| values, respectively.
The Mössbauer spectra for 57Fe-labelled 1 – 4 in different solvents provide information regarding the solution state structures of the series. The spectra for 3 in the solid state versus solution are shown in Figure 9. The spectra are nearly identical, indicating that the 5-coord structure for 3 remains unchanged in solution. The same result is seen for 4 (Figure S18). In contrast, Mössbauer spectra of solutions of 1–57Fe and 2–57Fe are highly solvent dependent and display more than one quadrupole doublet (Figure 10). The spectra for 1 and 2 in CH3CN (Figure 10a,d) exhibit two quadrupole doublets, and the doublets with the larger |ΔEQ| values are similar to the solid-state spectra for 1 and 2. These doublets can be assigned to the 6-coord, OTf-bound structures determined by X-ray crystallography. The narrower doublets seen in CH3CN correspond to a minor component for 1–57Fe and a major component for 2–57Fe. These data are consistent with the 19F NMR spectra for each complex, which indicate an equilibrium between free and bound OTf- species for both 1 and 2. Thus the narrower doublets can be assigned to the complexes without bound OTf-, corresponding to either a 5-coord species, or a solvent-bound form in which CH3CN replaces the OTf- ligand. The Mössbauer spectra for 1 and 2 in butyronitrile also exhibit two doublets (Figure 10b,e), and a third, minor component (~10% of total Fe) is observed for 2–57Fe. The three components seen for 2 are in line with the low-temperature 19F NMR spectrum in Figure 7, which shows peaks for free, terminal, and bridging OTf- species. The relative amounts of the different components obtained by fitting of the Mössbauer spectrum for 2 corroborates the 10:1:1 ratio seen for the different species by 19F NMR. The Mössbauer spectra for 1–57Fe and 2–57Fe in CH3OH are shown in Figure 10c,f, and are distinctly different than those seen for the nitrile-based solvents. Each spectrum displays a broad doublet that is best fit with two closely overlapping subcomponents (Table 3). As in the case for 1–57Fe and 2–57Fe in nitrile solvents, one doublet is assigned to an OTf-bound structure, and the other doublet could correspond to either a methanol-bound or 5-coord species.
Figure 9.
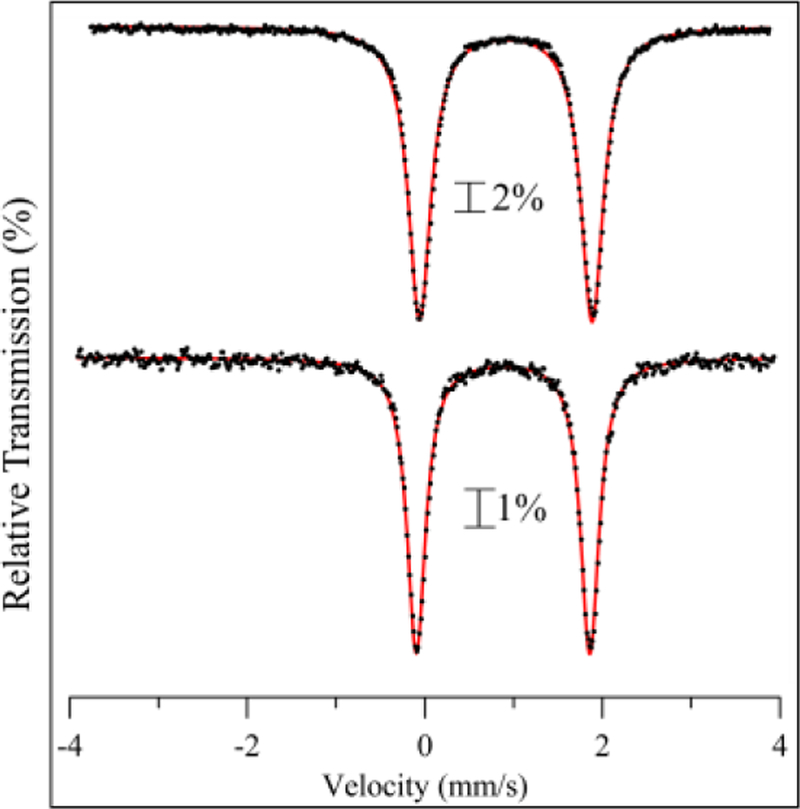
Zero-field 57Fe Mössbauer spectra of 3–57Fe dissolved in CH3CN (top) and of 3 as a crystalline solid dispersed in BN matrix (bottom) at 5 K. Fits shown in red.
Figure 10.
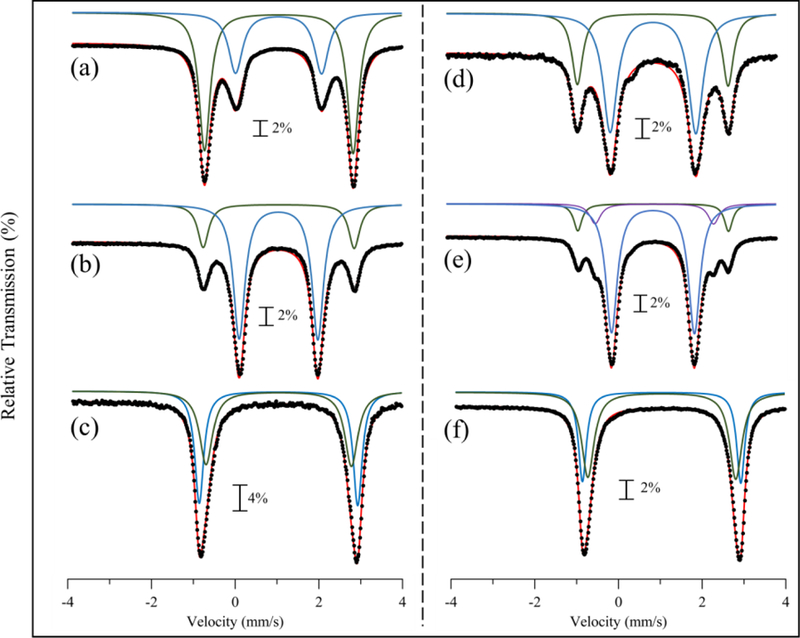
Zero-field 57Fe Mössbauer spectra at 80 K of 1–57Fe in (a) MeCN, (b) PrCN (c) MeOH and 2–57Fe in (d) MeCN (e) PrCN (f) MeOH. Overall fits are shown in red, and each subspecies fit is shown in green, blue, or purple.
Table 3.
| 1 | 2 | ||||||
|---|---|---|---|---|---|---|---|
| Solvent | Lc | δ, |ΔEQ| (DFT)d | % | Solvent | Lc | δ, |ΔEQ| (DFT)d | % |
| MeCN | L = OTf | 1.05, 3.57 (1.06, 3.35) | 65% | MeCN | L = OTf | 1.04, 3.63 (1.06, 3.26) | 32% |
| L = MeCN | 1.05, 2.07 (1.06, 2.48) | 35% | L = MeCN | 1.05, 2.06 (1.06, 2.91) | 68% | ||
| PrCN | L = OTf | 1.05, 3.63 (1.06, 3.35) | 24% | PrCN | L = OTf | 1.05, 3.62 (1.06, 3.26) | 12% |
| L = PrCN | 1.04, 1.89 (1.05, 2.96) | 76% | L = PrCN | 1.05, 1.99 (1.05, 2.89) | 77% | ||
| ––– | ––– | MeOH | L = OTf (bridged) | 1.09, 2.85 | 11% | ||
| MeOH | L = MeOH | 1.04, 3.80 (1.01, 3.48) | 51% | L = MeOH | 1.04, 3.80 (1.02, 3.35) | 39% | |
| L = OTf | 1.05, 3.49 (1.06, 3.35) | 49% | Solid | L = OTf | 1.05, 3.56 (1.06, 3.26) | 61% | |
| Solid | L = OTf | 1.06, 3.63 (1.06, 3.35) | ––– | L = OTf | 1.06, 3.33 (1.06, 3.26) | ––– | |
Collected at 80 K.
All parameters in mm s−1.
L represents sixth ligand for [FeII(Me3TACN)(abtx)(L)]+/0.
Calculated using B3LYP/CP(PPP)(on Fe)/def2-TZVP/COSMO(MeOH).
Mössbauer Spectroscopy: Computational Analysis.
Mössbauer parameters were computed by employing the B3LYP functional in conjunction with the optimized geometries for 1 – 4. The δ and |ΔEQ| values were determined by empirically derived calibration curves composed from a series of known iron complexes with similar coordination environments to 1 – 4 (Figure S19, Table S7).57–61 As seen in Table 2, the calculated δ and |ΔEQ| splitting values for all four complexes in the solid state are in good agreement with the experimental values. We next performed DFT geometry optimizations and Mössbauer parameter calculations for the putative 5-coordinate forms of 1 – 2 (1–5coord and 2–5coord), as well as solvent-bound, 6-coordinate forms of 1 – 2 (1–MeCN, 1–PrCN, 1–MeOH, 2– MeCN, 2–PrCN, and 2–MeOH) (Table S8 – S9). The calculated δ values for 1–5coord and 2–5coord are both 0.85 mm s−1 (Table S10), which does not match well with the observed solution state isomer shifts. In contrast, the calculated δ values for the 6-coord, solvent-bound forms of 1 and 2 are close to the observed δ values in each solvent (Table 3). The calculated |ΔEQ| values for the nitrile-bound solvent complexes 1–MeCN, 1–PrCN, 2–MeCN, and 2–PrCN are slightly larger than the experimental values; however, these values are smaller than the calculated values for 1–OTf and 2–OTf, following the same trend as what is seen experimentally.
The calculated |ΔEQ| values for the methanol-bound complexes 1–MeOH and 2–MeOH are a better match with experiment as compared to the nitrile-bound complexes. Taken together, the calculated and experimentally determined Mössbauer parameters in the different solvents confirm that the iron(II) centers in 1 and 2 remain six-coordinate, with equilibrium mixtures of solvent- and OTf-ligated species being observed.
Comparison of Mössbauer Data with CDO.
The Mössbauer spectrum of cys-bound CDO is reported to contain two distinct doublets designated as A and A’ (A: δ = 1.03 mm s−1 |ΔEQ| = 2.28 mm s−1; A’: δ = 1.10 mm s−1 |ΔEQ| = 3.14 mm s−1), which were proposed to arise from a mixture of a five-coordinate, N4S-ligated ferrous center and a six-coordinate N4SO-ligated ferrous center.10 DFT calculations of the Mössbauer parameters on a truncated model of the enzyme active site predicted A to be the water-bound form of cys-bound CDO and A’ to be the five-coordinate form based on the trends in the calculated ΔEQ values. However, the calculated Mössbauer parameters did not accurately reproduce the experimental values. The calculations significantly underestimated the isomer shift for both A and A’. These deviations likely stem from the fact that the previously used calibration method was derived from a limited set of iron complexes with a relatively narrow range in isomer shifts.62 Given our ability to accurately calculate the isomer shifts in our model complexes with a new calibration method, we recalculated Mössbauer parameters for A and A’ using the previously published coordinates on a truncated model of the enzyme.10 Using our new calibration method, the calculated Mössbauer parameters for site A (5-coord) are δ = 1.05 mm s−1, |ΔEQ| = 2.95 mm s−1 and for site A’ (6-coord) are δ = 1.17 mm s−1, |ΔEQ| = 3.19 mm s−1. These values are much closer to the experimental values for the two subsites in cys-bound CDO and properly match the experimental trends for isomers shift and quadrupole splitting for the two doublets. The trends seen in the model complexes 1 – 4 further support the assignments of the two species observed in cys-bound CDO. The crystal structures and solidstate Mössbauer spectra of 1 – 4 clearly show distinct differences in the isomer shifts and quadrupole splittings for the five-coord and six-coord N4S-ligated high-spin ferrous complexes. The δ and |ΔEQ| values are ~0.9 mm s−1 and ~2 mm s−1, respectively, for the five-coord complexes, and ~1 mm s−1 and >3 mm s−1, respectively, for the six-coord complexes in the solid state. These values are close to those observed for A and A’.
Other mononuclear nonheme iron enzymes, including homoprotocatechuate 2,3-dioxygenase,63 and several carotenoid cleavage oxygenases (CCOs),64 display two quadrupole doublets in the presence of substrate. For the CCOs, these two species have been proposed to arise from multiple conformations within the active site. This idea is supported by the fact that the isomer shift for these two species are identical, suggesting similar coordination environments. Furthermore, nitric oxide (NO•) binding studies show that in one of the CCOs, two different {FeNO}7 species are present in a ratio equal to the different conformers before introduction of NO•, supporting the existence of two distinct conformations of the active site.64 In contrast, EPR studies of the {FeNO}7 formed upon introduction of NO• to cys-bound ferrous CDO implies the presence of only one major cys-bound species, suggesting that both A and A’ are ultimately converted to the same {FeNO}7 species.65 We believe that the data for models 1 – 4, and the observation that A and A’ give the same species with NO•, provides strong evidence that A is the five-coordinate form of cys-bound CDO, while A’ is a six-coordinate, water-bound form (Scheme 1).
O2 Reactivity.
Reaction of 1 with excess O2 in MeOH at 23 °C results in the formation of 2-aminophenyl disulfide (Scheme 3), as seen by TLC and 1H NMR spectroscopy (Figure S20). However, the same reaction conducted at −95 °C yields a deep blue solution, which gradually turns brick red upon warming to 23 °C. TLC analysis indicated a new, major product distinct from disulfide, and 1H NMR spectroscopy of the crude reaction mixture confirmed the production of a new species (Figure S21). Purification of this product on neutral alumina gave a yellow oil with the 1H NMR spectrum in Figure 11. This spectrum together with 13C and 1H-13C HSQC NMR, as well as EI-MS, identified this product as methyl 2-aminobenzenesulfinate (42 % yield; Figures S21 – S26) (Scheme 3).66 The use of isotopically labeled 18O2 and analysis by EI-MS shows that one of the O atoms in the product originates from O2 (Figure S26). Attempts to perform catalytic S-oxygenation using FeII(Me3TACN)(OTf)2 as catalyst30 and excess O2 and abt yielded no S-oxygenated products.
Scheme 3.
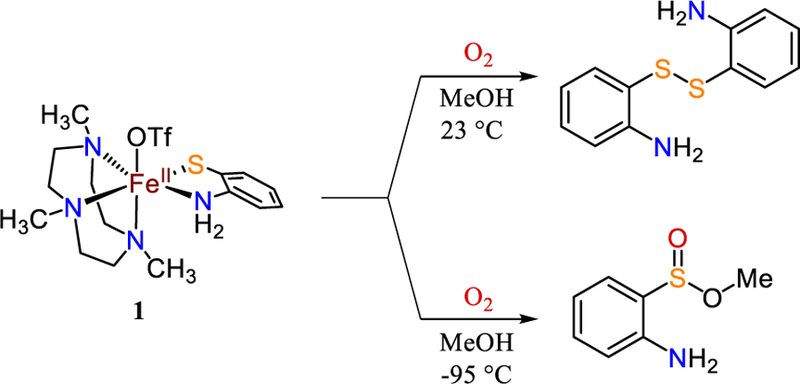
Reaction of 1 with O2 in MeOH at 23 °C and −95 °C
Figure 11.
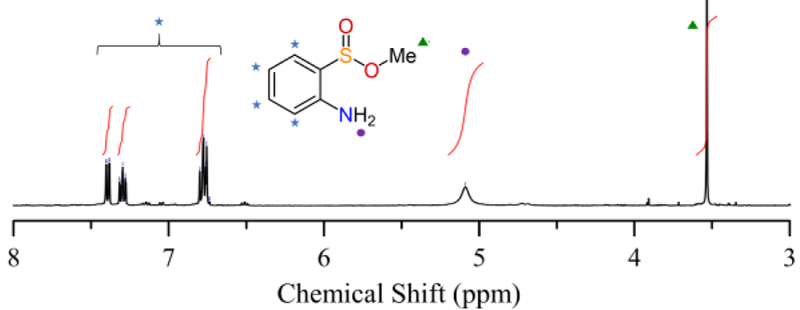
1H NMR spectrum in CD3CN of the purified reaction product from the oxygenation of 1 in MeOH at −95 °C.
Reaction of the CF3-substituted complex 2 with excess O2 at 23 °C resulted in the formation of disulfide67 (Figure S27), as seen with 1. In contrast, as observed for 1, the reaction of complex 2 with excess O2 at −95 °C leads to S-oxygenation. As shown in Scheme 4, reaction of 2 with O2 at −95 °C in MeOH leads to a µ-oxo diferric complex (5) with bridging sulfinate ligands. This complex was characterized by single crystal XRD, and the molecular structure is shown in Figure 12. The structure is similar to other FeIII2(µ-O)(Me3TACN)2(L)2 (e.g., L = RCO2-, Cl-, CO3-) complexes,68–72 with Fe–µ–O distances = 1.8096(7) and Fe–O–Fe angle = 126.41°. The ESI-MS spectrum of crystalline 5 displays a mono-cation peak with m/z = 1066 and an isotope distribution pattern consistent with [(FeIII2(Me3TACN)2(abt)2)] + 5O – 1H + 1OTf-. Use of 18O2 results in the two sets of peaks consistent with the incorporation of both 4 and 5 labelled O atoms (Figure S29). These labelling studies indicate that the sulfinate and bridging oxo ligands are derived from O2; however, the bridging oxo ligand can exchange with adventitious water, as has been observed in other FeIII (µ-O) complexes.73 In contrast to 1, esterification of the S-oxygenated sulfinate is not observed. This result supports the conclusions that 1 goes through a sulfinate species en route to forming the methyl ester, and both 1 – 2 react with O2 to give the S-oxygenated sulfinate product, similar to CDO.
Scheme 4.
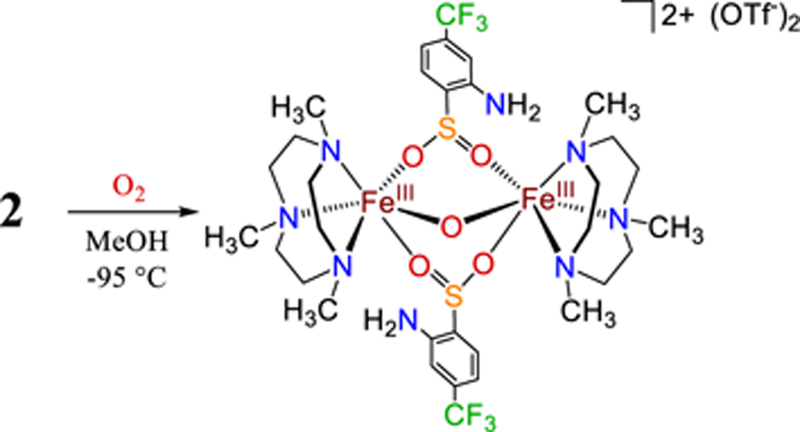
Reaction of 2 with O2 in MeOH at −95 °C
Figure 12.
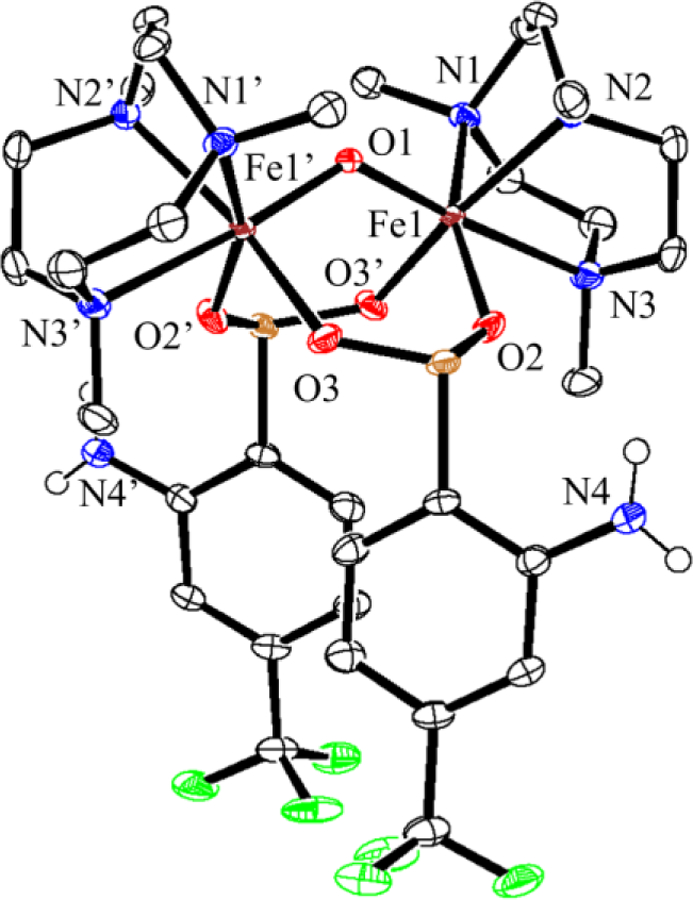
Displacement ellipsoid plot (50% probability level) for 5 at 110(2) K. The triflate counterions and hydrogen atoms (except those on N4 and N4’) have been omitted for clarity.
In contrast to 1 – 2, Complexes 3 and 4 are unstable in MeOH, as seen by the appearance of at least three quadrupole doublets in the Mössbauer spectra for 3–57Fe and 4–57Fe dissolved in MeOH. The 1H NMR spectra of 3 and 4 after dissolution in MeOH reveal the presence of protonated [iPr3TACNH]+ (Figure S30),31 suggesting that decay of 3 and 4 results from protonation and decomplexation of the iPr3TACN ligand in MeOH.
A proposed reaction pathway is shown in Scheme 5. Reaction of 1 – 2 with O2 should lead to the formation of an FeIII–superoxo species.19 Attack of the bound O2 on the sulfur center initiates S-oxygenation,74 giving an Fe(sulfinate) species, which can undergo esterification in MeOH to give the methylsulfinate ester in the case of 1. Esterification of sulfinic acids in the presence of Lewis acids is documented.75 The oxo-bridged diferric product seen for 2 is typical for the oxidation of FeII by O2.76–77 At this time we are not able to determine if the formation of the µ-oxo core occurs either before or after S-oxygenation.
Scheme 5.
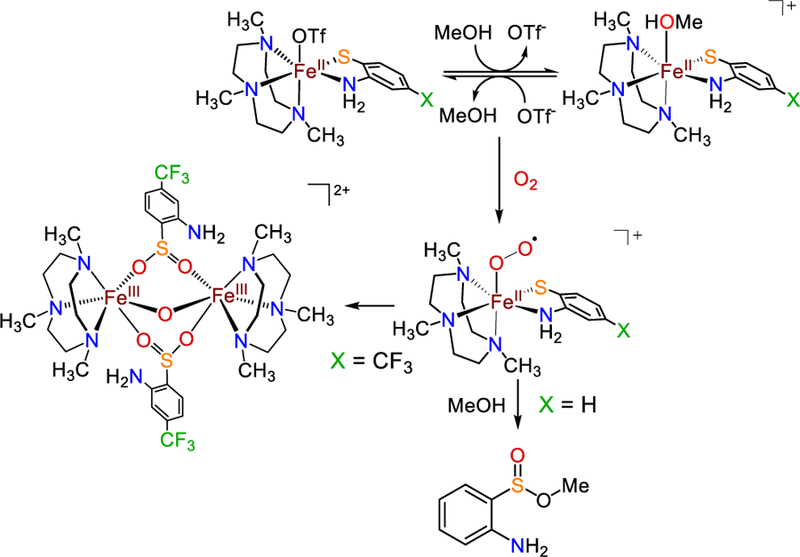
Proposed Reaction Pathway for Reaction of 1 – 2 with O2 in MeOH
Enzyme studies: Reaction of C93G CDO with abt and O2.
The C93G variant of Rattus norvegicus CDO was prepared and purified as described previously.26Addition of the non-native abt substrate was examined under aerobic conditions in MOPS buffer (pH 7.1) at 25 °C. Analysis by 1H NMR spectroscopy (Figure 13) shows that 2-aminophenyl disulfide is the major product of abt oxidation by C93G CDO in the presence of O2. The same reaction was examined in the presence of alcohol (MeOH, EtOH) (20% v/v), reproducing the conditions employed by Pierce,18 but the NMR data indicate formation of the same product (Figure 13d, e). The 1H NMR spectrum for abt + H2O2 (Figure 13b), which should give disulfide in situ, matches the spectrum from the abt reaction. Extraction of the organic product into CDCl3 followed by NMR also led to the same disulfide spectrum. Analysis by ESI-MS (positive ion mode) confirms the presence of disulfide [M-H]+ 249.0516 m/z. The ESIMS of the reactions containing ROH did show weak signals for the corresponding benzothiazole at [M-H]+ 136.0216 m/z (MeOH derivative) and 150.0372 m/z (EtOH derivative) in addition to disulfide, but the intensities of these signals suggest these products form in trace amounts compared to the disulfide.
Figure 13.
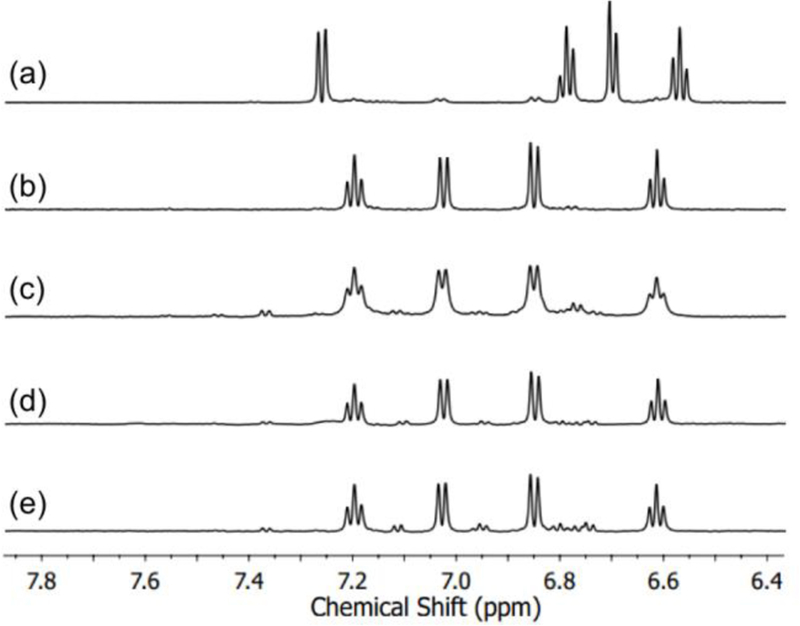
1H NMR spectra measured in MOPS buffer pH 7.1 of (a) abt; (b) abt after reaction with 2 equiv H2O2; (c) C93G CDO (10 µM) reacted with abt (5 mM); (d) C93G CDO (10 µM) reacted with abt (5 mM) with 20% MeOH; (e) C93G CDO (10 µM) reacted with abt (5 mM) with 20% EtOH.
C93G CDO Kinetics with abt and O2.
The steady state rate of C93G-mediated abt oxidation was measured by observing independently the rates of abt depletion by Ellman’s assay78 and 2-aminophenyl disulfide formation by detection at 335 nm using a 96-well microplate reader. In both cases, non-enzymatic oxidation was considered. Values of kobs versus abt concentration are plotted in Figure 14 and show comparable rates to those observed by Pierce et al.,18 and approximately half the rate with the correct substrate cysteine.26 Linear regression of these data points provides second order rate constants of 47 ± 3 M−1 s−1 for thiol depletion and 24 ± 1 M−1 s−1 for disulfide formation. The fact that depletion is double the rate of product formation further confirms that disulfide is the major product. Both best-fit lines do not intercept zero, but rather approach zero rate at ~0.5 mM. This intercept is unusual but reproducible. We suggest that this “threshold” concentration, where there appears to be little reaction until ~0.5 mM substrate has been added, may indicate a radical type mechanism. Similar reaction profiles with abtCF3 as substrate were observed, although significantly slower than with abt (8 ± 4 M−1 s−1 for thiol depletion).
Figure 14.
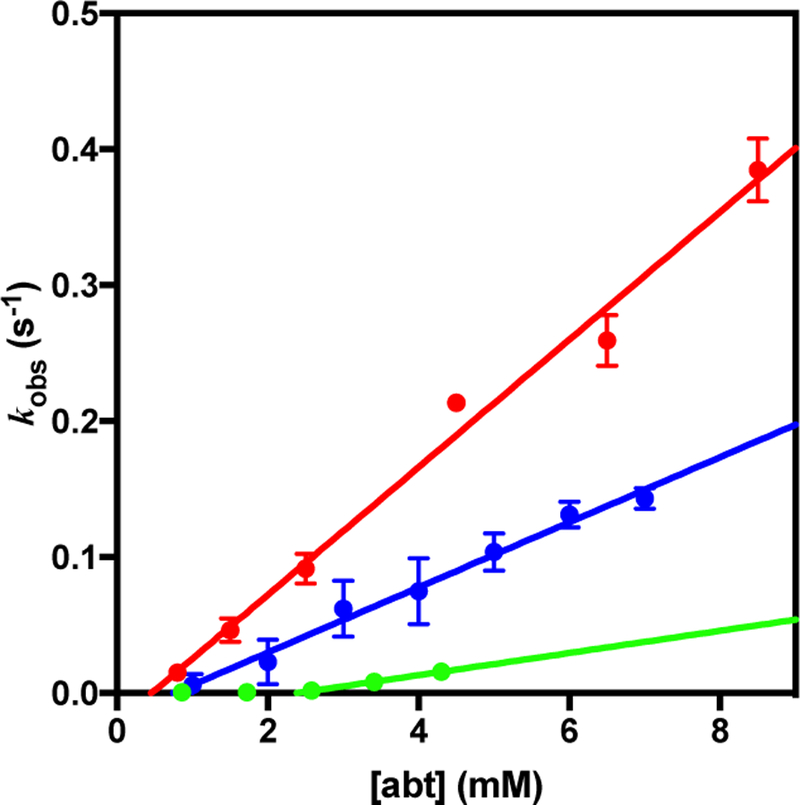
Variation of kobs with initial abt concentration for the C93G CDO-mediated turnover of abt in MOPS buffer (pH 7.1) monitoring either the depletion of abt (red) or the formation of disulfide (blue). Depletion of abtCF3 is given in green.
We have observed disulfide formation when presenting cysteine to Pa3MDO from Pseudomona aeruginosa.2, 26 Like the present study, this work also yielded kinetics that are first order in both enzyme and thiol. Previously, we indicated that this type of kinetics behavior is similar to that seen for glutathione peroxidases, which also show such a rate equation where formation of the sulfenate is rate determining.79 Weak binding of the substrate would promote such reactivity by prematurely releasing substrate following addition of the first O atom and before rearrangement to allow addition of the second O atom.74 Indeed, Pa3MDO shows a Kd for cysteine of ~1.3 mM.2 It was therefore proposed to investigate substrate binding by Mössbauer spectroscopy.
Binding Studies of C93G CDO with abt.
Mössbauer spectroscopy was used to investigate abt interactions with C93G CDO over a range of abt concentrations (0 – 9.3 mM) under anaerobic conditions, as Mössbauer is very sensitive to the first coordination sphere of iron. Representative Mössbauer spectra collected are presented in Figure 15 and fitted parameters are given in Table S11. Addition of abt leads to a slight decrease in the isomer shift (~0.05 mm s−1), and slight line broadening as compared to the spectrum for the enzyme alone. Changes in the spectra are minor compared to those observed when cysteine is bound and thus rules out S/N coordination by abt. Overall the Mössbauer spectra suggest that abt does not coordinate directly to the iron but may bind weakly within the CDO active site. Incorrect binding of the substrate agrees well with formation of disulfide as the major oxidation product, rather than sulfination.
Figure 15.
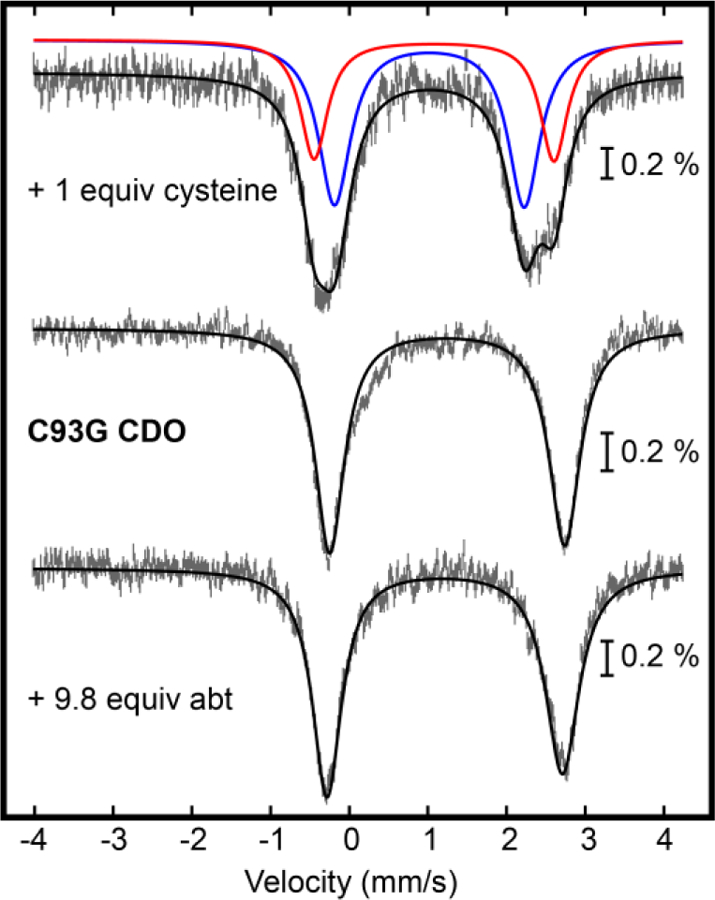
Mössbauer spectra of C93G CDO (middle) in the presence of 1 equiv cysteine (top) and 8.8 equiv abt (bottom). Fits are shown as red, blue, or black lines.
Conclusions
This works describes a combined study including both model complexes (FeII(N4S(thiolate)) and the relevant thiol dioxygenase enzyme cysteine dioxygenase. The same non-native substrate, aminobenzenethiolate (abt), was examined for both models and protein. The synthesized series of structurally well-defined ferrous complexes provided spectroscopic data that informed on their solution state versus solid state structures, and in the case of Mössbauer spectroscopy, allowed for direct comparison with data on the protein. A clear pattern in the Mössbauer data was seen for 5-coord versus 6-coord complexes, which provided important information for comparison with overlapping Mössbauer signals observed for substrate-bound CDO. Previous single-turnover investigations on cys-bound CDO revealed two sub-spectra pointing to a mixture of 5- and 6-coord enzyme,10 but calculations failed to satisfactorily support these assignments. The Mössbauer parameters for the two species seen in cys-bound CDO and C93G CDO (δ = 1.03, |ΔEQ| = 2.28 and δ = 1.10, |ΔEQ| = 3.14 mm s−1) agree remarkably well with the parameters for the 5- and 6-coord model complexes. The models allow us to conclude that the 5-coord/6-coord assignments for the enzyme are indeed correct.
The 6-coord ferrous complexes 1 and 2 both react with dioxygen at low temperature to S-oxygenate the non-native abt substrate in a manner similar to the native thiol dioxygenase reaction. The low temperature conditions likely enhance binding of O2, and prevent autooxidation pathways that could lead to disulfide formation in the models, as opposed to the enzymatic system which has evolved to readily bind O2 under ambient conditions. Only a few examples of dioxygenation to give a sulfinate product from an FeII-thiolate complex have been reported, and complex 5 provides a rare example of a structurally characterized, sulfinate-bound iron product.80 In contrast, the same abt derivatives are not S-oxygenated by C93G CDO, but rather give disulfide as the major product. Examination of the addition of abt substrate to C93G CDO reveals that only minor changes occur in the Mössbauer spectrum, consistent with no binding of the substrate directly to the metal center. The inability to directly coordinate is likely due to the differences between abt and the native cys substrate, including the planar phenyl ring in abt, and the lack of a carboxylate substituent seen in cys, which forms a salt bridge with Arg60. These differences likely prevent correct chelation of abt to the iron center, in contrast to the model complexes. Assuming that the reactivity of the models at low temperature is comparable to the enzyme at room temperature, we can conclude that proper S/N chelation in thiol dioxygenases is key for successful S-oxygenation.
Our conclusion that there are both 5-coord, and water-bound 6-coord ferrous sites in cys-bound CDO suggest that the prevailing paradigm for nonheme iron dioxygenases may need revision. Both 5-coord and 6-coord sites rapidly disappear upon reaction with dioxygen,10 and within 40 ms approximately 75% of the bound cys is converted to cysteine sulfinic acid. This rapid oxidation of substrate could be explained by very fast conversion of the 6-coord sites into the 5-coord sites, thereby allowing all O2 reactivity to occur through the 5-coord center. However, it is also possible that the H2O molecule coordinated in the sixth site is relatively weakly bound and can be displaced by dioxygen, allowing for S-oxygenation to occur via both 5-coord and 6-coord centers. The fact that the model complexes 1 – 2 are 6-coord in both the solid-state and in solution, and readily react with O2 to give sulfinate products, suggests the latter pathway may be a viable mechanism for CDO.
Experimental Section
General Considerations.
All syntheses and manipulations were conducted in an N2-filled drybox (Vacuum Atmospheres, O2 < 0.2 ppm, H2O < 0.5 ppm) or using standard Schlenk techniques under an atmosphere of Ar unless otherwise noted. Me3TACN was purchased from Matrix Scientific, degassed by three freeze-pump-thaw cycles, and stored over 3 Å molecular sieves. iPr3TACN was synthesized according to a reported procedure.81 2-aminothiophenol was purchased from Alfa Aesar, degassed by three freeze-pump-thaw cycles, and stored over 3 Å molecular sieves. Fe(OTf)2•2MeCN and 57Fe(OTf)2•2MeCN were prepared according to a literature procedure.82,57Fe metal (95.93%) was purchased from Cambridge Isotope Laboratories. Formaldehyde–d2, formic acid–d2 in D2O (21% w/w), and 18O2 (98 atom %) were purchased from ICON Isotopes (Summit, N.J.). All other reagents were purchased from commercial vendors and used without further purification. Acetonitrile, acetonitrile-d3, methanol, methanol-d4, and hexamethyldisiloxane were distilled from CaH2. Tetrahydrofuran was dried over Na/benzophenone and subsequently distilled. Butyronitrile was distilled from Na2CO3/KMnO4 according to a reported procedure.83 Diethyl ether was obtained from a PureSolv solvent purification system (SPS). All solvents were degassed by a minimum of three freeze-pump-thaw cycles and stored over freshly activated 3 Å molecular sieves in the drybox following distillation.
Instrumentation.
The 1H and 19F NMR spectra were measured on a Bruker 300 MHz or a Bruker 400 MHz spectrometer. 2H NMR spectra were recorded with a broad-band coil on a 300 MHz instrument with 2H resonance at 46 MHz. Solution magnetic susceptibilities were determined by Evans’ method.49–50 Chemical shifts were referenced to reported solvent resonances.84 UV–vis experiments were carried out on Agilent 5453 diode-array spectrophotometer using a 1 cm cuvette. Midwest Microlab (Indianapolis, IN) conducted elemental analyses on samples prepared and shipped in ampules sealed under vacuum. Infrared spectra were recorded on a ThermoNicolet Nexus 670 FTIR Spectrometer with an ATR diamond crystal stage using the OMNIC 6.0a software package. Infrared spectra were collected on crystalline solids that were crushed into a fine powder. High resolution EI mass spectra were obtained using a VG70S double-focusing magnetic sector mass spectrometer (VG Analytical, Manchester, UK, now Micromass/Waters) equipped with an MSS data acquisition system (MasCom, Bremen, Germany). ESI mass spectra were acquired using a Finnigan LCQ Duo ion-trap mass spectrometer equipped with an electrospray ionization source (Thermo Finnigan, San Jose, CA. Mössbauer spectra were recorded on a spectrometer from SEE Co. (Edina, MN) operating in the constant acceleration mode in a transmission geometry. The sample was kept in an SVT - 400 cryostat from Janis (Wilmington, MA), using liquid He as a cryogen for 5 K data collection and liquid N2 as a cryogen for 80 K measurements. Isomer shifts were determined relative to the centroid of the spectrum of a metallic foil of α–Fe collected at room temperature. Data analysis was performed using version F of the program WMOSS (www.wmoss.org) and quadrupole doublets were fit to Lorentzian lineshapes.85
DFT Computational Studies.
All geometry optimizations and Mossbauer calculations were performed in the ORCA-3.0.2 program package.86 Initial geometries were obtained from X-ray crystallographic models. Optimized geometries were calculated using the BP8687–88 or the TPSSh functional.89 The 6–311g* basis set90–92 was used for all Fe, N, O, F, P, Cl and S atoms and the 6–31g* basis set93–94 was used for all C and H atoms. Solvent effects in these calculations were accounted for by using a continuum solvation model (COSMO)95 in all cases. Due to SCF convergence difficulties in some cases, damping parameters were altered using the Slowconv function in ORCA. Frequency calculations at the same level of theory confirmed that all optimizations had converged to true minima on the potential energy surface (i.e., no imaginary frequencies). The optimized structures were used for Mössbauer calculations. Mössbauer parameters were computed using the B3LYP96–98 functional and a combination of CP(PPP)62 for Fe and def2-TZVP44, 99 for all other atoms. The angular integration grid was set to Grid4 (No-FinalGrid), with increased radial accuracy for the Fe atom (In-tAcc 7). To simulate solid state effects, a continuum solvation model was included (COSMO) with a solvent of intermediate dielectric (methanol), which has been shown to lead to accurate predictions of Mössbauer parameters.100 The isomer shift was obtained from the electron density at the Fe nucleus, using a linear fit function δcalc = α(ρ(0) − C) + β. For the methodology described here, α = −0.44024 mm s−1 a.u.3, β = 2.1042 mm s−1, and C = 11813 a.u.3, which was derived by plotting ρ(0) versus the experimental isomer shift of a series of Fe complexes. The calibrated quadrupole splitting was obtained from a linear fit function: |ΔEQ|calibrated = η(|ΔEQ|calc) – B0 with η = 0.84003 B0 = −0.0019275 mm s–1, which was derived by plotting |ΔEQ|calc versus |ΔEQ|exp.
All TD-DFT calculations were performed using the quantum computing suite ORCA 4.0.101 The electronic absorption spectra were calculated using TD-DFT and a triple-ξ basis set (def2-TZVP)99 in combination with functionals of varying Hartree-Fock (HF) exchange (TPSSh 10%,89 B3LYP 20%,96 PBE0 25%,102 CAM-B3LYP 19–65%103). All calculations employed the resolution of identity approach (RI-J)104 and chain-of-spheres (COSX)105 approximation for the Coulomb integral calculations and numerical integration of HF exchange, respectively. The zeroth-order regular approximation (ZORA) was used to model relativistic effects.106 Solvent effects in these calculations were accounted for by using the conductor-like polarizable continuum model (CPCM) and specifying the dielectric constant (ε) for acetonitrile.107 At least 50 vertical transitions were calculated for each compound. Simulated absorption spectra were generated using the ORCA spectral creation tool (orca_mapspc) using a constant fixed-width half-maximum line broadening of 2500 cm−1. Each simulated spectrum was scaled by a factor of 0.8 to allow for better comparison with experimental data. Computed excitations were individually analyzed by generating and visualizing transition difference density plots using the ORCA orbital plotting tool (orca_plot) and the UCSF Chimera extensible molecular modeling program, respectively.
Synthesis of Me3TACN–d9.
Synthesis of Me3TACN–d9 was performed according to a modified version of a previously reported procedure.108 H3TACN (1.050 g, 8.127 mmol) was dissolved in D2O (2 mL). Excess formaldehyde–d2 (7 g, 150 mmol) and formic acid–d2 in D2O (21% w/w) (10 g, 70 mmol) were added to the H3TACN solution resulting in a color change to orange. The solution was refluxed for 25 h. The orange solution was cooled to 0 °C and the pH was slowly raised to >10 by dropwise addition of aqueous NaOH (15 M). The resulting slurry was then extracted with CHCl3 (~100 mL) three times and all the organics were combined and dried over MgSO4, filtered, and dried under vacuum, yielding a pale yellow oil (1.107 g, 6.13 mmol, 75%), which was then degassed and stored over molecular sieves (3 Å) prior to use.
[FeII(Me3TACN)(abt)(OTf)] (1).
To a solution of Me3TACN (155 mg, 0.903 mmol) in CH3CN (~5 mL) was added Fe(OTf)2•2 CH3CN (394 mg, 0.903 mmol) to afford the previously reported purple species, [FeII(Me3TACN)(CH3CN)3](OTf)2.30 In a separate vial, trimethylamine (126 µL, 0.903 mmol) was added dropwise to a solution of 2-aminothiophenol (97 µL, 0.90 mmol) in THF (~5 mL) and stirred for 5 min. The resulting pale yellow solution was added dropwise to the solution containing [FeII(Me3TACN)(CH3CN)3](OTf)2, resulting in formation of a yellow slurry. The reaction was stirred for 1 h before filtering through a bed of celite and removing the solvent under reduced pressure. To the resulting pale yellow residue was added THF (~3 mL), followed by minimal CH3CN to dissolve the solid. Vapor diffusion of Et2O afforded 1 as colorless crystals after 12 h (360 mg, 80%). UV-vis (CH3CN): λmax = 268 nm (ε = 11000 M−1 cm−1). Selected IR bands, ν (cm−1): 3232, 3122, 2992, 2876, 1600, 1467, 1301, 1210 (s, νOTf), 1011(s, νOTf), 747, 637 (s, νOTf). 1H NMR: (CD3CN, 400 MHz): δ 133.65, 56.83, 39.08, 37.21, 17.87, 14.30, 12.06 ppm. 19F NMR: (CD3CN, 300 MHz): δ −77.18 ppm. Evans method (CD3CN, 400 MHz): μeff = 5.37 μB. Anal. Calcd for C16H27N4F3O3S2Fe: C, 38.41; H, 5.44; N, 11.20. Found: C, 38.44; H, 5.51; N, 11.24. [FeII(Me3TACN–d9)(abt)(OTf)] (1–d9) was synthesized using the same procedure as that for 1 using Me3TACN–d9.
[FeII(Me3TACN)(abtCF3)(OTf)] (2).
To a solution of Me3TACN (132 mg, 0.767 mmol) in CH3CN (~5 mL) was added Fe(OTf)2•2CH3CN (335 mg, 0.767 mmol) to afford [FeII(Me3TACN)(CH3CN)3](OTf)2.30 In a separate vial, triethylamine (214 µL, 1.54 mmol) was added dropwise to a solution to 2-amino-4-(trifluoromethyl)benzenethiol hydrochloride (176 mg, 0.767 mmol) in THF (~5 mL) and stirred for five min. The yellow slurry was filtered through celite to produce a pale yellow solution, which was then added to the solution containing [FeII(Me3TACN)(CH3CN)3](OTf)2 to afford a yellow solution. The reaction was stirred for 1 h before filtering through a bed of celite and removing the solvent under reduced pressure. To the resulting pale yellow residue was added THF (~3 mL) followed by minimal CH3CN to dissolve the solid. Vapor diffusion of Et2O afforded colorless crystals after 12 h (326 mg, 75%). UV-vis (CH3CN): λmax = 286 nm (ε = 10400 M−1 cm−1). Selected IR bands, ν (cm−1): 3317, 3223, 2891, 1610, 1462, 1327, 1282, 1232, 1157, 1221, 1107, 1080 (s, νOTf), 1012(s, νOTf), 890, 831, 635 (s, νOTf). 1H NMR: (CD3CN, 400 MHz): δ 133.34, 55.46, 41.74, 40.21, 17.02, 14.74 ppm. 19F NMR: (CD3CN, 300 MHz): δ −75.03, −23.97 ppm. Evans method (CD3CN, 400 MHz): μeff = 5.50 μB. Anal. Calcd for C17H26N4F6O3S2Fe: C, 35.92; H, 4.61; N, 9.86. Found: C, 35.91; H, 4.62; N, 9.70.
[FeII(iPr3TACN)(abt)](OTf) (3).
A solution of iPr3TACN (151 mg; 0.589 mmol) in THF (~1 mL) was added to a solution of Fe(OTf)2•2CH3CN (257 mg, 0.589 mmol) dissolved in CH3CN (~3 mL) and stirred for 1 h to afford the previously reported FeII(iPr3TACN)(OTf)2.31 In a separate vial, 2-aminobenzenethiol (74 mg, 0.59 mmol) was stirred with Et3N (82.0 μL, 0.589 mmol) in THF (~2 mL) for 30 min. The resulting solution of 2-aminobenzenethiolate was added to FeII(iPr3TACN)(OTf)2, and an immediate color change from peach to dark brown was observed along with visible precipitate formation. The reaction was stirred for 12 h and the resulting solution was filtered through celite before removing the volatiles under reduced pressure. The dark brown oily residue was redissolved in a mixture of 1:1 CH3CN/THF (~2 mL). Vapor diffusion of Et2O afforded 3 as colorless blocks (177 mg, 51%). UV-vis (CH3CN): λmax = 259 nm (ε = 11000 M−1 cm−1). Selected IR bands, ν (cm−1). 3288, 3244, 2970, 1599, 1470, 1382, 1258, 1257, 1144, 1221, 1072 (s, νOTf), 1026 (s, νOTf), 759, 720, 621 (s, νOTf) 1H NMR: (CD3CN, 400 MHz): δ 40.69, 30.37, −0.61 ppm. 19F NMR: (CD3CN, 300 MHz): δ −79.47 ppm. Evans method (CD3CN, 400 MHz): μeff =5.46 μB. Anal. Calcd for C22H39N4O3S2F3Fe: C, 45.21; H, 6.73; N, 9.58. Found: C, 45.52; H, 6.78; N, 9.57.
[FeII(iPr3TACN)(abtCF3)](OTf) (4).
A solution of iPr3TACN (138 mg, 0.540 mmol) in THF (~1 mL) was added to a solution of Fe(OTf)2•2CH3CN (191 mg, 0.540 mmol) dissolved in CH3CN (~3 mL) and stirred for 1 h to afford the previously reported species FeII(iPr3TACN)(OTf)2.31 In a separate vial, triethylamine (150.6 µL, 1.080 mmol) was added dropwise to a solution of 2-amino-4-(trifluoromethyl)benzenethiol hydrochloride in THF (~3 mL) and stirred for 30 min. The slurry was filtered through celite to remove the precipitate. The resulting pale yellow solution of 2-amino-4-(trifluoromethyl)benzenethiolate was added to the solution containing [FeII(iPr3TACN)(OTf)2] and an immediate color change from pale yellow to red was observed. The reaction mixture was stirred for 12 h and the resulting solution was filtered through celite before removing the volatiles under reduced pressure. The residue was redissolved in a mixture of 1:1 CH3CN/THF (~2 mL). Vapor diffusion of Et2O afforded colorless blocks of 4 (103 mg, 30%). UV-vis (CH3CN): λmax = 272 nm (ε = 9500 M−1 cm−1). Selected IR bands, ν (cm−1). 3261, 3138, 2985, 1606, 1495, 1380, 1324, 1273, 1248, 1159, 1075, 1068 (s, νOTf), 1026 (s, νOTf), 964, 894, 721, 636 (s, νOTf). 1H NMR: (CD3CN, 400 MHz): δ 137.75 (br), 45.24, 28.47, 17.97, −28.21(br) ppm. 19F NMR: (CD3CN, 300 MHz): δ −78.87, −27.89 ppm. Evans method (CD3CN, 400 MHz): μeff = 5.52 μB. Anal. Calcd for C23H38N4O3S2F6Fe: C, 42.34; H, 5.87; N, 8.59. Found: C, 42.05; H, 6.04; N, 8.64.
Reaction of 1 with excess O2 at 23 °C.
An excess amount of O2 gas was bubbled vigorously through a solution of 1 (19 mg, 38 μmol) in MeOH (10 mL) for ~1 min. The colorless solution rapidly turned blue then yellow/brown within 5 s. The solvent was removed and the crude product was dissolved in CD3CN for analysis by 1H NMR spectroscopy. The 1H NMR spectrum exhibited peaks corresponding to 2-aminophenyl disulfide at δ = 7.14 (td, 1H), 7.05 (dd, 1H), 6.75 (dd, 2H), 6.51 (td, 1H), and 4.72 (s, br, 2H) ppm.
Reaction of 1 with excess O2 at −95 °C.
A solution of 1 (59 mg, 0.12 mmol) in MeOH (10 mL) was cooled to −95 °C, and O2 gas was added by vigorous bubbling through the solution. A rapid color change from colorless to dark blue was noted. Further bubbling of O2 was continued for 15 min at −95 °C, followed by gradual warming to 23 °C. A color change from blue to red/brown occurred during warming. The solvent was removed under vacuum to give a red oil which was dissolved in CD3CN for analysis by 1H NMR spectroscopy. Peaks observed at δ = 7.38 (d, 1H), 7.29 (t, 1H), 6.78 (t, 2H), 5.09 (s, br, 2H), and 3.53 (s, 3H) ppm corresponded to methyl 2-aminobenzenesulfinate. The organic product was purified on neutral alumina (100% EtOAc). The solvent was removed yielding pure methyl 2-aminobenzenesulfinate as a yellow oil. Quantification by comparison of 1H NMR integrations with a standard (1,1,1-trifluorotoluene) indicated that methyl 2-aminobenzenesulfinate was formed in 42% yield. 1H NMR: (CD3CN, 400 MHz): δ = 7.38 (d, 1H), 7.29 (t, 1H), 6.78 (t, 2H), 5.09 (s, br, 2H), and 3.53 (s, 3H) ppm. 1H NMR: (CDCl3, 400 MHz): δ = 7.39 (d, 1H), 7.28 (t, 1H), 6.81 (t, 1H), 6.68 (d, 1H) 4.92 (s, br, 2H), and 3.61 (s, 3H) ppm. EI-MS (m/z): 171 (M+), 140 {(M – OCH3)}+.
Reaction of 2 with excess O2 at −95 °C.
A solution of 2 (63 mg, 0.11 mmol) in MeOH (5 mL) was cooled to −95 °C, and O2 gas was added by vigorous bubbling through the solution. A rapid color change from colorless to dark blue/purple was noted. Further bubbling of O2 was continued for 30 min at −95 °C, followed by gradual warming to 23 °C. A color change from blue/purple to red/brown occurred during warming. The solvent was removed under vacuum and the resulting red oil was washed with CH2Cl2 to remove organic byproducts. The red solid was dissolved in CH3CN and layered with diethyl ether affording red crystals of 5 over 24 h. (24 mg, 36%). 1H NMR: (CD3CN, 400 MHz): δ = 26.0 (br), 18.2 (br), 15.1 (br), 9.4 (s), and 8.4 (s) ppm. 19F NMR: (CD3CN, 300 MHz): δ −77.40, −60.73 ppm.
Protein purification and sample preparation.
The C93G variant of CDO was expressed and purified using the Strep-tag® affinity purification system as described previously.17 C93G purity was measured to be >95% as determined by sodium dodecyl sulfate-polyacrylamide gel electrophoresis. C93G contained 5% endogenously bound iron as determined by a ferrozine assay.109 Purified protein was concentrated and used as appropriate.
Product distribution of C93G CDO catalyzed reaction.
The products produced through reaction of abt with enzyme were assessed qualitatively by NMR spectroscopy and mass spectrometry. 1H NMR experiments were performed using a 600 MHz Bruker Avance III spectrometer using excitation sculpting for water suppression (zgespg) rather than presaturation as used previously.110 C93G (10µM) in the absence and presence of ethanol and methanol (20% v/v) in MOPS buffer (100 mM, pH 7.1) were mixed with abt (5 mM) to give a total volume of 1 mL. The reaction mixture was kept at 25 °C and stirred constantly for 3 hours. Aliquots (700 μL) of each reaction were transferred into NMR tubes with a D2O capillary for 1H NMR analysis at 25 °C. Following analysis, the final reaction mixture (200 μL) was added to ice-cold acetonitrile (800 μL) to precipitate the protein and the supernatant injected into a Thermo Exactive Plus Orbitrap mass spectrometer equipped with high voltage electrospray ionization source (H-ESI) for high resolution and accurate mass analysis. The spray voltage, temperature of ion transfer tube and S-lens of the mass spectrometer were set at 3.8 kV, 250 °C and 50%, respectively. The full MS scans were acquired at a resolving power of 140,000 at m/z 200, an auto gain control (AGC) target value of 3.0 × 10⁶ and a maximum injection time of 200 ms.
abt; 1H NMR (H2O, 600 MHz): δ = 7.27 (d, J = 8.1 Hz, 1H), 6.80 (t, J = 7.6 Hz, 1H), 6.71 (d, J = 7.8 Hz, 1H), 6.58 (t, J = 7.9 Hz, 1H) ppm. abt reacted with 2 equivalents H2O2 in MOPS (100mM, pH 7.1); 1H NMR (H2O, 600 MHz): δ = 7.22 (t, J = 8.2 Hz, 2H), 7.04 (d, J = 8.2 Hz, 2H), 6.87 (d, J = 8.6 Hz, 2H), 6.63 (t, J = 7.9 Hz, 2H) ppm. Sample extracted into CDCl3; 1H NMR (CDCl3, 600 MHz): δ = 7.15 (ddd, J = 4.7, 3.8, 1.4 Hz, 4H), 6.71 (dd, J = 7.8, 0.7 Hz, 2H), 6.58 (td, J = 7.5, 1.3 Hz, 2H) ppm. abt reacted with C93G; 1H NMR (H2O, 600 MHz): δ = 7.20 (t, J = 8.0 Hz, 1H), 7.03 (d, J = 8.2 Hz, 1H), 6.85 (d, J = 8.3 Hz, 1H), 6.62 (t, J = 7.9 Hz, 1H) ppm. MS: major product: m/z 249.0514 [M-H]+ abt reacted with C93G in 20 v/v methanol; 1H NMR (H2O, 600 MHz): δ = 7.20 (t, J = 8.2 Hz, 1H), 7.03 (d, J = 8.3 Hz, 1H), 6.85 (d, J = 8.5 Hz, 1H), 6.62 (t, J = 7.9 Hz, 1H) ppm. MS- major product: 2-aminophenyl disulfide m/z 249.0514 [M-H]+; minor product: benzothiazole m/z 136.0216 [M-H]+. abt reacted with C93G in 20 v/v ethanol; 1H NMR (H2O, 600 MHz): δ = 7.20 (t, J = 8.0 Hz, 1H), 7.02 (dd, J = 12.9, 8.9 Hz, 1H), 6.84 (dd, J = 12.6, 8.4 Hz, 1H), 6.65 – 6.58 (m, 1H) ppm. MS- major product: 2-aminophenyl disulfide m/z 249.0514 [M-H]+; minor product: benzothiazole m/z 150.0372 [M-H]+.
Enzyme kinetics.
Kinetics of abt turnover were followed either via an Ellman’s based assay78 to follow thiol disappearance or direct UV-vis to follow product formation. UV-vis measurements were performed using a Clariostar Monochromator Microplate Reader (BMG LABTECH), a Varian Cary 50 Bio spectrophotometer (Agilent Technologies) or a stopped-flow apparatus (SX-20MV, Applied Photophysics).
The extinction coefficient for abt was measured under anaerobic conditions as abt oxidizes readily at higher pH. To overcome this, various concentrations of abt (200–2000 μM) were rapidly mixed with MOPS buffer in a stopped-flow apparatus to give a final pH of 7.1. Initial spectra were averaged and used to calculate the extinction coefficients between 250 and 500 nm (Figure S31). 2-aminophenyl disulfide was produced by reaction of varying concentrations of abt with two equivalents of hydrogen peroxide. UV-vis spectra of the resulting solutions allowed equivalent extinction coefficients between 250 and 500 nm to be calculated (Figure S31).
The rate of 2-aminophenyl disulfide formation was measured at 335 nm, where the largest difference in absorbance between product and reactant was observed. It was found that abt was sensitive to photolysis and so measurements were carried out in a 96-well plate to decrease the pathlength and render photolysis negligible. Abt was also sensitive to non-enzymatic oxidation at the pHs under study and so control experiments in the absence of enzyme allowed the enzymatic rate to be calculated. A pH profile was performed to determine the optimal pH for detection of C93G activity (Figure S36), which was found to be pH 7.1, the maximum activity of C93G with cysteine.26 Typical experiments reacted C93G (2–10 μM) with abt (0–8.5 mM) in MOPS buffer (100 mM, pH 7.1). Absorbance-time profiles were converted to concentration-time profiles and the steadystate rates determined through linear regression of the initial linear section of the curve (approximately first 8 min). Division by the enzyme concentration allowed kobs (s−1) to be calculated.
Mössbauer spectroscopy of C93G CDO with abt.
Mössbauer spectroscopy of 57Fe bound C93G (~1.2 mM) was carried out under anaerobic conditions as previously described. Cysteine and a range of 2-aminothiophenol solutions were made and added anaerobically to purified C93G in Tris buffer (100 mM, pH 8.1) and frozen anaerobically in liquid nitrogen. Spectra were measured on a Mössbauer spectrometer (Science Engineering & Education Co., MN) equipped with a closed-cycle refrigerator system from Janis Research Co. and SHI (Sumi-tomo Heavy Industries Ltd.) and a temperature controller from Lakeshore Cryotronics, Inc. Data were collected in constant acceleration mode in transmission geometry with an applied field of 47 mT parallel to the γ-rays.
Supplementary Material
ACKNOWLEDGMENT
The NIH (GM119374 to D.P.G.) is gratefully acknowledged for financial support. G.N.L.J. further thanks the Faculty of Science, the University of Melbourne for financial support. J. P M. is thankful for funding from the Johns Hopkins University Dean’s Undergraduate Research Award and Provost’s Undergraduate Research Award. Computer time was provided by the Maryland Advanced Research Computing Center (MARCC).
Footnotes
ASSOCIATED CONTENT
Supporting Information
IR spectra, UV-vis spectra, 1H NMR, 2H NMR, 19F NMR, and Mössbauer spectra, EI-MS data, metrical parameters for DFT-computed structures, TD-DFT calculations, Mössbauer DFT calculation calibration data, crystallographic data for 1 – 4. (PDF)
Coordinates for all DFT-optimized structures (PDF)
Crystallographic data for 1 (CIF)
Crystallographic data for 2 (CIF)
Crystallographic data for 3 (CIF)
Crystallographic data for 4 (CIF)
Crystallographic data for 5 (CIF)
This material is available free of charge via the Internet at http://pubs.acs.org.
Notes
The authors declare no competing financial interest.
REFERENCES
- (1).Stipanuk MH; Simmons CR; Karplus PA; Dominy JE Jr. Amino Acids 2011, 41, 91–102. [DOI] [PMC free article] [PubMed] [Google Scholar]
- (2).Tchesnokov EP; Fellner M; Siakkou E; Kleffmann T; Martin LW; Aloi S; Lamont IL; Wilbanks SM; Jameson GNL J. Biol. Chem 2015, 290, 24424–24437. [DOI] [PMC free article] [PubMed] [Google Scholar]
- (3).Dominy JE Jr.; Simmons CR; Hirschberger LL; Hwang J; Coloso RM; Stipanuk MH J. Biol. Chem 2007, 282, 25189–25198. [DOI] [PubMed] [Google Scholar]
- (4).Ye S; Wu X; Wei L; Tang D; Sun P; Bartlam M; Rao Z J. Biol. Chem 2007, 282, 3391–3402. [DOI] [PubMed] [Google Scholar]
- (5).Wang Y; Griffith Wendell P; Li J; Koto T; Wherritt Daniel J; Fritz E; Liu A Angew. Chem., Int. Ed. Engl 2018, 57, 8149–8153. [DOI] [PMC free article] [PubMed] [Google Scholar]
- (6).Kal S; Que L Jr. J. Biol. Inorg. Chem 2017, 22, 339–365. [DOI] [PubMed] [Google Scholar]
- (7).de Visser SP; Straganz GD J. Phys. Chem. A 2009, 113, 1835–1846. [DOI] [PubMed] [Google Scholar]
- (8).Diebold AR; Neidig ML; Moran GR; Straganz GD; Solomon EI Biochemistry 2010, 49, 6945–6952. [DOI] [PMC free article] [PubMed] [Google Scholar]
- (9).Leitgeb S; Nidetzky B Biochem. Soc. Trans 2008, 36, 1180. [DOI] [PubMed] [Google Scholar]
- (10).Tchesnokov EP; Faponle AS; Davies CG; Quesne MG; Turner R; Fellner M; Souness RJ; Wilbanks SM; de Visser SP; Jameson GNL Chem. Commun 2016, 52, 8814–8817. [DOI] [PMC free article] [PubMed] [Google Scholar]
- (11).Fellner M; Siakkou E; Faponle AS; Tchesnokov EP; de Visser SP; Wilbanks SM; Jameson GN J. Biol. Inorg. Chem 2016, 21, 501–510. [DOI] [PubMed] [Google Scholar]
- (12).Blaesi EJ; Fox BG; Brunold TC Biochemistry 2015, 54, 2874–2884. [DOI] [PMC free article] [PubMed] [Google Scholar]
- (13).Solomon EI; Goudarzi S; Sutherlin KD Biochemistry 2016, 55, 6363–6374. [DOI] [PMC free article] [PubMed] [Google Scholar]
- (14).Costas M; Mehn MP; Jensen MP; Que L Chem. Rev 2004, 104, 939–986. [DOI] [PubMed] [Google Scholar]
- (15).Light KM; Hangasky JA; Knapp MJ; Solomon EI J. Am. Chem. Soc 2013, 135, 9665–9674. [DOI] [PMC free article] [PubMed] [Google Scholar]
- (16).Chai SC; Bruyere JR; Maroney MJ J. Biol. Chem 2006, 281, 15774–15779. [DOI] [PubMed] [Google Scholar]
- (17).Tchesnokov EP; Wilbanks SM; Jameson GNL Biochemistry 2012, 51, 257–264. [DOI] [PubMed] [Google Scholar]
- (18).Morrow WP; Sardar S; Thapa P; Hossain MS; Foss FW Jr.; Pierce BS Arch. Biochem. Biophys 2017, 631, 66–74. [DOI] [PMC free article] [PubMed] [Google Scholar]
- (19).During the revision process for this manuscript, an FeII(abt) complex prepared from an anionic tris(pyrazolyl)borate ligand was reported. The formation of an FeIII–superoxide intermediate at −80 °C from reaction with O2 was supported by resonance Raman spectroscopy. No S-oxygenation was seen in this case, only disulfide formation. See Fischer AA; Lindeman SV; Fiedler AT Chem. Commun 2018, 54, 11344–11347. [DOI] [PMC free article] [PubMed] [Google Scholar]
- (20).McQuilken AC; Goldberg DP Dalton Trans 2012, 41, 10883–10899. [DOI] [PMC free article] [PubMed] [Google Scholar]
- (21).Sahu S; Goldberg DP J. Am. Chem. Soc 2016, 138, 11410–11428. [DOI] [PMC free article] [PubMed] [Google Scholar]
- (22).Sallmann M; Siewert I; Fohlmeister L; Limberg C; Knispel C Angew. Chem., Int. Ed. Engl 2012, 51, 2234–2237. [DOI] [PubMed] [Google Scholar]
- (23).Sallmann M; Braun B; Limberg C Chem. Commun 2015, 51, 6785–6787. [DOI] [PubMed] [Google Scholar]
- (24).Sallmann M; Limberg C Acc. Chem. Res 2015, 48, 2734–2743. [DOI] [PubMed] [Google Scholar]
- (25).Fischer AA; Stracey N; Lindeman SV; Brunold TC; Fiedler AT Inorg. Chem 2016, 55, 11839–11853. [DOI] [PMC free article] [PubMed] [Google Scholar]
- (26).Davies CG; Fellner M; Tchesnokov EP; Wilbanks SM; Jameson GN L. Biochemistry 2014, 53, 7961–7968. [DOI] [PubMed] [Google Scholar]
- (27).Slep LD; Mijovilovich A; Meyer-Klaucke W; Weyhermüller T; Bill E; Bothe E; Neese F; Wieghardt KJ Am. Chem. Soc 2003, 125, 15554–15570. [DOI] [PubMed] [Google Scholar]
- (28).Drüeke S; Chaudhuri P; Pohl K; Wieghardt K; Ding XQ; Bill E; Sawaryn A; Trautwein AX; Winkler H; Gurman SJ J. Chem. Soc., Chem. Commun 1989, 59–62. [Google Scholar]
- (29).Jüstel T; Weyhermüller T; Wieghardt K; Bill E; Lengen M; Trautwein AX; Hildebrandt P Angew. Chem., Int. Ed. Engl 1995, 34, 669–672. [Google Scholar]
- (30).Blakesley DW; Payne SC; Hagen KS Inorg. Chem 2000, 39, 1979–1989. [DOI] [PubMed] [Google Scholar]
- (31).Diebold A; Elbouadili A; Hagen KS Inorg. Chem 2000, 39, 3915–3923. [DOI] [PubMed] [Google Scholar]
- (32).Thangavel A; Wieliczko M; Bacsa J; Scarborough CC Inorg. Chem 2013, 52, 13282–13287. [DOI] [PubMed] [Google Scholar]
- (33).Robinson K; Gibbs GV; Ribbe PH Science 1971, 172, 567–570. [DOI] [PubMed] [Google Scholar]
- (34).Addison AW; Rao TN; Reedijk J; van Rijn J; Verschoor GC J. Chem. Soc., Dalton Trans 1984, 1349–1356. [Google Scholar]
- (35).Sano Y; Lau N; Weitz AC; Ziller JW; Hendrich MP; Borovik AS Inorg. Chem 2017, 56, 14118–14128. [DOI] [PMC free article] [PubMed] [Google Scholar]
- (36).Prat I; Company A; Corona T; Parella T; Ribas X; Costas M Inorg. Chem 2013, 52, 9229–9244. [DOI] [PubMed] [Google Scholar]
- (37).Groom CR; Bruno IJ; Lightfoot MP; Ward SC Acta Crystallogr., Sect. B: Struct. Sci., Cryst. Eng. Mater 2016, 72, 171–179. [DOI] [PMC free article] [PubMed] [Google Scholar]
- (38).Bose K; Huang J; Haggerty BS; Rheingold AL; Salm RJ; Walters MA Inorg. Chem 1997, 36, 4596–4599. [DOI] [PubMed] [Google Scholar]
- (39).Ghosh P; Begum A; Bill E; Weyhermüller T; Wieghardt K Inorg. Chem 2003, 42, 3208–3215. [DOI] [PubMed] [Google Scholar]
- (40).Zdilla MJ; Verma AK; Lee SC Inorg. Chem 2008, 47, 11382–11390. [DOI] [PubMed] [Google Scholar]
- (41).Gorelsky SI; Basumallick L; Vura-Weis J; Sarangi R; Hodgson KO; Hedman B; Fujisawa K; Solomon EI Inorg. Chem 2005, 44, 4947–4960. [DOI] [PMC free article] [PubMed] [Google Scholar]
- (42).Fiedler AT; Halfen HL; Halfen JA; Brunold TC J. Am. Chem. Soc 2005, 127, 1675–1689. [DOI] [PubMed] [Google Scholar]
- (43).Cho J; Yap GP; Riordan CG Inorg. Chem 2007, 46, 11308–11315. [DOI] [PubMed] [Google Scholar]
- (44).Weigend F; Ahlrichs R Phys. Chem. Chem. Phys 2005, 7, 3297–3305. [DOI] [PubMed] [Google Scholar]
- (45).Barton D; König C; Neugebauer JJ Chem. Phys 2014, 141, 164115. [DOI] [PubMed] [Google Scholar]
- (46).Yanai T; Tew DP; Handy NC Chem. Phys. Lett 2004, 393, 51–57. [Google Scholar]
- (47).Neese F Coord. Chem. Rev 2009, 253, 526–563. [Google Scholar]
- (48).Leipzig BK; Rees JA; Kowalska JK; Theisen RM; Kavčič M; Poon PCY; Kaminsky W; DeBeer S; Bill E; Kovacs JA Inorg. Chem 2018, 57, 1935–1949. [DOI] [PMC free article] [PubMed] [Google Scholar]
- (49).Evans DF; Jakubovic DAJ Chem. Soc., Dalton Trans 1988, 2927–2933. [Google Scholar]
- (50).Evans DF J. Chem. Soc 1959, 2003–2005. [Google Scholar]
- (51).Biswas AN; Puri M; Meier KK; Oloo WN; Rohde GT; Bominaar EL; Münck E; Que L Jr. J. Am. Chem. Soc 2015, 137, 2428–2431. [DOI] [PubMed] [Google Scholar]
- (52).Gütlich P; Bill E; Trautwein A, Mössbauer spectroscopy and transition metal chemistry: fundamentals and applications Springer-Verlag: Berlin, 2011. [Google Scholar]
- (53).Holzhacker C; Calhorda MJ; Gil A; Carvalho MD; Ferreira LP; Mereiter K; Stöger B; Pittenauer E; Allmaier G; Kirchner K Polyhedron 2014, 81, 45–55. [Google Scholar]
- (54).Stieber SC; Milsmann C; Hoyt JM; Turner ZR; Finkelstein KD; Wieghardt K; DeBeer S; Chirik PJ Inorg. Chem 2012, 51, 3770–3785. [DOI] [PubMed] [Google Scholar]
- (55).Nicolini C; Reiff WM Inorg. Chem 1980, 19, 2676–2679. [Google Scholar]
- (56).Das UK; Daifuku SL; Iannuzzi TE; Gorelsky SI; Korobkov I; Gabidullin B; Neidig ML; Baker RT Inorg. Chem 2017, 56, 13766–13776. [DOI] [PubMed] [Google Scholar]
- (57).Bukowski MR; Koehntop KD; Stubna A; Bominaar EL; Halfen JA; Münck E; Nam W; Que L Jr. Science 2005, 310, 1000–1002. [DOI] [PubMed] [Google Scholar]
- (58).Pangia TM; Davies CG; Prendergast JR; Gordon JB; Siegler MA; Jameson GNL; Goldberg DP J. Am. Chem. Soc 2018, 140, 4191–4194. [DOI] [PMC free article] [PubMed] [Google Scholar]
- (59).Coucouvanis D; Swenson D; Baenziger NC; Murphy C; Holah DG; Sfarnas N; Simopoulos A; Kostikas A J. Am. Chem. Soc 1981, 103, 3350–3362. [DOI] [PubMed] [Google Scholar]
- (60).Chatel S; Chauvin AS; Tuchagues JP; Leduc P; Bill E; Chottard JC; Mansuy D; Artaud I Inorg. Chim. Acta 2002, 336, 19–28. [Google Scholar]
- (61).Marini PJ; Murray KS; West BO J. Chem. Soc., Dalton Trans 1983, 143–151. [Google Scholar]
- (62).Römelt M; Ye S; Neese F Inorg. Chem 2009, 48, 784–785. [DOI] [PubMed] [Google Scholar]
- (63).Mbughuni MM; Chakrabarti M; Hayden JA; Meier KK; Dalluge JJ; Hendrich MP; Münck E; Lipscomb JD Biochemistry 2011, 50, 10262–10274. [DOI] [PMC free article] [PubMed] [Google Scholar]
- (64).Sui X; Weitz AC; Farquhar ER; Badiee M; Banerjee S; von Lintig J; Tochtrop GP; Palczewski K; Hendrich MP; Kiser PD Biochemistry 2017, 56, 2836–2852. [DOI] [PMC free article] [PubMed] [Google Scholar]
- (65).Pierce BS; Gardner JD; Bailey LJ; Brunold TC; Fox BG Biochemistry 2007, 46, 8569–8578. [DOI] [PubMed] [Google Scholar]
- (66).Du B; Li Z; Qian P; Han J; Pan Y Chem. - Asian J 2016, 11, 478–481. [DOI] [PubMed] [Google Scholar]
- (67).Ezeh VC; Harrop TC Inorg. Chem 2013, 52, 2323–2334. [DOI] [PubMed] [Google Scholar]
- (68).Drüeke S; Wieghardt K; Nuber B; Weiss J Inorg. Chem 1989, 28, 1414–1417. [Google Scholar]
- (69).Drüeke S; Wieghardt K; Nuber B; Weiss J; Fleischhauer HP; Gehring S; Haase WJ Am. Chem. Soc 1989, 111, 8622–8631. [Google Scholar]
- (70).Hartman JAR; Rardin RL; Chaudhuri P; Pohl K; Wieghardt K; Nuber B; Weiss J; Papaefthymiou GC; Frankel RB; Lippard SJ J. Am. Chem. Soc 1987, 109, 7387–7396. [Google Scholar]
- (71).Payne SC; Hagen KS J. Am. Chem. Soc 2000, 122, 6399–6410. [Google Scholar]
- (72).Tshuva EY; Lee D; Bu W; Lippard SJ J. Am. Chem. Soc 2002, 124, 2416–2417. [DOI] [PubMed] [Google Scholar]
- (73).Sanders-Loehr J; Wheeler WD; Shiemke AK; Averill BA; Loehr TM J. Am. Chem. Soc 1989, 111, 8084–8093. [Google Scholar]
- (74).Aluri S; de Visser SP J. Am. Chem. Soc 2007, 129, 14846–14847. [DOI] [PubMed] [Google Scholar]
- (75).Drabowicz J; Kwiatkowska M; Kielbasinski P Synthesis 2008, 2008, 3563–3564. [Google Scholar]
- (76).Musie G; Lai C-H; Reibenspies JH; Sumner LW; Darensbourg MY Inorg. Chem 1998, 37, 4086–4093. [DOI] [PubMed] [Google Scholar]
- (77).Theisen RM; Shearer J; Kaminsky W; Kovacs JA Inorg. Chem 2004, 43, 7682–7690. [DOI] [PMC free article] [PubMed] [Google Scholar]
- (78).Fellner M; Doughty LM; Jameson GNL; Wilbanks SM Anal. Biochem 2014, 459, 56–60. [DOI] [PubMed] [Google Scholar]
- (79).Toppo S; Flohé L; Ursini F; Vanin S; Maiorino M Biochim. Biophys. Acta 2009, 1790, 1486–1500. [DOI] [PubMed] [Google Scholar]
- (80).McQuilken AC; Jiang Y; Siegler MA; Goldberg DP J. Am. Chem. Soc 2012, 134, 8758–8761. [DOI] [PMC free article] [PubMed] [Google Scholar]
- (81).Nakanishi S; Kawamura M; Kai H; Jin RH; Sunada Y; Nagashima H Chem. - Eur. J 2014, 20, 5802–5814. [DOI] [PubMed] [Google Scholar]
- (82).Hagen KS Inorg. Chem 2000, 39, 5867–5869. [DOI] [PubMed] [Google Scholar]
- (83).Armarego WLF; Chai CLL, Purification of Laboratory Chemicals 6th ed.; Elsevier/Butterworth-Heinemann: Amsterdam ; Boston, 2009. [Google Scholar]
- (84).Fulmer GR; Miller AJM; Sherden NH; Gottlieb HE; Nudelman A; Stoltz BM; Bercaw JE; Goldberg KI Organometallics 2010, 29, 2176–2179. [Google Scholar]
- (85).Prisecaru I WMOSS4 Mössbauer Spectral Analysis Software, Version F; 2009. [Google Scholar]
- (86).Neese F WIREs Comput. Mol. Sci 2012, 2, 73–78. [Google Scholar]
- (87).Perdew JP Phys. Rev. B 1986, 33, 8822–8824. [DOI] [PubMed] [Google Scholar]
- (88).Becke AD Phys. Rev. A 1986, 33, 2786–2788. [DOI] [PubMed] [Google Scholar]
- (89).Tao J; Perdew JP; Staroverov VN; Scuseria GE Phys. Rev. Lett 2003, 91, 146401–146404. [DOI] [PubMed] [Google Scholar]
- (90).Krishnan R; Binkley JS; Seeger R; Pople JA J. Chem. Phys 1980, 72, 650–654. [Google Scholar]
- (91).McLean AD; Chandler GS J. Chem. Phys 1980, 72, 5639–5648. [Google Scholar]
- (92).Blaudeau J-P; McGrath MP; Curtiss LA; Radom L J. Chem. Phys 1997, 107, 5016–5021. [Google Scholar]
- (93).Hehre WJ; Lathan WA J. Chem. Phys 1972, 56, 5255–5257. [Google Scholar]
- (94).Dill JD; Pople JA J. Chem. Phys 1975, 62, 2921–2923. [Google Scholar]
- (95).Klamt A; Schüürmann G J. Chem. Soc., Perkin Trans 2 1993, 799–805. [Google Scholar]
- (96).Becke AD J. Chem. Phys 1993, 98, 5648–5652. [Google Scholar]
- (97).Lee C; Yang W; Parr RG Phys. Rev. B 1988, 37, 785–789. [DOI] [PubMed] [Google Scholar]
- (98).Stephens PJ; Devlin FJ; Chabalowski CF; Frisch MJ J. Phys. Chem 1994, 98, 11623–11627. [Google Scholar]
- (99).Schäfer A; Horn H; Ahlrichs R J. Chem. Phys 1992, 97, 2571–2577. [Google Scholar]
- (100).Pápai M; Vankó G J. Chem. Theory Comput 2013, 9, 5004–5020. [DOI] [PMC free article] [PubMed] [Google Scholar]
- (101).Neese F WIREs Comput. Mol. Sci 2018, 8, e1327. [Google Scholar]
- (102).Adamo C; Barone V J. Chem. Phys 1999, 110, 6158–6170. [Google Scholar]
- (103).Tawada Y; Tsuneda T; Yanagisawa S; Yanai T; Hirao K J. Chem. Phys 2004, 120, 8425–8433. [DOI] [PubMed] [Google Scholar]
- (104).Eichkorn K; Treutler O; Öhm H; Häser M; Ahlrichs R Chem. Phys. Lett 1995, 240, 283–290. [Google Scholar]
- (105).Neese F; Wennmohs F; Hansen A; Becker U Chem. Phys 2009, 356, 98–109. [Google Scholar]
- (106).Pantazis DA; Chen X-Y; Landis CR; Neese F J. Chem. Theory Comput 2008, 4, 908–919. [DOI] [PubMed] [Google Scholar]
- (107).Marenich AV; Cramer CJ; Truhlar DG J. Phys. Chem. B 2009, 113, 6378–6396. [DOI] [PubMed] [Google Scholar]
- (108).Hage R; Gunnewegh EA; Niël J; Tjan FSB; Weyhermüller T; Wieghardt K Inorg. Chim. Acta 1998, 268, 43–48. [Google Scholar]
- (109).Stookey LL Anal. Chem 1970, 42, 779–781. [Google Scholar]
- (110).Siakkou E; Wilbanks SM; Jameson GN Anal. Biochem 2010, 405, 127–131. [DOI] [PubMed] [Google Scholar]
Associated Data
This section collects any data citations, data availability statements, or supplementary materials included in this article.


