

Abstract
The mechanisms that power the physiological events occurring in cilia, flagella, and microvilli are of fundamental importance for the functions of these important and ubicuous organelles. The olfactory epithelium is mostly populated by ciliated olfactory sensory neurons (OSNs) and surrounding sustentacular cells (SCs) with apical microvilli. The only OSN dendrite extends to the surface forming a knob projecting several chemosensory cilia of ∼50 × 0.2 μm, devoid of inner membranes embedded in a mucus layer. Upon odorant binding, odor receptors couple to G-protein activating adenylyl cyclase, producing cAMP. cAMP opens cyclic nucleotide-gated channels allowing a Ca2+ influx that opens Ca2+-activated Cl− channels, generating the receptor potential. Many enzymes are activated in chemotransduction to hydrolyze ATP. The knob contains approximately two mitochondria; assuming that the cilia ATP is 1 mm and diffuses along it at ∼10 μm in 500 ms, ATP from the knob mitochondria may not fulfill the demands of transduction over the full length of the cilium, which suggests an additional ATP source. We measured millimolar glucose in rat mucus; we detected glucose transporter GLUT3 in rat and toad (Caudiverbera caudiverbera) OSN cilia, SC microvilli, and glycolytic enzymes in rat cilia. We also found that the cilia and knob can incorporate and accumulate 2-deoxyglucose (glucose analog), but not when blocking GLUT. Glucose removal and the inhibition of glycolysis or oxidative phospholylation impaired the odor response. This evidence strongly suggests that glycolysis in the cilia and knob oxidative phosphorylation together fuel chemotransduction.
SIGNIFICANCE STATEMENT How processes occurring in cilia and flagella are powered is a matter of general interest. Substantial progress has been made in unraveling the sensory transduction mechanisms, commonly occurring in such structures; however, the energy sources powering them have been scarcely explored. Accessibility to the specialized sensory organelles and their small dimensions have been limiting factors. Olfactory sensory neurons chemosensory cilia are elongated, mucus embedded, fully exposed structures particularly amenable for a multidisciplinary study of this problem, as done here. We demonstrate the occurrence and functionality of glucose uptake and glycolysis in the cilia. We support that odor transduction relies on ATP generated by oxidative phosphorylation in the dendrite and glycolytically in the cilia using glucose internalized from the mucus.
Keywords: chemotransduction, glucose transport, glycolysis, mucus, olfactory cilia, oxidative phosphorylation
Introduction
The main olfactory epithelium (OE) comprises three main cell types, olfactory sensory neurons (OSNs), sustentacular cells (SCs) and basal cells. OSNs project a single dendrite to the epithelial surface, where it swells forming the dendritic knob. Several cilia specialized in odor transduction project from the knob into a mucus layer that covers the epithelial surface. In rodents, the cilia are ∼50 μm long and ∼0.2 μm wide, and lack any inner membranes, including mitochondria (Jenkins et al., 2009). SCs surround the OSNs and contribute to generate the mucus (Okano and Takagi, 1974). Upon odorant binding, receptor proteins at the ciliary membrane couple to G-proteins (Golf) activating adenylate cyclase (ACIII), which generates cAMP. This nucleotide opens cationic unselective cyclic nucleotide-gated channels (CNGs), raising luminal free Ca2+. This Ca2+ opens Ca2+-activated Cl− channels, causing an additional inward current due to a Cl− efflux, potentiating the receptor potential. ATP is required by ACIII, ATPases, and a variety of kinases, such as GPCR-kinase, Ca2+/calmodulin-dependent protein kinase type-II, and phosphokinase-C; therefore, it is expected that chemotransduction demands substantial amounts of ATP, especially under prolonged stimulation (Ronnett and Moon, 2002; Pifferi et al., 2010; Rospars et al., 2010). The few mitochondria in the knob (∼2; Fluegge et al., 2012) are likely a relevant source of ATP to the cilia. Luminal ATP levels in the cilium have not been measured, but in resting conditions it is possibly ∼1 mm, the typical cytoplasmic concentration. If the ATP diffusion coefficient in the cilium is as in cytoplasm (D = ∼0.9 × 10⁻⁶ cm2/s; Vendelin and Birkedal, 2008), we can estimate that ATP diffuses a distance of 10 μm in 500 ms. Under regimes of extensive odorant exposures, as it occurs in nature, ATP consumption must increase along the entire cilium. Therefore, luminal ATP should be replenished constantly and efficiently to prevent metabolic fatigue, especially at distant regions from the knob. We asked whether ATP generated in the knob by oxidative phosphorylation is sufficient for satisfying the requirements of an activated cilium or there is an additional ATP supply in these organelles. Studies on cilia and flagella of other cell types document a wide range of ATP requirements and sources, from a dominant supply from the cell body in the vertebrate photoreceptor outer segment (a modified cilium; Wong-Riley, 2010), to a fully local production in the flagellum of the green algae Chlamydomonas reinhardtii (Mitchell et al., 2005).
Previously, we reported an apical distribution of facilitative glucose transporters (GLUTs) in the olfactory epithelium, suggesting a directional traffic of glucose from the blood vessels in the lamina propria toward the mucosal epithelium surface through the SCs (Nunez-Parra et al., 2011). GLUT immunoreactivity was observed in the ciliary layer, which in addition to the cilia contains the microvilli of SCs. These observations suggested the possibility that SCs release glucose to the mucus where it would be incorporated by the cilia as an energy source. Here we provide strong evidence supporting this idea, and conclude that both oxidative phosphorylation in the dendrite and glycolysis in the cilia supply ATP for chemotransduction.
Materials and Methods
Animals.
Sprague-Dawley male rats (postnatal day 18–24) and adult Caudiververa caudiververa toads were used. Toads were purchased from a supplier authorized by the Chilean Service of Agriculture and Livestock (Servicio Agrícola y Ganadero). Animals were handled and killed according to the guidelines of the Animal Ethics Committee of the University of Chile and the Fondo Nacional de Ciencia y Tecnología de Chile (FONDECYT). Rats were killed with CO2 inhalation followed by decapitation. Toads were decapitated and pithed (American Veterinary Medical Association).
Isolated OSNs.
Rat and toad olfactory epithelia were removed from the nasal cavities and OSNs were isolated by mechanical dissociation (Sanhueza et al., 2000; Schmachtenberg et al., 2003). The preparation was maintained for at most 6 h at 4°C after extracted.
Whole-mount preparation.
The head of the rat was sectioned sagittally and the septum was removed to expose the intact turbinates coated with the olfactory epithelia.
Immunofluorescence.
For immunocytochemistry, rat or toad OSNs were dissociated mechanically from the olfactory mucosa into a divalent cation-free solution containing the following (in mm): 140 NaCl, 5 KCl, 10 glucose, 10 HEPES (4-(2-hydroxyethyl)-1-piperazineethanesulfonic acid buffer), pH 7.4. The cell suspension was allowed to attach to poly-l-lysine-coated (Sigma-Aldrich) 13 mm round glass coverslips for 2 h and fixed with 4% PFA at room temperature. Fixed cells were permeabilized with tris-buffered saline solution (TBS) supplemented with Triton X-100 (TBS-T; 0.2% v/v). Blockage of unspecific sites was performed by incubation with TBS-T supplemented with BSA (1% w/v) and 0.1 mm glycine (blocking buffer). The sample was then incubated overnight with rabbit anti-GLUT3 IgG (1:100; Catalog #SAB4502804 Sigma-Aldrich) or anti-GLUT3 IgG, Catalog #GT31-A Alpha Diagnostics International) at 4°C in a humidified chamber, followed by incubation with a secondary goat anti-rabbit IgG coupled to AlexaFluor-488 (1:500; Invitrogen) for 2 h at room temperature in the dark. The coverslips were allowed to dry and mounted on glass slides with Fluoromount (Southern-Biotech). We tested for the antibody specificity by preincubation of the IgG with the antigenic peptide (1:20; Catalog #GT31-P, Alpha Diagnostics International) for 2 h at room temperature in blocking buffer and agitation. The unblocked anti-GLUT3 IgG was processed in parallel. For double labeling, immunofluorescence cells were incubted overnight with the primary rabbit anti-GLUT3 and goat anti-OMP (1:200, Catalog #544–10001 Wako Chemicals), washed and then incubated 2 h at room temperature with the secondary donkey anti-rabbit Alexa-488 (1:500, A-21206, Invitrogen) and donkey anti-goat Alexa-594 (1:500, ab150136, Abcam). Cell nuclei were visualized using TOPRO-3 or DAPI (Invitrogen).
Immunoblotting.
Rat olfactory mucosa extracts were obtained by homogenizing the tissue in a Potter-Elvehjem homogenizer (PRO Scientific) at 4°C in a solution containing the following (in mm) 145 NaCl, 5 KCl, 1.6 K2HPO4, 2 MgSO4, 7.5 D-glucose, 20 HEPES, pH 7.4, supplemented with a protease inhibitor cocktail containing aprotinin, leupeptin, pepstatin, benzamidine, and PMSF (Roche). The homogenate was centrifuged at 600 × g for 5 min at 4°C and the pellet was discarded. The olfactory cilia membrane extracts were obtained according to Washburn (Washburn et al., 2002). The proteins were resolved by SDS-PAGE (15–20 μg/lane) in an 8–10% (w/v) polyacrylamide gel, transferred to nitrocellulose membranes and left overnight at 4°C with rabbit anti-CNGA2 (1:2000, Catalog #APC-045, Alomone Labs), rabbit anti-LDH (1:1000, Catalog #LS-B8758), goat anti-PKM2 (1:1000, Catalog #LS-B1450), goat anti-GAPDH (1:1000, Catalog #LS-B2193; all LSBio), and rabbit anti-ACIII (1:1000, Catalog #sc-588, Santa Cruz Biotechnology) antibodies. After extensive washing, the nitrocellulose membranes were incubated with peroxidase-labeled anti-rabbit (1:5000; Catalog #474-1516, KPL) or peroxidase-labeled anti-goat IgG (1:5000, Catalog #sc-2354, Santa Cruz Biotechnology) for 2 h at room temperature. The reaction was developed using the enhanced chemiluminescence Western blot analysis system (Thermo Scientific).
Glucose uptake assay.
Olfactory mucosa exposed in the nasal cavity was gently washed with control solution, containing the following (in mm): 145 NaCl, 5 KCl, 10 HEPES, 1 MgCl2, 1 CaCl2, and 1 D-glucose, pH 7.4. To allow glucose uptake, the preparation was incubated for 40 min at 37°C in darkness in a modified control solution, where glucose was replaced by 9.5 mm sucrose (to reduce the competitive inhibition of GLUTs). This solution was supplemented with 0.5 mm of the fluorescent glucose analog 2-NBDG [2-(N-(7-nitrobenz-2-oxa-1,3-diazol-4-yl)amino)-2-deoxyglucose, Invitrogen; Yoshioka et al., 1996]. Afterward, the tissue was washed for 10 min with a flow of fresh normal control solution. The turbinates were then carefully removed from the nasal cavity under a dissecting microscope with fine tweezers, mounted upside down on a coverslip over a drop of control solution, and immediately imaged with an inverted confocal microscope. For glucose-uptake experiments with isolated OSNs, the cells were attached to a poly-l-lysine precoated 13 mm coverglass, and incubated in control solution supplemented with 0.5 mm of the fluorescent glucose analog (2-NBDG) for 50 min at 37°C. Afterward, the cells were washed two times with fresh extracellular solution and imaged in the confocal microscope. The same protocol was used in the experiments in which the transporter was blocked with cytochalasin B (Maher and Simpson, 1994); the drug was added to the control solution at a final concentration of 20 μm.
Glucose detection.
Detection of glucose was done with the BioSystems glucose kit. After sectioning the rat head sagittally, the septum was removed carefully. The mucus was gently adsorbed with a 3 × 3 mm piece of filter paper previously weighted in a PCR tube. For an estimation of the collected volume, the tube was weighted again after adsorption. 40 μl of the same solution used in the glucose standard kit was added to each sample. The glucose content of the mucus was determined colorimetrically using three 10 μl replicas per sample.
Electroolfactogram recording.
Field recordings were performed on the whole-mount rat preparation, which contains an intact olfactory mucosa, using a standard procedure (Cygnar et al., 2010). Ag/AgCl electrodes were inserted in glass pipettes filled with control solution; the recording electrode was positioned on the epithelium (turbinate II) and the reference electrode at a distant region on the mucosa. Electrical signals were amplified (×10,000; Warner Instruments, DP-301), bandpass filtered at 0.3–1 kHz and digitized (Dagan). For stimulation, a nitrogen pressure pulse controlled by a picospritzer was applied through a flask containing control solution supplemented with isoamyl acetate at three different concentrations: 0.1, 1.0, and 10 mm. The pressure forced the humidified air in equilibrium with the odorant in the flask to flow through an outlet tubing connected to a glass capillary positioned close to the epithelium. During the experiment, a constant flow of humidified air was gently blown onto the epithelium. The drugs and control solution were applied at least 2 min before recording.
Loose-patch recording.
Dissociated cells were viewed with an Olympus IX70 inverted microscope equipped with a 40× DIC objective. We used an Axopatch 1D patch-clamp amplifier (Molecular Devices) for recording extracellular currents in the loose-patch modality (Reisert and Matthews (2001). The pClamp 6 software (Molecular Devices) was used for data acquisition and analysis. The pipettes were made of soft glass capillaries (Globe Scientific) to tip diameters 2–4 μm. To deliver odors we used multibarrel puffer pipettes (Sutter Instrument) with tip diameters of ∼2 μm each, positioned ∼10 μm from the cilia. A custom-made computer-operated picospritzer controlled the solution flow from the barrels. Nonparametric analyses of the data are shown in box plots. Comparison of the data was performed using the Friedman's nonparametric test. Plots containing all the experimental data are also shown.
Solutions for loose-patch and electroolfactogram experiments.
N-acetyl glucosamine (10 mm) and antimycin A (5 μm) were added to the control solution (see above). Iodoacetate was used at 5 mm. Rotenone dissolved in chloroform was added from a stock solution to a final concentration of 10 μm. Both concentrations are typically used in physiological studies.
The odorant isoamyl acetate (electroolfactogram experiments) or a blend of odorants (citralva, isoamyl acetate, geraniol, 0.2 mm each, loose-patch experiments) were added to control solution. Odorants were from Aldrich Chemical. The rest of the chemicals were from Sigma-Aldrich.
Confocal microscopy.
Images were acquired with an inverted laser confocal microscope (Carl Zeiss LSM 510 META) equipped with a Plan Neofluar 40× oil-immersion objective. In the immunohistochemistry experiments, optical slices were 1.6–2 μm wide and the z-stack ∼50 μm. The images were analyzed with the Zeiss LSM Image Browser (Carl Zeiss) and ImageJ. The high-magnification image of rat olfactory cilia (Fig. 1B, right) was deconvolved to increase the signal–noise ratio, using the Huygens Scripting software (Scientific Volume Imaging) and the algorithm based on the Classic Maximum Likelihood estimator.
Figure 1.
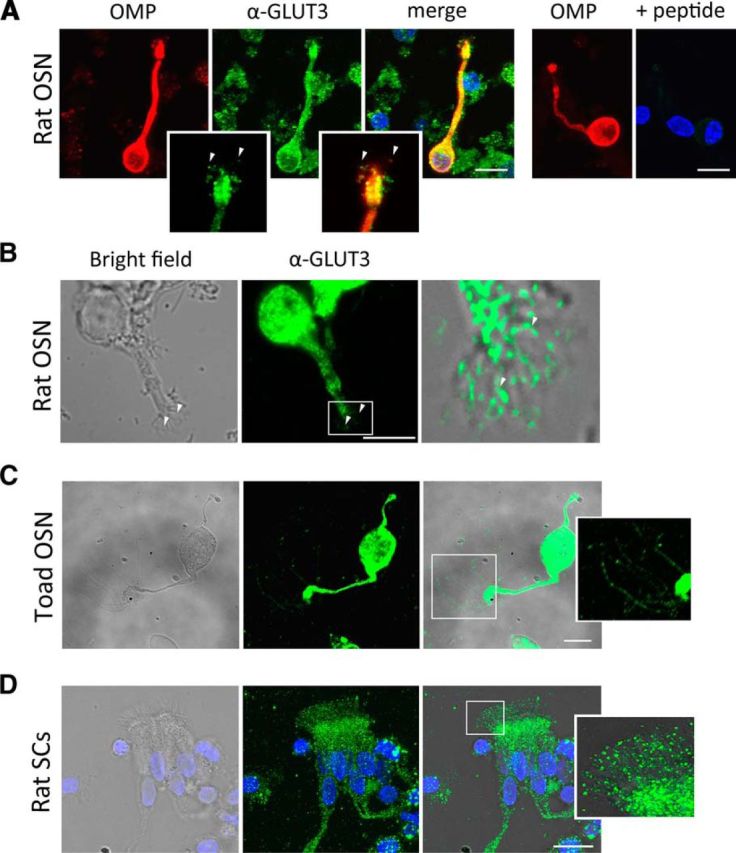
Olfactory neuron cilia and sustentacular cell microvilli express the high affinity GLUT3 glucose transporter. A, Immunocytochemistry for GLUT3 without (left) or with (right) preincubation of the primary antibody (Alpha Diagnostics anti-GLUT3 antibody) with its antigenic peptide in rat OSNs, as a control for the specificity of the antibody. The left three panels show a neuron labeled for OMP, GLUT3, and a merge of both; the two right panels show the control. B, Immunocytochemistry (Sigma anti-GLUT3 antibody) for GLUT3 of an isolated rat OSN. C, Isolated toad OSN (Sigma anti-GLUT3 antibody). D, Rat SCs (Sigma anti-GLUT3 antibody). GLUT3-expressing cilia are indicated by arrowheads. C, D, Insets (3×) correspond to the areas denoted in the figures. Nuclei are labeled blue (TOPRO). Scale bars, 10 μm.
Results
Olfactory cilia and microvilli of SCs express GLUT3
We performed immunocytochemistry in dissociated rat and toad OSNs and SCs to determine the subcellular localization of the glucose transporter. The two cell types were unmistakably identified under bright-field by their characteristic morphologies. Rat olfactory cilia were generally shorter than normal due to damage in the dissociation, whereas toad cilia were better preserved; for this reason, we used cells from both species. The rat OSN in Figure 1A (left) identified by the expression of the olfactory marker protein (OMP), immunoreacted with the antibody against GLUT3 (center). Although the entire cell became fluorescent, consistent with a wide distribution of GLUT3, it is particularly important to notice the labeling of the cilia (Fig. 1A, inset, arrowheads). No fluorescence was detected when the antibody was preincubated with its antigenic peptide (Fig. 1A, right). An additional example is presented in Figure 1B where we used a different anti-GLUT3 antibody to confirm the expression of the glucose transporter in OSNs. The same was observed in toad OSNs, whose bigger size allowed better resolution (Fig. 1C). We also examined whether the transporter was present in rat SCs and, strikingly, detected it preferentially distributed to the microvilli (Fig. 1D). No fluorescence was observed in SCs in presence of the antigenic peptide (data not shown). Toad SCs looked alike (data not shown). These results indicate that the glucose transporter GLUT3 is present both in the olfactory cilia and in the SC microvilli.
Glucose uptake from the mucus by olfactory cilia
The ability of the cilia and knob to uptake glucose was studied by detecting the incorporation of the fluorescent glucose analog 2-NBDG applied to the surface of the intact olfactory epithelium in the whole-mount preparation. This molecule can be transported by GLUTs and phosphorylated by the glycolytic enzyme hexokinase; the phosphorylated molecule cannot be transported back, therefore it accumulates within a living cell. An image of a confocal section corresponding to the surface of a rat olfactory epithelium shows a random distribution of discrete 2-NBDG fluorescent spots of ∼2–3 μm (Fig. 2A, top). Their distribution and density is comparable with that of the dendritic knobs (Ma and Shepherd, 2000), supporting that they correspond to such structures. A lower optical section (slightly deeper into the epithelium) shows larger structures with a much higher density, likely corresponding to SC bodies (Fig. 2A, center, yellow arrowheads). The sparse dark spots surrounded by cells correspond to the ducts of the Bowman's glands (Fig. 2A, center, red arrowheads). Some dendritic knobs are also observed at the level of SC somas (Fig. 2A, center), probably corresponding to OSNs in a lower plane. This is not surprising because the OSNs are continuously renovated in the olfactory mucosa. At an even lower optical section (Fig. 2A, bottom), the fluorescent spots are bigger (7–10 μm) and with a similar density and distribution of the presumed knobs, suggesting OSNs cell bodies. A higher-magnification view of the epithelial surface clearly resolved dendritic knobs (blue arrowheads) with their cilia oriented parallel to it (Fig. 2B, white arrowheads). Figure 2C depicts an orthogonal view of the olfactory epithelium, corresponding to a z-stack reconstruction of optical sections, where it is possible to identify by their morphology and position the different cell types of the OE labeled with 2-NBDG, in agreement with our interpretation of the horizontal planes. These results suggest that the olfactory cilia and possibly the knob are capable of uptaking glucose from their surroundings.
Figure 2.

Uptake and accumulation of glucose analog by the cilia and dendritic knobs. A, Three sequential optical sections starting from apical surface (top) in a whole-mount rat olfactory mucosa incubated with the fluorescent glucose analog 2-NBDG in the bathing solution. The bright dots of the top and central images correspond to dendritic knobs; in the central image SC somata (yellow arrowheads) and Bowman's glands ducts (dark spots, red arrowheads) are appreciated; and OSN somata are distinguished in the bottom image. B, Higher-magnification view of the epithelial surface, showing that both, knobs (blue arrowheads) cilia (white arrowheads) incorporated the glucose analog. C, Orthogonal view of the epithelium reconstructed from a stack of images as in A, showing the different cell types; arrowheads on the right indicate the planes used in A, where OSN knobs, dendrites, and cell bodies, and SCs can be observed. Scale bars, 10 μm.
Inhibition of GLUT impairs glucose accumulation
If OSNs and SCs can accumulate glucose by GLUT3, as shown above, inhibiting the transporter should impair glucose incorporation. The effect of cytochalasin B (20 μm), an effective GLUT inhibitor, was examined by evaluating the uptake of 2-NBDG by dissociated OSNs and SCs. In contrast with the cells under control conditions (Fig. 3A,B), the incorporation of 2-NGBD by both cell types was greatly impaired by the inhibitor (Fig. 3C and D, respectively). Therefore, these results indicate that a GLUT transporter is required for glucose incorporation by OSNs and SCs.
Figure 3.
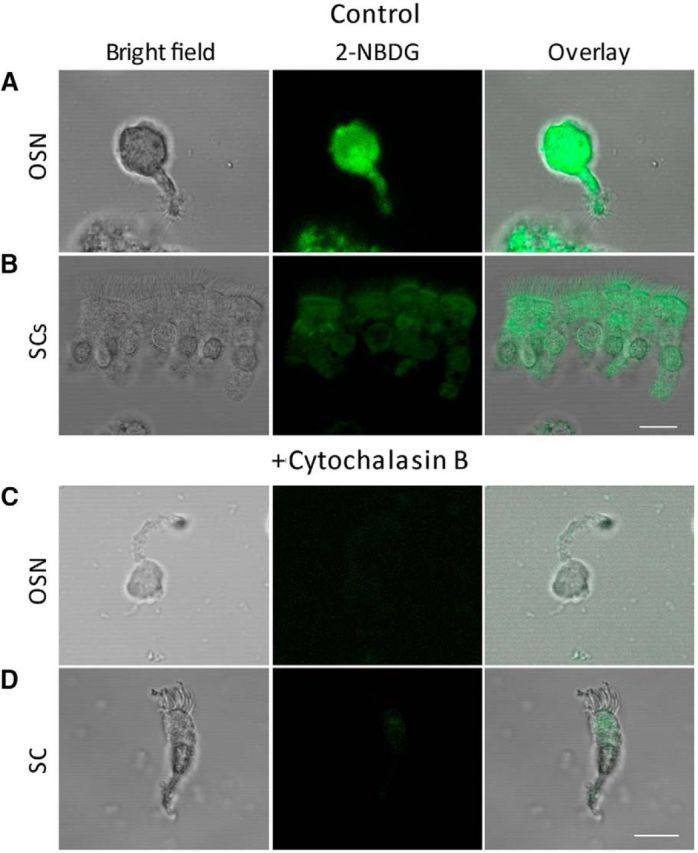
GLUT inhibition abolishes glucose incorporation in isolated OSNs and SCs. A, B, Single OSN and group SCs incubated in control solution with 0.5 mm 2-NBDG; cilia of the former and microvilli of the latter display fluorescence, in addition to the cell bodies (center). C, D, Isolated OSN and SC incubated in control solution with 0.5 mm 2-NBDG plus 20 μm cytochalasin B (GLUT inhibitor); neither cell could incorporate the fluorescent glucose analog (center). Scale bars, 10 μm.
Presence of glucose in the mucus
The functional importance of the ability of the chemosensory cilia and knob to uptake external glucose depends on the existence of this sugar in the mucus. Thus, we carefully collected mucus from the mucosal surface with a small piece of filter paper and measured it with a colorimetric assay. The glucose concentration in mucus was 1.6 ± 0.9 mm (M ± SD; N = 16).
Glycolytic enzymes in olfactory cilia
The expression of glucose transporters in the cilia and their ability to uptake glucose from the mucus are in line with the idea that the cilia metabolize glucose by glycolysis to generate ATP. To investigate this, we searched by immunoblotting for two key glycolytic enzymes in the cilia, glyceraldehyde-3-phosphate dehydrogenase (GAPDH) and pyruvate kinase (PKM2), in a membrane preparation enriched in olfactory cilia (Saavedra et al., 2008). Both enzymes were present in the ciliary fraction at the predicted molecular weights, in addition to lactate dehydrogenase [LDH; 37 kDa molecular weight (MW)], which we also examined (Fig. 4A). Figure 4B shows that, as expected, in this preparation we detected the ciliary membrane markers CNG channel (CNGA2; 140 kDa MW) and ACIII (180 kDa MW), but not in the olfactory mucosa, where the relative proportion of the markers is much lower than in the ciliary fraction, or in the deciliated epithelia. Lactate dehydrogenase might have an important role in the maintenance of NAD+ concentrations required by glycolysis. This result is consistent with the notion that glycolysis occurring in the olfactory cilia can be a source of ATP in this structure.
Figure 4.

Glycolytic enzymes in olfactory sensory cilia. A, Western-blot from olfactory cilia membranes testing for the presence of GAPDH, PKM2, and LDH. The high molecular weight bands are possibly aggregates of the protein. B, Left, Western-blot testing CNG in the whole olfactory mucosa, an enriched ciliary membrane fraction, and the deciliated epithelia. Right, ACIII tested in the ciliary membrane fraction.
Glycolysis and oxidative phosphorylation sustain chemotransduction
We tested the roles of glycolysis and oxidative phosphorylation in powering chemotransduction by measuring the effects of inhibitors of both processes on odor responses of the olfactory epithelium. Figure 5 shows electroolfactogram recordings of the epithelial responses to three different concentrations of isoamyl acetate (whole-mount preparation; see Materials and Methods). Figure 5A illustrates responses in control conditions and after applying rotenone, inhibitor of the electron transport chain, and Figure 5C shows an analogous experiment with iodoacetate, inhibitor of glycolysis. Figure 5, B and D, summarizes the effects of the drugs in three sets of experiments. The effects of the drugs did not reverse.
Figure 5.

Inhibition of glycolysis and oxidative phosphorylation impairs the olfactory epithelial odor response. A, Representative electroolfactogram responses to puffs of isoamyl acetate of an olfactory epithelium exposed to control and to the control with 10 μm rotenone. B, Pairs of responses (peak magnitudes) of epithelia tested under both conditions, each stimulated by one of three odor intensities (0.1, 1, and 10 mm; see Materials and Methods). C, Analogous experiment, with 5 mm Iodoacetate. D, As in C, with isoamyl acetate. *paired t test, p < 0.05.
We also performed experiments on isolated OSNs by loose-patch recording, where the cell body was drawn into the recording pipette while leaving the dendrite and apical structures exposed to the control solution. We first removed the glucose by perfusing the bath with glucose-free solution. This caused a pronounced drop in the odor response amplitude that fully recovered upon restituting this sugar back (Fig. 6A; N = 15). A reversible reduction of the odor response occurred upon addition of the competitive inhibitor of hexokinase, N-acetyl-d-glucosamine (10 mm) to the control solution (1 mm glucose; Fig. 6B; N = 10). We also tested the oxidative phosphorylation inhibitors rotenone (10 μm; Fig. 6C; N = 6) and antimycin A (5 μm; Fig. 6D; N = 11). Both drugs significantly decreased the odor responses: irreversibly the former and reversibly the latter. Finally, suppression of odor responses under 0 glucose and rotenone together was substantially more pronounced than each condition individually (Fig. 6E). Quantifications of the data in Figure 6 are shown below the respective recordings. Combined, these observations support the involvement of both, glycolysis and oxidative phosphorylation in generating the ATP required to sustain chemotransduction.
Figure 6.

Odor response requires extracellular glucose and depends on glycolysis and oxidative phosphorylation. Loose-patch recordings of representative odor responses under five different conditions. Quantification of each set of data are presented under the electrophysiological recordings as boxplots and all data points; statistical significances:*ns, not significant; t test. A, Odor responses under 1 mm glucose (control), after glucose removal and after wash. Boxplots and all data points are shown below the traces; in the boxplot, glucose vs 0-glucose, p < 0.01; 0-glucose vs wash, p < 0.01; N = 15. B, Responses under control solution: control with 10 mm N-acetyl glucosamine (GlcNAc) and control without GlcNAc, below are the boxplots and all data points; control vs GlcNAc, p < 0.05; GlcNAc vs wash, ns; N = 10. C, Responses under control: control with 10 μm rotenone and control without rotenone; below are the boxplots and all data points; control vs rotenone, p < 0.05; rotenone vs wash, ns; N = 12. D, Responses under control, control with 5 μm antimycin A and control without antimycin A; below are the boxplots and all data points; control vs antimycin A, p < 0.05; antimycin A vs wash, p < 0.05; N = 11. E, Responses under control: control-0 glucose and control-0 glucose with 10 μm rotenone; below are the boxplots and all data points; control vs −0 glucose, p < 0.05; 0-glucose vs 0-glucose + rotenone, p < 0.05; control vs 0-glucose + rotenone, p < 0.01.
Discussion
The main conclusion of this study is that chemotransduction is powered by ATP generated in the olfactory cilia by glycolytic processing of glucose incorporated from the mucus and ATP supplied by oxidative phosphorylation occurring in the knob. This conclusion is based on our findings of glucose accumulation by the cilia depending on a glucose transporter, the presence of glucose in the mucus, and of glycolytic enzymes in the cilia, as well as the fact that olfactory transduction is impaired in the absence of glucose or by glycolysis or oxidative phosphorylation inhibitors.
Because the cilia are elongated structures not containing mitochondria and ATP diffusion from the knob would be too slow to fuel chemotransduction in distal regions of the cilia, more than one ATP source might contribute to the transduction process.
The close morphological relationship between olfactory neurons and SCs (Nomura et al., 2004) sustains the notion of a metabolic interaction between both cell types in the OE, as generally found in the nervous system, where neurons are surrounded by glia that mediate the metabolic exchange with the blood. Furthermore, the polarized distribution of glucose transporters in the apical epithelial surface (Nunez-Parra et al., 2011) and the diffusion barrier between the mucus and the extracellular fluid bathing the basolateral regions of OSNs and SCs suggested a directional traffic of nutrients from the blood vessels to the mucosal compartments through the SCs and maybe the Bowman's glands as well. In this model, glucose would be incorporated by the SCs from the blood vessels via GLUT1 transporters of the basolateral membrane, and finally released to the mucus across the apical microvilli. Subsequently, the cilia would internalize the sugar and generate ATP by glycolysis to assist powering the transduction machinery. We are reporting here strong evidence in support of the last aspect of this hypothetical model (Fig. 7).
Figure 7.

Proposed model to account for the glucose flow in the olfactory mucosa and its utilization by the olfactory cilia. The epithelial distribution of glucose transporters allows the facilitated diffusion of glucose from the blood vessels into SCs, and through these cells toward their apical microvilli, from where it is released to the surrounding mucus. Glucose is transported into the cilia, where it is metabolized by glycolysis, generating ATP. Mitochondria contained in the dendritic knob also provide ATP to the cilia, by oxidative phosphorylation. Glc, glucose; BG, Bowman's gland; TJ, tight junction; V, blood vessel.
Our immunocytochemistry results from dissociated rat and toad olfactory sensory neurons and SCs revealed the presence of GLUT3 in their respective apical organelles. This notion was strengthened by the ability of the cilia and dendritic knob to incorporate 2-NBDG, as observed in the rat whole-mount preparation. Because the peripheral olfactory system stays intact in this preparation, it is highly unlikely that the sugar reached the apical structures of the epithelium in any other manner. The cilia exhibited marked 2-NBDG fluorescence, indicating glucose uptake; however, due to their small dimensions the microvilli could not be resolved. The measurements performed in dissociated cells confirmed that both, cilia and microvilli (and also the cell bodies), could accumulate 2-NBDG. Importantly, the GLUT blocker cytochalasin B drastically reduced the uptake of the glucose analog. Together, these results suggest that the apical organelles of the OSNs and SCs possess the capability of transporting glucose across their membranes.
Based on previous proteomics studies (Mayer et al., 2008, 2009; Kuhlmann et al., 2014), we expected to detect glycolytic enzymes in the cilia. Nonetheless, a striking discovery was the high concentration of glucose in the mucus (∼1 mm), which was essential to our model. Because the mucus layer is very thin, it might be thought that some cells were injured while sampling the mucus. However, even if this had occurred, cell damage could not have contributed to the glucose we detected because upon entering a cell this sugar is phosphorylated, turning it undetectable by the colorimetric assay.
Collectively, the evidence presented above suggests that the elements required for the use of glucose to power chemotransduction exist in the olfactory epithelium. The electrophysiological measurements are fully consistent with this notion. The results presented here demonstrate that glucose in the external medium is important for sustaining normal odor responses. However, because the response was only partially abolished after removing the sugar, or inhibiting glycolysis with N-acetyl glucosamine, we cannot discard that other metabolic fluxes may also support odor transduction. Rotenone and antimycin A decremented the odor response, suggesting that ATP produced by oxidative phosphorylation occurring in the mitochondria of the dendritic knob is also important.
Glucose at comparable levels as found here have been reported in the fluid bathing the cilia of the mucosal surface of the oviduct and uterine epithelia (Gardner and Leese, 1990; Hugentobler et al., 2008), showing that glucose can reach the mucosal surface in other epithelia as well.
The mammalian sperm flagella, which are similar to cilia, have localized GLUT transporters (Bucci et al., 2011) and crucial glycolytic enzymes (Miki et al., 2004). It has been suggested that the human sperm flagellum obtains ATP from the mitochondria located near the tail and also by local glycolytic activity in the tail (Mukai and Okuno, 2004; du Plessis et al., 2015). Additional mechanisms to generate or to buffer ATP are also found in flagella of different species, like the phosphorylation of ADP by the enzyme adenylate kinase (Cao et al., 2006) and the phosphagen shuttle systems, such as the phosphocreatine or phosphoarginine shuttles (Yeung et al., 1996). Neither of them was evaluated in our study; however, the prominent decay of the odor responses caused when suppressing glycolysis and oxidative phosphorylation suggest that, if present, they would have a minor contribution. Furthermore, to the best of our knowledge, there is no evidence for the presence of phosphogen kinases in olfactory cilia (Mayer et al., 2009; Kuhlmann et al., 2014).
Footnotes
This work was supported by Fondo Nacional de Ciencia y Tecnología 1140520. We thank Dr. Carolina González for help on image analysis and Daniela Villalobos for help in the glucose measurements. We are especially grateful to Dr. Ricardo C. Araneda for allowing us to perform some of the experiments in his laboratory during the revision of this manuscript.
The authors declare no competing financial interests.
References
- Bucci D, Rodriguez-Gil JE, Vallorani C, Spinaci M, Galeati G, Tamanini C (2011) GLUTs and mammalian sperm metabolism. J Androl 32:348–355. 10.2164/jandrol.110.011197 [DOI] [PubMed] [Google Scholar]
- Cao W, Haig-Ladewig L, Gerton GL, Moss SB (2006) Adenylate kinases 1 and 2 are part of the accessory structures in the mouse sperm flagellum. Biol Reprod 75:492–500. 10.1095/biolreprod.106.053512 [DOI] [PubMed] [Google Scholar]
- Cygnar KD, Stephan AB, Zhao H (2010) Analyzing responses of mouse olfactory sensory neurons using the air-phase electroolfactogram recording. J Vis Exp 37:e1850. 10.3791/1850 [DOI] [PMC free article] [PubMed] [Google Scholar]
- du Plessis SS, Agarwal A, Mohanty G, van der Linde M (2015) Oxidative phosphorylation versus glycolysis: what fuel do spermatozoa use? Asian J Androl 17:230–235. 10.4103/1008-682X.135123 [DOI] [PMC free article] [PubMed] [Google Scholar]
- Fluegge D, Moeller LM, Cichy A, Gorin M, Weth A, Veitinger S, Cainarca S, Lohmer S, Corazza S, Neuhaus EM, Baumgartner W, Spehr J, Spehr M (2012) Mitochondrial Ca(2+) mobilization is a key element in olfactory signaling. Nat Neurosci 15:754–762. 10.1038/nn.3074 [DOI] [PubMed] [Google Scholar]
- Gardner DK, Leese HJ (1990) Concentrations of nutrients in mouse oviduct fluid and their effects on embryo development and metabolism in vitro. J Reprod Fertil 88:361–368. 10.1530/jrf.0.0880361 [DOI] [PubMed] [Google Scholar]
- Hugentobler SA, Humpherson PG, Leese HJ, Sreenan JM, Morris DG (2008) Energy substrates in bovine oviduct and uterine fluid and blood plasma during the oestrous cycle. Mol Reprod Dev 75:496–503. 10.1002/mrd.20760 [DOI] [PubMed] [Google Scholar]
- Jenkins PM, McEwen DP, Martens JR (2009) Olfactory cilia: linking sensory cilia function and human disease. Chem Senses 34:451–464. 10.1093/chemse/bjp020 [DOI] [PMC free article] [PubMed] [Google Scholar]
- Kuhlmann K, Tschapek A, Wiese H, Eisenacher M, Meyer HE, Hatt HH, Oeljeklaus S, Warscheid B (2014) The membrane proteome of sensory cilia to the depth of olfactory receptors. Mol Cell Proteomics 13:1828–1843. 10.1074/mcp.M113.035378 [DOI] [PMC free article] [PubMed] [Google Scholar]
- Ma M, Shepherd GM (2000) Functional mosaic organization of mouse olfactory receptor neurons. Proc Natl Acad Sci U S A 97:12869–12874. 10.1073/pnas.220301797 [DOI] [PMC free article] [PubMed] [Google Scholar]
- Maher F, Simpson IA (1994) The GLUT3 glucose transporter is the predominant isoform in primary cultured neurons: assessment by biosynthetic and photoaffinity labelling. Biochem J 301:379–384. 10.1042/bj3010379 [DOI] [PMC free article] [PubMed] [Google Scholar]
- Mayer U, Ungerer N, Klimmeck D, Warnken U, Schnölzer M, Frings S, Möhrlen F (2008) Proteomic analysis of a membrane preparation from rat olfactory sensory cilia. Chem Senses 33:145–162. [DOI] [PubMed] [Google Scholar]
- Mayer U, Küller A, Daiber PC, Neudorf I, Warnken U, Schnölzer M, Frings S, Möhrlen F (2009) The proteome of rat olfactory sensory cilia. Proteomics 9:322–334. 10.1002/pmic.200800149 [DOI] [PubMed] [Google Scholar]
- Miki K, Qu W, Goulding EH, Willis WD, Bunch DO, Strader LF, Perreault SD, Eddy EM, O'Brien DA (2004) Glyceraldehyde 3-phosphate dehydrogenase-S, a sperm-specific glycolytic enzyme, is required for sperm motility and male fertility. Proc Natl Acad Sci U S A 101:16501–16506. 10.1073/pnas.0407708101 [DOI] [PMC free article] [PubMed] [Google Scholar]
- Mitchell BF, Pedersen LB, Feely M, Rosenbaum JL, Mitchell DR (2005) ATP production in Chlamydomonas reinhardtii flagella by glycolytic enzymes. Mol Biol Cell 16:4509–4518. 10.1091/mbc.E05-04-0347 [DOI] [PMC free article] [PubMed] [Google Scholar]
- Mukai C, Okuno M (2004) Glycolysis plays a major role for adenosine triphosphate supplementation in mouse sperm flagellar movement. Biol Reprod 71:540–547. 10.1095/biolreprod.103.026054 [DOI] [PubMed] [Google Scholar]
- Nomura T, Takahashi S, Ushiki T (2004) Cytoarchitecture of the normal rat olfactory epithelium: light and scanning electron microscopic studies. Arch Histol Cytol 67:159–170. 10.1679/aohc.67.159 [DOI] [PubMed] [Google Scholar]
- Nunez-Parra A, Cortes-Campos C, Bacigalupo J, Garcia Mde L, Nualart F, Reyes JG (2011) Expression and distribution of facilitative glucose (GLUTs) and monocarboxylate/H+ (MCTs) transporters in rat olfactory epithelia. Chem Senses 36:771–780. 10.1093/chemse/bjr052 [DOI] [PubMed] [Google Scholar]
- Okano M, Takagi SF (1974) Secretion and electrogenesis of the supporting cell in the olfactory epithelium. J Physiol 242:353–370. 10.1113/jphysiol.1974.sp010711 [DOI] [PMC free article] [PubMed] [Google Scholar]
- Pifferi S, Menini A, Kurahashi T (2010) Signal transduction in vertebrate olfactory cilia. In: The Neurobiology of Olfaction (Menini A, ed). Boca Raton, FL: CRC. [PubMed] [Google Scholar]
- Reisert J, Matthews HR (2001) Response properties of isolated mouse olfactory receptor cells. J Physiol 530:113–122. 10.1111/j.1469-7793.2001.0113m.x [DOI] [PMC free article] [PubMed] [Google Scholar]
- Ronnett GV, Moon C (2002) G proteins and olfactory signal transduction. Annu Rev Physiol 64:189–222. 10.1146/annurev.physiol.64.082701.102219 [DOI] [PubMed] [Google Scholar]
- Rospars JP, Gu Y, Grémiaux A, Lucas P (2010) Odour transduction in olfactory receptor neurons. Chin J Physiol 53:364–372. 10.4077/CJP.2010.AMM038 [DOI] [PubMed] [Google Scholar]
- Saavedra MV, Smalla KH, Thomas U, Sandoval S, Olavarria K, Castillo K, Delgado MG, Delgado R, Gundelfinger ED, Bacigalupo J, Wyneken U (2008) Scaffolding proteins in highly purified rat olfactory cilia membranes. Neuroreport 19:1123–1126. 10.1097/WNR.0b013e3283086797 [DOI] [PubMed] [Google Scholar]
- Sanhueza M, Schmachtenberg O, Bacigalupo J (2000) Excitation, inhibition, and suppression by odors in isolated toad and rat olfactory receptor neurons. Am J Physiol Cell Physiol 279:C31–39. [DOI] [PubMed] [Google Scholar]
- Schmachtenberg O, Diaz J, Bacigalupo J (2003) NO activates the olfactory cyclic nucleotide-gated conductance independent from cGMP in isolated rat olfactory receptor neurons. Brain Res 980:146–150. 10.1016/S0006-8993(03)02990-1 [DOI] [PubMed] [Google Scholar]
- Vendelin M, Birkedal R (2008) Anisotropic diffusion of fluorescently labeled ATP in rat cardiomyocytes determined by raster image correlation spectroscopy. Am J Physiol Cell Physiol 295:C1302–1315. 10.1152/ajpcell.00313.2008 [DOI] [PMC free article] [PubMed] [Google Scholar]
- Washburn KB, Turner TJ, Talamo BR (2002) Comparison of mechanical agitation and calcium shock methods for preparation of a membrane fraction enriched in olfactory cilia. Chem Senses 27:635–642. 10.1093/chemse/27.7.635 [DOI] [PubMed] [Google Scholar]
- Wong-Riley MT. (2010) Energy metabolism of the visual system. Eye Brain 2:99–116. 10.2147/EB.S9078 [DOI] [PMC free article] [PubMed] [Google Scholar]
- Yeung CH, Majumder GC, Rolf C, Behre HM, Cooper TG (1996) The role of phosphocreatine kinase in the motility of human spermatozoa supported by different metabolic substrates. Mol Hum Reprod 2:591–596. 10.1093/molehr/2.8.591 [DOI] [PubMed] [Google Scholar]
- Yoshioka K, Takahashi H, Homma T, Saito M, Oh KB, Nemoto Y, Matsuoka H (1996) A novel fluorescent derivative of glucose applicable to the assessment of glucose uptake activity of Escherichia coli. Biochim Biophys Acta 1289:5–9. 10.1016/0304-4165(95)00153-0 [DOI] [PubMed] [Google Scholar]