

Abstract
The dorsal and ventral premotor cortices (PMd and PMv, respectively) each take part in unique aspects for the planning and execution of hand movements. These premotor areas are components of complex anatomical networks that include the primary motor cortex (M1) of both hemispheres. One way that PMd and PMv could play distinct roles in hand movements is by modulating the outputs of M1 differently. However, patterns of effects from PMd and PMv on the outputs of M1 have not been compared systematically. Our goals were to study how PMd within the same (i.e., ipsilateral or iPMd) and in the opposite hemisphere (i.e., contralateral or cPMd) can shape M1 outputs and then compare these effects with those induced by PMv. We used paired-pulse protocols with intracortical microstimulation techniques in sedated female cebus monkeys while recording EMG signals from intrinsic hand and forearm muscles. A conditioning stimulus was delivered in iPMd or cPMd concurrently or before a test stimulus in M1. The patterns of modulatory effects from PMd were compared with those from PMv collected in the same animals. Striking differences were revealed. Conditioning stimulation in iPMd induced more frequent and powerful inhibitory effects on M1 outputs compared with iPMv. In the opposite hemisphere, cPMd conditioning induced more frequent and powerful facilitatory effects than cPMv. These contrasting patterns of modulatory effects could allow PMd and PMv to play distinct functions for the control of hand movements and predispose them to undertake different, perhaps somewhat opposite, roles in motor recovery after brain injury.
SIGNIFICANCE STATEMENT The dorsal and ventral premotor cortices (PMd and PMv, respectively) are two specialized areas involved in the control of hand movements in primates. One way that PMd and PMv could participate in hand movements is by modulating or shaping the primary motor cortex (M1) outputs to hand muscles. Here, we studied the patterns of modulation from PMd within the same and in the opposite hemisphere on the outputs of M1 and compared them with those from PMv. We found that PMd and PMv have strikingly different effects on M1 outputs. These contrasting patterns of modulation provide a substrate that may allow PMd and PMv to carry distinct functions for the preparation and execution of hand movements and for recovery after brain injury.
Keywords: cortex, hand movement, interaction, interhemispheric, intrahemispheric, network
Introduction
The dorsal premotor cortex (PMd) is an area of the frontal lobe involved in the planning and execution of forelimb movements. Microstimulation studies in monkeys have shown the existence of a distal forelimb representation within PMd from which movements of the forearm, wrist, and fingers can be evoked (Preuss et al., 1996; Raos et al., 2003; Dea et al., 2016). Neurons in this cortical region discharge during the preparatory and execution phases of hand movements (Wise, 1985; Kurata and Tanji, 1986; Riehle and Requin, 1989) and their pattern of activity can be tuned to specific types of grasps (Raos et al., 2004).
PMd is not only involved in the control of the contralateral hand, but also participates in the preparation and production of bilateral and ipsilateral movements. For example, both neural recording studies in monkeys (Kermadi et al., 2000) and imaging studies in humans (Meyer-Lindenberg et al., 2002) have shown that activity in PMd can increase during complex bimanual hand movements. Moreover, the activity of many neurons in PMd is modulated when preparing and performing tasks with either hand (Tanji et al., 1988; Kermadi et al., 2000). Finally, human imaging studies also revealed that hemodynamic activity in PMd can increase as a function of task complexity when performing ipsilateral sequential finger movements (Sadato et al., 1996).
In addition to PMd, primates have several other premotor areas, each sending effective outputs to the motoneurons of forelimb and hand muscles (He et al., 1993; Dum and Strick, 2002; Boudrias et al., 2010). Although these premotor areas are all part of the cortical motor network, they each have a unique pattern of connections (Dum and Strick, 2005; Dea et al., 2016; Hamadjida et al., 2016; Kaas and Stepniewska, 2016) and appear to undertake specialized functions for the control of hand movements. For example, whereas PMd seems more involved in intersegmental coupling, arm trajectory, and geometry for arm and hand movements, the ventral premotor cortex (PMv) is primarily concerned with preshaping the hand to accurately match the properties of the objects to be grasped (Kurata, 1993; Scott et al., 1997; Rizzolatti and Luppino, 2001; Davare et al., 2006).
One way that PMd and PMv can participate in the production of hand movements is by modulating the outputs of the primary motor cortex (M1). To date, several human studies have investigated the modulatory effects of PMd and PMv on the outputs of M1 using transcranial magnetic stimulation (TMS). These studies showed that PMd and PMv within the same hemisphere (i.e., ipsilateral or iPMd and iPMv, respectively) and in the opposite hemisphere (i.e., contralateral or cPMd and cPMv, respectively) can have a wide range of effects on M1 outputs (Civardi et al., 2001; Koch et al., 2006; O'Shea et al., 2007; Davare et al., 2008; Prabhu et al., 2009; Buch et al., 2010; Groppa et al., 2012a; Quessy et al., 2016). One largely unexplored question is how the pattern of modulatory effects of PMd on M1 outputs compares with that of PMv. Different patterns of modulations from the two areas may provide a means for them to assume their unique roles in the preparation and production of hand movements. They could also predispose premotor areas to undertake distinct functions and have different impacts on the large-scale reorganization of ipsilesional and interhemispheric network after brain injury (Grefkes and Fink, 2012; Silasi and Murphy, 2014).
To address some of these questions, we investigated the modulatory effects of iPMd and cPMd on M1 outputs using paired-pulse protocols with intracortical microstimulation (ICMS) methods in sedated cebus monkeys. In these protocols, a conditioning pulse (Cstim) was delivered in either iPMd or cPMd simultaneously or before a test pulse (Tstim) in M1 with different interstimulation intervals (ISIs). Modulatory effects were quantified in EMG signals from intrinsic hand and forearm muscles. We then compared the modulatory effects of PMd with those from PMv collected in the same animals (Quessy et al., 2016).
Materials and Methods
Subjects.
Four adult female capuchin monkeys (Cebus apella): CB1 (1.9 kg), CB2 (1.3 kg), CB3 (1.4 kg), and CB4 (1.2 kg), were used in this study. Monkeys were group housed and supplied with food and water ad libitum. The experimental protocol followed the guidelines of the Canadian Council on Animal Care and was approved by the Comité de Déontologie de l'Expérimentation sur les Animaux of the Université de Montréal.
Surgical procedures.
All procedures were performed in a terminal experiment. Details of surgical procedures were described previously (Quessy et al., 2016). Anesthesia was induced with 15 mg/kg ketamine hydrochloride and transitioned to ∼2–3% isoflurane (Furane; Baxter) in 100% oxygen. The animal received dexamethasone 2 (Vetoquinol; 0.5 mg/kg) and mannitol 20% (1500 mg/kg) to prevent inflammation and swelling of the brain. To maintain proper hydration, lactated Ringer's solution (10 ml/kg/h, i.v.) was injected continuously. Body temperature was kept near 36.5°C throughout the procedures and blood oxygen saturation and heart rate were monitored continuously.
Insulated, multistranded microwires (Cooner Wire) were implanted intramuscularly for the recording of EMG signals. In CB1, six muscles in both arms were implanted [flexor pollicis brevis (FPB), extensor carpi ulnaris (ECU), extensor digitorum communis (EDC), palmaris longus (PL), biceps brachii (BB), and triceps brachii (TB)]. In the other three monkeys, in addition to these six muscles, the abductor pollicis brevis (APB) and flexor digitorum superficialis (FDS) were also implanted. The accurate placement of EMG wires was confirmed with stimulation of each muscle through the implanted wires and observation of the evoked movements. After EMG microwire implantation, craniotomies and durectomies were performed to expose M1 and iPMd in one hemisphere and cPMd in the opposite hemisphere.
Experimental design.
After the surgical procedures, gas anesthesia was turned off and the animal was kept deeply sedated with intravenous injections of ketamine (∼10 mg/kg/10 min) and diazepam (Valium; 0.01 mg/kg/h) for electrophysiological data collection. To facilitate the identification of stimulation sites related to hand movements for the paired-pulse protocols, we first located the hand representations in M1 and premotor areas using standard ICMS trains (13 monophasic cathodal pulses of 0.2 ms delivered at 350 Hz) delivered at 1 Hz (Deffeyes et al., 2015; Dea et al., 2016; Hamadjida et al., 2016; Quessy et al., 2016). Within these identified hand representations (Fig. 1), we then searched for stimulation sites in layer V (∼1800 μm) to place the electrode for the Cstim in either iPMd or cPMd and the electrode for the Tstim in M1 with two independent micromanipulators. At each cortical site tested, we inspected EMG signals visually on an oscilloscope to confirm that ICMS trains evoked clear EMG responses in at least one contralateral intrinsic hand or forearm muscle. Only such cortical sites were kept for the paired-pulse protocols. Therefore, all cortical stimulation sites selected in this study were located in clearly identified distal forelimb representations as defined with ICMS trains.
Figure 1.
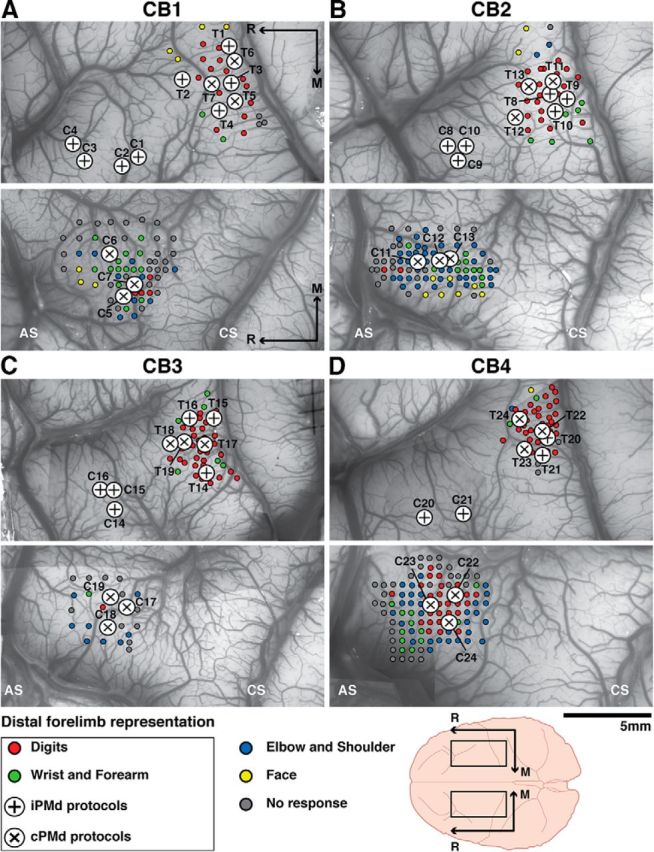
Cortical locations of the Cstim and Tstim electrodes selected for paired-pulse protocols. Motor mapping data evoked with ICMS trains (small colored dots) and cortical locations selected for Cstim and Tstim electrodes (large circles) for the paired-pulse protocols in CB1 (A), CB2 (B), CB3 (C), and CB4 (D). In each monkey, we first located the hand representations of M1 and cPMd with motor mapping techniques using ICMS trains and visual inspection of evoked movements. The hand representation of iPMd was then easily located by stimulating cortical sites in the area homotopic to cPMd in the ipsilateral hemisphere. Evoked movements with ICMS trains at threshold current intensity are color coded according to the legend at the bottom of the figure. Within M1, iPMd, and cPMd, only cortical sites evoking clear EMG activity in at least one intrinsic hand or forearm muscle with ICMS trains were selected for paired-pulse protocols. All of these sites were thus in the distal forelimb representations of M1, iPMd, and cPMd. Large circles with + show cortical sites used in protocols testing the effects of iPMd on M1 outputs and large circles with X show cortical sites used in protocols testing the effects of cPMd. CS, Central sulcus; AS, arcuate sulcus; M, medial; R, rostral.
Once the electrodes were in place, stimulations were switched from trains to single pulses. Both the Cstim and Tstim were cathodal single square pulses of 0.2 ms duration delivered through single-wire insulated tungsten electrodes (FHC). The stimulation intensities for Cstim and Tstim were established online based on evoked EMG activity in the arm contralateral to each electrode. If EMG activity was evoked in multiple muscles in the contralateral arm, the muscle with the lowest threshold (i.e., the current at which EMG activity was evoked by ∼50% of single pulses) was chosen to establish the current intensity. The current intensity for the Cstim was set at 75% of the EMG threshold (range = 38–225 μA, mean = 167 μA). If no EMG activity was evoked with up to 300 μA with single pulses, the current intensity of the Cstim was set to 225 μA. The current intensity for the Tstim was typically set to 125% of threshold (range = 50–300 μA, mean = 163 μA). However, if the evoked activity was too small or too big with this intensity value, it was adjusted to a level producing clear, submaximal responses. This insured that the motor evoked potential (MEP) evoked by the Tstim could be either increased or decreased by the Cstim at all cortical sites tested.
After the establishment of the stimulation intensities, a paired-pulse stimulation protocol was initiated. Within each protocol, stimulations could be delivered through the conditioning electrode only (C-only trials), the test electrode only (T-only trials), or through both electrodes (paired stimulations or paired-pulse trials; C+T) using one of six different ISIs. For iPMd conditioning, the paired stimulations were presented simultaneously (ISI0) or with the Cstim preceding the Tstim by 1 ms (ISI1), 2 ms (ISI2), 4 ms (ISI4), 6 ms (ISI6), or 10 ms (ISI10). For cPMd conditioning, the paired stimulations were presented simultaneously (ISI0) or with the Cstim preceding the Tstim by 2.5 ms (ISI2.5), 5 ms (ISI5), 10 ms (ISI10), 15 ms (ISI15), or 20 ms (ISI20).
Using several ISIs allows the outputs of neurons stimulated by the Cstim and the Tstim electrodes to interact through the various pathways they share and provides information about the temporal specificity of modulatory effects from the conditioned area. When comparing the modulatory effects of various cortical areas, here PMd and PMv, these detailed patterns of interaction can highlight specific latencies with which the two areas exert their most similar or divergent effects on the outputs of M1.
In the present set of experiments, we opted to test ISIs around the time windows of the fast corticocortical effects between iPMd or cPMd (Cstim) and M1 (Tstim). For the ipsilateral hemisphere, short-latency intrahemispheric conduction time between premotor areas and M1 is estimated to be ∼1–2 ms (Godschalk et al., 1984; Tokuno and Nambu, 2000). Accordingly, it can be proposed that ISI1 and ISI2 are more likely to favor direct projections from iPMd onto output producing neurons in M1 (e.g., corticospinal; Ghosh and Porter, 1988; Tokuno and Nambu, 2000). In contrast, simultaneous stimulation of iPMd and M1 (ISI0) could favor downstream convergent projections along the neuraxis, for example, in the spinal cord (He et al., 1993). However, summation of the Cstim effects onto cortically mediated I-waves in M1 could also explain the effects with ISI0, ISI1, and ISI2 (Shimazu et al., 2004; Maier et al., 2013). Finally, ISI4, ISI6, and ISI10 may favor effects carried by slower-conducting fibers, oligosynaptic projection pathways from iPMd to M1, or give time for the Cstim to induce changes of excitability at downstream sites of convergence with M1 outputs.
For the contralateral hemisphere, because the short-latency interhemispheric conduction time between motor areas is estimated to be ∼2–6 ms (Asanuma and Okuda, 1962; Matsunami and Hamada, 1984), ISI2.5 and ISI5 can be proposed to favor direct projections onto M1 output neurons. Similar pathways as the ones suggested above for the ipsilateral effects could be favored with shorter (e.g., downstream convergence with ISI0) and longer (e.g., oligosynaptic pathways with ISI10, ISI15, and ISI20) ISIs. Nevertheless, it should be kept in mind that the strength of testing several ISIs is to provide information about the range of possible modulatory effects of the conditioned area on the outputs of the tested area. Because stimulations are delivered at the cortical level and the modulatory effects are identified at the level of muscles through EMG recordings, the locus of interactions is uncertain.
For each of the eight stimulation conditions (C-only, T-only, and C+T with six ISIs), a total of 150 trials were collected (total number of trials per protocol = 1200). In CB1 and CB2, data for each condition was collected in 3 blocks of 50 trials delivered at 3 Hz and the order of the blocks was randomized across conditions (Deffeyes et al., 2015). In CB3 and CB4, the condition used for each trial was randomly selected until a total of 150 trials delivered at 3 Hz was collected for each condition (Quessy et al., 2016). This latter design was an improvement of our custom-written acquisition software. We confirmed that the EMG responses acquired from both designs were stable throughout data collection by comparing the responses obtained with the T-only trials from the first 75 trials with those obtained with the last 75 trials using 2-sample t tests (CB1 and CB2: t = −1.57; p = 0.12; CB3 and CB4: t = −0.73; p = 0.48). This supports that the randomization of blocks of trials was sufficient to prevent potential effects that could result from the serial acquisition of data from different conditions (see also Deffeyes et al., 2015; Quessy et al., 2016).
After data collection for a protocol, the two electrodes were relocated to different cortical positions and another protocol was initiated. These procedures were repeated until a total of two to four cortical sites were tested for iPMd and cPMd in each animal. For iPMd conditioning, EMG activity was concurrently recorded from six muscles for four protocols in CB1 and eight muscles for eight protocols in the other three monkeys. We thus collected 88 EMG signals under eight conditions (total of 704 MEPs). For cPMd conditioning, EMG activity was concurrently recorded from six muscles for three protocols in CB1 and eight muscles for nine protocols in the other three monkeys. Accordingly, we collected 90 EMG signals under eight conditions (for total of 720 MEPs).
A RZ5 real-time processor (Tucker Davis Technologies) with custom software was used to conduct paired-pulse stimulation protocols and record EMG data. One component of the custom software controlled the stimulations generated by an IZ2 stimulator (Tucker Davis Technologies) and another component controlled data acquisition. EMG signals from each channel were recorded at 4.9 kHz. Raw EMG data were stored for offline analysis.
EMG data analysis.
EMG data were analyzed offline with custom-written MATLAB (Version R2014a) code. The continuously recorded raw EMG signals were separated into individual trials and aligned on the end of the last stimulation (i.e., Cstim for C-only trials and Tstim for the T-only and the six paired-pulse trials). Then, the EMG responses were analyzed in a window of 30 ms after the end of the stimulation (Fig. 2A–C). The raw EMG was full-wave rectified and smoothed using a 5-point moving average (window = 1.02 ms).
Figure 2.

Comparison of the conditioned responses with the probability distribution. A, Example of responses evoked in the PL with the C-only condition (n = 150) in iPMd for a given protocol. Because the current intensity for Cstim was subthreshold, no clear MEP is observed. Data across all following panels were recorded in PL during the same protocol. B, C, Responses evoked with the T-only condition (n = 150; B) and when the Cstim and Tstim were delivered simultaneously (ISI0; n = 150; C). D, Example of mean responses evoked in PL in the C+T condition with different ISIs in relation with the ± SD (gray area) obtained from the predicted MEPs (see Materials and Methods). Here, traces show responses when the Cstim preceded the Tstim by 0, 4, and 6 ms: ISI0 (red), ISI4 (gray), and ISI6 (blue), respectively. Open circles show EMG peak maximum values. E, Histogram of the probability distribution of predicted MEP peak amplitudes (n = 10,000) showing the probability of occurrence (y-axis) of predicted peaks with different amplitudes (x-axis). The black line and whiskers above the histogram indicate the mean and SD of the probability distribution. The colored dots on top show the values of the average peak amplitude obtained with ISI0 (red), ISI4 (gray), and ISI6 (blue) from the traces in D. The average peak amplitude with ISI0 was clearly greater than the probability distribution (Z-score = 10.47; p < 0.001) and the effect of iPMd was considered significantly facilitatory with this ISI. In contrast, the average peak amplitude with ISI6 was smaller than the probability distribution (Z-score = −4.45; p < 0.001) and the effect of iPMd was considered significantly inhibitory with this ISI. Finally, the average peak amplitude with ISI4 was within the probability distribution (Z-score = 0.16; p = 0.87) and it was concluded that this iPMd site had no effect on M1 outputs to PL with this ISI.
We first established whether the Tstim alone (T-only trials) in M1 induced a detectable MEP and that this response was large enough to distinguish either increases or decreases of activity potentially induced in paired stimulations trials (C+T; Quessy et al., 2016). All T-only trials (n = 150) for each muscle were averaged and the MEP was compared with the baseline activity recorded in a window of 30 ms before the stimulus onset. If the average MEP peak amplitude resulting from the T-only trials was >3 SDs above the average baseline, then it was considered significant and kept for subsequent analyses. Although the Cstim intensity was set to 75% of threshold value, we also verified the absence of responses offline. Across the entire dataset, we found and discarded four cases in which the average response induced with the C-only trials was >3 SDs above the average baseline and in which the presence of a potential MEP was confirmed with visual inspection.
To study the modulation of MEP peak amplitude by the Cstim delivered in iPMd or cPMd, we compared the amplitude of the evoked response in paired-pulse trials with a probability distribution of predicted peak amplitudes based on the combination of responses in C-only and T-only trials (Fig. 2D,E). This process has been described in detail previously (Quessy et al., 2016). First, to produce predicted traces, we linearly summed all possible combinations (n = 22,500) of single C-only traces (n = 150) with single T-only traces (n = 150). Out of this population of predicted traces, 150 trials were selected randomly and averaged to generate an average predicted MEP. The peak amplitude of the predicted MEP was calculated (peak maximum − peak minimum voltage value) within a 30 ms window after the end of the stimulus. The random selection of 150 trials to generate an average predicted MEP and the calculation of its peak amplitude was repeated 10,000 times to produce a probability distribution of predicted peak amplitudes (Fig. 2E). The average peak amplitude of the MEPs obtained with the paired-pulse trials (C+T) with each ISI (n = 150 per ISI) was compared with the probability distribution to determine the direction of modulation (facilitation, inhibition, or no modulation; Fig. 2E). The normalized strength of the modulatory effects of PMd on M1 outputs was obtained by calculating the Z-score of the average MEP peak amplitude of C+T trials with each ISI. The modulation of M1 outputs by PMd conditioning was considered significant when the Z-score of the average MEP peak amplitude of C+T trials with a given ISI differed by >1.96 SDs from the mean of the distribution of predicted peak amplitudes (p ≤ 0.05).
Although there is potential for nonlinearity when performing summation of rectified EMG signals (Baker and Lemon, 1995), this issue was minimized in our experiments by the use of subthreshold stimulus intensity for the Cstim and the inclusion of only large responses evoked by the T-only trials (>3 SDs; average SD above baseline = 63.48 ± 43.63). Moreover, in paired-pulse trials, our assessment of the incidence of facilitation and inhibition was based on significant modulations (±1.96 SDs). Errors caused by nonlinearity are expected to be small (Baker et al., 1998) and are thus likely to have been excluded from these analyses.
Statistical analysis.
Statistical analyses were performed using MATLAB (Version R2014a). Comparisons of the incidence of facilitatory or inhibitory effects were performed with χ2 tests followed by a post hoc two-proportion Z test. Comparisons of the magnitude of facilitatory or inhibitory effects were performed with two-sample t tests. p < 0.05 was considered statistically significant. When applicable, results are expressed as mean ± SE.
Results
We conducted a total of 24 paired-pulse protocols in four cebus monkeys to study the modulatory effects of iPMd (n = 12) and cPMd (n = 12) on M1 outputs (Fig. 1). As described above, clear EMG activity in at least one digit or forearm muscle was evoked with ICMS trains from all cortical sites selected for the Cstim and Tstim electrodes. Therefore, this study focuses specifically on the interactions between outputs from the distal forelimb representations in iPMd, cPMd, and M1.
For all 24 protocols, stimulations with the Tstim electrode (T-only trials) evoked a significant MEP (see Materials and Methods) in at least one and up to seven muscles of the contralateral arm (total = 81 MEPs). Similar to previous reports in awake monkeys (Lemon et al., 1987; Baker et al., 1998), we observed that single-pulse ICMS in M1 commonly evoked an early facilitation followed by a longer-lasting suppression (∼60% of cases) in unrectified EMG signals. Significant MEPs were more common in the FPB (n = 23), APB (n = 16), ECU (n = 14), and EDC (n = 12) and less common in PL (n = 7) and FDS (n = 6). Because we specifically positioned our Tstim electrode at cortical sites that evoked EMG activity in digit or forearm muscles, as expected, we found very few MEPs in proximal arm muscles (BB = 3, TB = 0). We thus only analyzed MEPs in intrinsic hand (FPB and APB; total n = 39 MEPs) and forearm muscles (ECU, EDC, PL, and FDS; total n = 39 MEPs).
Figure 3 is an intensity plot that provides a complete view of the effects of iPMd and cPMd conditioning on the MEPs in intrinsic hand and forearm muscles (total of 37 MEPs modulated by iPMd and 41 MEPs modulated by cPMd). For iPMd (Fig. 3A), we found a total of 18 MEPs in intrinsic hand muscles collected from 11 protocols (four protocols with only one MEP in either FPB or APB) and a total of 19 MEPs in forearm muscles collected from nine protocols (four protocols with only one MEP in a forearm muscle). For cPMd (Fig. 3B), we found a total of 21 MEPs in intrinsic hand muscles collected from 12 protocols (three protocols with only one MEP in either FPB or APB) and a total of 20 MEPs in forearm muscles collected from eight protocols (three protocols with only one MEP in a forearm muscle). Each line in the left column of Figure 3 shows the MEP evoked with the Tstim only. The color intensity in the other columns is normalized to the peak value of this MEP and presents the responses with the Cstim only and the paired stimulations conditions (C+T) with the different ISIs. In paired-pulse conditions, the conditioning stimulations induced a wide range of modulatory effects on M1 outputs across the different ISIs and this was the case in intrinsic hand and forearm muscles. In both muscle groups, we found cases in which the conditioning stimulus in iPMd or cPMd could increase the peak amplitude of the MEP (facilitation) or decrease it (inhibition) with any of the tested ISIs. In some cases, when the conditioning stimulation had an effect on the MEP, it was always facilitatory regardless of the ISI (pure facilitation across ISIs; see red arrows in Fig. 3). In other cases, when the conditioning stimulation had an effect, it was always inhibitory regardless of the ISI (pure inhibition across ISIs; see blue arrows in Fig. 3). Finally, the conditioning stimulation could facilitate the MEP with some ISIs and inhibit the MEP with others (opposite effects across ISIs; see purple arrows in Fig. 3).
Figure 3.
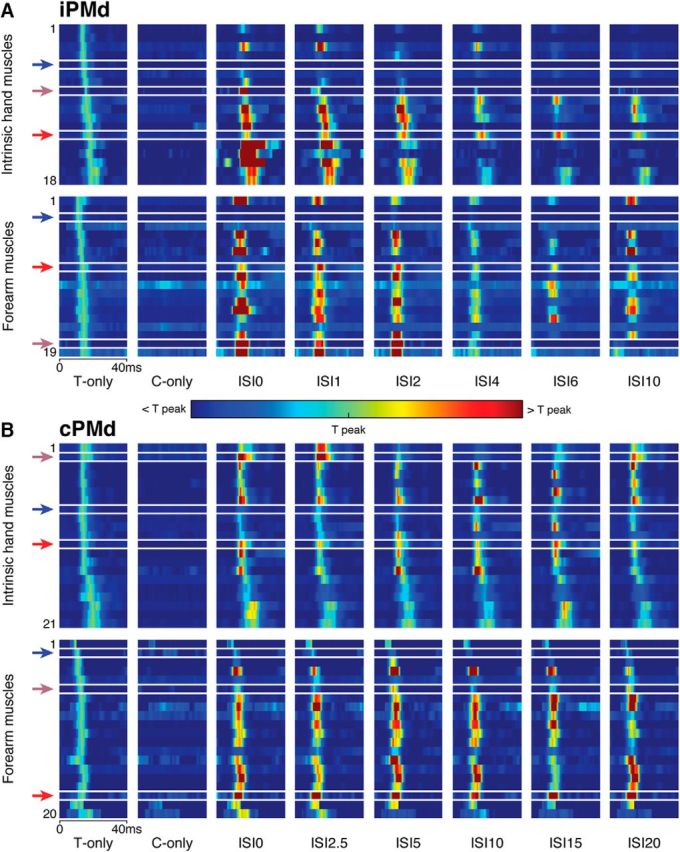
Complete dataset of modulatory effects of iPMd and cPMd on M1 outputs. A, Effects of iPMd conditioning on the 18 MEPs recorded in intrinsic hand muscles (FPB, APB; top) and the 19 MEPs recorded in forearm muscles (ECU, EDC, PL, FDS; bottom). Columns from left to right show the activity for 40 ms after the stimulation (time = 0) evoked in T-only trials, C-only trials, and the six different tested ISIs (0, 1, 2, 4, 6, and 10 ms). These responses are normalized to MEP peak intensity in the T-only condition (color scale below). Each row in the plots is an individual MEP ordered from top to bottom based on the peak latency in the T-only condition. Because the intensity of the Cstim was purposefully subthreshold, little activity is observed in the C-only condition. The red, blue, and purple arrows, respectively, highlight examples in which the conditioning stimulation in iPMd induced pure facilitation, pure inhibition, and opposite effects across ISIs. In general, iPMd conditioning appeared to induce more cases of facilitation (yellow to red colors) with shorter ISIs (ISI0, ISI1, and ISI2) and more cases of inhibition (light to dark blue colors) with longer ISIs (ISI4, ISI6, and ISI10). B, Effects of cPMd conditioning on the 21 MEPs recorded in intrinsic hand muscles (top) and the 20 MEPs recorded in forearm muscles (bottom). Columns and arrows are as in A, although different latencies were used for the tested ISIs (0, 2.5, 5, 10, 15, and 20 ms). In general, cPMd appeared to induce more facilitation with all ISIs, especially in forearm muscles.
Despite this variability, some notable general trends in the dataset were also visible. Conditioning stimulations in iPMd appeared to be more likely to facilitate M1 outputs with shorter ISIs and this was the case for both intrinsic hand and forearm muscles (Fig. 3A). With longer ISIs, inhibitory effects became much more frequent in both muscle groups. In comparison, conditioning stimulations in cPMd generally seemed to induce more facilitatory effects and modulatory effects from cPMd appeared to be less affected by ISIs (Fig. 3B). These trends were more obvious in forearm than intrinsic hand muscles.
Quantification of the modulatory effects of iPMd on M1 outputs with each ISI
For each significant MEP in T-only trials, we created a probability distribution of predicted peak amplitudes based on the combination of responses in C-only and T-only trials (see Materials and Methods and Fig. 2). We then compared the MEPs in paired stimulations conditions with this distribution to identify significant modulatory effects. For each tested ISI, we counted the number of significant facilitatory and inhibitory effects and the average magnitude of these two types of modulation (Fig. 4).
Figure 4.

Quantification of modulatory effects of iPMd and cPMd with each ISI. A, Incidence (left) and magnitude (right) of modulations in intrinsic hand muscles produced by iPMd with the different tested ISIs. In the left panel, each bar shows the proportion of the 18 MEPs that were significantly facilitated (red) or inhibited (blue) with each ISI. For example, when both the Cstim and Tstim were applied simultaneously (ISI0), 11 of the 18 MEPs (61.1%) had a significant increase of peak amplitude compared with the distribution of predicted peaks (facilitation) and four (22.2%) had a significant decrease of peak amplitude (inhibition). The right panel shows the magnitude of the modulations in intrinsic hand muscles produced by iPMd conditioning. The histogram presents the mean (±SE) of the positive and negative Z-scores with the different ISIs. B, Incidence (left) and magnitude (right) of modulations in forearm muscles produced by iPMd conditioning with each ISI. C, Data with all tested ISIs pooled for the incidence (left) and magnitude (right) to reveal the general modulatory effects produced by iPMd conditioning. Inhibitory effects induced by iPMd were significantly more powerful in intrinsic hand than in forearm muscles. D, Incidence (left) and magnitude (right) of modulations in intrinsic hand muscles produced by cPMd with the different tested ISIs. E, Incidence (left) and magnitude (right) of modulations in forearm muscles produced by cPMd with each ISI. F, Data with all tested ISIs pooled for the incidence (left) and magnitude (right) of modulations produced by cPMd conditioning. Facilitatory effects were significantly more common and more powerful in forearm than in intrinsic hand muscles. *Significant effects.
For intrinsic hand muscles, of the 108 MEPs (18 significant responses with T-only conditioned with 6 ISIs), we found 87 cases in which iPMd conditioning significantly modulated M1 outputs (80.6%). Out of these significant effects, we found fewer cases of facilitation (n = 32; 36.8%) than cases of inhibition (n = 55; 63.2%). Figure 4A, left, shows the incidence of significant facilitation and inhibition with each tested ISI. With each ISI, we found some cases in which iPMd conditioning induced significant facilitation and some cases in which it induced significant inhibition. However, in this figure, it becomes obvious that facilitatory effects were much more common when the Cstim preceded the Tstim by shorter ISIs (ISI0, n = 11; ISI1, n = 9; and ISI2, n = 6) and less common with longer ISIs (ISI4, n = 3; ISI6, n = 2; and ISI10, n = 1). In contrast, inhibitory effects were less likely to occur with shorter ISIs (ISI0, n = 4; ISI1, n = 6) and more likely to occur with longer ISIs (ISI4, n = 11; ISI6, n = 13; and ISI10, n = 12).
We also studied the magnitude of the modulation of M1 outputs to intrinsic hand muscles produced by iPMd conditioning using the relative measure of the intensity of the modulatory effect (Z-score; see Materials and Methods; Fig. 4A, right). These analyses revealed that the magnitude of the facilitatory and inhibitory effects with each ISI generally followed a similar pattern as the one described for incidence. Facilitatory effects were more powerful with shorter ISIs, especially with ISI0. Although the impact of ISIs on the magnitude of inhibitory effects was much milder, there was a tendency for inhibitory effects to be more powerful with longer ISIs. Therefore, iPMd induced more frequent and powerful facilitatory effects with shorter ISIs and induced more frequent and powerful inhibitory effects with longer ISIs. It is worth noting that one cortical site in iPMd (C14 in CB3; Fig. 1) generated particularly strong facilitatory effects in intrinsic hand muscles with ISI0 (> 20 times greater than those of other cortical sites). Therefore, we decided to remove data from this site in our analyses and figures showing the magnitude of modulatory effects from iPMd. Including these data would increase the magnitude of facilitatory effect with ISI0 dramatically without affecing the rest of the pattern of facilitatory effects for each ISI.
We then performed the same analyses for MEPs in forearm muscles. Of the 114 studied MEPs (19 significant responses with T-only conditioned with six ISIs), we found 88 cases (77.2%) in which peak amplitude of the MEP was significantly greater or smaller than the probability distribution. Of these significant effects, we found a comparable proportion of facilitation (n = 46; 52.3%) and inhibition (n = 42; 47.7%). In general, the pattern of modulation in forearm muscles followed similar trends as the ones described for intrinsic hand muscles. Conditioning stimulations in iPMd induced more facilitation with shorter ISIs (ISI0, n = 11; ISI1, n = 12; and ISI2, n = 11) and more inhibition with longer ISIs (ISI6, n = 13; ISI10, n = 8; Fig. 4B, left). For the magnitude of effects (Fig. 4B, right), we found that facilitatory effects were more powerful with shorter ISIs, especially with ISI0, and less powerful with longer ISIs. The magnitude of inhibitory effects tended to be of comparable strength for each ISI.
We pooled data from all tested ISIs to compare the modulations of iPMd on intrinsic hand and forearm muscles using a χ2 test (Fig. 4C, left). We found that the distribution of modulatory effects influencing intrinsic hand muscles was not different from that influencing forearm muscles (χ2 = 4.63; p = 0.10). We also compared the magnitude of the modulatory effects induced by iPMd on intrinsic hand and forearm muscles using two-sample t tests (Fig. 4C, right). One two-sample t test was used to compare the facilitatory effects and a second to compare inhibitory effects. We found that the magnitude of facilitatory effects was not significantly different (t = −1.07; p = 0.29). However, the magnitude of inhibitory effects was greater in intrinsic hand than in forearm muscles (t = −2.45; p = 0.02).
Quantification of the modulatory effects of cPMd on M1 outputs with each ISI
For intrinsic hand muscles, of the 126 MEPs (21 significant responses with T-only conditioned with six ISIs), we found 70 cases in which cPMd conditioning modulated M1 outputs significantly (55.6%). Of these significant effects, we found 38 cases of facilitation (54.3%) and 32 cases of inhibition (45.7%). Therefore, in contrast to iPMd, cPMd induced a greater proportion of facilitatory than inhibitory effects on intrinsic hand muscles. Figure 4D, left, shows the incidence of significant facilitation and inhibition with each ISI that we tested. The most common facilitatory effects were found when the Cstim preceded the Tstim by 15 ms (ISI15 n = 10) and when the two stimulations were delivered simultaneously (ISI0 n = 8). Facilitatory effects were least common with ISI2.5 (n = 3). With all tested ISIs, we also found cases in which cPMd conditioning induced significant inhibitory effects. Inhibitory effects were most likely to occur when the Cstim preceded the Tstim by 10 ms (ISI10 n = 8).
The magnitude of modulatory effects induced by cPMd conditioning on intrinsic hand muscles was not affected much by the ISIs. However, facilitation was strongest with ISI15 and ISI0 (Fig. 4D, right). Therefore, with these two ISIs, facilitatory effects were not only most frequent (Fig. 4D, left), they were also stronger. The magnitude of the inhibitory effects was even more stable with the various ISIs tested, supporting that, when present, inhibitory effects in intrinsic hand muscles were of relatively comparable strength regardless of the delay between the Cstim and Tstim.
In forearm muscles, of the 120 studied MEPs (20 significant responses with T-only conditioned with six ISIs), we found 87 cases (72.5%) in which peak amplitude of the MEP was significantly greater or smaller than the probability distribution. Again, in contrast to iPMd, many more of these significant effects were facilitatory (n = 58; 66.7%) compared with inhibitory (n = 29; 33.3%). After cPMd conditioning, we found a greater proportion of facilitatory than inhibitory effects in forearm muscles with each tested ISI (Fig. 4E, left). Facilitatory effects were slightly more common when the Cstim preceded the Tstim with midrange ISIs (ISI5, n = 12; ISI10, n = 11) and inhibitory effects were quite stable across ISIs. For the magnitude of modulatory effects of cPMd conditioning on MEPs in forearm muscles (Fig. 4E, right), we found that ISIs did not affect responses much.
We compared the incidence of effects induced by cPMd on intrinsic hand and forearm muscles using a χ2 test and found that the distribution of modulatory effects influencing intrinsic hand muscles was different from that influencing forearm muscles (χ2 = 10.1; p = 0.01) (Fig. 4F, left). A post hoc two-proportion Z test confirmed that conditioning of cPMd induced significantly more facilitatory effects in forearm (48.3%) than in intrinsic hand muscles (30.2%; p = 0.003). In contrast, the incidence of inhibitory effects was not significantly different between intrinsic hand and forearm muscles (p = 0.82). We also compared the magnitude of the modulatory effects induced by cPMd on intrinsic hand and forearm muscles using two-sample t tests (Fig. 4F, right). One two-sample t test was used to compare facilitatory effects and a second to compare inhibitory effects. We found that, whereas the magnitude of facilitatory effects was greater in forearm than intrinsic hand muscles (t = −2.74; p = 0.007), the magnitude of inhibitory effects of the two muscle groups was not significantly different (t = 1.60; p = 0.11).
Comparison of the pattern of modulatory effects of iPMd and iPMv with each ISI
In a previous study, we analyzed the effects evoked by PMv conditioning on the outputs of M1 (Quessy et al., 2016). Because these data were collected in the same animals as the ones analyzed in the present study for PMd, this allows for direct comparison of the modulatory effects from the two premotor areas. Furthermore, the distribution of significant MEPs evoked with T-only trials across recorded muscles was comparable for iPMd and iPMv (χ2 = 0.50; p = 1.55) and for cPMd and cPMv (χ2 = 1.5; p = 0.96).
Figure 5A, left, compares the number of significant modulatory effects evoked by iPMd and iPMv conditioning in all muscles combined with each tested ISI. With shorter ISIs (ISI0, ISI1, and ISI2), iPMd conditioning induced a greater proportion of facilitatory effects compared with iPMv. With longer ISIs (ISI4, ISI6, and ISI10) iPMd induced a smaller proportion of facilitatory effects. In contrast, inhibitory effects were more frequently induced by iPMd conditioning with all ISIs tested and this difference increased with longer ISIs. Figure 5A, right, compares the magnitude of modulatory effects induced by iPMd and iPMv with each tested ISI. Note that these analyses also excluded site C14 from CB3 (see above). Nevertheless, facilitatory effects from iPMd were stronger than those from iPMv with ISI0. They were weaker with all other ISIs, particularly ISI10. In contrast, iPMd induced more powerful inhibitory effects than iPMv with all tested ISIs.
Figure 5.

Comparison of the modulatory effects of PMd and PMv with each ISI. A, Comparison of the incidence (left) and magnitude (right) of modulations produced by iPMd and iPMv conditioning in all muscles combined with each ISI. The effects induced with iPMv conditioning (see-through gray) are overlaid on those induced with iPMd (red, facilitation; blue, inhibition). Accordingly, when PMv data overlap PMd data, the bar appears in light grayish red for facilitation and in light grayish blue for inhibition. B, Data with all tested ISIs pooled for the incidence (left) and magnitude (right) of modulations produced by iPMd and iPMv. Inhibitory effects were significantly more frequent and more powerful following iPMd compared with iPMv conditioning. C, Comparison of the incidence (left) and magnitude (right) of modulations produced by cPMd and cPMv conditioning in all muscles combined with each ISI. D, Data with all tested ISIs pooled for the incidence (left) and magnitude (right) of modulations produced by cPMd and cPMv. Facilitatory effects were significantly more frequent and more powerful after cPMd compared with cPMv conditioning. Inhibitory effects were significantly less frequent after cPMd compared with cPMv conditioning. *Significant effects.
Figure 5B combines data obtained with all tested ISIs for iPMd and iPMv. To compare the incidence of modulatory effects (Fig. 5B, left), we used a χ2 test followed by a post hoc two-proportion Z test. We found that the distribution of modulatory effects produced by iPMd conditioning was different from that produced by iPMv (χ2 = 34.2; p < 0.001). Although iPMd and iPMv conditioning induced similar proportions of facilitatory effects (35.1% and 33.7%, respectively; p = 0.75), iPMd induced significantly more inhibitory effects (43.7%) than iPMv (22.6%; p < 0.001). To compare the magnitude of modulatory effects of iPMd and iPMv (Fig. 5B, right), two-sample t tests were used. One two-sample t test comparing the magnitude of facilitatory effects showed no significant difference between iPMd and iPMv conditioning (mean Z-scores = 5.50 and 7.52, respectively; t = 1.52; p = 0.13). Another two-sample t test comparing the magnitude of inhibitory effects showed that iPMd induced significantly greater inhibitory effects than iPMv conditioning (mean Z-scores = −3.60 and −2.08, respectively; t = 6.72; p < 0.001). Therefore, in addition to being more numerous, inhibitory effects generated by iPMd were also significantly more powerful than those originating from iPMv.
Comparison of the pattern of modulatory effects of cPMd and cPMv with each ISI
We then performed the same analyses to compare the effects of premotor areas located in the hemisphere opposite to M1. Figure 5C, left, shows the number of significant modulatory effects evoked by cPMd and cPMv conditioning in all muscles combined with each tested ISI. The graph emphasizes that the incidence of facilitatory effects was much greater after cPMd than after cPMv conditioning and this was true with each tested ISI. The difference between cPMd and cPMv was particularly striking when the Cstim preceded the Tstim by 15 ms (ISI15) or when the Cstim and Tstim were delivered simultaneously (ISI0). Moreover, cPMd conditioning induced fewer inhibitory effects than cPMv with each tested ISI. The difference between the two cortical areas was the greatest when longer ISIs separated the Cstim and Tstim (ISI15 and ISI20) and with ISI0. When comparing the magnitude of the effects from cPMd and cPMv (Fig. 5C, right), we found that facilitatory effects from cPMd were much more powerful than those from cPMv with all tested ISIs, with the exception of ISI5. Facilitation from cPMd was particularly stronger with ISI15 and ISI0. Although inhibitory effects were less common in cPMd compared with cPMv with all tested ISIs (Fig. 5C, left), the strength of inhibition was much more similar for the two premotor areas. In fact, inhibitory effects of cPMd were slightly stronger than those of cPMv with half of the tested ISIs (ISI0, ISI5, and ISI10).
Once again, we combined all tested ISIs to compare the incidence of modulatory effects (Fig. 5D, left) with a χ2 test followed by a post hoc two-proportion Z test. We found that the distribution of modulatory effects produced by cPMd conditioning was different from that produced by cPMv (χ2 = 66.6; p < 0.001). Conditioning stimulations in cPMd induced significantly more facilitatory effects (39.0%; 11.0%; p < 0.001) and significantly fewer inhibitory effects (24.8%) than in cPMv (53.0%; p < 0.001). To compare the magnitude of modulatory effects of cPMd and cPMv (Fig. 5D, right), two-sample t tests were used. One two-sample t test comparing the magnitude of facilitatory effects showed that cPMd conditioning induced significantly greater facilitatory effects than cPMv (mean Z-scores = 3.74 and 2.46 respectively; t = 2.70; p = 0.008). Another two-sample t test comparing the magnitude of inhibitory effects showed no significant difference between cPMd and cPMv conditioning (mean Z-scores = −3.18 and −3.23 respectively; t = 0.19; p = 0.85). Therefore, in addition to being more numerous, facilitatory effects generated by cPMd were also significantly more powerful than those originating from cPMv. In contrast, although cPMd conditioning generated fewer inhibitory effects, the magnitude of these inhibitory effects was similar to those induced by cPMv.
Comparison of the modulatory effects across ISIs from PMd and PMv
For any given MEP evoked with the T-only trials, we looked at the pattern of modulation across ISIs and separated them into three groups (Deffeyes et al., 2015; Quessy et al., 2016). First, the conditioning of PMd or PMv could facilitate the MEP significantly with at least one ISI, but never inhibited M1 outputs significantly with any of the ISIs (i.e., pure facilitation across ISIs). Second, the conditioning of PMd or PMv could inhibit the MEP significantly with at least one ISI, but never facilitated M1 outputs significantly with any of the ISIs (i.e., pure inhibition across ISIs). Third, the conditioning of PMd or PMv could facilitate the MEP significantly with at least one ISI and could also inhibit the MEP significantly with at least one ISI (i.e., opposite effects across ISIs).
When looking at the effects across the ISIs that we tested in iPMd, we did not find any MEP that was not modulated significantly with any of the ISIs, supporting that modulatory effects from iPMd on M1 outputs were very likely to occur with the ISIs we selected. Of our population of 37 MEPs conditioned by iPMd, we found that pure facilitation (nine cases, 24.3%) was less common than pure inhibition (12 cases, 32.4%) and that opposite effects (16 cases, 43.2%) were more common than either pure facilitation or pure inhibition (Fig. 6A). Although iPMv induced more pure facilitatory effects than either pure inhibitory or opposite effects across ISIs (Quessy et al., 2016), this pattern was not significantly different from the one induced by iPMd (χ2 = 2.05; p = 0.72).
Figure 6.

Groups of modulatory effects across ISIs for PMd and PMv. A, Incidence of pure facilitatory, pure inhibitory, and opposite effects across ISIs for iPMd (colored bars) and iPMv (gray bars). For iPMd, there were fewer cases of pure facilitation (red) than pure inhibition (blue) and more cases of opposite effects across ISIs (purple). For iPMv, cases of pure facilitation were most common and opposite effects were the least common. However, the patterns of iPMd and iPMv across ISIs were not significantly different. B, Incidence of pure facilitatory, pure inhibitory, and opposite effects across ISIs for cPMd (colored bars) and cPMv (gray bars). For cPMd, we found many more cases of pure facilitation (red) than pure inhibition (blue) or opposite effects (purple) across ISIs. The proportions of pure facilitation and pure inhibition induced by cPMd and cPMv were significantly different. *Significant effects.
For cPMd conditioning, we found only one MEP that was not modulated significantly with any of the ISIs. This once again supports that cPMd was very likely to modulate M1 outputs with the ISIs we selected (97.6%). Of our population of 41 MEPs, we found many more cases in which the conditioning of cPMd had pure facilitatory effects (24 cases, 58.5%) than pure inhibitory (10 cases, 24.4%) or opposite effects (six cases, 14.6%) across ISIs (Fig. 6B). Therefore, most neural populations stimulated in cPMd had only facilitatory effects on M1 outputs regardless of the latency that separated the Cstim and Tstim. This pattern is quite different from the one found for cPMv (Quessy et al., 2016), which induced many more pure inhibitory effects than either opposite or pure facilitatory effects (Fig. 6B). The pattern of effects was significantly different after cPMd and cPMv conditioning (χ2 = 19.1; p < 0.001). Post hoc two-proportion Z test confirmed that cases of pure facilitation were more common after cPMd conditioning (p < 0.001) and cases of pure inhibition were more common after cPMv conditioning (p = 0.005). However, cPMd and cPMv conditioning induced a similar number of cases of opposite effects across tested ISIs (p = 0.10). These results suggest that, compared with cPMv, more cortical territory in cPMd is devoted to inducing pure facilitatory effects and less to inducing pure inhibitory effects.
Comparison of the modulatory effects of PMd and PMv on different muscle categories
We then wanted to know whether the effects of PMd and PMv conditioning were similar or different for the various muscles that we recorded. To investigate this, we first separated the muscles into functional categories: intrinsic hand (FPB, APB), forearm extensors (ECU, EDC), and forearm flexors (PL, FDS). We counted the incidence of significant facilitatory and inhibitory effects induced by PMd and PMv in each muscle category and compared them with a χ2 test followed by a post hoc two-proportion Z test (Fig. 7).
Figure 7.

Modulatory effects of PMd and PMv on different muscle categories. A, Incidence of significant modulation induced by iPMd (colored bars) and iPMv (gray bars) in each functional category of muscles (hand, intrinsic hand; extensors, forearm extensors; flexors, forearm flexors). Conditioning stimulation in iPMd induced significantly fewer facilitatory effects (red) in intrinsic hand and more facilitatory effects in forearm muscles compared with iPMv. In contrast, significant differences in incidence of inhibitory effects were only observed for intrinsic hand muscles and they were more common after iPMd conditioning (blue) compared with iPMv conditioning. B, Incidence of significant modulation induced by cPMd (colored bars) and cPMv (gray bars) in each functional category of muscles. Facilitatory effects were significantly more common in all three muscle categories after cPMd conditioning (red) compared with cPMv conditioning. In contrast, inhibitory effects were significantly less common in all three muscle categories after cPMd conditioning (blue) compared with cPMv conditioning. These differences between the modulatory patterns of cPMd and cPMv were more pronounced in forearm muscles, especially in flexor muscles. *Significant effects.
When looking at the effects of iPMd conditioning in different categories of muscles (Fig. 7A), we found that facilitatory effects were most common in forearm flexors while inhibitory effects were most common in intrinsic hand muscles. The distribution of modulatory effects produced by iPMd was different from that produced by iPMv in each muscle category (intrinsic hand χ2 = 43.0; p < 0.001; forearm extensors χ2 = 17.4; p < 0.001; forearm flexors χ2 = 10.5; p = 0.01). For intrinsic hand muscles, conditioning of iPMd induced fewer facilitatory effects (29.6%) than iPMv (54.4%; p < 0.001) and more inhibitory effects (50.9% versus 10.5% for iPMd and iPMv respectively; p < 0.001). For forearm extensor muscles, conditioning of iPMd induced significantly more facilitatory effects (34.6%) than iPMv (16.7%; p = 0.005). For forearm flexor muscles, iPMd induced significantly more facilitatory effects (52.8%) than iPMv (16.7%; p = 0.001). Therefore, whereas iPMd generally induced more inhibitory effects compared with iPMv (Fig. 5B), this difference was only significant in intrinsic hand muscles.
For the effects of cPMd in different categories of muscles (Fig. 7B), we found that facilitatory effects were most common in forearm muscles, especially in flexors, whereas inhibitory effects were most common in forearm extensors. Once again, this pattern was different from that produced by cPMv for all three muscle categories (intrinsic hand χ2 = 14.1; p = 0.002; forearm extensors χ2 = 27.3; p < 0.001; forearm flexors χ2 = 44.6; p < 0.001). In intrinsic hand muscles, conditioning of cPMd induced significantly more facilitatory effects (30.2%) than cPMv (17.5%; p = 0.02) and fewer inhibitory effects (25.4% vs 48.2% for iPMd and iPMv, respectively; p < 0.001). Similar, but even more pronounced, differences were observed in forearm muscles. For forearm extensor muscles, conditioning of cPMd induced significantly more facilitatory effects (41.0%) than cPMv (7.1%; p < 0.001) and fewer inhibitory effects (29.5% vs 57.1% for iPMd and iPMv, respectively; p < 0.001). For forearm flexor muscles, cPMd induced significantly more facilitatory effects (61.9%) than cPMv (4.5%; p < 0.001) and fewer inhibitory effects (14.3% and 56.1% for iPMd and iPMv, respectively; p < 0.001). Therefore, the differences of modulatory effects from cPMv and cPMd were less pronounced in intrinsic hand muscles and more pronounced in forearm muscles, especially in flexors.
Comparison of the modulatory effects across muscles from PMd and PMv
We then wondered whether the conditioning stimulation had the same or different effects across the muscles that we recorded. In theory, the conditioning stimulation could induce significant facilitation on the MEP of one and up to all six muscles (i.e., pure facilitation across muscles), could only be inhibitory on the MEPs (i.e., pure inhibition across muscles), or simultaneously facilitate and inhibit different combinations of muscles (i.e., simultaneous mixed effects across muscles; Deffeyes et al., 2015; Quessy et al., 2016). For each protocol (i.e., cortical stimulation site), we counted the incidence of each of these three possible groups of effects across muscles (Fig. 8).
Figure 8.

Groups of modulatory effects across muscles for PMd and PMv. A, Incidence of pure facilitatory, pure inhibitory, and mixed effects across muscles for iPMd (colored bars) and iPMv (gray bars). Each bar represents the proportion of cases in which a given paired-pulse protocol (i.e., interactions between two cortical sites) induced pure facilitatory, pure inhibitory, or mixed effects across the various muscles modulated with a given ISI. We found that iPMd induced significantly more cases of pure inhibitory effects (blue) and fewer cases of mixed effects (purple) across muscles than iPMv. B, Incidence of pure facilitatory, pure inhibitory, and mixed effects across muscles for cPMd (colored bars) and cPMv (gray bars). We found that cPMd induced significantly more cases of pure facilitatory effects (red) and fewer cases of pure inhibitory effects (blue) across muscles than iPMv. *Significant effects.
For protocols recorded with iPMd conditioning (12 protocols × 6 ISIs = 72 cases), we found 25 cases (35.7%) in which iPMd evoked only facilitation across recorded muscles and, in 19 of these (76.0%), more than one muscle was facilitated simultaneously. We found considerably more cases in which iPMd evoked only inhibition across recorded muscles (40 cases; 55.6%) and, in 30 of these (75.0%), more than one muscle was inhibited simultaneously. Finally, we rarely found cases in which iPMd induced simultaneous mixed effects across muscles (2 cases; 2.8%; Fig. 8A). This pattern was different from what we found previously for iPMv (χ2 = 17.4; p < 0.001; Quessy et al., 2016). Post hoc two-proportion Z tests revealed that iPMd and iPMv conditioning induced similar amounts of pure facilitatory effects (p = 0.25). However, iPMd induced more cases of pure inhibition than iPMv (p < 0.001), whereas iPMv induced more cases of simultaneous mixed effects across muscles than iPMd (p = 0.01).
Finally, for protocols recorded with cPMd conditioning (Fig. 8B; 12 protocols × 6 ISIs = 72 cases), we found 33 cases (45.8%) of pure facilitation across muscles and, in 23 of these (69.7%), more than one muscle was facilitated. We found fewer cases of pure inhibition (24 cases; 33.3%) and, in 20 of these (83.3%), more than one muscle was inhibited. We rarely found cases of simultaneous mixed effects (2 cases; 2.8%). Once again, this pattern was quite different from what we found previously for cPMv (Quessy et al., 2016; χ2 = 13.9; p = 0.002). Post hoc two-proportion Z tests confirmed that, compared with cPMv, the incidence of cases of pure facilitation was greater (p = 0.001) and the incidence of pure inhibition across muscles was smaller (p = 0.004) after cPMd conditioning. However, cPMd and cPMv conditioning induced comparable amounts of simultaneous mixed effects across muscles (p = 0.11).
Discussion
Our objectives were to study the modulatory effects of PMd on the outputs of M1 to intrinsic hand and forearm muscles with invasive miscrostimulations techniques and compare them with those of PMv collected in the same animals (Quessy et al., 2016). We found that iPMd was more likely to inhibit M1 outputs than iPMv and these inhibitory effects were more powerful. In the opposite hemisphere, cPMd was more likely to facilitate M1 outputs than cPMv and these facilitatory effects were more powerful. Our results support that the patterns of modulations induced by PMd and PMv are strikingly different. These contrasting effects could support the specific roles that these premotor areas play for the production of hand movements and may predispose them to contribute differently to the reorganization of cortical networks after brain injury.
Invasive microstimulations to study interactions of cortical outputs
Most studies investigating the interactions of cortical outputs are conducted with TMS. Although there are several advantages to TMS, such as the ease to test interactions in various behavioral contexts, one limitation is that the volume of stimulated tissue is relatively large (∼1 cm; Cowey, 2005; Wassermann et al., 2008). This means that only effects of broad populations of neurons from a few distinct cortical sites can be investigated effectively from each area. Furthermore, the size of the coils may be a problem for paired-pulse paradigms when the two tested areas are in close proximity, such as for iPMd and M1. In the present study, the use of ICMS with intensities ≤300 μA allowed us to stimulate much smaller cortical volumes (<0.5 mm radius) (Stoney et al., 1968) to reveal how clusters of neurons within iPMd and cPMd can affect M1 outputs. Across all protocols, the closest pair of C and T electrodes were >5.6 mm apart (sites C10 and T10 in CB2), insuring that the effects induced by iPMd were not due to current spread to M1.
We chose to collect our data in terminal preparations under sedation (Cerri et al., 2003; Quessy et al., 2016). An advantage of these preparations is that a great quantity of data can be collected within a single experiment under stable conditions. Here, it allowed the sampling of several cortical sites and testing of multiple ISIs. These experiments can be viewed more as “neuroanatomical”, providing insights into the range of potential effects that the outputs of iPMd and cPMd can exert on M1 through the different pathways that these cortical areas share. However, the reciprocal nature of connections between premotor areas and M1 should also be kept in mind (Dum and Strick, 2005; Dancause et al., 2006; Dea et al., 2016; Hamadjida et al., 2016). We cannot exclude that some of the observed effects were caused by antidromic activation of M1 neurons projecting to PMd.
The diversity or variability of modulations that we found across tested sites is consistent with previous reports using ICMS techniques in monkeys (Tokuno and Nambu, 2000; Prabhu et al., 2009) and appears to be an inherent property of premotor areas' effects on M1 neurons and M1 outputs. We propose that it provides a versatile substrate for premotor areas to contribute to a wide variety of motor functions. During different stages of movement preparation and production or depending on the task, the variability of modulatory effects may decrease as different subpopulations of premotor neurons are activated selectively and exert the prominent influence on motor outputs. This state-dependent selective activation of different circuits in awake, behaving animals could explain differences with the patterns of modulatory effects observed under sedation (Cerri et al., 2003; Prabhu et al., 2009).
Modulatory effects of iPMd and cPMd on the outputs of M1
TMS studies in humans have shown that iPMd can induce either facilitatory or inhibitory effects on M1 outputs to intrinsic hand muscles depending on the timing between the stimulations (ISIs) and the conditioning stimulation intensity (Civardi et al., 2001; Koch et al., 2007; Groppa et al., 2012b). Using ICMS techniques in cebus monkeys, we also found that the proportion of facilitation and inhibition induced by iPMd was greatly affected by ISIs. Although facilitation was much more common with shorter ISIs, inhibition was much more likely to be induced with longer ISIs. Facilitatory effects were particularly common and powerful when the Cstim and Tstim were applied simultaneously (ISI0).
Based on the estimated intrahemispheric conduction time between premotor areas and M1 (∼1–2 ms; Godschalk et al., 1984; Tokuno and Nambu, 2000), it is tempting to speculate that facilitatory effects from iPMd with ISI0 could, at least in part, be carried through subcortical routes. In particular, corticospinal projections of iPMd to lower cervical levels (He et al., 1993), where motoneurons controlling distal forearm muscles are located, could favor the integration of facilitatory outputs from iPMd and M1 to intrinsic hand and forearm muscles in the spinal cord. PMv has many fewer direct projections to lower cervical segments (He et al., 1993; Borra et al., 2010), which may favor the corticocortical route.
Studies in humans using TMS have also reported that cPMd can have both facilitatory (Bäumer et al., 2006) and inhibitory (Mochizuki et al., 2004) effects on M1 outputs to intrinsic hand muscles at rest depending on the Cstim intensity (Koch et al., 2006). Shifts between facilitation and inhibition also occur during different phases of movement preparation and production (Kroeger et al., 2010; Liuzzi et al., 2010). Similarly, our results show that cPMd can be both facilitatory and inhibitory on M1 outputs.
Although the modulatory effects of cPMd induced with most of the ISIs that we tested could have been carried through callosal projections, we also found several cases in which cPMd modulated M1 outputs with ISI0. Considering that the shortest interhemispheric conduction time is ∼2–6 ms (Asanuma and Okuda, 1962; Matsunami and Hamada, 1984), it is unlikely that these effects were caused by cortical interactions; rather, they may have occurred at a downstream site of convergence, for example, through bilateral projections of premotor areas and M1 to the reticular formation (Kuypers and Lawrence, 1967; Keizer and Kuypers, 1989; Kably and Drew, 1998).
Comparison of the pattern of modulatory effects from PMd and PMv
The main finding of the present study is the sharp contrast between modulatory effects from PMd and PMv on M1 outputs. In the ipsilateral hemisphere, iPMd induced more and stronger inhibitory effects than iPMv. Studies in both humans and monkeys have demonstrated that iPMd is involved in intersegmental coupling and monitoring of the different components of prehensile movements (Raos et al., 2004; Davare et al., 2006). In this context, it is possible that inhibition induced by iPMd suppresses unwanted outputs, decreases co-contractions, and refines the coordination of EMG patterns across the entire arm. In contrast, iPMv seems primarily involved in transforming object properties into proper hand configurations for grasping (Fogassi et al., 2001; Davare et al., 2006). Powerful facilitation from iPMv may thus be used to favor the outputs to the appropriate muscles to form adapted grips (Prabhu et al., 2009).
In the contralateral hemisphere, cPMd had more and stronger facilitatory effects on M1 outputs than cPMv. Human imaging studies have shown that the activity in cPMd increases with the complexity of sequential finger movements (Sadato et al., 1996) and that cPMd is involved in the execution of complex bimanual anti-phase movements (Meyer-Lindenberg et al., 2002). Hence, facilitatory effects from cPMd may be used to strengthen the most efficient M1 activation patterns to produce dexterous movements of the ipsilateral hand (Horenstein et al., 2009) or help to maintain synchronous asymmetrical movements of the two hands (Liuzzi et al., 2011). In comparison, inhibitory effects from cPMv may help to suppress mirror movements in the arm contralateral to M1 to favor unimanual grasping (Nudo and Masterton, 1990; Wise, 2006).
Finally, the contrasting pattern of modulatory effects from cPMd and cPMv may also have major implications for motor recovery after brain injury. Most neuromodulatory protocols currently tested in stroke patients attempt to inhibit the contralesional M1 based on the concept of interhemispheric imbalance (Nowak et al., 2009). According to this view, the predominant inhibitory effects from contralesional M1 on the ipsilesional network increase after stroke (Murase et al., 2004; Duque et al., 2005) and interfere with recovery. However, the current model of interhemispheric imbalance does not consider the impact of other cortical areas in the complex motor network of primates and is likely oversimplified (Grefkes and Fink, 2012).
We propose that the contrasting patterns of modulatory effects of cPMd and cPMv could predispose them to play different, somewhat opposing roles in poststroke interhemispheric interplay and recovery. In addition to M1, cPMv may also exert detrimental inhibition on the ipsilesional network in some patients and cPMd could play a favorable role in the reestablishment of interhemispheric balance. If so, inhibition of cPMv or facilitation of cPMd could be more effective strategies in these patients. Although the potential of these approaches will have to be investigated in future experiments, our data certainly point out that cPMd and cPMv should be considered as prime targets for the development of alternative neuromodulatory treatments.
Footnotes
This work was supported by the Natural Sciences and Engineering Research Council of Canada (NSERC Discovery Grant RGPIN-2016-05718 to N.D). S.L.C. was supported by a master's salary award from NSERC. A.H. was supported by a postdoctoral fellowship from the Groupe de Recherche sur le Système Nerveux Central. We thank Kelsey N. Dancause for editing comments on the manuscript.
The authors declare no competing financial interests.
References
- Asanuma H, Okuda O (1962) Effects of transcallosal volleys on pyramidal tract cell activity of cat. J Neurophysiol 25:198–208. [DOI] [PubMed] [Google Scholar]
- Baker SN, Lemon RN (1995) Non-linear summation of responses in averages of rectified EMG. J Neurosci Methods 59:175–181. 10.1016/0165-0270(94)00180-O [DOI] [PubMed] [Google Scholar]
- Baker SN, Olivier E, Lemon RN (1998) An investigation of the intrinsic circuitry of the motor cortex of the monkey using intra-cortical microstimulation. Exp Brain Res 123:397–411. 10.1007/s002210050585 [DOI] [PubMed] [Google Scholar]
- Bäumer T, Bock F, Koch G, Lange R, Rothwell JC, Siebner HR, Münchau A (2006) Magnetic stimulation of human premotor or motor cortex produces interhemispheric facilitation through distinct pathways. J Physiol 572:857–868. 10.1113/jphysiol.2006.104901 [DOI] [PMC free article] [PubMed] [Google Scholar]
- Borra E, Belmalih A, Gerbella M, Rozzi S, Luppino G (2010) Projections of the hand field of the macaque ventral premotor area F5 to the brainstem and spinal cord. J Comp Neurol 518:2570–2591. [DOI] [PubMed] [Google Scholar]
- Boudrias MH, McPherson RL, Frost SB, Cheney PD (2010) Output properties and organization of the forelimb representation of motor areas on the lateral aspect of the hemisphere in rhesus macaques. Cereb Cortex 20:169–186. 10.1093/cercor/bhp084 [DOI] [PMC free article] [PubMed] [Google Scholar]
- Buch ER, Mars RB, Boorman ED, Rushworth MF (2010) A network centered on ventral premotor cortex exerts both facilitatory and inhibitory control over primary motor cortex during action reprogramming. J Neurosci 30:1395–1401. 10.1523/JNEUROSCI.4882-09.2010 [DOI] [PMC free article] [PubMed] [Google Scholar]
- Cerri G, Shimazu H, Maier MA, Lemon RN (2003) Facilitation from ventral premotor cortex of primary motor cortex outputs to macaque hand muscles. J Neurophysiol 90:832–842. 10.1152/jn.01026.2002 [DOI] [PubMed] [Google Scholar]
- Civardi C, Cantello R, Asselman P, Rothwell JC (2001) Transcranial magnetic stimulation can be used to test connections to primary motor areas from frontal and medial cortex in humans. Neuroimage 14:1444–1453. 10.1006/nimg.2001.0918 [DOI] [PubMed] [Google Scholar]
- Cowey A. (2005) The Ferrier Lecture 2004 what can transcranial magnetic stimulation tell us about how the brain works? Philos Trans R Soc London B 360:1185–1205. 10.1098/rstb.2005.1658 [DOI] [PMC free article] [PubMed] [Google Scholar]
- Dancause N, Barbay S, Frost SB, Plautz EJ, Popescu M, Dixon PM, Stowe AM, Friel KM, Nudo RJ (2006) Topographically divergent and convergent connectivity between premotor and primary motor cortex. Cereb Cortex 16:1057–1068. [DOI] [PubMed] [Google Scholar]
- Davare M, Andres M, Cosnard G, Thonnard JL, Olivier E (2006) Dissociating the role of ventral and dorsal premotor cortex in precision grasping. J Neurosci 26:2260–2268. 10.1523/JNEUROSCI.3386-05.2006 [DOI] [PMC free article] [PubMed] [Google Scholar]
- Davare M, Lemon R, Olivier E (2008) Selective modulation of interactions between ventral premotor cortex and primary motor cortex during precision grasping in humans. J Physiol 586:2735–2742. 10.1113/jphysiol.2008.152603 [DOI] [PMC free article] [PubMed] [Google Scholar]
- Dea M, Hamadjida A, Elgbeili G, Quessy S, Dancause N (2016) Different patterns of cortical inputs to subregions of the primary motor cortex hand representation in Cebus apella. Cereb Cortex 26:1747–1761. 10.1093/cercor/bhv324 [DOI] [PMC free article] [PubMed] [Google Scholar]
- Deffeyes JE, Touvykine B, Quessy S, Dancause N (2015) Interactions between rostral and caudal cortical motor areas in the rat. J Neurophysiol 113:3893–3904. 10.1152/jn.00760.2014 [DOI] [PMC free article] [PubMed] [Google Scholar]
- Dum RP, Strick PL (2002) Motor areas in the frontal lobe of the primate. Physiol Behav 77:677–682. 10.1016/S0031-9384(02)00929-0 [DOI] [PubMed] [Google Scholar]
- Dum RP, Strick PL (2005) Frontal lobe inputs to the digit representations of the motor areas on the lateral surface of the hemisphere. J Neurosci 25:1375–1386. 10.1523/JNEUROSCI.3902-04.2005 [DOI] [PMC free article] [PubMed] [Google Scholar]
- Duque J, Hummel F, Celnik P, Murase N, Mazzocchio R, Cohen LG (2005) Transcallosal inhibition in chronic subcortical stroke. Neuroimage 28:940–946. 10.1016/j.neuroimage.2005.06.033 [DOI] [PubMed] [Google Scholar]
- Fogassi L, Gallese V, Buccino G, Craighero L, Fadiga L, Rizzolatti G (2001) Cortical mechanism for the visual guidance of hand grasping movements in the monkey: A reversible inactivation study. Brain 124:571–586. 10.1093/brain/124.3.571 [DOI] [PubMed] [Google Scholar]
- Ghosh S, Porter R (1988) Corticocortical synaptic influences on morphologically identified pyramidal neurones in the motor cortex of the monkey. J Physiol 400:617–629. 10.1113/jphysiol.1988.sp017139 [DOI] [PMC free article] [PubMed] [Google Scholar]
- Godschalk M, Lemon RN, Kuypers HG, Ronday HK (1984) Cortical afferents and efferents of monkey postarcuate area: an anatomical and electrophysiological study. Exp Brain Res 56:410–424. [DOI] [PubMed] [Google Scholar]
- Grefkes C, Fink GR (2012) Disruption of motor network connectivity post-stroke and its noninvasive neuromodulation. Curr Opin Neurol 25:670–675. 10.1097/WCO.0b013e3283598473 [DOI] [PubMed] [Google Scholar]
- Groppa S, Werner-Petroll N, Münchau A, Deuschl G, Ruschworth MF, Siebner HR (2012a) A novel dual-site transcranial magnetic stimulation paradigm to probe fast facilitatory inputs from ipsilateral dorsal premotor cortex to primary motor cortex. Neuroimage 62:500–509. 10.1016/j.neuroimage.2012.05.023 [DOI] [PubMed] [Google Scholar]
- Groppa S, Schlaak BH, Münchau A, Werner-Petroll N, Dünnweber J, Bäumer T, van Nuenen BF, Siebner HR (2012b) The human dorsal premotor cortex facilitates the excitability of ipsilateral primary motor cortex via a short latency cortico-cortical route. Hum Brain Mapp 33:419–430. 10.1002/hbm.21221 [DOI] [PMC free article] [PubMed] [Google Scholar]
- Hamadjida A, Dea M, Deffeyes J, Quessy S, Dancause N (2016) Parallel cortical networks formed by modular organization of primary motor cortex outputs. Curr Biol 26:1737–1743. 10.1016/j.cub.2016.04.068 [DOI] [PubMed] [Google Scholar]
- He SQ, Dum RP, Strick PL (1993) Topographic organization of corticospinal projections from the frontal lobe: motor areas on the lateral surface of the hemisphere. J Neurosci 13:952–980. [DOI] [PMC free article] [PubMed] [Google Scholar]
- Horenstein C, Lowe MJ, Koenig KA, Phillips MD (2009) Comparison of unilateral and bilateral complex finger tapping-related activation in premotor and primary motor cortex. Hum Brain Mapp 30:1397–1412. 10.1002/hbm.20610 [DOI] [PMC free article] [PubMed] [Google Scholar]
- Kaas JH, Stepniewska I (2016) Evolution of posterior parietal cortex and parietal-frontal networks for specific actions in primates. J Comp Neurol 524:595–608. 10.1002/cne.23838 [DOI] [PMC free article] [PubMed] [Google Scholar]
- Kably B, Drew T (1998) Corticoreticular pathways in the cat. I. Projection patterns and collaterization. J Neurophysiol 80:389–405. [DOI] [PubMed] [Google Scholar]
- Keizer K, Kuypers HG (1989) Distribution of corticospinal neurons with collaterals to the lower brain stem reticular formation in monkey (Macaca fascicularis). Exp Brain Res 74:311–318. [DOI] [PubMed] [Google Scholar]
- Kermadi I, Liu Y, Rouiller EM (2000) Do bimanual motor actions involve the dorsal premotor (PMd), cingulate (CMA) and posterior parietal (PPC) cortices? Comparison with primary and supplementary motor cortical areas. Somatosens Mot Res 17:255–271. 10.1080/08990220050117619 [DOI] [PubMed] [Google Scholar]
- Koch G, Franca M, Del Olmo MF, Cheeran B, Milton R, Alvarez Sauco M, Rothwell JC (2006) Time course of functional connectivity between dorsal premotor and contralateral motor cortex during movement selection. J Neurosci 26:7452–7459. 10.1523/JNEUROSCI.1158-06.2006 [DOI] [PMC free article] [PubMed] [Google Scholar]
- Koch G, Franca M, Mochizuki H, Marconi B, Caltagirone C, Rothwell JC (2007) Interactions between pairs of transcranial magnetic stimuli over the human left dorsal premotor cortex differ from those seen in primary motor cortex. J Physiol 578:551–562. 10.1113/jphysiol.2006.123562 [DOI] [PMC free article] [PubMed] [Google Scholar]
- Kroeger J, Bäumer T, Jonas M, Rothwell JC, Siebner HR, Münchau A (2010) Charting the excitability of premotor to motor connections while withholding or initiating a selected movement. Eur J Neurosci 32:1771–1779. 10.1111/j.1460-9568.2010.07442.x [DOI] [PubMed] [Google Scholar]
- Kurata K. (1993) Premotor cortex of monkeys: set- and movement-related activity reflecting amplitude and direction of wrist movements. J Neurophysiol 69:187–200. [DOI] [PubMed] [Google Scholar]
- Kurata K, Tanji J (1986) Premotor cortex neurons in macaques: activity before distal and proximal forelimb movements. J Neurosci 6:403–411. [DOI] [PMC free article] [PubMed] [Google Scholar]
- Kuypers HG, Lawrence DG (1967) Cortical projections to the red nucleus and the brain stem in the Rhesus monkey. Brain Res 4:151–188. 10.1016/0006-8993(67)90004-2 [DOI] [PubMed] [Google Scholar]
- Lemon RN, Muir RB, Mantel GW (1987) The effects upon the activity of hand and forearm muscles of intracortical stimulation in the vicinity of corticomotor neurones in the conscious monkey. Exp Brain Res 66:621–637. 10.1007/BF00270695 [DOI] [PubMed] [Google Scholar]
- Liuzzi G, Hörniss V, Hoppe J, Heise K, Zimerman M, Gerloff C, Hummel FC (2010) Distinct temporospatial interhemispheric interactions in the human primary and premotor cortex during movement preparation. Cereb Cortex 20:1323–1331. 10.1093/cercor/bhp196 [DOI] [PubMed] [Google Scholar]
- Liuzzi G, Hörniss V, Zimerman M, Gerloff C, Hummel FC (2011) Coordination of uncoupled bimanual movements by strictly timed interhemispheric connectivity. J Neurosci 31:9111–9117. 10.1523/JNEUROSCI.0046-11.2011 [DOI] [PMC free article] [PubMed] [Google Scholar]
- Maier MA, Kirkwood PA, Brochier T, Lemon RN (2013) Responses of single corticospinal neurons to intracortical stimulation of primary motor and premotor cortex in the anesthetized macaque monkey. J Neurophysiol 109:2982–2998. 10.1152/jn.01080.2012 [DOI] [PMC free article] [PubMed] [Google Scholar]
- Matsunami K, Hamada I (1984) Effects of stimulation of corpus callosum on precentral neuron activity in the awake monkey. J Neurophysiol 52:676–691. [DOI] [PubMed] [Google Scholar]
- Meyer-Lindenberg A, Ziemann U, Hajak G, Cohen L, Berman KF (2002) Transitions between dynamical states of differing stability in the human brain. Proc Natl Acad Sci U S A 99:10948–10953. 10.1073/pnas.162114799 [DOI] [PMC free article] [PubMed] [Google Scholar]
- Mochizuki H, Huang YZ, Rothwell JC (2004) Interhemispheric interaction between human dorsal premotor and contralateral primary motor cortex. J Physiol 561:331–338. 10.1113/jphysiol.2004.072843 [DOI] [PMC free article] [PubMed] [Google Scholar]
- Murase N, Duque J, Mazzocchio R, Cohen LG (2004) Influence of interhemispheric interactions on motor function in chronic stroke. Ann Neurol 55:400–409. 10.1002/ana.10848 [DOI] [PubMed] [Google Scholar]
- Nowak DA, Grefkes C, Ameli M, Fink GR (2009) Interhemispheric competition after stroke: brain stimulation to enhance recovery of function of the affected hand. Neurorehabil Neural Repair 23:641–656. 10.1177/1545968309336661 [DOI] [PubMed] [Google Scholar]
- Nudo RJ, Masterton RB (1990) Descending pathways to the spinal cord, III: Sites of origin of the corticospinal tract. J Comp Neurol 296:559–583. 10.1002/cne.902960405 [DOI] [PubMed] [Google Scholar]
- O'Shea J, Sebastian C, Boorman ED, Johansen-Berg H, Rushworth MF (2007) Functional specificity of human premotor-motor cortical interactions during action selection. Eur J Neurosci 26:2085–2095. 10.1111/j.1460-9568.2007.05795.x [DOI] [PubMed] [Google Scholar]
- Prabhu G, Shimazu H, Cerri G, Brochier T, Spinks RL, Maier MA, Lemon RN (2009) Modulation of primary motor cortex outputs from ventral premotor cortex during visually guided grasp in the macaque monkey. J Physiol 587:1057–1069. 10.1113/jphysiol.2008.165571 [DOI] [PMC free article] [PubMed] [Google Scholar]
- Preuss TM, Stepniewska I, Kaas JH (1996) Movement representation in the dorsal and ventral premotor areas of owl monkeys: a microstimulation study. J Comp Neurol 371:649–676. 10.1002/(SICI)1096-9861(19960805)371:4<649::AID-CNE12>3.0.CO;2-E [DOI] [PubMed] [Google Scholar]
- Quessy S, Côté SL, Hamadjida A, Deffeyes J, Dancause N (2016) Modulatory effects of the ipsi and contralateral ventral premotor cortex (PMv) on the primary motor cortex (M1) outputs to intrinsic hand and forearm muscles in Cebus apella. Cereb Cortex 26:3905–3920. 10.1093/cercor/bhw186 [DOI] [PMC free article] [PubMed] [Google Scholar]
- Raos V, Franchi G, Gallese V, Fogassi L (2003) Somatotopic organization of the lateral part of area F2 (dorsal premotor cortex) of the macaque monkey. J Neurophysiol 89:1503–1518. [DOI] [PubMed] [Google Scholar]
- Raos V, Umiltá MA, Gallese V, Fogassi L (2004) Functional properties of grasping-related neurons in the dorsal premotor area F2 of the macaque monkey. J Neurophysiol 92:1990–2002. 10.1152/jn.00154.2004 [DOI] [PubMed] [Google Scholar]
- Riehle A, Requin J (1989) Monkey primary motor and premotor cortex: single-cell activity related to prior information about direction and extent of an intended movement. J Neurophysiol 61:534–549. [DOI] [PubMed] [Google Scholar]
- Rizzolatti G, Luppino G (2001) The cortical motor system. Neuron 31:889–901. 10.1016/S0896-6273(01)00423-8 [DOI] [PubMed] [Google Scholar]
- Sadato N, Campbell G, Ibáñez V, Deiber M, Hallett M (1996) Complexity affects regional cerebral blood flow change during sequential finger movements. J Neurosci 16:2691–2700. [DOI] [PMC free article] [PubMed] [Google Scholar]
- Scott SH, Sergio LE, Kalaska JF (1997) Reaching movements with similar hand paths but different arm orientations. II. Activity of individual cells in dorsal premotor cortex and parietal area 5. J Neurophysiol 78:2413–2426. [DOI] [PubMed] [Google Scholar]
- Shimazu H, Maier MA, Cerri G, Kirkwood PA, Lemon RN (2004) Macaque ventral premotor cortex exerts powerful facilitation of motor cortex outputs to upper limb motoneurons. J Neurosci 24:1200–1211. 10.1523/JNEUROSCI.4731-03.2004 [DOI] [PMC free article] [PubMed] [Google Scholar]
- Silasi G, Murphy TH (2014) Stroke and the connectome: how connectivity guides therapeutic intervention. Neuron 83:1354–1368. 10.1016/j.neuron.2014.08.052 [DOI] [PubMed] [Google Scholar]
- Stoney SD Jr, Thompson WD, Asanuma H (1968) Excitation of pyramidal tract cells by intracortical microstimulation: effective extent of stimulating current. J Neurophysiol 31:659–669. [DOI] [PubMed] [Google Scholar]
- Tanji J, Okano K, Sato KC (1988) Neuronal activity in cortical motor areas related to ipsilateral, contralateral, and bilateral digit movements of the monkey. J Neurophysiol 60:325–343. [DOI] [PubMed] [Google Scholar]
- Tokuno H, Nambu A (2000) Organization of nonprimary motor cortical inputs on pyramidal and nonpyramidal tract neurons of primary motor cortex: An electrophysiological study in the macaque monkey. Cereb Cortex 10:58–68. 10.1093/cercor/10.1.58 [DOI] [PubMed] [Google Scholar]
- Wassermann E, Epstein C, Ziemann U, Walsh V, Paus T, Lisanby S (2008) Oxford handbook of transcranial stimulation. Oxford: OUP. [Google Scholar]
- Wise SP. (1985) The primate premotor cortex: past, present, and preparatory. Annu Rev Neurosci 8:1–19. [DOI] [PubMed] [Google Scholar]
- Wise SP. (2006) The ventral premotor cortex, corticospinal region C, and the origin of primates. Cortex 42:521–524. 10.1016/S0010-9452(08)70391-5 [DOI] [PubMed] [Google Scholar]