

Abstract
Auditory and sensorimotor brain areas interact during the action–perception cycle of sound making. Neurophysiological evidence of a feedforward model of the action and its outcome has been associated with attenuation of the N1 wave of auditory evoked responses elicited by self-generated sounds, such as talking and singing or playing a musical instrument. Moreover, neural oscillations at β-band frequencies have been related to predicting the sound outcome after action initiation. We hypothesized that a newly learned action–perception association would immediately modify interpretation of the sound during subsequent listening. Nineteen healthy young adults (7 female, 12 male) participated in three magnetoencephalographic recordings while first passively listening to recorded sounds of a bell ringing, then actively striking the bell with a mallet, and then again listening to recorded sounds. Auditory cortex activity showed characteristic P1–N1–P2 waves. The N1 was attenuated during sound making, while P2 responses were unchanged. In contrast, P2 became larger when listening after sound making compared with the initial naive listening. The P2 increase occurred immediately, while in previous learning-by-listening studies P2 increases occurred on a later day. Also, reactivity of β-band oscillations, as well as θ coherence between auditory and sensorimotor cortices, was stronger in the second listening block. These changes were significantly larger than those observed in control participants (eight female, five male), who triggered recorded sounds by a key press. We propose that P2 characterizes familiarity with sound objects, whereas β-band oscillation signifies involvement of the action–perception cycle, and both measures objectively indicate functional neuroplasticity in auditory perceptual learning.
SIGNIFICANCE STATEMENT While suppression of auditory responses to self-generated sounds is well known, it is not clear whether the learned action–sound association modifies subsequent perception. Our study demonstrated the immediate effects of sound-making experience on perception using magnetoencephalographic recordings, as reflected in the increased auditory evoked P2 wave, increased responsiveness of β oscillations, and enhanced connectivity between auditory and sensorimotor cortices. The importance of motor learning was underscored as the changes were much smaller in a control group using a key press to generate the sounds instead of learning to play the musical instrument. The results support the rapid integration of a feedforward model during perception and provide a neurophysiological basis for the application of music making in motor rehabilitation training.
Keywords: action–perception association, auditory evoked responses, β oscillation, learning-induced plasticity, magnetoencephalography, N1 suppression
Introduction
Brain systems underlying auditory perception are closely interconnected with sensorimotor systems for sound-making actions, which has been shown for speech (Hickok et al., 2011) and music (Zatorre et al., 2007). Magnetoencephalographic recordings showed that learning to play music modified auditory brain responses and involved sensorimotor activity when pianists listened to well practiced repertoires (Haueisen and Knösche, 2001). After novices underwent a brief course of piano training, their EEGs showed increases in sustained activity (Bangert and Altenmüller, 2003) and suppressed μ rhythms (Wu et al., 2016). Findings that premotor cortex activation in fMRI was specific to learned melodies (Lahav et al., 2007) and was more strongly expressed in experts (Baumann et al., 2007) were interpreted as being indicative of auditory–motor associations, which developed during sound-making experiences (Rizzolatti and Craighero, 2004). To have observed these effects, it seems essential that adults were actively engaged when they learned about the nature of the sound. Accordingly, auditory mismatch negativity responses, indicating automatic encoding of sound, were larger in an active task, compared with passive listening, and induced immediate neuroplastic changes (Seppänen et al., 2013). Actively playing an instrument had a stronger effect on the encoding of melodic patterns than a training program that involved solely a listening experience (Lappe et al., 2008). These findings point to the importance of the action–perception cycle for memory of the sound. Only recently, researchers considered that motor-action representation coexists and dynamically interacts with perception (Maes et al., 2014), moving away from the concept of strictly unidirectional processing leading from sensation, to perception, and then to cognition that ultimately leads to action.
Here, we targeted auditory evoked responses and brain oscillations to reveal neuroplastic changes in perception after learning a new association between an action and its sound outcome. We made magnetoencephalographic (MEG) recordings while participants first passively listened to the recorded sounds of an unfamiliar musical instrument, then actively made the sounds themselves, and then again listened to the recorded sounds. We expected suppression of the auditory evoked N1 responses during one's own action, as previously reported for speech vocalization (Aliu et al., 2009) or key press-initiated sounds (Martikainen et al., 2005; Bäss et al., 2008), providing neurophysiological evidence of feedforward processing. We analyzed the effects of learning on auditory evoked P2 responses, elicited 200 ms after the sound onset, as well as modulations of 15–25 Hz β oscillations in the same time interval. In perceptual learning studies, the P2 wave of auditory EEG and MEG responses showed neuroplastic amplitude increases (Reinke et al., 2003; Tong et al., 2009; Alain et al., 2010; Kujala and Näätänen, 2010; Tremblay et al., 2014), which became evident after a delay of 1 d following auditory discrimination training (Atienza et al., 2002) or sound experience (Sheehan et al., 2005; Ross and Tremblay, 2009). Recently it has been found that a night of sleep, and not the passage of time, manifested the P2 increase (Alain et al., 2015), suggesting that the P2 increase may be related to the consolidation of new network connections during sleep. However, if the association between an action and its sound outcome is established instantaneously (Kiefer et al., 2011), brain responses may change immediately.
Another candidate of neural correlates for action–perception representation is event-related modulation of β rhythms, predominantly present in sensorimotor systems, indicating an active status of sensorimotor function (Salmelin et al., 1995; Pfurtscheller and Lopes da Silva, 1999) before and during movement (Cheyne, 2013), movement imagery (Kraeutner et al., 2014), and action observation (Avanzini et al., 2012). In addition, we and others demonstrated the role of β oscillations for temporal prediction of sensory information. The time course of β oscillations reflects anticipation of rhythmic sounds (Fujioka et al., 2012) and subjectively imagined grouping of sounds (Fujioka et al., 2015), in line with additional findings that indicate that β oscillations are related to actively predicting a future time point (Saleh et al., 2010; Arnal et al., 2015). Thus, modulation of β oscillations would also reflect the prediction of the sound outcome, once the action–perception cycle has been initiated.
Materials and Methods
Participants.
Thirty-two university students (15 female, 17 male; mean age, 22.7 years; 95% CI = [21.2, 23.4]) participated in the study, with 19 in the main experiment and 13 in control conditions. All reported being healthy, free of medication, and without a history of neurological or psychiatric disorders. Normal hearing was assessed with pure tone audiometry at octave frequencies between 250 and 8000 Hz for both ears using a clinical audiometer (GSI61, Grason Stadler) and ER-3A sound transducers (Etymotic Research) connected to the participants' ears with 20 cm plastic tubing and foam ear pieces. Twenty-nine participants were right-handed; three were left-handed. All provided written consent for participation after receiving written and verbal information about the nature of the study. The study protocol was approved by the Research Ethics Board at Baycrest Centre. Participants received an honorarium after completing the study.
Experimental design.
MEG recordings were made while participants listened to bell-like sounds from a Tibetan singing bowl 80 mm in diameter. Sounds were made by striking the singing bowl on the rim with a wooden mallet (Fig. 1A). Ninety stimuli were presented in an experimental block of ∼6 min duration. After four blocks of passively listening to the recorded sounds, the real singing bowl was introduced to the participants and they were asked to spontaneously produce sounds of approximately equal intensity at similar time intervals to those in the previous listening blocks. After ∼10 practice trials, MEG recordings were made in five blocks of 6 min each. The active sound-making part was followed by four blocks of passive listening in the same fashion as the initial listening phase. The total duration of the experimental procedure was close to 90 min (Fig. 1B). A group of 12 participants performed a control experiment with the same listening conditions. However, during the active period, they initiated the presentation of a recorded sound by pressing a key on a keypad instead of producing the sound by striking the singing bowl with the mallet. Outcome measures of the main experiment and the control condition were auditory evoked responses and changes in oscillatory activity during the listening intervals. Brain responses, recorded during the active periods, were analyzed and discussed with respect to the hypothesis of an association between the action of sound making and perception of the acoustical outcome.
Figure 1.
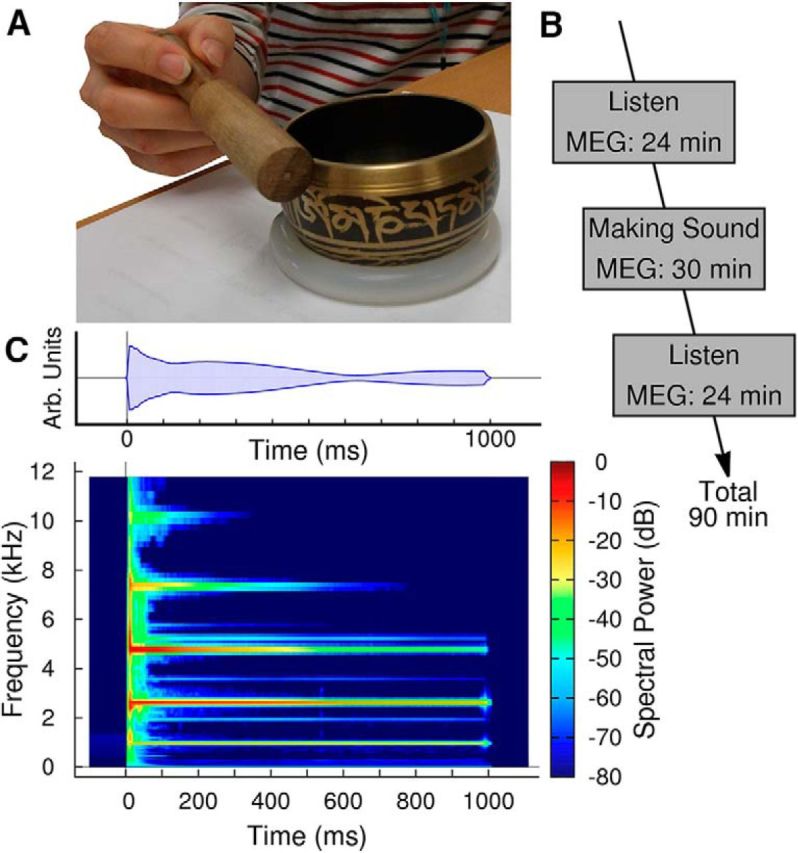
Experimental design and stimulation. A, Sounds were made by striking a Tibetan singing bowl with a wooden mallet. B, The experimental design consisted of three periods of MEG recording: first listening passively to recorded sounds, then making sounds, and then again passive listening. C, The spectrogram of the sound shows multiple modal frequencies. Interaction between spectral components results in a beating sound, which can be observed in the modulation of the amplitude (top). The recorded sounds were truncated at 1000 ms with a 25 ms cosine slope.
Additionally, in a single participant, possible interactions between movement-related magnetic fields and auditory evoked responses were assessed with a sequence of recordings for the following: (1) listening to the stimuli, (2) making the sounds, (3) performing sound-making movement without hearing the sound, (4) initiating the sound with key presses, and (5) performing key presses without a sound. For movement without sound, the singing bowl was filled with sand to dampen its sound, and white noise was presented to the participant at 50 dB sensation level using foam ear pieces for further sound insulation.
Sound stimuli.
Striking the singing bowl with the mallet produced a sharp sound onset and sustained decay (Fig. 1C). A spectrogram of the sound revealed multiple modal frequencies, each decaying with different time constants. Prominent modal frequencies were 972, 2625, 4780, 7340, and 10,260 Hz. Interactions among modal frequencies resulted in a characteristic beating sound, which is expressed as a slow modulation of the sound amplitude (Fig. 1B). Sounds were recorded in a sound-proof anechoic chamber. Twenty of these sounds, varying in their peak amplitude by <±6 dB, were selected as stimuli for the MEG study. The durations of the stimuli were truncated to 1000 ms using a 25 ms cosine profile. The stimuli were presented in random order with the onset-to-onset interval uniformly randomized between 3500 and 4500 ms.
The actively produced sounds were recorded with an MEG-compatible microphone (Optimic, Optoacoustics), and the sound envelope was simultaneously sampled with the MEG. The time point of sound onset (i.e., when the mallet hit the singing bowl) defined time 0 for data analysis. Stimulus timing during the listening intervals was controlled by Presentation software (Neurobehavioural Systems). Sound intensities were set with the audiometer to 60 dB above individual sensation threshold. Sounds were presented through ER-3A audiometric sound transducers connected to the participants' ears via 2.5 m of plastic tubing and foam inserts. The time delay of 8 ms, caused by the sound traveling through the tubes, was considered during data analysis. The foam inserts were temporally removed during the sound-making phase of the experiment.
Data acquisition and analysis.
MEG acquisition was performed in a silent, magnetically shielded room using a 151-channel whole-head MEG system (CTF MEG) at the Rotman Research Institute in Toronto. The detection coils of this MEG device are equally spaced on the helmet-shaped surface and are configured as first-order axial gradiometers (Vrba and Robinson, 2001). After low-pass filtering at 200 Hz, the magnetic field data were sampled at the rate of 625 Hz and stored continuously. Participants were seated comfortably in an upright position with the head resting inside the helmet-shaped MEG device. The head position was registered at the beginning and end of each recording block using three detection coils attached to the participant's nasion and the preauricular points. During each block, participants were instructed to maintain their head position as best as possible. For three participants, the recording of one block was repeated because head movements exceeded the threshold of ±4 mm. This procedure ensured that head movements did not significantly affect the source localization accuracy.
MEG data were parsed into epochs beginning 2500 ms before stimulus onset and extending to 1500 ms after stimulus onset. Principal component (PC) analysis was applied to each epoch and PCs >2.5 pico Tesla (pT) in any channel at any time were subtracted from the data. This procedure effectively removed artifacts caused by eye blinks and head movements (Kobayashi and Kuriki, 1999). Data were averaged across all epochs in each block and the offset was adjusted according to the mean of the 500 ms time interval before stimulus onset. While the number of epochs in each listening block was n = 90, the number varied between n = 75 and n = 130 during sound making, depending on the individual timing of the voluntary actions.
Dipole modeling.
Single dipoles in both hemispheres were fitted simultaneously to the 151-channel magnetic field distribution after averaging across trials within each listening block. First, the data in the time interval of ±15 ms around the peak of the N1 response with ∼100 ms latency were modeled with a mirror-symmetric pair of dipoles in bilateral temporal areas. The resulting source coordinates were used as the initial points for fitting the dipole in one hemisphere while the coordinates in the other hemisphere were kept fixed. This last step was repeated, switching between hemispheres each time, until the source coordinates showed no further variation. Dipole fits were accepted if the calculated field explained ≥90% of the variance of the measured magnetic field and if the SD obtained from repeated measurements was <8 mm in any Cartesian coordinate. Eight estimates for the dipole locations were obtained for each participant from the repeated blocks. Individual source models were constructed from the median auditory cortex coordinates and the orientation fitted to the individual data. The location of the motor source was estimated by fitting a single equivalent current dipole to the magnetic field above the left central areas, contralateral to the active right hand, using the time interval of ±10 ms around the maximum of the motor response at 18 ms latency with respect to the sound onset. Formally, the location of an ipsilateral source was assumed mirror symmetric to the left motor dipole. Based on these resultant two pairs of auditory and sensorimotor dipole models, source waveforms were calculated for each block. This procedure of source space projection (Tesche et al., 1995; Ross et al., 2000; Teale et al., 2013) combined the 151-channel magnetic field data into four waveforms of cortical source strength, measured in nano Ampere-meter (nAm). The position of the MEG sensor relative to the participant's head may change between sessions and between participants. This may cause spatial dispersion in group-averaged magnetic field waveforms. In contrast, the waveforms of cortical source activity are independent of individual head position.
Statistical analysis.
We used a multivariate approach to compare the time series of averaged evoked responses in left and right auditory sources during the listening sessions before and after sound making. The n = 76 time series from 19 participants under two conditions and two source locations, containing 850 samples in the time interval from −200 to 1200 ms, were stacked into a 76 × 850 data matrix. A singular-value decomposition applied to this matrix resulted in time series of PCs and factor loads, indicating how the individual averages contributed to each PC. Two-way repeated-measures ANOVAs with the factors hemisphere (left, right) and blocks (pre, post) were applied to the set of factor loads. This step of data analysis provided a hypothesis-free, data-driven test for response differences across listening blocks.
To study how changes in the auditory evoked responses developed over the time course of the experiment, we separately averaged the first 25% of trials and the last 25% of trials of the two listening blocks. P1, N1, and P2 peak amplitudes were measured and compared across the four time points using a two-way repeated-measures ANOVA with the factors block (pre, post) and temporal order (beginning, end).
Time–frequency analysis.
Time–frequency analysis was applied to each epoch of source activities using a complex Morlet wavelet transform. Wavelets were constructed at 100 frequency bins, logarithmically spaced between 2 and 120 Hz with half-intensity full-width of two cycles at 2 Hz and six cycles at 120 Hz. Signal power was calculated as the product of each wavelet coefficient with its complex conjugate and averaged across all epochs. Mean power was normalized according to the mean power in the 500 ms baseline interval immediately before stimulus onset for the listening blocks or a 500 ms baseline interval ending 2500 ms before movement as indicated by the sound onset for the sound-making blocks. Time–frequency maps of event-related desynchronization and synchronization (ERD/ERS) were constructed from the logarithm of the power ratio. The ERD/ERS maps were compared between listening blocks using a permutation test (Maris et al., 2007).
Connectivity analysis.
Connectivity between auditory and sensorimotor cortices and its changes over the time course of the experiment were analyzed by calculating the weighted phase-lagging index (wPLI) for each wavelet coefficient (Vinck et al., 2011). The wPLI method is a statistical test on the imaginary part of coherence between a pair of signals. While the real part of coherence might be affected by cross talk from incomplete spatial separation of sources, the imaginary part of coherence is discussed as indicating a time delay, reflecting the conduction delay of true neural interaction (Nolte et al., 2004). wPLI was calculated for all six pairwise combinations of the four cortical sources in the prelistening and postlistening sessions. The wPLI values were compared with the maximum wPLI, observed in 1000 repetitions of surrogate data. Surrogate data were generated by adding a random phase delay to all trials and replicating the analysis as performed with the original data. All analyses were performed with customized Matlab programs.
Results
Dipole source analysis
Magnetic field maps of the averaged responses showed dipolar patterns, which justified dipole modeling. The N1 response, recorded during passive listening, showed two dipolar patterns above bilateral temporal areas at a latency of 98 ms (Fig. 2A). During sound making, the motor response at an 18 ms latency after the sound onset showed a single dipolar pattern above the left central brain, contralateral to the right hand (Fig. 2B). Dipole modeling was successful in all individuals. Grand mean source locations, transformed to the MNI coordinate system, were as follows: −54.8, −17.8, and 7.35 for the left auditory cortex; 50.1, −8.93, and 7.54 for the right auditory cortex; and −36.7, −15.0, and 58.4 for the left sensorimotor cortex. The 95% CI for each of the group mean coordinates was <±5 mm in any direction. Group mean source locations and their 95% CI were overlaid on the ICBM-152 template brain (Mazziotta et al., 2001; Fig. 2C).
Figure 2.

Magnetic field maps and dipole locations. A, The topographic map, obtained from an individual participant at the peak latency of the auditory evoked N1 response in passive listening, shows dipolar patterns of bilateral auditory cortex sources. B, The magnetic field of the motor response during sound making shows a single dipolar pattern contralateral to the right hand. C, Group mean of auditory and motor dipole locations and their 95% confidence ranges are overlaid on coronal and axial MRI images of the ICBM-152 brain template. The red dot in the right hemisphere indicates the location of a mirror symmetric motor source.
Auditory and motor evoked responses
Listening to the sound stimuli elicited clearly pronounced P1, N1, and P2 responses, while those responses were smaller during sound making, as illustrated for a single control participant in Figure 3A. The same individual performed the sound-making action without hearing the sound; corresponding motor responses are shown in the top panel of Figure 3A. In this case, the motor response during movement alone was stronger than during sound making, likely because the person hit the singing bowl harder than when receiving auditory feedback. Nonetheless, the accompanying auditory cortex activity was small compared with the sound evoked response. In principle, the observed response, using the auditory cortex model, could result from superimposition of auditory cortex activity and spurious contribution from motor areas. One could estimate the motor contribution from the activity observed during sole movement. Subtracting the estimate of motor activity from the response during sound making changed the response amplitudes only slightly, which demonstrated a good separation between auditory and motor sources in MEG. Therefore, we chose to use the uncorrected responses during sound making for the further analyses in the main experiment. Figure 3B illustrates the relations between auditory and motor responses in the case of initiating the sound stimulus by a button press on a keypad instead of using the actual musical instrument (i.e., striking the singing bowl with the mallet). In the active condition in this single case, P1 was suppressed by similar amount than for the real movement, though N1 suppression was clearly less expressed. Again, the movement for pressing the key without sound had little impact on the auditory activity measure.
Figure 3.

Time series of left hemispheric responses during sound making, movement without sound, and passive listening in an individual participant. A, Motor (top) and auditory (bottom) responses using the singing bowl and a mallet. The thin red line illustrates the response during sound making, corrected for the effect of movement by subtracting the activity from the movement-only condition. B, Cortical responses related to pressing a key for initiating the sound stimuli. Note that the tone occurred 150 ms after the key press. Time 0 in all panels relates to the acoustic sound onset.
Attenuation of the auditory evoked response during sound making
Grand averaged auditory responses during self-initiated sound making were characterized by a triphasic auditory evoked P1–N1–P2 wave, overlaid on a slow negative shift (Fig. 4A). The long-lasting shift can be explained as the sustained negativity elicited by the slowly decaying sound. While the recorded sounds were truncated to a 1.0 s duration and therefore elicited sustained responses for only a 1.0 s interval, the actively made sound continued for a longer time, and subsequent sounds were often made before the previous sound had faded away completely. Therefore, the prestimulus activity in Figure 4A should be interpreted as a continuation of the sustained poststimulus wave. While the sustained response and positive P1 and P2 waves during sound making were similar to those during passive listening, the N1 wave was strongly suppressed. A repeated-measures ANOVA revealed an effect of conditions (F(1,18) = 81.7, p < 0.0001) and hemispheres (F(1,18) = 4.97, p = 0.039) because of smaller N1 amplitudes in the active condition and larger N1 amplitudes in the right hemisphere during listening (t(18) = 2.12, p = 0.041) and sound making (t(18) = 2.44, p = 0.025).
Figure 4.

Grand averaged evoked responses in left and right auditory and sensorimotor cortices during listening before (blue) and during (red) sound making. A, Experimental group, making the sound by striking the singing bowl with a mallet (arrow). B, Control group, initiating the sound presentation with a key press (arrow).
N1 suppression was expressed to a lesser degree in the control group, whose members initiated the sound by pressing a key (Fig. 4B). The ANOVA revealed an effect of conditions (F(1,11) = 7.42, p = 0.02) because in the active condition, N1 was attenuated in both the left (t(11) = 4.90, p = 0.0005) and right (t(11) = 2.75, p = 0.019) hemispheres, and an effect of hemispheres (F(1,11) = 8.48, p = 0.14), because of larger responses in the right hemisphere (t(11) = 3.99, p = 0.002).
The mixed-design ANOVA for between-group comparison of the N1 amplitudes and within-group factors of conditions and hemispheres revealed an effect of groups (F(1,29) = 5.56, p = 0.025) because of slightly larger responses in the control group (t(113) = 3.32, p = 0.0012). The effects of experimental conditions (F(1,29) = 87.2, p < 0.0001) and hemispheres (F(1,29) = 11.3, p = 0.0022) prevailed. Most importantly, a group × conditions interaction was significant (F(1,29) = 26.5, p < 0.0001) because a strong suppression of N1 occurred during sound making with the actual instrument, while the N1 suppression by key press was weaker. However, two-sample t tests were not significant in comparison with the N1 response elicited by key press-initiated sounds and passive listening responses.
Modification of the auditory evoked response in passive listening after sound making
A closer look at the grand averaged responses during passive listening before and after sound making showed that the responses were the same for the early P1 wave and for large portions of the sustained response, though differences between blocks occurred in the N1–P2 latency range (Fig. 5A). The sets of individual averaged responses were decomposed into PCs for multivariate analysis of the between-block differences in the left and right hemispheres. The aim of this analysis was to reveal differences between conditions with a hypothesis-free, entirely data-driven method. This approach is particularly advantageous when temporally overlapping components may contribute to the condition differences at separate time periods, since conventional peak amplitude measures cannot fully capture such characteristics. The first PC explained 71.6% of the variance and explained the characteristics of response waveforms, which were common to both listening conditions and brain hemispheres (Fig. 5B). The ANOVA for the factor load of the first PC revealed no main effects or interactions.
Figure 5.

Auditory evoked responses during passive listening. A, Grand averaged waveforms before and after the sound-making interval show an increase in the P2 wave in the second block compared with naive listening in the first block. B, First two PCs of the auditory evoked responses. C, Group mean factor loads of the responses in left and right auditory cortices, before and after sound making. Error bars indicate 95% CIs for the mean.
The time course of the second PC, which explained 12.5% of the variance, showed two predominant positive peaks at 100 and 200 ms latency (Fig. 5B), likely reflecting the positive shift at N1 and P2 latencies in the second block compared with the first one (Fig. 5A). The ANOVA applied to the factor loads of the second PC revealed main effects of the factors hemispheres (F(1,18) = 12.6, p = 0.023) and conditions (F(1,18) = 15.8, p = 0.0009), and there was no interaction between the two factors (F(1,18) = 0.3). The size of the second PC was larger in the left than the right for both the first (t(18) = 3.1, p = 0.0065) and the second (t(18) = 3.8, p = 0.0014) listening periods, and was larger during the second period in both the right (t(18) = 2.8, p = 0.01) and left (t(18) = 4.4, p < 0.0001) hemispheres. Results of the pairwise comparisons are visualized in Figure 5C. The most important result of this analysis was that auditory evoked responses during passive listening after the sound-making period were different from those observed during the first period of naive listening. Differences were prominent at N1 and P2 latencies.
N1 and P2 changes over the time course of the experiment
To test whether the dynamics of N1 and P2 changed over the time course of MEG recordings, we analyzed the evoked responses separately at the beginning and end of each listening period. The beginning was defined as the first 25% of trials in the first listening block of 6 min and the end as the last 25% of trials in the last listening block. These responses were calculated for both listening periods before and after sound making and were averaged across hemispheres and participants (Fig. 6A). N1 peak amplitudes decreased within each listening period, as indicated by the upward pointing black arrows a and b in Figure 6A, and were of almost identical amplitudes at the end of the prelistening and postlistening periods. In contrast, P2 amplitude changes within each period were small compared with the difference in P2 between periods, indicated by the red arrow c in Figure 6A. For quantitative analysis, the individual N1 and P2 peak amplitudes were measured for each beginning and end sub-block. A two-way repeated-measures ANOVA for the N1 peak amplitudes revealed an effect of conditions (F(1,18) = 9.89, p = 0.0056), an effect of position within the listening conditions (F(1,18) = 11.8, p = 0.0030), and a tendency for an interaction between both factors (F(1,18) = 4.40, p = 0.051). N1 amplitude decreased between the beginning and end of the first listening period (t(18) = 3.52, p = 0.0028), but the corresponding decrease within the second period was less strongly expressed (t(18) = 2.01, p = 0.060, not significant). While N1 differed at the beginning of each period (t(18) = 3.16, p = 0.006), N1 amplitudes at the end of the first and second periods were not significantly different (t(18) = 0.52, p = 0.6, not significant). Corresponding analysis of the P2 amplitude revealed an effect of conditions (F(1,18) = 13.4, p = 0.0018), but it revealed no effect of within-blocks differences and no interaction between both factors (F < 1 for both). P2 increased between listening periods but was of constant amplitude within each period. Specifically, this means that the P2 increase was already evident between the ending of the first passive listening block and the beginning of the second block (t(18) = 2.24, p = 0.038). No differences within and between blocks were observed for the P1 amplitude.
Figure 6.

Development of responses over the time course of the experiment. A, Responses during listening periods before and after sound making, averaged across left and right hemispheres. Thin lines show responses at the beginning of the first recording block, thick lines at the end of the last recording block before (blue) and after (red) actively making sound. Black arrows indicate changes within the listening period, and the red arrow indicates changes between periods. N1 amplitudes decreased between the beginning and end of each listening period but were of similar size at the end of both periods. In contrast, P2 amplitudes increased between prelistening and postlistening periods but not within each period. B, Development of left and right auditory cortex responses during sound making over the time course of five blocks of 6 min each.
A mixed-design ANOVA, comparing the P2 amplitude between the experimental group and the control group with the within-subject factors hemisphere and listening periods, revealed no effect of groups (F(1,29) = 0.18, p = 0.68), but an effect of hemisphere (F(1,29) = 21.7, p < 0.0001), and an effect of listening periods (F(1,29) = 10.2, p = 0.0033), as well as a group × listening periods interaction (F(1,29) = 4.55, p = 0.042). P2 amplitudes were larger in the left auditory cortex in the experimental group (t(37) = 4.0, p = 0.0003) and also in the control group (t(23) = 5.24, p < 0.0001). P2 amplitudes were larger during listening after sound making in the experimental group (t(37) = 4.01, p = 0.0003) but not in the control group (t(23) = 1.67, p = 0.11).
Following up on the finding that the P2 amplitude increase was evident between the end of the first listening period and the beginning of the second listening period, we studied how the response waveforms changed over the time course of sound making. We separately averaged the responses in the five recording blocks of 6 min each (Fig. 6B). Generally, the response waveforms shifted toward more positive values between subsequent blocks. N1 changes were small, which specifically means that the N1 suppression was established immediately and did not develop further over time. In contrast, the P2 increase between the first and last block during the active sound-making period was significant in both the right hemisphere (t(18) = 2.35, p = 0.03) and the left hemisphere (t(18) = 4.07, p = 0.0007).
Modification of event-related β oscillations
The grand averaged time–frequency map of event-related changes in oscillatory signal power in the left sensorimotor cortex during sound-making action using the right hand demonstrates predominant changes at β frequencies (Fig. 7A). In preparation for voluntary movement, β activity began to decrease ∼1 s before the movement, reached its strongest effect size of ∼50% decrease at and immediately after the movement, and increased above baseline magnitude during the rebound interval. β Changes were accompanied by an α decrease of similar time course, but without a rebound above baseline level, and a high γ burst during the movement.
Figure 7.

Time–frequency maps of event-related signal power changes. A, Predominant α and β ERD in left sensorimotor cortex during preparation for right-hand movement and thereafter. B, ERD/ERS in the right auditory cortex before and after sound making. C, Time courses of group mean β ERD/ERS in the frequency band of 16–18 Hz, showing significant increase in β ERD. D, Permutation test for the differences between ERD/ERS maps in B revealed significances for β oscillations 200–300 ms after sound onset. E, Spectral power in the baseline interval preceding the stimulus in the passive listening conditions. Thick lines denote time intervals of significant differences between presound-making and postsound-making conditions at α = 0.01.
The spectral dynamics of auditory cortex activity during passive listening were predominantly characterized by α and β ERD after stimulus onset as shown for the right auditory cortex in Figure 7B. Specifically, β ERD was more strongly expressed in the second listening period. The time courses of β ERD/ERS in the frequency range of 16 to 18 Hz showed ERD troughs in the 200–300 ms latency range (Fig. 7C). β ERD was stronger during listening after sound making than before (t(18) = 6.53, p < 0.0001). Comparing the time–frequency representations using a permutation test revealed significant differences across participants at lower β frequencies (16–18 Hz) centered around 300 ms latency (Fig. 7D). When listening after sound making, spectral power in the baseline interval was larger than before at α and β frequencies in the right hemisphere (Fig. 7E). Baseline activities in the left auditory cortex, as well as α and β ERD, were not significantly different between listening conditions.
The spectral dynamics of sensorimotor cortices during passive listening showed β ERD followed by a rebound above baseline level in addition to α ERD and θ ERS as shown for the left hemisphere in Figure 8A. Time courses of β ERD/ERS after sound making showed an ERD peak at a similar latency to those in the auditory cortex, which was not expressed before sound making (Fig. 8B). A permutation test, comparing the time–frequency maps before and after sound making revealed significant differences in the β frequency range between 18 and 26 Hz at ∼300 ms latency (Fig. 8C). Modulation of β oscillations during listening was less strongly expressed in the right sensorimotor cortex, and no consistent differences between conditions were found. The same permutation test did not reveal differences between the listening intervals in the control group.
Figure 8.

Event-related power changes in left sensorimotor cortex. A, Grand averaged time–frequency maps of ERD/ERS during passive listening before and after the active task. B, Grand averaged time series of β (15–25 Hz) changes, showing β decrease in the second listening block. C, P values from a permutation test show significant differences between both time–frequency maps in the β range ∼300 ms after sound onset.
Connectivity measures
Connectivity between cortical sources was measured with the wPLI for all coefficients of the time–frequency representations. The wPLI measure was strongest and most consistent across participants in the θ frequency range at 6.0 Hz and at the 50–350 ms latency interval. Group mean values of wPLI in this time and frequency range for the two listening blocks are shown in Figure 9 together with error bars denoting the 95% confidence limits for the group means, as well as the maximum wPLI observed from surrogate data. Significant increases were found for the connectivity between the left sensorimotor cortex and both the left auditory cortex (t(18) = 2.41, p = 0.027) and the right auditory cortex (t(18) = 2.71, p = 0.014).
Figure 9.

Connectivity between auditory and sensorimotor sources as indexed by the wPLI applied to poststimulus θ activity in listening presound making and postsound making. Error bars indicate the 95% confidence limits for the group means. Dashed lines indicate the maximum level of wPLI observed in 1000 repetitions of surrogate data. Connectivity between left sensorimotor cortex and bilateral auditory cortices was increased during the second passive listening block.
Discussion
The main experimental findings were as follows: (1) the N1 wave of auditory evoked responses was attenuated when sound was made by the participant, compared with passively listening to recorded versions of similar sounds; (2) the P2 wave was larger during listening after the sound-making period than before; (3) event-related modulation of β oscillation was more pronounced after sound making; and (4) θ frequency connectivity measures between bilateral auditory cortices and the left sensorimotor cortex were strengthened after sound making using the right hand. Moreover, N1 suppression and P2 increase were larger when making sounds with a real instrument than in a control condition of initiating sound presentation by a key press. We will discuss the findings in the context of modified brain processes underlying perception after learning a new association between a sound and the action for making that sound.
Brain activity during active sound making
While our primary aim was to compare brain activity during the passive listening periods, brain responses recorded during sound making gave insights into the association between action and its perceived outcome. The predominant effect was an attenuation of the N1 response, which is commonly interpreted as indicating suppression of sensory input for self-initiated sounds (Bäss et al., 2008). However, the part of sensory processing that becomes suppressed must be discussed, because we hear and perceive self-made sounds as well as externally initiated sounds. Thus, behavioral performance seems little affected. For example, in a loudness matching study, sounds generated by oneself or others were found equally as loud as externally generated sounds (Sato, 2008). Also, in our study, P1, P2, and the sustained response were not attenuated compared with passive listening, suggesting that the N1 attenuation is related to the motor action in a special manner, while maintaining normal perception of acoustic features of sounds. The functional roles of the N1 response have been described as generally signaling an acoustic change or triggering attention (Näätänen and Picton, 1987) and being related to updating a sensory memory. The latter role is supported by the strong modulation of the N1 response when changing the stimulus repetition rate (Näätänen and Winkler, 1999). N1 response is largest for long interstimulus intervals, beyond the time constant of sensory memory of ≤15 s (Hari et al., 1987), because the memory has to be fully established for each sound. A shorter interstimulus interval requires only partial refresh of the memory, causing a smaller N1 response. The role of N1 for updating a short-term memory is compatible with the two-stage theory of goal-directed action (Elsner and Hommel, 2001). According to this theory, first an internal memory for the intended sound outcome is generated and, in a second step, a motor program that has been previously associated with the sound is executed almost automatically. We speculate that a short-term memory, the same as or similar to the one normally used for perception, is updated with the forward model copy of the sound to be performed. Thus, listening during sound making requires only partial updating for matching between the forward model and the sound outcome. Recent reports that N1 was more suppressed when the sound outcome was congruent with the intended sound than in the case of incongruency, which requires memory updating (Horváth et al., 2012; Hughes et al., 2013), are compatible with the concept that the size of the N1 response reflects updating of sensory memory. This view is further in line with temporal orienting, where N1 is attenuated when the sound occurs in the expected timing interval (Lange, 2013). The alternative hypothesis proposes that the motor system generates an internal representation of the sound outcome, the efferent copy (Flanders, 2011), which modulates the N1 response depending on congruency with the actual feedback (Houde et al., 2002). However, Timm et al. (2014) demonstrated that association between a motor program and a sound is not sufficient for the observed response suppression. In their study, N1 suppression was not observed when the key press movement was initiated by a transcranial magnetic stimulation pulse to the contralateral motor cortex, though voluntary sound initiation attenuated the auditory response. Moreover, experimental evidence has been provided that suppression of the N1 depends on the intention for sound making (SanMiguel et al., 2013) and goal-oriented action (Poonian et al., 2015).
Participants in our study produced sounds at a variable rate and intensity. Both parameters affected the N1 amplitude, but it is unlikely that the attenuation of the N1 response was solely an effect of stimulus loudness and rate volatility. In our control condition, the sound onset occurred 150 ms after the button press. However, it has been shown that N1 suppression occurred even if the sound was delayed by hundreds of milliseconds (Horváth et al., 2012), suggesting that our control condition was valid. Importantly, the N1 suppression during action with the real instrument was approximately five times stronger than in control participants who initiated the sound with a key press. The latter showed N1 attenuation with a similar magnitude as reported in previous studies that used the action of pressing a key on a computer keyboard for generating the sound (Bäss et al., 2008). Such an action is rather generic and requires only additional mapping between the key and a sound outcome. Moreover, each button press initiates the same prerecorded sound and therefore does not require monitoring. This is very different from playing a real musical instrument or talking, which requires learning specific fine movements for making the sound, and, if necessary, readjustment of the motor plan. Such monitoring of motor planning and outcome has been also associated with suppression of premotor cortex activities (Roy et al., 2016). Thus, the observed N1 suppression can be interpreted as indicating the newly learned association between the sound and the action for making the sound.
Learning-related changes of N1 and P2 during passive listening
The N1 amplitude decreased over the time course of ∼20 min of passive listening, but it recovered partially during the short break between blocks. Similarly, in a previous study, N1 amplitudes decreased steadily within a 5 min recording block and across repeated blocks within a recording session, but it recovered completely between sessions and showed the same amplitudes during recordings on subsequent days (Ross and Tremblay, 2009). Although mean N1 amplitudes were different in the listening blocks before and after sound making, it is more important that N1 amplitudes asymptotically reached the same level of adaptation at the end of listening blocks. Comparing the N1 at the end of each listening block, we conclude that the N1 changes did not constitute a neuroplastic effect. Also, the underlying mechanism is probably not related to sensory memory update because stimuli were presented consistently with only slightly randomized interstimulus intervals, and an equal amount of memory update was required for each stimulus. It is more likely that N1 decrease over the time course of a listening block was related to neural adaptation caused by depletion of presynaptic neurotransmitters (Picton et al., 1976).
In contrast, P2 amplitudes were constant during a listening block, but increased between repeated blocks of sound making. This pattern of P2 changes resembles findings in previous studies where P2 increased over the time course of perceptual learning and training, while N1 amplitudes showed adaptation and subsequent recovery (Atienza et al., 2002; Ross and Tremblay, 2009; Alain et al., 2015). The novel finding here is an immediate and persistent increase in the P2 amplitude within 1 h of the experimental procedure. Even in previous studies of rapid learning, which demonstrated a behavioral performance increase within 1 h of the experiment, P2 changes became evident only on the following day (Alain et al., 2007). Notably, the above studies used learning-by-listening tasks that involve no motor-learning components. Similarly, in our results, the P2 increase during the active block was not observed in the control experiment using key presses to initiate the sound. While behavioral performance in discrimination learning was correlated with P2 increase (Reinke et al., 2003), the reverse may not hold true, and a P2 increase may occur without behavioral consequences. P2 increases have also been observed after periods of passive listening without measurable behavioral improvement (Sheehan et al., 2005). These findings led to the interpretation that P2 increases indicate a stage of learning preceding behavioral improvement (Tremblay et al., 2014) and enhanced object representation for perception (Ross et al., 2013). Therefore, we suggest that learning the specific fine-motor control for sound making with the mallet and singing bowl induces more rapid and efficient establishment of an action–sound association than the generic movement of pressing a key.
β Oscillations
β Oscillations are prominent in the sensorimotor system (Engel and Fries, 2010; Pavlidou et al., 2014). Accordingly, we observed the strongest β modulation in sensorimotor cortices during the action of sound making, which was characterized by a power decrease during preparation for the voluntary movement and a fast rebound beyond the baseline level after the movement. These modulation patterns have been found also in motor imagery without actual movements (Pfurtscheller and Neuper, 1997; McFarland et al., 2000) and action observation (Muthukumaraswamy and Johnson, 2004; Orgs et al., 2008). Interestingly, β modulation is affected by the relevance of the action to the performer (Muthukumaraswamy and Johnson, 2004; Orgs et al., 2008). For example, expert dancers exhibited larger β modulation when viewing dance movements compared with novices, while no difference was found in nondance movements. In the auditory modality, an interval of β ERD has been shown as an obligatory response to sound (Mazaheri and Picton, 2005). More recent studies discovered a role of auditory β oscillation in rhythm perception and predictive timing processing (Fujioka et al., 2012; Bartolo et al., 2014; Arnal et al., 2015; Bartolo and Merchant, 2015; Fujioka et al., 2015; Breska and Deouell, 2016). From these studies, it has been postulated that β ERDs contain both exogenous and endogenous components, the latter related to predictive sensory processing and motor planning. Participants in this study learned to perform a self-initiated, goal-directed action for sound making. Thus, we speculate that placing a feedforward model of the sound outcome into sensory memory would implicitly initiate prediction of perception at the projected time point of the movement, which is mediated by auditory and sensorimotor β oscillations.
Connectivity
High-frequency β and γ oscillations are supposedly related to local processing, while the rhythm of low-frequency oscillations at δ, θ, and α frequencies provides the timing structure for long-range communication (Buzsáki and Watson, 2012). Thus, phase-locked θ oscillations, consistently found across participants, seem to be relevant for functional connectivity. Stronger connectivity between the left sensorimotor cortex and bilateral auditory cortices after sound making is consistent with the concept of learned action–perception association during sound making. Interestingly, all three distinct findings of P2 changes, β modulation, and θ connectivity occurred at a common latency interval of 200–350 ms after stimulus onset, further suggesting involvement in a common process underlying perception.
Footnotes
This work was supported by a grant from the Canadian Institutes for Health Research (Grant MOP125925) to B.R. We thank Angela Wang and Ava Ghods for recording data in control conditions.
The authors declare no competing financial interests.
References
- Alain C, Snyder JS, He Y, Reinke KS (2007) Changes in auditory cortex parallel rapid perceptual learning. Cereb Cortex 17:1074–1084. 10.1093/cercor/bhl018 [DOI] [PubMed] [Google Scholar]
- Alain C, Campeanu S, Tremblay K (2010) Changes in sensory evoked responses coincide with rapid improvement in speech identification performance. J Cogn Neurosci 22:392–403. 10.1162/jocn.2009.21279 [DOI] [PubMed] [Google Scholar]
- Alain C, Zhu KD, He Y, Ross B (2015) Sleep-dependent neuroplastic changes during auditory perceptual learning. Neurobiol Learn Mem 118:133–142. 10.1016/j.nlm.2014.12.001 [DOI] [PubMed] [Google Scholar]
- Aliu SO, Houde JF, Nagarajan SS (2009) Motor-induced suppression of the auditory cortex. J Cogn Neurosci 21:791–802. 10.1162/jocn.2009.21055 [DOI] [PMC free article] [PubMed] [Google Scholar]
- Arnal LH, Doelling KB, Poeppel D (2015) Delta-beta coupled oscillations underlie temporal prediction accuracy. Cereb Cortex 25:3077–3085. 10.1093/cercor/bhu103 [DOI] [PMC free article] [PubMed] [Google Scholar]
- Atienza M, Cantero JL, Dominguez-Marin E (2002) The time course of neural changes underlying auditory perceptual learning. Learn Mem 9:138–150. 10.1101/lm.46502 [DOI] [PMC free article] [PubMed] [Google Scholar]
- Avanzini P, Fabbri-Destro M, Dalla Volta R, Daprati E, Rizzolatti G, Cantalupo G (2012) The dynamics of sensorimotor cortical oscillations during the observation of hand movements: an EEG study. PLoS One 7:e37534. 10.1371/journal.pone.0037534 [DOI] [PMC free article] [PubMed] [Google Scholar]
- Bangert M, Altenmüller EO (2003) Mapping perception to action in piano practice: a longitudinal DC-EEG study. BMC Neurosci 4:26. 10.1186/1471-2202-4-26 [DOI] [PMC free article] [PubMed] [Google Scholar]
- Bartolo R, Merchant H (2015) β Oscillations are linked to the initiation of sensory-cued movement sequences and the internal guidance of regular tapping in the monkey. J Neurosci 35:4635–4640. 10.1523/JNEUROSCI.4570-14.2015 [DOI] [PMC free article] [PubMed] [Google Scholar]
- Bartolo R, Prado L, Merchant H (2014) Information processing in the primate basal ganglia during sensory-guided and internally driven rhythmic tapping. J Neurosci 34:3910–3923. 10.1523/JNEUROSCI.2679-13.2014 [DOI] [PMC free article] [PubMed] [Google Scholar]
- Bäss P, Jacobsen T, Schröger E (2008) Suppression of the auditory N1 event-related potential component with unpredictable self-initiated tones: evidence for internal forward models with dynamic stimulation. Int J Psychophysiol 70:137–143. 10.1016/j.ijpsycho.2008.06.005 [DOI] [PubMed] [Google Scholar]
- Baumann S, Koeneke S, Schmidt CF, Meyer M, Lutz K, Jancke L (2007) A network for audio-motor coordination in skilled pianists and non-musicians. Brain Res 1161:65–78. 10.1016/j.brainres.2007.05.045 [DOI] [PubMed] [Google Scholar]
- Breska A, Deouell LY (2016) When synchronizing to rhythms is not a good thing: modulations of preparatory and post-target neural activity when shifting attention away from on-beat times of a distracting rhythm. J Neurosci 36:7154–7166. 10.1523/JNEUROSCI.4619-15.2016 [DOI] [PMC free article] [PubMed] [Google Scholar]
- Buzsáki G, Watson BO (2012) Brain rhythms and neural syntax: implications for efficient coding of cognitive content and neuropsychiatric disease. Dialogues Clin Neurosci 14:345–367. [DOI] [PMC free article] [PubMed] [Google Scholar]
- Cheyne DO. (2013) MEG studies of sensorimotor rhythms: a review. Exp Neurol 245:27–39. 10.1016/j.expneurol.2012.08.030 [DOI] [PubMed] [Google Scholar]
- Elsner B, Hommel B (2001) Effect anticipation and action control. J Exp Psychol Hum Percept Perform 27:229–240. 10.1037/0096-1523.27.1.229 [DOI] [PubMed] [Google Scholar]
- Engel AK, Fries P (2010) Beta-band oscillations—signalling the status quo? Curr Opin Neurobiol 20:156–165. 10.1016/j.conb.2010.02.015 [DOI] [PubMed] [Google Scholar]
- Flanders M. (2011) What is the biological basis of sensorimotor integration? Biol Cybern 104:1–8. 10.1007/s00422-011-0419-9 [DOI] [PMC free article] [PubMed] [Google Scholar]
- Fujioka T, Trainor LJ, Large EW, Ross B (2012) Internalized timing of isochronous sounds is represented in neuromagnetic beta oscillations. J Neurosci 32:1791–1802. 10.1523/JNEUROSCI.4107-11.2012 [DOI] [PMC free article] [PubMed] [Google Scholar]
- Fujioka T, Ross B, Trainor LJ (2015) Beta-band oscillations represent auditory beat and its metrical hierarchy in perception and imagery. J Neurosci 35:15187–15198. 10.1523/JNEUROSCI.2397-15.2015 [DOI] [PMC free article] [PubMed] [Google Scholar]
- Hari R, Pelizzone M, Mäkelä JP, Hällström J, Leinonen L, Lounasmaa OV (1987) Neuromagnetic responses of the human auditory cortex to on- and offsets of noise bursts. Audiology 26:31–43. 10.3109/00206098709078405 [DOI] [PubMed] [Google Scholar]
- Haueisen J, Knösche TR (2001) Involuntary motor activity in pianists evoked by music perception. J Cogn Neurosci 13:786–792. 10.1162/08989290152541449 [DOI] [PubMed] [Google Scholar]
- Hickok G, Houde J, Rong F (2011) Sensorimotor integration in speech processing: computational basis and neural organization. Neuron 69:407–422. 10.1016/j.neuron.2011.01.019 [DOI] [PMC free article] [PubMed] [Google Scholar]
- Horváth J, Maess B, Baess P, Tóth A (2012) Action-sound coincidences suppress evoked responses of the human auditory cortex in EEG and MEG. J Cogn Neurosci 24:1919–1931. 10.1162/jocn_a_00215 [DOI] [PubMed] [Google Scholar]
- Houde JF, Nagarajan SS, Sekihara K, Merzenich MM (2002) Modulation of the auditory cortex during speech: an MEG study. J Cogn Neurosci 14:1125–1138. 10.1162/089892902760807140 [DOI] [PubMed] [Google Scholar]
- Hughes G, Desantis A, Waszak F (2013) Attenuation of auditory N1 results from identity-specific action-effect prediction. Eur J Neurosci 37:1152–1158. 10.1111/ejn.12120 [DOI] [PubMed] [Google Scholar]
- Kiefer M, Sim EJ, Helbig H, Graf M (2011) Tracking the time course of action priming on object recognition: Evidence for fast and slow influences of action on perception. J Cogn Neurosci 23:1864–1874. 10.1162/jocn.2010.21543 [DOI] [PubMed] [Google Scholar]
- Kobayashi T, Kuriki S (1999) Principal component elimination method for the improvement of S/N in evoked neuromagnetic field measurements. IEEE Trans Biomed Eng 46:951–958. 10.1109/10.775405 [DOI] [PubMed] [Google Scholar]
- Kraeutner S, Gionfriddo A, Bardouille T, Boe S (2014) Motor imagery-based brain activity parallels that of motor execution: evidence from magnetic source imaging of cortical oscillations. Brain Res 1588:81–91. 10.1016/j.brainres.2014.09.001 [DOI] [PubMed] [Google Scholar]
- Kujala T, Näätänen R (2010) The adaptive brain: a neurophysiological perspective. Prog Neurobiol 91:55–67. 10.1016/j.pneurobio.2010.01.006 [DOI] [PubMed] [Google Scholar]
- Lahav A, Saltzman E, Schlaug G (2007) Action representation of sound: audiomotor recognition network while listening to newly acquired actions. J Neurosci 27:308–314. 10.1523/JNEUROSCI.4822-06.2007 [DOI] [PMC free article] [PubMed] [Google Scholar]
- Lange K. (2013) The ups and downs of temporal orienting: a review of auditory temporal orienting studies and a model associating the heterogeneous findings on the auditory N1 with opposite effects of attention and prediction. Front Hum Neurosci 7:263. 10.3389/fnhum.2013.00263 [DOI] [PMC free article] [PubMed] [Google Scholar]
- Lappe C, Herholz SC, Trainor LJ, Pantev C (2008) Cortical plasticity induced by short-term unimodal and multimodal musical training. J Neurosci 28:9632–9639. 10.1523/JNEUROSCI.2254-08.2008 [DOI] [PMC free article] [PubMed] [Google Scholar]
- Maes PJ, Leman M, Palmer C, Wanderley MM (2014) Action-based effects on music perception. Front Psychol 4:1008. 10.3389/fpsyg.2013.01008 [DOI] [PMC free article] [PubMed] [Google Scholar]
- Maris E, Schoffelen JM, Fries P (2007) Nonparametric statistical testing of coherence differences. J Neurosci Methods 163:161–175. 10.1016/j.jneumeth.2007.02.011 [DOI] [PubMed] [Google Scholar]
- Martikainen MH, Kaneko K, Hari R (2005) Suppressed responses to self-triggered sounds in the human auditory cortex. Cereb Cortex 15:299–302. 10.1093/cercor/bhh131 [DOI] [PubMed] [Google Scholar]
- Mazaheri A, Picton TW (2005) EEG spectral dynamics during discrimination of auditory and visual targets. Brain Res Cogn Brain Res 24:81–96. 10.1016/j.cogbrainres.2004.12.013 [DOI] [PubMed] [Google Scholar]
- Mazziotta J, Toga A, Evans A, Fox P, Lancaster J, Zilles K, Woods R, Paus T, Simpson G, Pike B, Holmes C, Collins L, Thompson P, MacDonald D, Iacoboni M, Schormann T, Amunts K, Palomero-Gallagher N, Geyer S, Parsons L, et al. (2001) A probabilistic atlas and reference system for the human brain: International Consortium for Brain Mapping (ICBM). Philos Trans R Soc Lond B Biol Sci 356:1293–1322. 10.1098/rstb.2001.0915 [DOI] [PMC free article] [PubMed] [Google Scholar]
- McFarland DJ, Miner LA, Vaughan TM, Wolpaw JR (2000) Mu and beta rhythm topographies during motor imagery and actual movements. Brain Topogr 12:177–186. 10.1023/A:1023437823106 [DOI] [PubMed] [Google Scholar]
- Muthukumaraswamy SD, Johnson BW (2004) Primary motor cortex activation during action observation revealed by wavelet analysis of the EEG. Clin Neurophysiol 115:1760–1766. 10.1016/j.clinph.2004.03.004 [DOI] [PubMed] [Google Scholar]
- Näätänen R, Picton T (1987) The N1 wave of the human electric and magnetic response to sound: a review and an analysis of the component structure. Psychophysiology 24:375–425. 10.1111/j.1469-8986.1987.tb00311.x [DOI] [PubMed] [Google Scholar]
- Näätänen R, Winkler I (1999) The concept of auditory stimulus representation in cognitive neuroscience. Psychol Bull 125:826–859. 10.1037/0033-2909.125.6.826 [DOI] [PubMed] [Google Scholar]
- Nolte G, Bai O, Wheaton L, Mari Z, Vorbach S, Hallett M (2004) Identifying true brain interaction from EEG data using the imaginary part of coherency. Clin Neurophysiol 115:2292–2307. 10.1016/j.clinph.2004.04.029 [DOI] [PubMed] [Google Scholar]
- Orgs G, Dombrowski JH, Heil M, Jansen-Osmann P (2008) Expertise in dance modulates alpha/beta event-related desynchronization during action observation. Eur J Neurosci 27:3380–3384. 10.1111/j.1460-9568.2008.06271.x [DOI] [PubMed] [Google Scholar]
- Pavlidou A, Schnitzler A, Lange J (2014) Beta oscillations and their functional role in movement perception. Transl Neurosci 5:286–292. 10.2478/s13380-014-0236-4 [DOI] [Google Scholar]
- Pfurtscheller G, Lopes da Silva FH (1999) Event-related EEG/MEG synchronization and desynchronization: basic principles. Clin Neurophysiol 110:1842–1857. 10.1016/S1388-2457(99)00141-8 [DOI] [PubMed] [Google Scholar]
- Pfurtscheller G, Neuper C (1997) Motor imagery activates primary sensorimotor area in humans. Neurosci Lett 239:65–68. 10.1016/S0304-3940(97)00889-6 [DOI] [PubMed] [Google Scholar]
- Picton TW, Hillyard SA, Galambos R (1976) Habituation and attention in the auditory system. In: Handbook of sensory physiology (Keidel WD, Neff WD, eds), pp 343–389. Berlin: Springer. [Google Scholar]
- Poonian SK, McFadyen J, Ogden J, Cunnington R (2015) Implicit agency in observed actions: Evidence for N1 suppression of tones caused by self-made and observed actions. J Cogn Neurosci 27:752–764. 10.1162/jocn_a_00745 [DOI] [PubMed] [Google Scholar]
- Reinke KS, He Y, Wang C, Alain C (2003) Perceptual learning modulates sensory evoked response during vowel segregation. Brain Res Cogn Brain Res 17:781–791. 10.1016/S0926-6410(03)00202-7 [DOI] [PubMed] [Google Scholar]
- Rizzolatti G, Craighero L (2004) The mirror-neuron system. Annu Rev Neurosci 27:169–192. 10.1146/annurev.neuro.27.070203.144230 [DOI] [PubMed] [Google Scholar]
- Ross B, Tremblay K (2009) Stimulus experience modifies auditory neuromagnetic responses in young and older listeners. Hear Res 248:48–59. 10.1016/j.heares.2008.11.012 [DOI] [PMC free article] [PubMed] [Google Scholar]
- Ross B, Borgmann C, Draganova R, Roberts LE, Pantev C (2000) A high-precision magnetoencephalographic study of human auditory steady-state responses to amplitude-modulated tones. J Acoust Soc Am 108:679–691. 10.1121/1.429600 [DOI] [PubMed] [Google Scholar]
- Ross B, Jamali S, Tremblay KL (2013) Plasticity in neuromagnetic cortical responses suggests enhanced auditory object representation. BMC Neurosci 14:151. 10.1186/1471-2202-14-151 [DOI] [PMC free article] [PubMed] [Google Scholar]
- Roy S, Zhao L, Wang X (2016) Distinct neural activities in premotor cortex during natural vocal behaviors in a new world primate, the common marmoset (Callithrix jacchus). J Neurosci 36:12168–12179. 10.1523/JNEUROSCI.1646-16.2016 [DOI] [PMC free article] [PubMed] [Google Scholar]
- Saleh M, Reimer J, Penn R, Ojakangas CL, Hatsopoulos NG (2010) Fast and slow oscillations in human primary motor cortex predict oncoming behaviorally relevant cues. Neuron 65:461–471. 10.1016/j.neuron.2010.02.001 [DOI] [PMC free article] [PubMed] [Google Scholar]
- Salmelin R, Hämäläinen M, Kajola M, Hari R (1995) Functional segregation of movement-related rhythmic activity in the human brain. Neuroimage 2:237–243. 10.1006/nimg.1995.1031 [DOI] [PubMed] [Google Scholar]
- SanMiguel I, Todd J, Schröger E (2013) Sensory suppression effects to self-initiated sounds reflect the attenuation of the unspecific N1 component of the auditory ERP. Psychophysiology 50:334–343. 10.1111/psyp.12024 [DOI] [PubMed] [Google Scholar]
- Sato A. (2008) Action observation modulates auditory perception of the consequence of others' actions. Conscious Cogn 17:1219–1227. 10.1016/j.concog.2008.01.003 [DOI] [PubMed] [Google Scholar]
- Seppänen M, Hämäläinen J, Pesonen AK, Tervaniemi M (2013) Passive sound exposure induces rapid perceptual learning in musicians: event-related potential evidence. Biol Psychol 94:341–353. 10.1016/j.biopsycho.2013.07.004 [DOI] [PubMed] [Google Scholar]
- Sheehan KA, McArthur GM, Bishop DV (2005) Is discrimination training necessary to cause changes in the P2 auditory event-related brain potential to speech sounds? Brain Res Cogn Brain Res 25:547–553. 10.1016/j.cogbrainres.2005.08.007 [DOI] [PubMed] [Google Scholar]
- Teale P, Pasko B, Collins D, Rojas D, Reite M (2013) Somatosensory timing deficits in schizophrenia. Psychiatry Res 212:73–78. 10.1016/j.pscychresns.2012.11.007 [DOI] [PMC free article] [PubMed] [Google Scholar]
- Tesche CD, Uusitalo MA, Ilmoniemi RJ, Huotilainen M, Kajola M, Salonen O (1995) Signal-space projections of MEG data characterize both distributed and well-localized neuronal sources. Electroencephalogr Clin Neurophysiol 95:189–200. 10.1016/0013-4694(95)00064-6 [DOI] [PubMed] [Google Scholar]
- Timm J, SanMiguel I, Keil J, Schröger E, Schönwiesner M (2014) Motor intention determines sensory attenuation of brain responses to self-initiated sounds. J Cogn Neurosci 26:1481–1489. 10.1162/jocn_a_00552 [DOI] [PubMed] [Google Scholar]
- Tong Y, Melara RD, Rao A (2009) P2 enhancement from auditory discrimination training is associated with improved reaction times. Brain Res 1297:80–88. 10.1016/j.brainres.2009.07.089 [DOI] [PubMed] [Google Scholar]
- Tremblay KL, Ross B, Inoue K, McClannahan K, Collet G (2014) Is the auditory evoked P2 response a biomarker of learning? Front Syst Neurosci 8:28. 10.3389/fnsys.2014.00028 [DOI] [PMC free article] [PubMed] [Google Scholar]
- Vinck M, Oostenveld R, van Wingerden M, Battaglia F, Pennartz CM (2011) An improved index of phase-synchronization for electrophysiological data in the presence of volume-conduction, noise and sample-size bias. Neuroimage 55:1548–1565. 10.1016/j.neuroimage.2011.01.055 [DOI] [PubMed] [Google Scholar]
- Vrba J, Robinson SE (2001) Signal processing in magnetoencephalography. Methods 25:249–271. 10.1006/meth.2001.1238 [DOI] [PubMed] [Google Scholar]
- Wu CC, Hamm JP, Lim VK, Kirk IJ (2016) Mu rhythm suppression demonstrates action representation in pianists during passive listening of piano melodies. Exp Brain Res 234:2133–2139. 10.1007/s00221-016-4615-7 [DOI] [PubMed] [Google Scholar]
- Zatorre RJ, Chen JL, Penhune VB (2007) When the brain plays music: auditory-motor interactions in music perception and production. Nat Rev Neurosci 8:547–558. 10.1038/nrn2152 [DOI] [PubMed] [Google Scholar]