

Abstract
In the postnatal forebrain regionalized neural stem cells along the ventricular walls produce olfactory bulb (OB) interneurons with varying neurotransmitter phenotypes and positions. To understand the molecular basis of this region-specific variability we analyzed gene expression in the postnatal dorsal and lateral lineages in mice of both sexes from stem cells to neurons. We show that both lineages maintain transcription factor signatures of their embryonic site of origin, the pallium and subpallium. However, additional factors, including Zic1 and Zic2, are postnatally expressed in the dorsal stem cell compartment and maintained in the lineage that generates calretinin-positive GABAergic neurons for the OB. Functionally, we show that Zic1 and Zic2 induce the generation of calretinin-positive neurons while suppressing dopaminergic fate in the postnatal dorsal lineage. We investigated the evolutionary conservation of the dopaminergic repressor function of Zic proteins and show that it is already present in C. elegans.
SIGNIFICANCE STATEMENT The vertebrate brain generates thousands of different neuron types. In this work we investigate the molecular mechanisms underlying this variability. Using a genomics approach we identify the transcription factor signatures of defined neural stem cells and neuron populations. Based thereon we show that two related transcription factors, Zic1 and Zic2, are essential to control the balance between two defined neuron types in the postnatal brain. We show that this mechanism is conserved in evolutionary very distant species.
Keywords: neural stem cells, olfactory bulb, transcription factor
Introduction
A key question in developmental neurobiology concerns the molecular mechanisms that control the specification of stem cells to produce neurons with defined neurotransmitter phenotype, positions, and connectivity. Combinatorial expression of transcription factors, highly controlled in space and time, has been shown to underlie the determination events that lead to neuronal diversity in the developing embryo (Guillemot, 2007). Moreover, in defined regions of the mammalian brain neurogenesis continues into postnatal and adult stages, making the control of stem cell determination a lifelong requirement.
Postnatal neurogenesis is particularly prominent in the olfactory system of rodents, where neuronal stem cells in ventricular and subventricular zone (V/SVZ) lining the walls of the lateral ventricles generate continuously new interneurons for the olfactory bulb (OB; Alvarez-Buylla and Garcia-Verdugo, 2002; Alvarez-Buylla et al., 2008). After migration via the rostral migratory stream (RMS) these precursors differentiate into OB periglomerular cells (PGCs) or granule cells (GCs) and use GABA, dopamine, and glutamate as their neurotransmitters. The heterogeneity of neuron types in the OB is based on the existence of predetermined neural stem cells organized in subregions of the postnatal ventricular walls (Merkle et al., 2007, 2014). Recent work indicated that this regionalization of the postnatal and adult stem cell pools is already established during early time points of embryonic forebrain development, starting at E11.5, when subpopulations of embryonic progenitor cells in the developing cortex, striatum, and septum are set aside to be reactivated for OB neurogenesis after birth (Fuentealba et al., 2015).
These observations suggest that developmental mechanisms that are used to generate defined type of neurons in the embryo are maintained and needed for the specification of neuronal phenotype in the postnatal OB. In agreement with this idea, glutamatergic neurons for the embryonic cortex are generated in the dorsal telencephalon (Hevner et al., 2006), a region that gives rise to the postnatal dorsal V/SVZ which later generates the glutamatergic interneurons for the OB (Anderson et al., 1997b; Brill et al., 2009; Winpenny et al., 2011). Similarly, GABAergic interneurons destined for the developing cortex are generated by the ganglionic eminences of the subpallium (Anderson et al., 1997a), a region that postnatally generates GABAergic neurons for the OB (Merkle et al., 2007).
However, the precise situation is more complex. For example the dorsal V/SVZ, which in the embryo generates exclusively glutamatergic neurons, produces in the postnatal brain only low numbers of this neurotransmitter type, but predominantly GABAergic and dopaminergic (DA) neurons (Fiorelli et al., 2015). At the molecular level this indicates that additional regulatory mechanisms have to be activated postnatally, inducing this new diversity. Moreover, fate decisions are not confined to the stem cell compartment, since expression of new transcription factor combinations to produce specific neuronal phenotypes can occur at the postmitotic stage (Brill et al., 2008; de Chevigny et al., 2012b). Thus, to understand the regulatory mechanisms that control neuronal diversity we have to investigate molecular determinants in the postnatal neurogenic system in space (in different stem cell compartments), but also in time (from stem cells to neurons).
We performed an in vivo screen that allowed following gene expression in the dorsal (cortical) and lateral (striatal) lineages of OB neurogenesis. We show that both lineages maintain transcription factor signatures corresponding to their sites of origin, the pallium and subpallium. Focusing on the dorsal compartment we demonstrate that additional factors are induced, that can account for the de novo potential of this stem cell pool. We demonstrate that the zinc-finger transcription factors Zic1 and Zic2 are expressed postnatally in a subset of dorsal stem and progenitor cells where they repress dopaminergic fate and induce the production of calretinin (CR)-positive GABAergic interneurons.
In parallel, we investigated the conservation of the DA repressor function of Zic proteins using the invertebrate Caenorhabditis elegans. We demonstrate that the unique C. elegans Zic protein REF-2 represses the dopaminergic pathway in the nematode dorsal head, comparable to the situation in vertebrates.
Materials and Methods
Mice.
All animals were treated according to protocols approved by the French Ethical Committee. CD1 (RjOrl:SWISS) mice of both sexes (Janvier Laboratories), held under standard conditions, were used for expression pattern analyses and in vivo electroporation. In vivo functional studies were performed through P1 animal electroporation (Boutin et al., 2008). When only two conditions were tested, one litter (∼15 animals) was used. When more than two conditions were tested in parallel in a same experiment, two litters were used.
Plasmids and in vivo electroporation.
Overexpression experiments: mouse Zic1 cDNA was amplified from total RNA extracted from P1 pups dorsal SVZ tissue. Briefly, RNA was reverse transcribed using Superscript III (ThermoFisher Scientific, 12574-030) and a nested-PCR was performed on the reverse transcription product using PrimeSTAR polymerase (Ozyme, TAKR050Q) and the two couples of primers:
PCR1: Zic1 FW (TCCTGATCTTCCCTCCTTGG) and Zic1 REV (ACGGCGTATATACGTGTGTG)
PCR2: Zic1 FW_SpeI (TCACTAGTTGCAGCCACGATGCTCCTGG) and Zic1 REV_EI (TCGAATTCTAAATAGGGGGTCGGCATGT). PCR product was subsequently subcloned behind the CAG promoter into the pCX-MCS2 vector (Morin et al., 2007), or behind the BLBP promoter (Schmid et al., 2006). The pCAGGS-human Zic2 plasmid was described by García-Frigola et al. (2008). Downregulation experiments: the shZic1 clone, which was subsequently used for the in vivo experiments, was selected among a set of 5 shZic1 clones provided by Sigma-Aldrich. For this selection step, Zic1 cDNA was subcloned into the peGFP-C1 vector (Clontech, GenBank: U55763.1) to fuse Zic1 and eGFP proteins. This Zic1-eGFP construct was cotransfected in mycoplasma free HeLa cells together with a Zic1 shRNA and a pCAGGS-tomato expression vector (all 3 plasmids in equal ratio) using Lipofectamin2000 (ThermoFisher Scientific, 11668019) following the manufacturer's instructions. Two days after transfection images in fluorescence (GFP and Tomato) were randomly acquired in all transfected wells. Using ImageJ software GFP and tomato fluorescences were measured on all images and GFP/tomato ratios were used to evaluate the efficiency of each Zic1 shRNA to target the mouse Zic1 sequence. shZic1 targeting the sequence CCAGCGCTGCTTTCAATTCTA was finally chosen as it induced a 95% decrease in GFP fluorescence. The same sequence has been independently identified, selected, and successfully used in another study (Urban et al., 2015). The mouse shZic2 was described by Escalante et al. (2013).
For all in vivo functional experiments overexpression vectors and shRNA plasmids were electroporated in P1 pups, as described by Boutin et al. (2008), together with a pCX-eGFP vector (Morin et al., 2007) in a 2:1 molecular ratio to label the electroporated cells. For triple electroporations, a 2:2:1 ratio was applied (1 dose of pCX-eGFP monitor, 2 doses of gain/loss of function vector, and/or empty pCX plasmid).
Microarrays.
The design of the microarray analysis performed to determine the time course of genes expression in the dorsal and lateral lineages in the SVZ-RMS-OB postnatal neurogenic system was previously described (de Chevigny et al., 2012b). Briefly, lateral and dorsal SVZ stem cells were in vivo electroporated with a pCX-eGFP plasmid. At various time points after electroporation tissues of interest were microdissected [SVZ tissues at 8 h post-electroporation (hpe) 1 and 2 d post-electroporation (dpe); RMS tissues at 4 dpe; whole bulb at 7 and 14 dpe] and dissociated by trypsin/DNase digestion. GFP-expressing neuronal cells were subsequently sorted by flow cytometry (MoFlow, Beckman-Coulter). Numbers of FACS isolated cells and experimental repetitions are listed in Table 1. Ten to 15 mice were used per condition.
Table 1.
Cell number and repetitions for microarray analyses
| Electroporation target | GFP + cells per animal | No. of repetitions | |
|---|---|---|---|
| 8 hpe | Lateral SVZ | 150 | 2 |
| Dorsal SVZ | 250 | 2 | |
| 1 dpe | Lateral SVZ | 358 | 3 |
| Dorsal SVZ | 1091 | 3 | |
| 2 dpe | Lateral SVZ | 1066 | 2 |
| Dorsal SVZ | 1590 | 2 | |
| 4 dpe | Lateral SVZ | 903 | 3 |
| Dorsal SVZ | 213 | 3 | |
| 7 dpe | Lateral SVZ | 500 | 3 |
| Dorsal SVZ | 371 | 3 | |
| 14 dpe | Lateral SVZ | 73 | 4 |
| Dorsal SVZ | 53 | 4 |
RNA was extracted, amplified and hybridized (2 colors protocol, each color corresponding to a targeted region, dorsal or lateral wall) on a G4122F Whole Mouse Genome (4 × 44K) Oligo Microarrays (Agilent). Microarray results (referenced in GEO as GSE69693) were analyzed using R software (RRID:SCR_001905) and Limma package (RRID:SCR_010943; Gentleman et al., 2004). Briefly, data were first normalized using quantile normalization. Differential gene expression was analyzed at each time-point using a moderated t test applied on a filtered subset of data. The filtering selected genes for which the average of dorsal/lateral intensity ratio (log2) was >2. A FDR corrected p value was then calculated for each gene. A corrected p < 0.05 was considered significant.
In Figure 1C–E the genes for which the time course of the dorsal/lateral intensity ratios is shown were generally selected based on a significant differential expression for at least one time point (except for Nr4f1/COUP-TF1, which did not match this criterion but showed consistent dorsal predominance).
Figure 1.
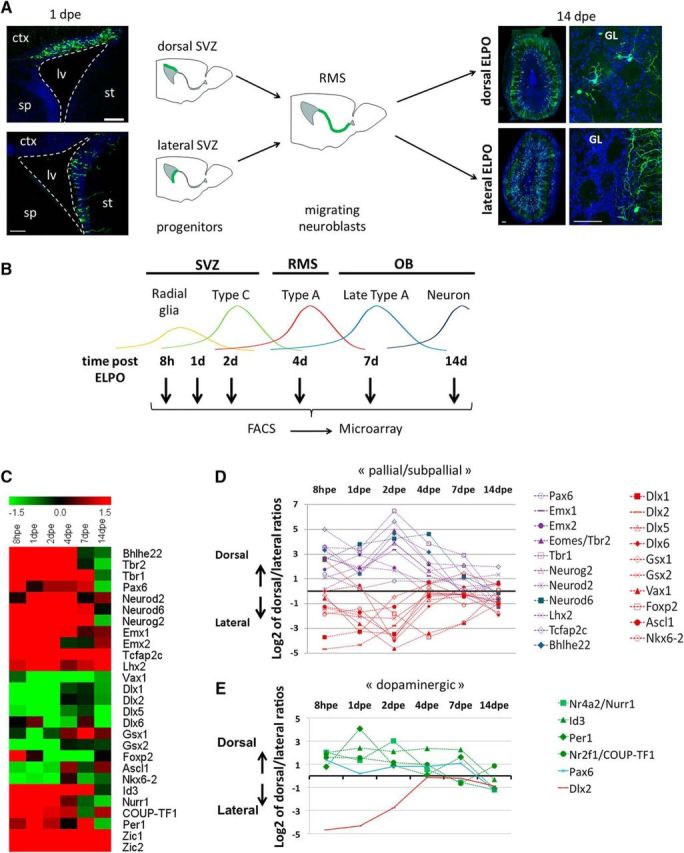
Gene expression analyses in dorsal and lateral neurogenic lineages from stem cells to neurons. A, Schematic representation of the experimental procedure underlying the gene expression screen. V/SVZ was dorsally or laterally transfected by targeted brain electroporation (ELPO). Photomicrographs (left) represent examples for electroporation of the dorsal and lateral ventricular walls at 1dpe. After migration in the RMS GFP-expressing cells segregate into the different layers of the OB. Dorsally electroporated cells integrate after 14 d mainly into peripheral layers while laterally targeted cells remain centrally (right). B, GFP-expressing cells were harvested at 8 hpe, 1 dpe, and 2 dpe from the V/SVZ, at 4 dpe from the RMS and at 7 and 14 dpe from the OB. Colored curves represent the predominant cell type at a given time point. C, Heat map representation of average ratios (log values) for dorsal versus lateral intensities for all genes mentioned in this study. D, Time course of gene expression dorsal/lateral ratios for key factors implicated in telencephalon development. Pallial (blue curves) and subpallial (red curves) gene expression signatures are maintained in the postnatal dorsal (cortical) and lateral (striatal) lineages. E, Factors implicated in dopaminergic pathways are predominant in the dorsal lineage. Note the progressive induction of expression of the subpallial gene Dlx2 in the dorsal lineage. D, E, The values plotted in graphs represent for each time point the log2 average of dorsal/lateral intensity value of all different experimental repetitions. ctx, Cortex; lv, lateral ventricle; sp, septum; st, striatum. Scale bars, 150 μm.
qRT-PCR.
RNAs were extracted using miRNeasy mini kit (Qiagen, 217004). cDNAs were prepared using superscript-III (ThermoFisher Scientific, 12574-030) following manufacturer instructions. QPCRs were performed on a Bio-Rad CFX system using SYBR-GreenER qPCR SuperMix (ThermoFisher Scientific, 11762100). β-Actin was used as reference gene. Primers used for mRNA detection are the following: Beta Actin FORseq_ CTAAGGCCAACCGTGAAAAG and REVseq_ ACCAGAGGCATACAGGGACA; Zic1 FOR seq_ AACCTCAAGATCCACAAAAGGA and REVseq_ CCTCGAACTCGCACTTGAA; Zic2 FORseq_ GATCCACAAAAGAACTCATACAGG and REVseq_ CTTCTTCCTGTCGCTGCTGT; Nurr1 FORseq_ CAGCTCCGATTTCTTAACTCCAG and REVseq_ AGGGGCATTTGGTACAAGCAA.
Sample preparation and immunohistochemistry.
Animals were deeply anesthetized with an overdose of xylasin/ketamine then intracardially perfused with 4% paraformaldehyde (w/v; PFA) in PBS. The brain were dissected out and further fixed overnight at 4°C in the same fixative. For light tissue fixation required for Zic immunohistochemistry, animals were first perfused with PBS (10 ml/10 g) then with 4% PFA (10 ml/10 g). Brains were dissected out, further fixed for 1 h. Fifty micrometer floating sections were processed as described previously (Boutin et al., 2010), blocked in PBS supplemented with 0.3% Triton and 5% fetal bovine serum for 1 h at room temperature and incubated at 4°C overnight in the blocking solution supplemented with primary antibody. After washing, sections were incubated for 2 h at room temperature in the blocking solution supplemented with a fluorophore-conjugated secondary antibody. After staining of cell nuclei with Hoechst 33258, sections were mounted onto Superfrost Plus slides with Mowiol.
The primary antibodies we used were designed against pan-Zic (rabbit IgG, 1:1000; generous gift from Rosalind Segal; Borghesani et al., 2002), Zic2 (rabbit IgG, 1: 1000; Brown et al., 2003), GFP (rabbit IgG, 1:1000; ThermoFisher Scientific, Catalog #PA1–28521, RRID:AB_1956473; or chicken IgY, 1:1000; Aves Labs, Catalog #GFP-1010, RRID:AB_2307313), KI67 (mouse IgG1; BD Biosciences, Catalog #550609, RRID:AB_393778; 1:200), CR (mouse IgG1, 1:2000; Synaptic Systems, Catalog #214 111C3 RRID:AB_2619906;), and tyrosine hydroxylase (TH; chicken IgY, 1:1000; Aves Labs, Catalog #TYH RRID:AB_10013440). The adapted secondary antibodies were provided by ThermoFisher Scientific.
C. elegans.
For ref-2 ubiquitous overexpression in C. elegans, a construct containing the ref-2 cDNA under the control of a heat shock promoter (Alper and Kenyon, 2002) was injected at 20 ng/μl with 80 ng/μl hisp::his::mCherry coinjection marker to generate the vbaEx113 extrachromosomal array; (vbaEx113; vtIs1) embryos or (vtIs1) control embryos were then mounted on slides at the two-cell stage, incubated 250 min at 20°C (before the birth of the dopaminergic neurons), and then shifted to 33°C for 30 min and put back to 20°C until analysis at the L1 larval stage.
Quantification and statistics.
For mice experiments both sexes were used. Quantification of CR or TH-expressing cells among the GFP electroporated periglomerular neurons at 14 and 21 dpe was assessed on photomicrographs taken on an Apotome M2 microscope (Zeiss). The number of independent experiments, animals, and counted cells is detailed in the figure legends. For the characterization of the dorsally originated periglomerular cells at 21 dpe, the percentage of TH+ and CR+ cells represent the mean value of four independent experiments comprising in total 20 animals (CR) and five independent experiments comprising 26 animals (TH); SEM are given.
For all in vivo experiments in mouse, statistically significant differences between groups of animals were assessed by the 2K-permutation test, on pooled experimental repetitions using R software (RRID:SCR_001905). This test is a nonparametric test for comparing two populations of samples in conditions where the normality of distribution cannot be assumed or assessed (May and Hunter, 1993). C. elegans experiments were performed on hermaphrodite animals. For Figure 6, statistically significant differences between proportions were assessed by a Fisher's exact test, two-tailed.
Figure 6.
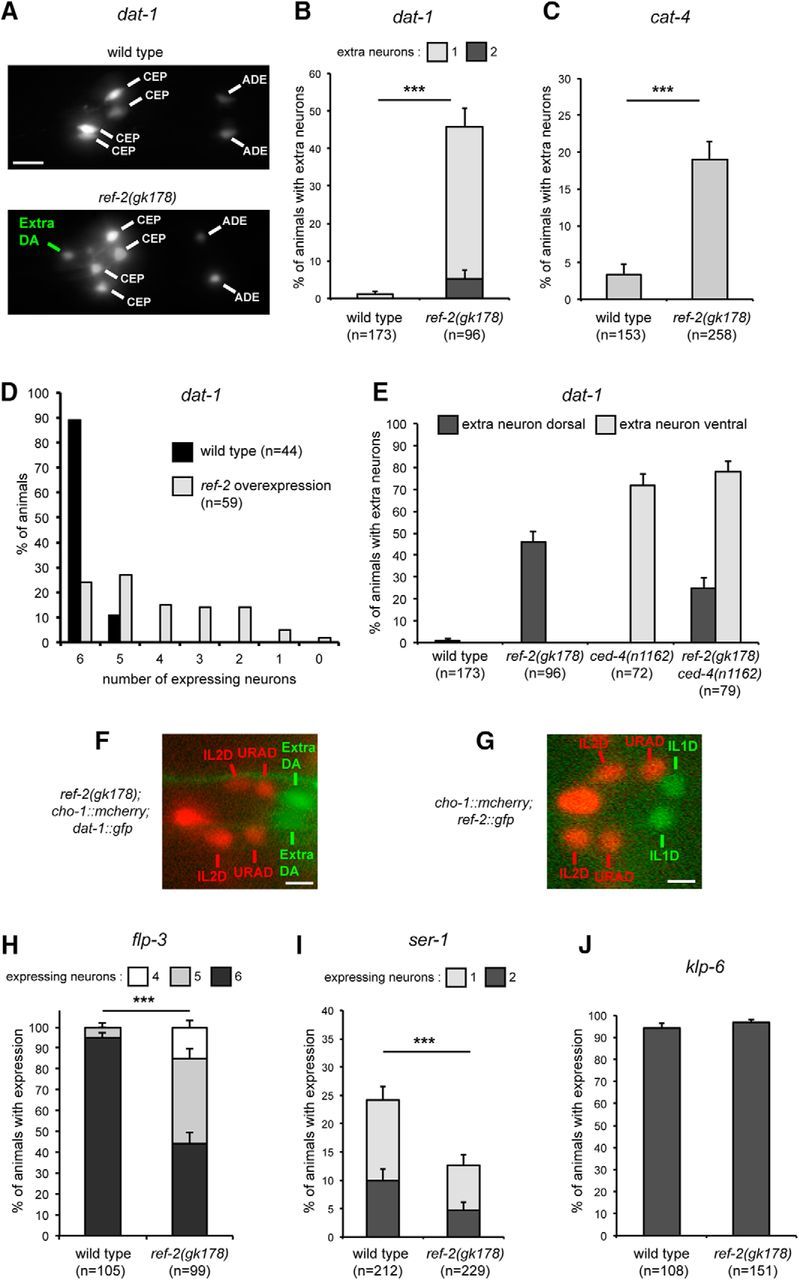
Effect of the C. elegans Zic protein REF-2 on dopaminergic fate. A, In the head of wild-type C. elegans larvae six dopaminergic neurons are present (4 CEP and 2 ADE), in ref-2(gk178) mutants extra dopaminergic neurons are observed (marker of dopaminergic neurons used: dat-1::gfp (vtIs1); head of L1 larvae, lateral view, anterior is left, dorsal is up). Scale bar, 5 μm. B, Percentage of L1 larvae displaying one or two extra neurons expressing dat-1::gfp (n = number of animals, error bars show standard error of proportion; ***p = 3.9 × 10⁻²¹, Fisher's exact test). C, Percentage of L1 larvae displaying one extra neuron expressing cat-4::gfp (otIs225) in the dorsal region (n = number of animals, error bars show standard error of proportion; *** p = 1.4 × 10⁻⁶, Fisher's exact test). D, Percentage of L1 larvae expressing dat-1::gfp in 6, 5, …, 1, or 0 dopaminergic neurons in absence (black bar) or presence (gray bar) of ref-2 overexpression (n = number of animals). ref-2 Overexpression does not block all neuronal differentiation as it does not affect the expression of klp-6, a marker of the unrelated neuronal class IL2 (without ref-2 ectopic expression 20/20 animals express klp-6::gfp (myIs13) in the six IL2 neurons; with ref-2 ectopic expression 25/25 animals express klp-6::gfp in the six IL2 neurons). E, Percentage of L1 larvae displaying extra neurons expressing dat-1::gfp (vtIs1) in the dorsal region (dark gray) or ventral region (light gray; n = number of animals, error bars show standard error of proportion). The effect of ref-2 and ced-4 mutations is additive suggesting that the extra neurons expressing dat-1::gfp observed in ref-2 mutants do not come from a loss of cell death. F, The two extra dopaminergic neurons observed in ref-2(gk178) mutants (extra DA labeled with dat-1::gfp) are located just posterior to the pairs of cholinergic neurons IL2 dorsal (IL2D) and URA dorsal [URAD; labeled with cho-1::mcherry (otIs544)]. Dorsal view of the head of a L1 larva, anterior is left. Scale bar, 2 μm. G, Expression of ref-2::gfp (fosmid translational reporter, wgIs520) in the pair of IL1D glutamatergic neurons, located just posterior to the pairs of cholinergic neurons IL2D and URAD [labeled with cho-1::mcherry (otIs544)]. Dorsal view of the head of a L1 larva, anterior is left. Scale bar, 2 μm. H, Percentage of L1 larvae expressing the IL1 neuron marker flp-3 (flp-3::gfp, ynIs21) in 6, 5, or 4 IL1 neurons (n = number of animals, error bars show standard error of proportion; ***p = 1.1 × 10⁻¹⁶, Fisher's exact test). I, Percentage of L1 larvae expressing the URYD neuron marker ser-1 (ser-1::gfp, vuEx172) in one or both URYD neurons (n = number of animals, error bars show standard error of proportion; ***p = 0.002, Fisher's exact test). J, Percentage of L1 larvae expressing the IL2 neuron marker klp-6 (klp-6::gfp, myIs13) in every IL2 neurons (n = number of animals, error bars show standard error of proportion).
Results
Gene expression in the postnatal neurogenic forebrain in space and time
We aimed at comparing gene expression between different postnatal stem cell compartments during the entire neurogenic process in the V/SVZ-RMS-OB system of the mouse. Targeted forebrain electroporation allowed the specific labeling of dorsal (cortical) and lateral (striatal) stem cell pools with GFP (Fig. 1A; de Chevigny et al., 2012a,b). After electroporation, a labeled cell cohort passed through the different neurogenic steps to finally differentiate and integrate into the OB (Fig. 1A; Boutin et al., 2008). Twenty-one days post-electroporation labeled GFP+ neurons of dorsal origin were predominantly localized in peripheral layers of the OB, the glomerular layer (GL),and the superficial GC layer (GCL; Fig. 1A). In the GL this population comprised 22.1% ± 0.7% TH-expressing dopaminergic neurons and 24.9 ± 1.6% CR-expressing GABAergic neurons. The remaining GFP-positive cells did not express known markers of OB interneuron subtypes, except for a small number of Tbr2-expressing glutamatergic neurons (<2%). Neurons targeted by lateral electroporation were in the OB generally confined to deep layers of the GCL (Fig. 1A). Among the laterally electroporated neurons <3% expressed TH or CR. Thus, targeted in vivo brain electroporation labeled two different heterogeneous stem cell pools that generated neurons that occupied distinct spatial positions in the OB layers and different relative proportions of dopaminergic and GABAergic neurons.
We compared the gene expression programs in the dorsal and lateral lineages from the radial glia (RG) stage to integrated neurons. Using the postnatal brain electroporation approach we labeled specifically either the dorsal or the lateral walls with GFP and performed FACS to isolate fluorescent cells 8 hpe (representing RG), 1 dpe (mainly representing RG and transit amplifying type C cells), 2 dpe (mainly type C cells and migrating neuroblasts in the SVZ), 4 dpe (tangentially migrating neuroblasts in the RMS), 7 dpe (radially migrating neuroblasts in the OB), and 14 dpe (integrating neurons in the OB; Boutin et al., 2008). Subsequent microarray analyses followed by bioinformatics comparison of the different samples provided a high-resolution matrix of gene expression in the forebrain neurogenic system in space (dorsal versus lateral lineages) and time (from stem cells to neurons; Fig. 1B; de Chevigny et al., 2012b). This resource is accessible under GEO reference GSE69693.
Recent work suggested that the postnatal neuronal lineages are specified early in the developing cortical and striatal ventricular walls and maintained in a quiescent state for postnatal use in OB neurogenesis (Fuentealba et al., 2015). We asked whether this spatial relationship is detectable at the molecular level in the postnatal OB neurogenic lineages. Comparison of the expression ratio in the dorsal versus lateral lineages revealed that key transcription factors (TFs) implicated in cortex regionalization, cortical layer specification or glutamatergic differentiation were strongly overrepresented in the dorsally generated postnatal OB lineage (heat map: Fig. 1C; space/time diagram: Fig. 1D). These factors included Emx1, Emx2, Pax6, Tbr1, Tbr2, NeuroD2, NeuroD6, Neurog2, Lhx2, Tcfap2c, and Bhlhe22 (Bishop et al., 2002; Englund et al., 2005; Britz et al., 2006; Joshi et al., 2008; Pinto et al., 2009; Bormuth et al., 2013; Chou and O'Leary, 2013; Dixit et al., 2014; Zembrzycki et al., 2015). In contrast, factors implicated in regionalization and specification of the subpallium, including Dlx1, Dlx2, Dlx5, Dlx6, Gsx1, Gsx2, Vax1, FoxP2, Ascl1, and Nkx6.2 (Guillemot et al., 1993; Hallonet et al., 1999; Takahashi et al., 2003; Cobos et al., 2006; Sousa et al., 2009; Wang et al., 2010; Pei et al., 2011) were predominant in the laterally generated lineage (Fig. 1C,D). Thus, molecular signatures of dorsal and lateral OB lineages reflected the cortical or subcortical origin of the respective embryonic precursor pools.
The above results indicate that the same transcriptional programs that control forebrain development in the embryo are maintained and underlie, at least in part, the generation of OB interneurons. However, during corticogenesis the dorsal telencephalon in rodents generates exclusively glutamatergic projection neurons, while in the postnatal and adult brain the cortical stem cell pool generates predominantly dopaminergic and GABAergic neurons, and only very few glutamatergic cells. This suggests that additional mechanisms must be activated in the postnatal stem cell compartments, likely in the form of additional transcription factors, which suppress or override the glutamatergic program and induce these alternative fates.
In line with this notion, we found that the orphan nuclear receptor Nurr1, a regulator of TH (Sakurada et al., 1999), was overrepresented in dorsal progenitors that generate the majority of OB DA neurons (Fig. 1C,E). Other TF that have been implicated in dopaminergic differentiation in non-midbrain neurons showed also clear dorsal predominance. These included Coup-TF1, a regulator of activity-dependent TH expression (Bovetti et al., 2013), Per1, which controls DA neurons implicated in circadian rhythm (Huang et al., 2015), and Id3, which has been implicated in DA neuron maturation in zebrafish (Li et al., 2010). The expression patterns of Pax6 and Dlx2, two postnatal pro-dopaminergic factors (Hack et al., 2005; Kohwi et al., 2005; Brill et al., 2008), also illustrate the evolution of neuronal progenitors that occurs after birth. Pax6, whose expression in the embryonic pallium is confined exclusively to early progenitor stages, becomes permanently expressed in the postnatal dorsal lineage (Fig. 1E; de Chevigny et al., 2012b). Dlx2, which in the embryo is expressed in the subpallial stem cell compartment, is postnatally induced during migratory stages in the dorsal/pallial, lineage where it interacts with Pax6 to induce dopaminergic fate (Fig. 1E; Brill et al., 2008; de Chevigny et al., 2012b). In contrast, Lmx1a, Lmx1b, and Foxa2, three key factors that cooperatively specify midbrain dopaminergic neurons (Lin et al., 2009; Nakatani et al., 2010), were not detected in our expression studies, underlining that forebrain DA neurons are specified by alternative, forebrain-specific pathways.
Zic1 and Zic2 are repressors of dopaminergic fate in the postnatal forebrain
In the postnatal dorsal lineage we also identified genes that were not so far implicated in cortical neurogenesis or related to dopaminergic fate determination. In particular the zinc-finger transcription factor Zic1 (Ali et al., 2012) was strongly and consistently expressed in the dorsal isolates from the stem cell stage to neurons (Figs. 1C, 2A,B). Zic2 displayed comparable expression dynamics (Figs. 1C, 2A) at a lower level (Fig. 2B), whereas the other members of the Zic-gene family (Zic3–5) showed no significant expression, except for low signal for Zic4 at 14 dpe (Fig. 2B). qRT-PCR analyses of microdissected periventricular tissue from neonate (P2) and adult (≥3 months) animals demonstrated that restriction of Zic1 and Zic2 expression to the dorsal compartment was maintained in adult stages (Fig. 2C).
Figure 2.

Expression of Zic1 and Zic2 in the mouse forebrain neurogenic system. A, Time course of gene expression ratios for Zic1 and Zic2 showing predominance in the dorsal lineage from stem cells to neurons. The values plotted in graphs represent for each time point the log2 average of dorsal/lateral intensity value of all different experimental repetitions. B, Microarray fluorescence intensity value at different time points of postnatal OB neurogenesis in the dorsal (d) and lateral (l) lineages for all five members of the Zic family. C, qRT-PCR analysis for Zic1 and Zic2 expression in microdissected tissue isolated from neonate and adult brains. This validated the dorsal over lateral predominance of both Zic transcripts in neonates. This predominance is maintained at adult stages. Error bars represent the variation between samples (neonate: n = 4, 2 animals/sample, pZic1 = 0.0102, pZic2 = 0.0318; adult: n = 5, 1 animal/sample, pZic1 = 0.0047, pZic2 = 0.0083). D, E, Immunohistochemistry using anti-pan Zic (D) and anti-Zic2 antibody (E) on coronal neonate (P2) brain sections. Comparable reactivity for both antibodies is detected in the medial (D1, E1) and dorsal (D2, E2) stem cell compartment lining the lateral ventricle (lv) but absent from the lateral wall (D3, E3). F, Anti pan-Zic immunohistochemistry on a P4 OB section. Strongly pan-Zic-positive cells are abundant in the GL (boxed area) but absent from the inner OB layers. ctx, cortex; sp, septum; st, striatum; EPL, external plexiform layer; MCL: mitral cell layer. Scale bars: D, E, 150 μm for left panel and 60 μm for right panels; F, 300 μm and 200μm in inset. Error bars represent SEM. *p ≤ 0.05, **p ≤ 0.01.
We used a pan-Zic antibody (Borghesani et al., 2002) to investigate expression at the protein level. At P2 Zic-immunoreactivity was strongest along the medial wall in agreement with previous observations (Inoue et al., 2007; Merkle et al., 2014; Fig. 2D, D1). In the dorsal aspect Zic-immunoreactivity was also present but at lower levels (Fig. 2D, D2). Expression was absent from the lateral ventricular wall (Fig. 2D, D3). Immunostaining of P2 tissue using a Zic2-specific antibody (Brown et al., 2003) showed a highly comparable pattern to pan-Zic along the ventricular walls (Fig. 2E). In the OB, pan-Zic-positive cells were predominantly found in the GL and the superficial GCL (Fig. 2F).
We aimed at characterizing the cell types that expressed Zic-protein in the dorsal wall. Zic-protein in this compartment was found in cells with radial glia morphology in agreement with our gene expression data (compare Figs. 3A, 1C). Moreover, at P2 8.2% of Zic-positive cells in the dorsal V/SVZ were Ki67-positive (Fig. 3B). In the RMS, when both dorsal and lateral precursors migrate together toward the OB, only neuroblasts that were labeled by dorsal electroporation showed Zic expression (Fig. 3C). After arrival in the GL of the OB, 35.0% of the dorsally labeled neurons expressed Zic-protein (Fig. 3D). Less than 1% of these expressed TH (Fig. 3D,E; Merkle et al., 2014). However, 77.9% of the Zic+ population expressed CR, therefore representing a subclass of GABAergic neurons (Fig. 3D,F). Thus, based on the combined use of gene expression data and immunohistochemical analyses we conclude that Zic1 and Zic2 proteins are expressed in a subpopulation of the dorsal neurogenic lineage from stem cells to neurons. In the OB, both proteins are present in the majority of dorsally labeled CR GABAergic interneurons, but absent from labeled TH-expressing cells.
Figure 3.
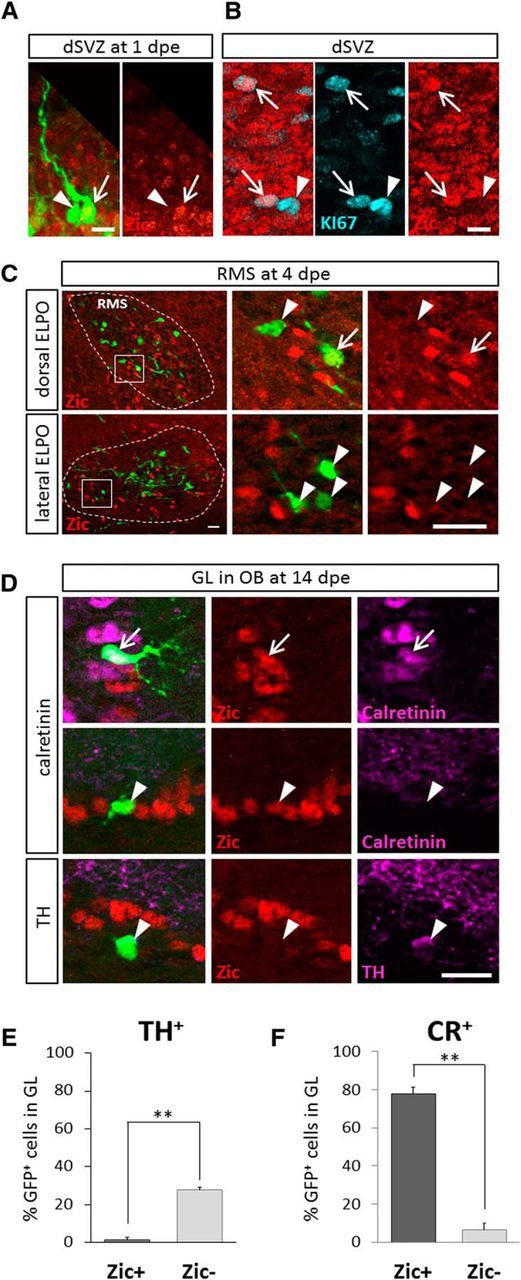
Zic-protein is expressed in the CR-positive GABAergic lineage but absent from dopaminergic neurons. A, B, In the dorsal V/SVZ, Zic protein is expressed in GFP-electroporated radial glia (A) at 1 dpe and in KI67+ dividing progenitors (B) at P2. C, In the RMS at 4dpe a subpopulation of GFP+ cells showed Zic immunoreactivity after dorsal electroporation. Lateral electroporation did not lead to labeled Zic+ cells in the RMS. D, In the GL of the OB, 14 d after dorsal electroporation the majority of Zic+ PGC coexpressed CR (top lane). However, some Zic+ cells were negative for CR (middle lane) but Zic-immunoreactivity was never found in TH-expressing PGC (bottom lane). A–D, Arrows indicate double- and arrowheads single-labeled cells. E, F, Quantification of TH and CR expression among Zic+ or Zic− GFP cells of the GL at 21 dpe obtained in two independent experiments. Histograms represent the mean per section calculated over randomly selected sections (TH: n = 4, p = 0.0094; CR: n = 5, p = 0.0047; 2–3 sections per animal). Scale bars: A, B, 15 μm; C, D, 20 μm. Error bars represent SEM of intersection variations. **p ≤ 0.01.
This pattern prompted us to investigate the function of Zic proteins in the regulation of dopaminergic versus CR-GABAergic identity of dorsally generated OB interneurons. We used targeted in vivo brain electroporation to introduce a Zic1 expression plasmid based on the constitutively active β-actin promoter (CAGGS-Zic1) into the dorsal stem cell compartment (together with a GFP reporter plasmid). At 14 dpe, when transfected cells arrived in the OB and started their differentiation, the number of CR+GFP+ PGC was significantly increased (Fig. 4A,G). In contrast, shRNA-mediated knockdown of Zic1 (shZic1) induced a significant loss of CR+GFP+ interneurons (Fig. 4B,G). In the next step we investigated the impact of Zic1 alteration on dopaminergic differentiation. Dorsal electroporation of CAGGS-Zic1 induced a significant loss of TH-expressing neurons in the OB at both, 14 dpe and 21 dpe (Fig. 4C,G). Moreover, Zic1 loss-of-function significantly increased the amount of dopaminergic neurons at 21 dpe (Fig. 4D,G).
Figure 4.
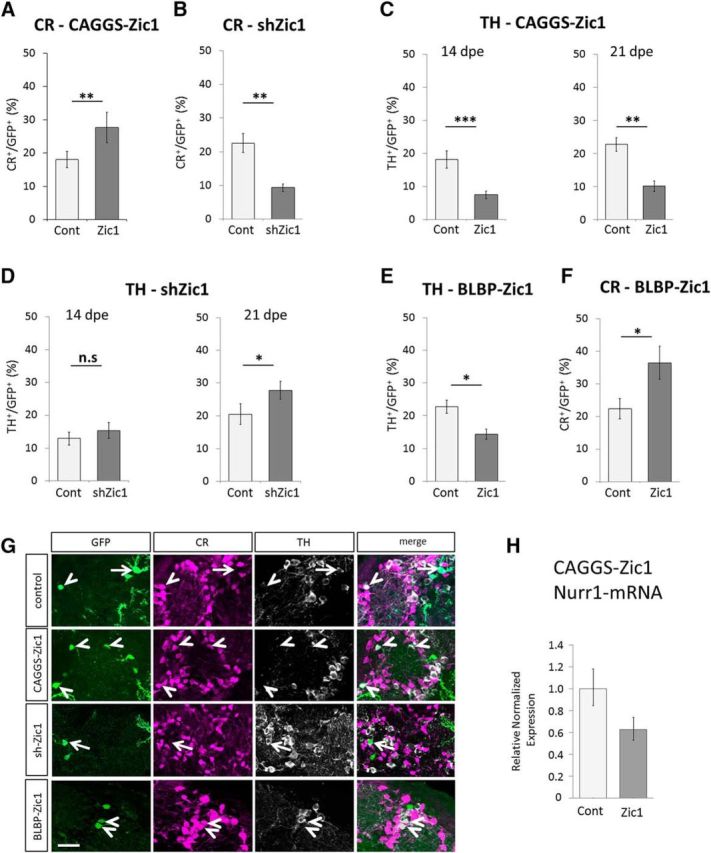
In vivo functional analyses of Zic1. A, Zic1 overexpression via in vivo brain electroporation increases the amount of CR GABAergic-expressing neurons in the OB at 14 dpe (3 independent experiments; animals: ncontrol = 17, nCAGGS-Zic1 = 17; cells: ncontrol = 1432, nCAGGS-Zic1 = 907; p = 0.0055). B, shRNA-induced Zic1 knockdown significantly reduces CR neurons in the OB at 14 dpe (2 independent experiments, animals: ncontrol = 7, nshZic1 = 8; cells: ncontrol = 537, nshZic1 = 573; p = 0.0056). C, Overexpression of Zic1 in the dorsal compartment decreases dopaminergic neurons at 14 and 21 dpe (14 dpe: 2 independent experiments, animals: ncontrol = 14, nCAGGS-Zic1 = 15; cells: ncontrol = 918, nCAGGS-Zic1 = 656, p = 0.0005; 21 dpe: 1 experiment, animals: ncontrol = 6, nCAGGS-Zic1 = 5; cells: ncontrol = 418, nCAGGS-Zic1 = 388, p = 0.0077). D, shRNA-induced knockdown increases dopaminergic neurons in the OB at 21 dpe but not at 14 dpe (14 dpe: 2 experiments, animals: ncontrol = 11, nshZic1 = 9; cells: ncontrol = 813, nshZic1 = 459, p = 0.4341; 21 dpe: 1 experiment, animals: ncontrol = 7, nshZic1 = 7; cells: ncontrol = 330, nshZic1 = 330, p = 0.0351). E, F, Overexpression of Zic1 under the control of the BLBP promoter reduces TH-expressing neurons in the OB at 21 dpe and increases the amount of CR+ GABAergic neurons (1 experiment, animals: ncontrol = 6, nBLBP-Zic1 = 6; cells: ncontrol = 448, nBLBP-Zic1 = 392; p for TH = 0.0358; p for CR = 0.0291). n.s.: p > 0.05, *p ≤ 0.05, **p ≤ 0.01, ***p ≤ 0.001. Error bars represent SEM. G, Representative images of TH and CR-expressing cells among the GFP electroporated GFP+ cells in the GL at 21 dpe for electroporation with the control vector, pCAGGS-Zic1, pU6-shZic1, and pBLBP-Zic1 vectors. H, qRT-PCR analysis of Nurr1 expression performed on mRNA isolated from FACS sorted SVZ cells 6 d after Zic1 overexpression. RNA samples are issued from the dissection of 10 animals. Error bars represent the variation between four technical repetitions. Arrows: CR-expressing GFP+ neurons. Arrowheads: TH-expressing GFP+ neurons. Scale bars, 20 μm.
We asked whether Zic1 induced repression of dopaminergic fate could be detected at an earlier stage of neurogenic progression. As mentioned above the nuclear receptor Nurr-1 is a regulator of TH expression and has been implicated in dopaminergic differentiation in OB neurons (Vergaño-Vera et al., 2015). We performed Zic1 gain-of-function via dorsal electroporation of CAGGS-Zic1 and isolated transfected cells from the RMS at 6dpe by microdissection and FACS. qRT-PCR analyses showed an almost 40% reduction in Nurr1 expression at the mRNA level (Fig. 4H; two independent biological replicates). This suggests that an early action of Zic1 underlies repression.
In line with this idea we asked whether transitory expression of Zic1 exclusively at early stages was sufficient to promote the CR at the expense of the TH fate. A fragment of the BLBP promoter has been shown to be strongly and transitorily expressed in RG cells but not in neurons (Schmid et al., 2006). Electroporation of an expression plasmid driving Zic1 under the control of this BLBP promoter increased the generation of CR neurons and decreased the production of TH neurons in the OB GL (Fig. 4E–G), comparable to the change observed with the constitutive actin-promoter based construct (Fig. 4A,C).
Thus, based on the combined use of gain- and loss-of-function approaches we conclude that Zic1 is an early-active neuronal fate determinant that favors generation of CR-GABAergic neurons while inhibiting generation of dopaminergic neurons on the OB.
In the next step we tested whether Zic2 had also a phenotype determining function. Gain-of-function of Zic2 significantly increased the amount of CR-expressing neurons while inhibiting dopaminergic differentiation at 21 dpe (Fig. 5A,B,D). We used a well characterized shRNA targeting Zic2 (Escalante et al., 2013) to investigate the consequences of Zic2 knockdown. However, Zic2 loss-of-function induced an accumulation of transfected cells in the SVZ/RMS with only few cells arriving in the OB precluding the analysis of neuronal phenotype (data not shown).
Figure 5.

In vivo functional analyses of Zic2. A, B, Overexpression of Zic2 by in vivo brain electroporation does not significantly change the quantity of CR neurons (A) but does not significantly change the quantity of CR neurons (B); 1 experiment, animals: ncontrol = 8, nCAGGS-Zic2 = 8; cells: ncontrol = 568, nCAGGS-Zic2 = 568; p for CR = 0.00084; p for TH = 0.0023). C, Increase in TH neurons in the OB at 21 dpe after Zic1 knockdown was rescued by overexpression of Zic2 (1 experiment, animals: ncontrol = 7, nshZic1 = 7, nshZic1+CAGGS-Zic2 = 8; cells: ncontrol = 330, nshZic1 = 330, nshZic1+CAGGS-Zic2 = 290; p value Cont vs shZic1 = 0.0351, p value shZic1 vs shZic1+CAGGS-Zic2 = 0.0127). n.s.: p > 0.05, *p ≤ 0.05, **p ≤ 0.01, ***p ≤ 0.001. Error bars represent SEM. D, Representative images of TH and CR-expressing cells among the GFP electroporated GFP+ cells in the GL at 21 dpe, for electroporation with the control vector, pCAGGS-Zic2 vector, and pU6-shZic1 together with pCAGGS-Zic2. Arrows: CR-expressing GFP+ neurons. Arrowheads: TH-expressing GFP+ neurons. Scale bar, 20 μm.
The gain-of-function results indicated that Zic2 and Zic1 have overlapping functions in CR versus TH fate decisions in PGCs. To demonstrate this parallel roles we performed electroporation experiments, combining the Zic1 knockdown and the Zic2 overexpression vectors. We observed that Zic2 expression significantly reduced the increased TH levels observed after Zic1 knockdown (Fig. 5C,D). Together these results demonstrate that Zic1 and Zic2 are both capable to induce CR-GABAergic fate while repressing the generation of dopaminergic neurons.
The Zic factor REF-2 represses dopaminergic fate in C. elegans
To investigate the evolutionary conservation of Zic proteins as repressors of dopaminergic fate and to circumvent the problem of redundancy between Zic factors in mice we switched to the nematode C. elegans. C. elegans has only one transcription factor of the Zic family, called REF-2. We have previously observed that, in a null mutant for ref-2, the global organization of the nervous system is normal (Bertrand and Hobert, 2009). In addition, although a few neuronal subtypes were lost (for example the AIY cholinergic interneurons), most of the neuronal subtypes tested were unaffected. Dopaminergic neurons were not analyzed in this study.
Dopaminergic neurons are defined by the expression of a battery of terminal differentiation genes required for the synthesis, packaging and transport of dopamine. This includes dat-1 (dopamine transporter), cat-4 (GTP cyclohydrolase), and cat-2 (TH). To analyze the role of ref-2 in dopaminergic neuron specification, we first used a loss-of-function approach. Wild-type C. elegans larvae have six dopaminergic neurons in the head (2 ADE neurons and 4 CEP neurons), which are generated during embryogenesis. Importantly, in a null mutant for ref-2, one or two additional neurons expressing a dopaminergic marker were observed in the dorsal part of the head (Fig. 6A). These neurons expressed the dopaminergic markers dat-1 and cat-4, but not cat-2 (Fig. 6A–C), suggesting that they acquire only a partial dopaminergic fate. In addition, ubiquitous overexpression of ref-2 during embryogenesis using a heat shock promoter strongly inhibited the formation of dopaminergic neurons in the head (Fig. 6D). Thus, like in mice, a Zic protein represses dopaminergic fate in C. elegans.
We then investigated the origin of the ectopic “dopaminergic-like” (DA-like) neurons observed in ref-2 loss of function mutants. As the dopaminergic neuron lineages in the wild-type contain cell death events, we first tested whether the ectopic DA-like neurons in ref-2 mutants resulted from survival of cells that normally die. When cell death was blocked, using a mutation in the cell death gene ced-4, ectopic DA-like neurons were also observed, but in this case they were always located in a distinct, ventral, region of the head. Moreover, the effect of ref-2 and ced-4 mutants was additive, with the appearance of ectopic DA-like neurons in both, the dorsal and ventral head regions (Fig. 6E), altogether indicating that the appearance of ectopic DA-like neurons observed in ref-2 mutants was not a result of a reduced cell death.
Next, we investigated whether the appearance of the ectopic DA-like neurons was the result of a conversion of some non-dopaminergic neurons to a dopaminergic fate. The ectopic DA-like neurons observed in ref-2 mutants are located just posterior to the pairs of cholinergic neurons IL2 dorsal and URA dorsal (Fig. 6F). This corresponds to the location, in wild-type animals, of the pairs of glutamatergic neurons IL1 dorsal and URY dorsal. In addition, in ref-2 mutants, we observed a loss of the URY neuron marker ser-1 and the IL1 neuron marker flp-3 (Fig. 6H,I), whereas the expression of the IL2 neuron marker klp-6 was unaffected (Fig. 6J). Finally, ref-2 is expressed in the URY and IL1 lineages but not in the dopaminergic lineages during embryogenesis (Murray et al., 2012), and we observed that during larval and adult stages ref-2 expression in the head is restricted to only six neurons, corresponding to the six IL1 neurons (2 dorsal, 2 lateral, and 2 ventral; Fig. 6G and data not shown). Together, these data suggest that the ectopic DA-like neurons observed in ref-2 mutants were a result of a cell fate switch of the dorsal IL1 and/or dorsal URY neurons from a non-dopaminergic to a dopaminergic phenotype.
In conclusion, in mice and C. elegans a Zic protein represses dopaminergic fate in defined non-dopaminergic neurons.
Discussion
Based on a high-resolution gene expression screen in space and time during postnatal OB neurogenesis we show here that the dorsal and lateral lineages that generate interneurons for the OB during postnatal stages maintain molecular signatures of the embryonic pallium and subpallium. In the postnatal dorsal lineages Zic1 and Zic2 are superposed over the existing program and control neuronal phenotype by repressing dopaminergic fate and favoring the generation of CR GABAergic neurons. This anti-dopaminergic function of Zic-proteins is evolutionary conserved and also present in C. elegans.
Our gene expression screen resulted in the first two-dimensional gene-expression matrix that includes the spatial and the temporal components of the postnatal neurogenic system. So far such studies addressed gene expression either in static situations or during individual steps in the temporal sequence that leads to new OB neurons. Pennartz et al. (2004) investigated gene expression in migratory type A cells isolated from the RMS on the basis of PSA-NCAM expression. In another study neuronal precursors and mature neurons from the periglomerular neuron lineage were isolated and analyzed by microarray (Boutin et al., 2010). Other, more recent transcriptomic studies focused on the first steps in the neurogenic process and the switch from silent to activated neural stem cells at the population (Beckervordersandforth et al., 2010; Codega et al., 2014) and at the single cell levels (Llorens-Bobadilla et al., 2015). Only recently, work addressed transcriptomic differences between spatially separated stem cell and progenitor pools (Azim et al., 2015).
Our study provides the first systematic insight into gene expression changes during all steps of the neurogenic sequence, from stem cells in the V/SVZ over amplification and migratory stages to neurons. In addition, at each of these steps we compare two stem cell pools and their lineages that generate different types of OB neurons. This provides a unique resource for the identification of regulators and molecular cascades that control stem cell identity, their activation, and their progression toward functional neurons. Moreover, this resource allows the identification of fate determinants that are active at the stem cell level, but also those that act at the post-stem cell stage. Finally, a major advantage of our electroporation-based approach is that functional studies aiming at determining the in vivo function of identified candidates are based on the same technology, and therefore targeting the same cell types and differentiation steps, that we used for the screening process. This is well illustrated by our work on Zic1 and Zic2.
Neuronal diversity in the postnatal OB is based on the existence of predetermined neural stem cells organized in subregions of the postnatal ventricular walls (Merkle and Alvarez-Buylla, 2006; Merkle et al., 2007, 2014). This regionalization is already established during early time points of forebrain development (Fuentealba et al., 2015), when subsets of stem cells appear to be set aside in the cortex, striatum and septum. After birth these cells enter the neurogenic cycle and produce new neurons that migrate into the OB and integrate. Of particular interest in this context is the dorsal aspect of the postnatal neurogenic compartment, which is mainly derived from the developing cortex (Fuentealba et al., 2015). Our lineage studies in this compartment clearly identify a cortical signature with most major players in place, including Pax6, Tbr1/2, Emx1/2, and Ngn1/2. This is in agreement with a cortical descent. Whereas the lateral (striatal) and medial (septal) walls generate exclusively GABAergic neurons, the dorsal aspect shows a high degree of heterogeneity. Although still generating low amounts of glutamatergic neurons, it produces mainly large numbers of GABAergic and dopaminergic neurons. Thus, it can be expected that new combinations of transcription factors occur in this compartment, superposed over the pre-existing cortical program, that allow the acquisition of new phenotypic traits.
One such example is Dlx2, a distal-less homeodomain protein that is expressed in the ventrolateral forebrain, the subpallial ganglionic eminences, and that in the embryo is involved the generation of cortical interneurons (Anderson et al., 1999). However, at postnatal stages Dlx2 is expressed in the dopaminergic lineage of the OB GL, and is interacting with Pax6 to induce this neurotransmitter phenotype (Brill et al., 2008; de Chevigny et al., 2012b). Thus, introduction of a subpallial gene into the pallial lineage is necessary for the appearance of a new neuron type for the postnatal OB.
The situation shows parallels to what we find for Zic-proteins. Like Dlx2, Zic-proteins are expressed in the Pax6-expressing dorsal stem cell compartment and control neuronal fate in OB PGC. Within this population the majority of Zic-positive neurons were of the CR+ GABAergic phenotype, whereas Zic-proteins were absent from dopaminergic neurons. Our functional work clearly demonstrates that Zic1 and Zic2 are able to repress dopaminergic fate and to induce the second major population derived from the dorsal aspect, GABAergic CR-expressing neurons. We conclude that Zic1 and Zic2 are used in the postnatal dorsal stem cell compartment to induce new phenotypic traits in the form of CR+ GABAergic PGC, comparable to the introduction of the subpallial factor Dlx2 in the dorsal dopaminergic lineage.
There is a deep phylogenetic conservation of the gene regulatory networks specifying the dopaminergic fate between mice and C. elegans. The dopamine biosynthetic pathway in both species is very similar (Flames and Hobert, 2011) and nematode mutants can be rescued by introducing the corresponding human ortholog (Duerr et al., 1999). In addition, dopaminergic neurons in C. elegans and in the mouse olfactory bulb express similar combinations of transcription factors, including Ets, Dlx, and Pbx proteins (Flames and Hobert, 2009; Doitsidou et al., 2013). Our finding that Zic proteins function as repressors of dopaminergic fate in worm and mouse represents further support for the deep conservation of the gene regulatory networks specifying this neurotransmitter phenotype. It will be important in the future to characterize the biochemical mechanism by which Zic proteins repress dopaminergic fate in both organisms.
Footnotes
This work was supported by the Agence National pour la Recherche (ANR), Fondation de France (FDF), and France Parkinson to H.C., the Fondation pour la Recherche sur le Cerveau (FRC) to H.C. and V.B., the European Commission MSC Program (IAPP Dopanew) to H.C. and A.B., the CNRS ATIP program to V.B.; work in the laboratory of E.H. is supported by the following Grants: Prometeo 2012-005, BFU2010-16563, and ERC2011-StG201001109. We thank P. Follert for help with microdissection, L. Miranda for technical assistance, C. Couillault for help with the C. elegans injections, Aude Barani from the Regional Flow Cytometry Platform for Microbiology (PRECYM) of the Mediterranean Institute of Oceanography (MIO) for FACS, R. Segal for ZIC-specific antibody, the France-BioImaging/PICsL infrastructure (ANR-10-INSB-04-01) and IBDM animal facilities, and the Caenorhabditis Genetics Center, M. Barr, J. Dent, and S. Alper for C. elegans strains and plasmids.
The authors declare no competing financial interests.
References
- Ali RG, Bellchambers HM, Arkell RM (2012) Zinc fingers of the cerebellum (Zic): transcription factors and co-factors. Int J Biochem Cell Biol 44:2065–2068. 10.1016/j.biocel.2012.08.012 [DOI] [PubMed] [Google Scholar]
- Alper S, Kenyon C (2002) The zinc finger protein REF-2 functions with the Hox genes to inhibit cell fusion in the ventral epidermis of C. elegans. Development 129:3335–3348. [DOI] [PubMed] [Google Scholar]
- Alvarez-Buylla A, Garcia-Verdugo JM (2002) Neurogenesis in adult subventricular zone. J Neurosci 22:629–634. [DOI] [PMC free article] [PubMed] [Google Scholar]
- Alvarez-Buylla A, Kohwi M, Nguyen TM, Merkle FT (2008) The heterogeneity of adult neural stem cells and the emerging complexity of their niche. Cold Spring Harb Symp Quant Biol 73:357–365. 10.1101/sqb.2008.73.019 [DOI] [PubMed] [Google Scholar]
- Anderson DJ, Groves A, Lo L, Ma Q, Rao M, Shah NM, Sommer L (1997a) Cell lineage determination and the control of neuronal identity in the neural crest. Cold Spring Harb Symp Quant Biol 62:493–504. 10.1101/SQB.1997.062.01.056 [DOI] [PubMed] [Google Scholar]
- Anderson SA, Qiu M, Bulfone A, Eisenstat DD, Meneses J, Pedersen R, Rubenstein JL (1997b) Mutations of the homeobox genes Dlx-1 and Dlx-2 disrupt the striatal subventricular zone and differentiation of late born striatal neurons. Neuron 19:27–37. 10.1016/S0896-6273(00)80345-1 [DOI] [PubMed] [Google Scholar]
- Anderson S, Mione M, Yun K, Rubenstein JL (1999) Differential origins of neocortical projection and local circuit neurons: role of Slx genes in neocortical interneuronogenesis. Cereb Cortex 9:646–654. 10.1093/cercor/9.6.646 [DOI] [PubMed] [Google Scholar]
- Azim K, Hurtado-Chong A, Fischer B, Kumar N, Zweifel S, Taylor V, Raineteau O (2015) Transcriptional hallmarks of heterogeneous neural stem cell niches of the subventricular zone. Stem Cells 33:2232–2242. 10.1002/stem.2017 [DOI] [PubMed] [Google Scholar]
- Beckervordersandforth R, Tripathi P, Ninkovic J, Bayam E, Lepier A, Stempfhuber B, Kirchhoff F, Hirrlinger J, Haslinger A, Lie DC, Beckers J, Yoder B, Irmler M, Götz M (2010) In vivo fate mapping and expression analysis reveals molecular hallmarks of prospectively isolated adult neural stem cells. Cell Stem Cell 7:744–758. 10.1016/j.stem.2010.11.017 [DOI] [PubMed] [Google Scholar]
- Bertrand V, Hobert O (2009) Linking asymmetric cell division to the terminal differentiation program of postmitotic neurons in C. elegans. Dev Cell 16:563–575. 10.1016/j.devcel.2009.02.011 [DOI] [PMC free article] [PubMed] [Google Scholar]
- Bishop KM, Rubenstein JL, O'Leary DD (2002) Distinct actions of Emx1, Emx2, and Pax6 in regulating the specification of areas in the developing neocortex. J Neurosci 22:7627–7638. [DOI] [PMC free article] [PubMed] [Google Scholar]
- Borghesani PR, Peyrin JM, Klein R, Rubin J, Carter AR, Schwartz PM, Luster A, Corfas G, Segal RA (2002) BDNF stimulates migration of cerebellar granule cells. Development 129:1435–1442. [DOI] [PubMed] [Google Scholar]
- Bormuth I, Yan K, Yonemasu T, Gummert M, Zhang M, Wichert S, Grishina O, Pieper A, Zhang W, Goebbels S, Tarabykin V, Nave KA, Schwab MH (2013) Neuronal basic helix-loop-helix proteins Neurod2/6 regulate cortical commissure formation before midline interactions. J Neurosci 33:641–651. 10.1523/JNEUROSCI.0899-12.2013 [DOI] [PMC free article] [PubMed] [Google Scholar]
- Boutin C, Diestel S, Desoeuvre A, Tiveron MC, Cremer H (2008) Efficient in vivo electroporation of the postnatal rodent forebrain. PLoS One 3:e1883. 10.1371/journal.pone.0001883 [DOI] [PMC free article] [PubMed] [Google Scholar]
- Boutin C, Hardt O, de Chevigny A, Coré N, Goebbels S, Seidenfaden R, Bosio A, Cremer H (2010) NeuroD1 induces terminal neuronal differentiation in olfactory neurogenesis. Proc Natl Acad Sci U S A 107:1201–1206. 10.1073/pnas.0909015107 [DOI] [PMC free article] [PubMed] [Google Scholar]
- Bovetti S, Bonzano S, Garzotto D, Giannelli SG, Iannielli A, Armentano M, Studer M, De Marchis S (2013) COUP-TFI controls activity-dependent tyrosine hydroxylase expression in adult dopaminergic olfactory bulb interneurons. Development 140:4850–4859. 10.1242/dev.089961 [DOI] [PubMed] [Google Scholar]
- Brill MS, Snapyan M, Wohlfrom H, Ninkovic J, Jawerka M, Mastick GS, Ashery-Padan R, Saghatelyan A, Berninger B, Götz M (2008) A Dlx2- and Pax6-dependent transcriptional code for periglomerular neuron specification in the adult olfactory bulb. J Neurosci 28:6439–6452. 10.1523/JNEUROSCI.0700-08.2008 [DOI] [PMC free article] [PubMed] [Google Scholar]
- Brill MS, Ninkovic J, Winpenny E, Hodge RD, Ozen I, Yang R, Lepier A, Gascón S, Erdelyi F, Szabo G, Parras C, Guillemot F, Frotscher M, Berninger B, Hevner RF, Raineteau O, Götz M (2009) Adult generation of glutamatergic olfactory bulb interneurons. Nat Neurosci 12:1524–1533. 10.1038/nn.2416 [DOI] [PMC free article] [PubMed] [Google Scholar]
- Britz O, Mattar P, Nguyen L, Langevin LM, Zimmer C, Alam S, Guillemot F, Schuurmans C (2006) A role for proneural genes in the maturation of cortical progenitor cells. Cereb Cortex 16:i138–151. 10.1093/cercor/bhj168 [DOI] [PubMed] [Google Scholar]
- Brown LY, Kottmann AH, Brown S (2003) Immunolocalization of Zic2 expression in the developing mouse forebrain. Gene Expr Patterns 3:361–367. 10.1016/S1567-133X(03)00043-7 [DOI] [PubMed] [Google Scholar]
- Chou SJ, O'Leary DD (2013) Role for Lhx2 in corticogenesis through regulation of progenitor differentiation. Mol Cell Neurosci 56:1–9. 10.1016/j.mcn.2013.02.006 [DOI] [PMC free article] [PubMed] [Google Scholar]
- Cobos I, Long JE, Thwin MT, Rubenstein JL (2006) Cellular patterns of transcription factor expression in developing cortical interneurons. Cereb Cortex 16:i82–88. 10.1093/cercor/bhk003 [DOI] [PubMed] [Google Scholar]
- Codega P, Silva-Vargas V, Paul A, Maldonado-Soto AR, Deleo AM, Pastrana E, Doetsch F (2014) Prospective identification and purification of quiescent adult neural stem cells from their in vivo niche. Neuron 82:545–559. 10.1016/j.neuron.2014.02.039 [DOI] [PMC free article] [PubMed] [Google Scholar]
- de Chevigny A, Coré N, Follert P, Gaudin M, Barbry P, Béclin C, Cremer H (2012a) miR-7a regulation of Pax6 controls spatial origin of forebrain dopaminergic neurons. Nat Neurosci 15:1120–1126. 10.1038/nn.3142 [DOI] [PubMed] [Google Scholar]
- de Chevigny A, Core N, Follert P, Wild S, Bosio A, Yoshikawa K, Cremer H, Beclin C (2012b) Dynamic expression of the pro-dopaminergic transcription factors Pax6 and Dlx2 during postnatal olfactory bulb neurogenesis. Front Cell Neurosci 6:6. 10.3389/fncel.2012.00006 [DOI] [PMC free article] [PubMed] [Google Scholar]
- Dixit R, Wilkinson G, Cancino GI, Shaker T, Adnani L, Li S, Dennis D, Kurrasch D, Chan JA, Olson EC, Kaplan DR, Zimmer C, Schuurmans C (2014) Neurog1 and Neurog2 control two waves of neuronal differentiation in the piriform cortex. J Neurosci 34:539–553. 10.1523/JNEUROSCI.0614-13.2014 [DOI] [PMC free article] [PubMed] [Google Scholar]
- Doitsidou M, Flames N, Topalidou I, Abe N, Felton T, Remesal L, Popovitchenko T, Mann R, Chalfie M, Hobert O (2013) A combinatorial regulatory signature controls terminal differentiation of the dopaminergic nervous system in C. elegans. Genes Dev 27:1391–1405. 10.1101/gad.217224.113 [DOI] [PMC free article] [PubMed] [Google Scholar]
- Duerr JS, Frisby DL, Gaskin J, Duke A, Asermely K, Huddleston D, Eiden LE, Rand JB (1999) The cat-1 gene of Caenorhabditis elegans encodes a vesicular monoamine transporter required for specific monoamine-dependent behaviors. J Neurosci 19:72–84. [DOI] [PMC free article] [PubMed] [Google Scholar]
- Englund C, Fink A, Lau C, Pham D, Daza RA, Bulfone A, Kowalczyk T, Hevner RF (2005) Pax6, Tbr2, and Tbr1 are expressed sequentially by radial glia, intermediate progenitor cells, and postmitotic neurons in developing neocortex. J Neurosci 25:247–251. 10.1523/JNEUROSCI.2899-04.2005 [DOI] [PMC free article] [PubMed] [Google Scholar]
- Escalante A, Murillo B, Morenilla-Palao C, Klar A, Herrera E (2013) Zic2-dependent axon midline avoidance controls the formation of major ipsilateral tracts in the CNS. Neuron 80:1392–1406. 10.1016/j.neuron.2013.10.007 [DOI] [PubMed] [Google Scholar]
- Fiorelli R, Azim K, Fischer B, Raineteau O (2015) Adding a spatial dimension to postnatal ventricular-subventricular zone neurogenesis. Development 142:2109–2120. 10.1242/dev.119966 [DOI] [PubMed] [Google Scholar]
- Flames N, Hobert O (2009) Gene regulatory logic of dopamine neuron differentiation. Nature 458:885–889. 10.1038/nature07929 [DOI] [PMC free article] [PubMed] [Google Scholar]
- Flames N, Hobert O (2011) Transcriptional control of the terminal fate of monoaminergic neurons. Annu Rev Neurosci 34:153–184. 10.1146/annurev-neuro-061010-113824 [DOI] [PubMed] [Google Scholar]
- Fuentealba LC, Rompani SB, Parraguez JI, Obernier K, Romero R, Cepko CL, Alvarez-Buylla A (2015) Embryonic origin of postnatal neural stem cells. Cell 161:1644–1655. 10.1016/j.cell.2015.05.041 [DOI] [PMC free article] [PubMed] [Google Scholar]
- García-Frigola C, Carreres MI, Vegar C, Mason C, Herrera E (2008) Zic2 promotes axonal divergence at the optic chiasm midline by EphB1-dependent and -independent mechanisms. Development 135:1833–1841. 10.1242/dev.020693 [DOI] [PubMed] [Google Scholar]
- Gentleman RC, Carey VJ, Bates DM, Bolstad B, Dettling M, Dudoit S, Ellis B, Gautier L, Ge Y, Gentry J, Hornik K, Hothorn T, Huber W, Iacus S, Irizarry R, Leisch F, Li C, Maechler M, Rossini AJ, Sawitzki G, et al. (2004) Bioconductor: open software development for computational biology and bioinformatics. Genome Biol 5:R80. 10.1186/gb-2004-5-10-r80 [DOI] [PMC free article] [PubMed] [Google Scholar]
- Guillemot F. (2007) Spatial and temporal specification of neural fates by transcription factor codes. Development 134:3771–3780. 10.1242/dev.006379 [DOI] [PubMed] [Google Scholar]
- Guillemot F, Lo LC, Johnson JE, Auerbach A, Anderson DJ, Joyner AL (1993) Mammalian achaete-scute homolog 1 is required for the early development of olfactory and autonomic neurons. Cell 75:463–476. 10.1016/0092-8674(93)90381-Y [DOI] [PubMed] [Google Scholar]
- Hack MA, Saghatelyan A, de Chevigny A, Pfeifer A, Ashery-Padan R, Lledo PM, Götz M (2005) Neuronal fate determinants of adult olfactory bulb neurogenesis. Nat Neurosci 8:865–872. 10.1038/nn1479 [DOI] [PubMed] [Google Scholar]
- Hallonet M, Hollemann T, Pieler T, Gruss P (1999) Vax1, a novel homeobox-containing gene, directs development of the basal forebrain and visual system. Genes Dev 13:3106–3114. 10.1101/gad.13.23.3106 [DOI] [PMC free article] [PubMed] [Google Scholar]
- Hevner RF, Hodge RD, Daza RA, Englund C (2006) Transcription factors in glutamatergic neurogenesis: conserved programs in neocortex, cerebellum, and adult hippocampus. Neurosci Res 55:223–233. 10.1016/j.neures.2006.03.004 [DOI] [PubMed] [Google Scholar]
- Huang J, Zhong Z, Wang M, Chen X, Tan Y, Zhang S, He W, He X, Huang G, Lu H, Wu P, Che Y, Yan YL, Postlethwait JH, Chen W, Wang H (2015) Circadian modulation of dopamine levels and dopaminergic neuron development contributes to attention deficiency and hyperactive behavior. J Neurosci 35:2572–2587. 10.1523/JNEUROSCI.2551-14.2015 [DOI] [PMC free article] [PubMed] [Google Scholar]
- Inoue T, Ota M, Ogawa M, Mikoshiba K, Aruga J (2007) Zic1 and Zic3 regulate medial forebrain development through expansion of neuronal progenitors. J Neurosci 27:5461–5473. 10.1523/JNEUROSCI.4046-06.2007 [DOI] [PMC free article] [PubMed] [Google Scholar]
- Joshi PS, Molyneaux BJ, Feng L, Xie X, Macklis JD, Gan L (2008) Bhlhb5 regulates the postmitotic acquisition of area identities in layers II-V of the developing neocortex. Neuron 60:258–272. 10.1016/j.neuron.2008.08.006 [DOI] [PMC free article] [PubMed] [Google Scholar]
- Kohwi M, Osumi N, Rubenstein JL, Alvarez-Buylla A (2005) Pax6 is required for making specific subpopulations of granule and periglomerular neurons in the olfactory bulb. J Neurosci 25:6997–7003. 10.1523/JNEUROSCI.1435-05.2005 [DOI] [PMC free article] [PubMed] [Google Scholar]
- Li S, Yin M, Liu S, Chen Y, Yin Y, Liu T, Zhou J (2010) Expression of ventral diencephalon-enriched genes in zebrafish. Dev Dyn 239:3368–3379. 10.1002/dvdy.22467 [DOI] [PubMed] [Google Scholar]
- Lin W, Metzakopian E, Mavromatakis YE, Gao N, Balaskas N, Sasaki H, Briscoe J, Whitsett JA, Goulding M, Kaestner KH, Ang SL (2009) Foxa1 and Foxa2 function both upstream of and cooperatively with Lmx1a and Lmx1b in a feedforward loop promoting mesodiencephalic dopaminergic neuron development. Dev Biol 333:386–396. 10.1016/j.ydbio.2009.07.006 [DOI] [PubMed] [Google Scholar]
- Llorens-Bobadilla E, Zhao S, Baser A, Saiz-Castro G, Zwadlo K, Martin-Villalba A (2015) Single-cell transcriptomics reveals a population of dormant neural stem cells that become activated upon brain injury. Cell Stem Cell 17:329–340. 10.1016/j.stem.2015.07.002 [DOI] [PubMed] [Google Scholar]
- May RB, Hunter MA (1993) Some advantages of permutation tests. Can Psychol 34:401–407. 10.1037/h0078862 [DOI] [Google Scholar]
- Merkle FT, Alvarez-Buylla A (2006) Neural stem cells in mammalian development. Curr Opin Cell Biol 18:704–709. 10.1016/j.ceb.2006.09.008 [DOI] [PubMed] [Google Scholar]
- Merkle FT, Mirzadeh Z, Alvarez-Buylla A (2007) Mosaic organization of neural stem cells in the adult brain. Science 317:381–384. 10.1126/science.1144914 [DOI] [PubMed] [Google Scholar]
- Merkle FT, Fuentealba LC, Sanders TA, Magno L, Kessaris N, Alvarez-Buylla A (2014) Adult neural stem cells in distinct microdomains generate previously unknown interneuron types. Nat Neurosci 17:207–214. 10.1038/nn.3610 [DOI] [PMC free article] [PubMed] [Google Scholar]
- Morin X, Jaouen F, Durbec P (2007) Control of planar divisions by the G-protein regulator LGN maintains progenitors in the chick neuroepithelium. Nat Neurosci 10:1440–1448. 10.1038/nn1984 [DOI] [PubMed] [Google Scholar]
- Murray JI, Boyle TJ, Preston E, Vafeados D, Mericle B, Weisdepp P, Zhao Z, Bao Z, Boeck M, Waterston RH (2012) Multidimensional regulation of gene expression in the C. elegans embryo. Genome Res 22:1282–1294. 10.1101/gr.131920.111 [DOI] [PMC free article] [PubMed] [Google Scholar]
- Nakatani T, Kumai M, Mizuhara E, Minaki Y, Ono Y (2010) Lmx1a and Lmx1b cooperate with Foxa2 to coordinate the specification of dopaminergic neurons and control of floor plate cell differentiation in the developing mesencephalon. Dev Biol 339:101–113. 10.1016/j.ydbio.2009.12.017 [DOI] [PubMed] [Google Scholar]
- Pei Z, Wang B, Chen G, Nagao M, Nakafuku M, Campbell K (2011) Homeobox genes Gsx1 and Gsx2 differentially regulate telencephalic progenitor maturation. Proc Natl Acad Sci U S A 108:1675–1680. 10.1073/pnas.1008824108 [DOI] [PMC free article] [PubMed] [Google Scholar]
- Pennartz S, Belvindrah R, Tomiuk S, Zimmer C, Hofmann K, Conradt M, Bosio A, Cremer H (2004) Purification of neuronal precursors from the adult mouse brain: comprehensive gene expression analysis provides new insights into the control of cell migration, differentiation, and homeostasis. Mol Cell Neurosci 25:692–706. 10.1016/j.mcn.2003.12.011 [DOI] [PubMed] [Google Scholar]
- Pinto L, Drechsel D, Schmid MT, Ninkovic J, Irmler M, Brill MS, Restani L, Gianfranceschi L, Cerri C, Weber SN, Tarabykin V, Baer K, Guillemot F, Beckers J, Zecevic N, Dehay C, Caleo M, Schorle H, Götz M (2009) AP2gamma regulates basal progenitor fate in a region- and layer-specific manner in the developing cortex. Nat Neurosci 12:1229–1237. 10.1038/nn.2399 [DOI] [PubMed] [Google Scholar]
- Sakurada K, Ohshima-Sakurada M, Palmer TD, Gage FH (1999) Nurr1, an orphan nuclear receptor, is a transcriptional activator of endogenous tyrosine hydroxylase in neural progenitor cells derived from the adult brain. Development 126:4017–4026. [DOI] [PubMed] [Google Scholar]
- Schmid RS, Yokota Y, Anton ES (2006) Generation and characterization of brain lipid-binding protein promoter-based transgenic mouse models for the study of radial glia. Glia 53:345–351. 10.1002/glia.20274 [DOI] [PubMed] [Google Scholar]
- Sousa VH, Miyoshi G, Hjerling-Leffler J, Karayannis T, Fishell G (2009) Characterization of Nkx6–2-derived neocortical interneuron lineages. Cereb Cortex 19:i1–10. 10.1093/cercor/bhp038 [DOI] [PMC free article] [PubMed] [Google Scholar]
- Takahashi K, Liu FC, Hirokawa K, Takahashi H (2003) Expression of Foxp2, a gene involved in speech and language, in the developing and adult striatum. J Neurosci Res 73:61–72. 10.1002/jnr.10638 [DOI] [PubMed] [Google Scholar]
- Urban S, Kobi D, Ennen M, Langer D, Le Gras S, Ye T, Davidson I (2015) A Brn2-Zic1 axis specifies the neuronal fate of retinoic-acid-treated embryonic stem cells. J Cell Sci 128:2303–2318. 10.1242/jcs.168849 [DOI] [PubMed] [Google Scholar]
- Vergaño-Vera E, Díaz-Guerra E, Rodríguez-Traver E, Méndez-Gómez HR, Solís Ó, Pignatelli J, Pickel J, Lee SH, Moratalla R, Vicario-Abejón C (2015) Nurr1 blocks the mitogenic effect of FGF-2 and EGF, inducing olfactory bulb neural stem cells to adopt dopaminergic and dopaminergic-GABAergic neuronal phenotypes. Dev Neurobiol 75:823–841. 10.1002/dneu.22251 [DOI] [PMC free article] [PubMed] [Google Scholar]
- Wang Y, Dye CA, Sohal V, Long JE, Estrada RC, Roztocil T, Lufkin T, Deisseroth K, Baraban SC, Rubenstein JL (2010) Dlx5 and Dlx6 regulate the development of parvalbumin-expressing cortical interneurons. J Neurosci 30:5334–5345. 10.1523/JNEUROSCI.5963-09.2010 [DOI] [PMC free article] [PubMed] [Google Scholar]
- Winpenny E, Lebel-Potter M, Fernandez ME, Brill MS, Götz M, Guillemot F, Raineteau O (2011) Sequential generation of olfactory bulb glutamatergic neurons by Neurog2-expressing precursor cells. Neural Dev 6:12. 10.1186/1749-8104-6-12 [DOI] [PMC free article] [PubMed] [Google Scholar]
- Zembrzycki A, Perez-Garcia CG, Wang CF, Chou SJ, O'Leary DD (2015) Postmitotic regulation of sensory area patterning in the mammalian neocortex by Lhx2. Proc Natl Acad Sci U S A 112:6736–6741. 10.1073/pnas.1424440112 [DOI] [PMC free article] [PubMed] [Google Scholar]