

Abstract
The ability to temporarily prioritize rapid and vigilant reactions over slower higher-order cognitive functions is essential for adaptive responding to threat. This reprioritization is believed to reflect shifts in resource allocation between large-scale brain networks that support these cognitive functions, including the salience and executive control networks. However, how changes in communication within and between such networks dynamically unfold as a function of threat-related arousal remains unknown. To address this issue, we collected functional MRI data and continuously assessed the heart rate from 120 healthy human adults as they viewed emotionally arousing and ecologically valid cinematographic material. We then developed an analysis method that tracks dynamic changes in large-scale network cohesion by quantifying the level of within-network and between-network interaction. We found a monotonically increasing relationship between heart rate, a physiological index of arousal, and within-network cohesion in the salience network, indicating that coordination of activity within the salience network dynamically tracks arousal. Strikingly, salience–executive control between-network cohesion peaked at moderate arousal. These findings indicate that at moderate arousal, which has been associated with optimal noradrenergic signaling, the salience network is optimally able to engage the executive control network to coordinate cognitive activity, but is unable to do so at tonically elevated noradrenergic levels associated with acute stress. Our findings extend neurophysiological models of the effects of stress-related neuromodulatory signaling at the cellular level to large-scale neural systems, and thereby explain shifts in cognitive functioning during acute stress, which may play an important role in the development and maintenance of stress-related mental disorders.
SIGNIFICANCE STATEMENT How does brain functioning change in arousing or stressful situations? Extant literature suggests that through global projections, arousal-related neuromodulatory changes can rapidly alter coordination of neural activity across brain-wide neural systems or large-scale networks. Since it is unknown how such processes unfold, we developed a method to dynamically track levels of within-network and between-network interaction. We applied this technique to human neuroimaging data acquired while participants watched realistic and emotionally arousing cinematographic material. Results demonstrate that cohesion within the salience network monotonically increases with arousal, while cohesion of this network with the executive control network peaks at moderate arousal. Our findings explain how cognitive performance shifts as a function of arousal, and provide new insights into vulnerability for stress-related psychopathology.
Keywords: arousal, functional connectivity, functional MRI, large-scale networks, stress
Introduction
During a physical attack, immediately relevant behaviors, such as identifying the location of the attacker, become very important, while responses with long-term benefits, such as processing elaborate details about the attacker, become secondary. Transiently prioritizing particular cognitive processes over others is therefore essential for responding adaptively to changing environmental conditions. Many of these processes are subserved by distinct large-scale brain networks that consist of interconnected cooperating regions, and are affected by stress and arousal. Thus, it has been proposed that changes in cognitive priorities are generated by shifts in interactions within and between networks (Hermans et al., 2011; Kinnison et al., 2012; McMenamin et al., 2014), but these shifts have not yet been examined on a moment-to-moment basis. Accordingly, we developed a novel network cohesion measure that quantifies the level of within-network and between-network interactions to examine how dynamic shifts within and between large-scale networks unfold as a function of arousal.
Through its prominent connectivity with subcortical and limbic structures involved in emotion, anxiety, reward, and motivation (Bressler and Menon, 2010), engagement of the salience network (Seeley et al., 2007) is critical in facilitating appropriate responses to stress. Acute stressors prompt the locus ceruleus (LC) to release norepinephrine (Valentino and Van Bockstaele, 2008), which then alters adrenoceptor engagement and neural function in salience network structures, such as the amygdala (Arnsten, 1998). Indeed, increased activation and connectivity within the salience network has been shown in humans in response to stress (Hermans et al., 2011; McMenamin et al., 2014). Activity within the core regions of the salience network also correlates with physiological stress indices, including increased heart rate (Wager et al., 2009). We therefore hypothesized that salience network cohesion, which quantifies the interaction among constituent network parts, would have a monotonically increasing relationship with arousal.
In contrast, the executive control network is involved in higher-order cognition, such as working memory. Many of these cognitive functions follow the Yerkes–Dodson law (Yerkes and Dodson, 1908) in that impairments in executive control and decreased responsiveness within executive control network regions occur at suboptimal and supraoptimal arousal levels, such as mental fatigue (Ishii et al., 2015) and stress (Qin et al., 2009; 2012; McMenamin et al., 2014), respectively. Relatedly, at the neurochemical level, catecholamines have an inverted-U-shaped influence on prefrontal cortex functioning (Arnsten, 2009), and corticosteroids further exacerbate negative effects when catecholamine levels are supraoptimal (Barsegyan et al., 2010). However, how arousal influences executive control network communication with other networks is unknown.
The ability of changes within one network, especially the salience network, to alter activity in other brain networks has been demonstrated in multiple studies (Sridharan et al., 2008; Chen et al., 2013; Goulden et al., 2014). With respect to stress, salience network connectivity increases while the executive control network becomes less central for communication between other networks during immediate responses to threat of shock (McMenamin et al., 2014). We thus hypothesized that executive control network cohesion, and cohesion between the salience and executive control networks would show an inverted-U-shaped relation to arousal, with the highest cohesion occurring under moderate arousal.
To test these hypotheses, we collected functional magnetic resonance imaging (fMRI) data and continuous heart rate as participants watched a movie clip that progressed from neutral to arousing and stressful. Critically, an uninterrupted movie clip is an ecologically valid method that induces and allows for assessment of the stress response in a dynamic manner. Network cohesion was then quantified within the salience and executive control networks, as well as within the default mode network, which has been implicated in stress-related disorders (Whitfield-Gabrieli and Ford, 2012). Importantly, as with other existing network measures, network cohesion indices quantify interactions within and between entire networks, rather than changes in activation within or connectivity between isolated regions. However, rather than considering possible paths of information transfer between individual nodes within or across networks, as with efficiency and betweenness measures (McMenamin et al., 2014), the network cohesion indices used here probe the tendency of all voxels within a network to become cohesive around a common activity pattern (i.e., fully connected topology). In other words, cohesion will be high if all voxels within a network display similar behavior (e.g., all voxels increase in activity). By relating these network cohesion indices to heart rate, a physiological index of arousal (Qin et al., 2009, 2012), we were able to examine how functional integrity within and between networks changes with varying levels of arousal in response to an acute stressor (Fig. 1).
Figure 1.
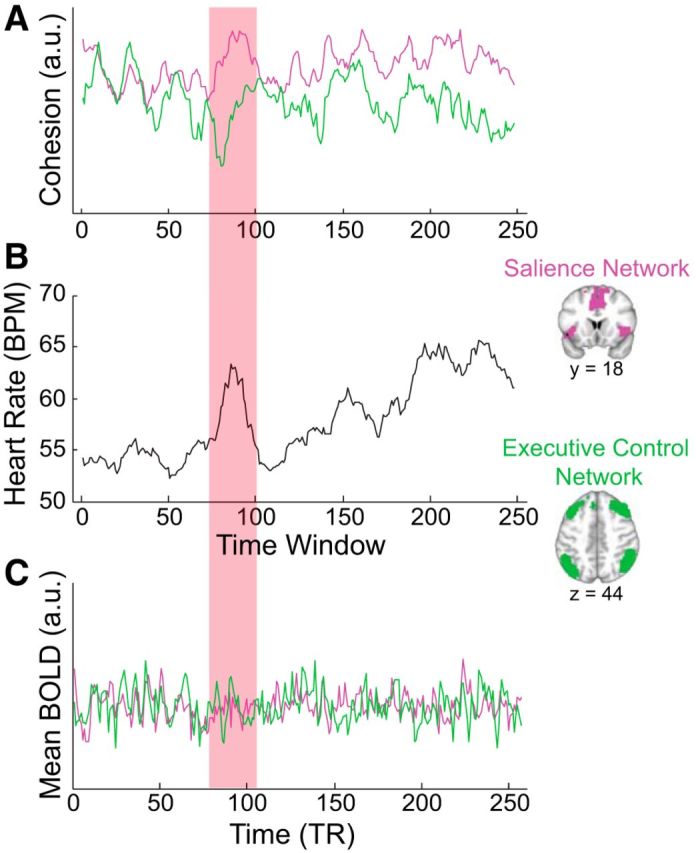
Illustration of within-network cohesion, heart rate, and mean BOLD signal for a single participant. A, B, In the time period highlighted in red, within-network cohesion for the salience network (A, pink) increases as heart rate increases (B), while within-network cohesion for the executive control network (A, green) decreases. B, C, In contrast, mean BOLD signal in the salience and executive control networks (C) are not related to heart rate (B). Note that this single participant example is for visualization purposes only, and conclusions of the paper are based on inferential statistics as described in the main text. a.u., Arbitrary units; BPM, beats per minute; TR, repetition time; BOLD, blood-oxygen-level dependent.
Materials and Methods
Participants
A total of 120 healthy adult men were recruited using a local participant database and advertisements. All participants received €60 for their participation. Exclusion criteria were assessed through self-report and consisted of a history of somatic disease, current or past psychiatric or neurological disorders, medication or illicit drug use during the preceding 6 months, history of substance abuse, current or past alcohol dependence, and MRI contraindications. Women were excluded from this study because of the influence of the menstrual cycle on correlates of the stress response (Fernández et al., 2003) and because of difficulties in repeated testing controlling for menstrual cycle. Heart rate and fMRI analyses excluded five participants due to missing heart rate data and three participants due to excessive motion (see below). Thus, 112 participants (mean age ± SD: 22.0 ± 2.7 years) made up the total sample included in analyses for this study. All procedures were approved by the local medical ethical review board (CMO Region Arnhem-Nijmegen, The Netherlands).
An independent sample of 16 healthy men was recruited to provide dynamic arousal and valence ratings for the stress movie clip. One participant was excluded due to an error during data collection. Participants (mean age ± SD: 24.7 ± 4.0 years) watched the stress movie clip three times. During the first viewing, participants were instructed to watch the movie from an eye-witness perspective, and to try to remember how they felt during the clip. During the second viewing, participants were presented with the Self-Assessment Manikin (SAM) arousal dimensions (Bradley and Lang, 1994), and were instructed to recollect and indicate their arousal levels when they watched the movie for the first time. During the third viewing, participants were instructed to recall and rate their valence levels when they watched the movie for the first time using the SAM valence dimension (Bradley and Lang, 1994). Test–retest procedures showing high moment-by-moment correlations across sessions have demonstrated reliability and validity of retrospective affect ratings of movie clips (Raz et al., 2012).
Procedure
All participants completed two counterbalanced sessions (stress and control) separated by ≥5 d. Only data from the stress session were used for fMRI analyses reported in this study. All procedures were standardized as much as possible to minimize between-subject variance. All sessions took place between noon and 6:00 P.M. to minimize the influence of diurnal variation on cortisol levels. Participants arrived 1 h before the MRI session to avoid fluctuations in cortisol levels due to physical activity. During this hour, participants practiced the scanner tasks, watched a low-arousal nature documentary (Attenborough, 2010), and were escorted to the scanning facility.
In the MRI scanner, participants watched the back-projected stress movie clip, which consisted of violent sexual assault scenes from Irréversible (Noé, 2008), on a translucent screen while listening to the movie through earphones. Clips from this movie have been used in previous studies to induce stress (Hermans et al., 2011). Participants were instructed to watch the stress movie clip from an eye-witness perspective. After the movie clip, participants completed several other cognitive tasks in the scanner.
Assessing mood, cortisol, and blood pressure
Positive and negative mood were assessed using the Dutch version of the Positive and Negative Affect Schedule (PANAS; Watson et al., 1988) 30 min before and 20 min after the movie clip. Changes in positive and negative mood were assessed using repeated-measures ANOVAs with two time points in the stress and control conditions.
Baseline saliva measures were sampled before lunch and before dinner on the day before the second MRI session; the mean cortisol of these two samples was used as the baseline cortisol level. During the MRI sessions, cortisol was also sampled 20 min after the movie clip. Cortisol levels for the stress movie and the control movie clips controlling for baseline were calculated and then compared using a paired-samples t test. PANAS ratings and saliva samples were missing for one participant, who was thus excluded from these analyses.
Finally, during each MRI session, blood pressure was measured 20 min after the movie clip using a semiautomatic MR-compatible blood pressure device. Paired-samples t tests were used to compare systolic and diastolic blood pressure after the stress and control movie clips.
Heart rate data acquisition and analysis
Heart rate data were continuously collected during scanning using an MR-compatible pulse oximeter. Data were first inspected for movement-related and other measurement artifacts. Mean heart rate during the stress movie and control movie clips were calculated and compared using a paired-samples t test. For the stress movie clip, continuous heart rate was also calculated in the same sliding time windows used for fMRI analyses described below. Five participants were missing heart rate data and were thus excluded from these analyses.
fMRI data acquisition
MR data were acquired on a 1.5 T Avanto MR scanner (Siemens) at the Donders Institute in Nijmegen, The Netherlands. During the movie clips, a series of 262 T2*-weighted functional images were acquired using gradient echo-planar imaging with the following parameters: 32 oblique transverse slices; repetition time (TR) = 2.34 s; flip angle 90°; echo time = 35 ms; field of view, 212 × 212 mm; matrix, 64 × 64; 3.5 mm slice thickness; voxel size, 3.3 × 3.3 × 3.5 mm.
Preprocessing.
Preprocessing of fMRI data was performed using tools from the Oxford Centre for Functional MRI of the Brain (FMRIB) Software Library (FSL; http://www.fmrib.ox.ac.uk/fsl; RRID:SCR_002823; Smith et al., 2004). The first five volumes were removed to allow for signal equilibration. FEAT version 6.00 (fMRI Expert Analysis Tool) was then used for head movement correction using MCFLIRT (Motion Correction FMRIB Linear Registration Tool; Jenkinson et al., 2002), nonbrain removal, and spatial smoothing (4 mm FWHM). Additional motion correction using ICA-AROMA (Independent Component Analysis-based Automatic Removal of Motion Artifacts; Pruim et al., 2015) was then applied, and data were high-pass filtered (cutoff periodicity of 128 s) and spatially normalized into standard stereotactic space [Montreal Neurological Institute (MNI) 152 T1-template].
Root mean square deviation of framewise displacement was calculated for each participant. Three participants were excluded from analyses due to excessive motion (>3 SDs above the sample root mean square deviation of framewise displacement).
Network definition.
To perform focused analyses of network cohesion, data were extracted only from the core nodes of the salience, executive control, and default mode networks (Fig. 2,1; Buckner et al., 2008; Menon, 2011). More specifically, we identified (1) anterior cingulate cortex and bilateral insula components of the salience network from the anterior salience network template, (2) bilateral dorsolateral prefrontal cortex and lateral posterior parietal cortex regions of the executive control network from the left and right executive control network templates, and (3) medial prefrontal cortex, posterior cingulate cortex, and bilateral inferior parietal lobule components of the default mode network from the dorsal and ventral default mode network templates provided by the Functional Imaging in Neuropsychiatric Disorders Laboratory (Shirer et al., 2012). The networks were then gray matter masked (FSL MNI: MNI-maxprob-thr25-2 mm.nii.gz) to restrict analyses to gray matter voxels. A complement mask was also defined as any gray matter voxel not included in the salience, executive control, or default mode networks to examine effects that were not network-specific.
Figure 2.
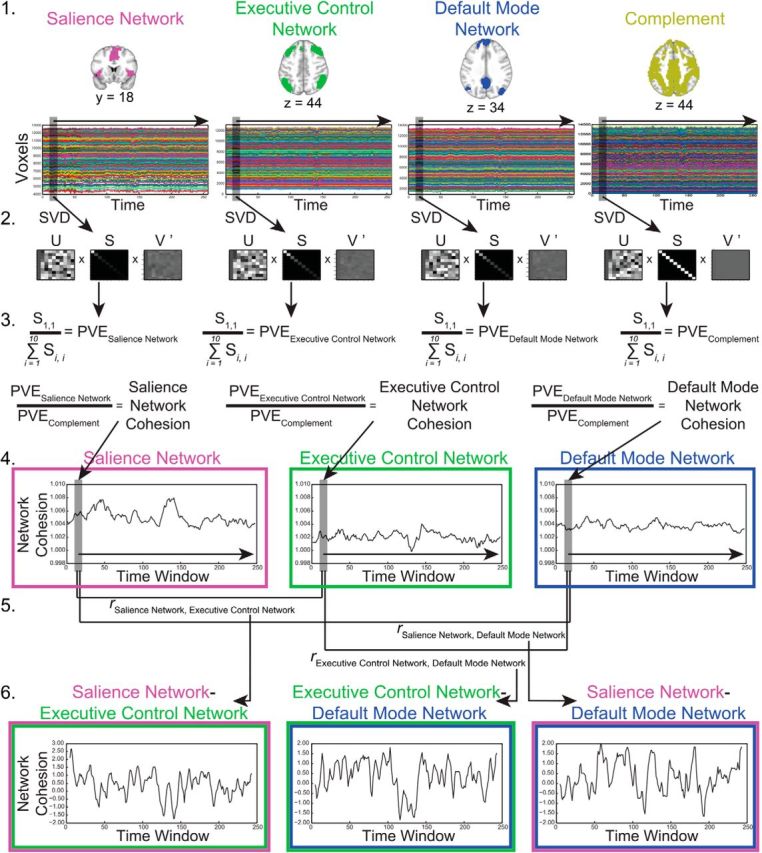
Overview of methods to compute network cohesion for a single participant. 1, The salience, executive control, and default mode networks were defined using templates provided by the Functional Imaging in Neuropsychiatric Disorders Laboratory. The complement mask consisted of all gray matter voxels not included in the salience, executive control, or default mode networks. Time series from each voxel within each network and the complement mask were extracted. 2, Singular value decomposition (SVD) was performed separately for each network and each sliding time window (defined as 10 TRs). SVD yields a unitary matrix (S) for each network and time window. The unitary matrix consists of singular values, representing the amount of variance explained for each component, on the matrix diagonal. 3, Dividing the first singular value (S1,1), which represents the cohesiveness of the network, by the sum of the singular values (∑i=110Si,i), which quantifies the total variance in the network, provides the percent variance explained (PVE) for each network and time window. To obtain a cohesion measure distinct to each network existing over and above global nonspecific levels of cohesion, the PVE of each network was divided by the complement PVE. 4, This procedure was repeated for each sliding time window, thereby providing a dynamic measure of within-network cohesion for the salience, executive control, and default mode networks. 5, In a second sliding time window, Fisher-transformed correlations were taken for each network pair. 6, This procedure was repeated for each sliding time window, yielding a dynamic measure of between-network cohesion.
Computing network cohesion.
To obtain a dynamic measure of network cohesion, singular value decomposition (SVD; Golub and Reinsch, 1970) was combined with a sliding time window approach (Fig. 2,2). Time series data from each voxel within the salience network, executive control network, default mode network, and complement mask were first extracted for each participant. SVD was then performed in Matlab (RRID:SCR_001622) on time series data within sliding time windows of 10 TRs (23.4 s) for each network, yielding a unitary matrix for each participant, network, and time window. The time window length used here is consistent with those of previous studies that have also used time windows of 10 TRs (Raz et al., 2012). The unitary matrix consists of singular values, representing the amount of variance explained for each component, on the matrix diagonal. The first singular value quantifies the variance explained by the largest component, and the sum of the singular values quantifies the total variance in the network. Thus, dividing the first singular value by the sum of the singular values for each participant, network, and time window quantifies the percentage of variance explained in each network and time window for each participant (Fig. 2,3). The percentage of variance explained for the salience, executive control, and default mode networks was then divided by the percentage of variance explained for the complement mask to control for cohesion not specific to any particular network. Thus, the cohesion for the salience, executive control, and default mode networks reflects network-specific cohesion over and above global nonspecific levels of cohesion existing in the rest of the brain. In summary, for each participant, this analysis yielded three vectors (one each for salience network, executive control network, and default mode network) with length 248 [257 TRs − time window length (10 TRs) + 1], and these vectors represented the dynamic network cohesion within the salience, executive control, and default mode networks (Fig. 2,4).
To examine interactions between networks, between-network cohesion was also calculated by correlating within-network cohesions across time. Because within-network cohesion is calculated across time windows of 10 TRs, a second sliding time window of 10 within-network time windows (44.46 s) was used to correlate salience and executive control network cohesion, salience and default mode network cohesion, and executive control and default mode network cohesion (Fig. 2,5). Fisher's r-to-Z transformation was then used for the correlation values, providing a dynamic measure of between-network cohesion for each participant (Fig. 2,6). The between-network cohesion thus quantified the synchrony of cohesion of each network pair as a function of time. In other words, if cohesion in both networks behaved similarly, then the between-network cohesion increased; in contrast, if the cohesion in each network operated independently, then between-network cohesion decreased. Mean between-network cohesion across time was calculated for each participant and one-sample t tests were used to determine whether network pairs behaved similarly (i.e., positive t scores) or reciprocally (i.e., negative t scores).
Network cohesion and arousal response.
Heart rate, a physiological index of arousal, was continuously measured during the fMRI scan. Nonparametric regression with linear and quadratic terms, heart rate as the independent variable, and network cohesion as the dependent variable was conducted for each participant and network (i.e., Network Cohesion Ranki,j = β0 + β1i,j * Heart Rate Ranki + β2i,j * Heart Rate Ranki2 + εi,j where i = participant, j = network). One-sample t tests were then performed to determine whether the linear and quadratic parameter estimates were significantly different from 0. Linear and quadratic parameter estimates were also directly compared across networks using paired-sample t tests. These analyses determined whether there is a consistent linear and/or quadratic relationship between network cohesion and arousal response.
Validation of the network cohesion index.
Eigenvectors describing underlying temporal patterns were extracted from data across the entire scan for each network and for each participant. These values were entered back into a general linear model to examine the validity of the network cohesion indices. Maps for every participant containing parameter estimates for the eigenvector effect were then entered into three one-sample t tests (one each for salience network, executive control network, and default mode network). Adaptive thresholding using mixture modeling with an equal balance between false positives and false negatives (i.e., threshold level of 0.5) was used to threshold results (Hartvig and Jensen, 2000). This analysis determined whether the components for each network represented the network as a whole, or whether the network cohesion measure predominantly reflected only part of the network.
Results
Psychological and physiological indices of arousal
To ensure that the movie clip was emotionally arousing, we assessed mood, cortisol, blood pressure, continuous heart rate, and continuous self-report measures of arousal. The stress movie clip led to significant increases in self-reported negative mood, whereas no significant changes in negative mood were reported for the control movie (interaction, F(1,110) = 38.1, p < 0.001; condition main effect, F(1,110) = 24.2, p < 0.001; time main effect, F(1,110) = 29.3, p < 0.001). In contrast, both the stress and the control movie clips led to significant decreases in positive mood (time main effect, F(1,110) = 61.2, p < 0.001; condition main effect and interaction, p > 0.39). Mean heart rate during the movie (t(110) = 4.8, p < 0.001), as well as cortisol (t(110) = 2.7, p = 0.007), systolic blood pressure (t(111) = 3.8, p < 0.001), and diastolic blood pressure (t(111) = 3.2, p = 0.002) after the stress movie were all significantly higher than after the control movie. Continuous ratings of the stress movie clip, provided by an independent sample of 15 healthy adults, demonstrated that the movie evoked a wide range of subjective arousal levels ranging from calm to highly arousing, and that valence was strongly and negatively related to arousal (t(14) = −10.7, p < 0.001; Fig. 3). Critically, heart rate in participants who completed the fMRI task was positively related to the averaged continuous arousal ratings in a linear (t(111) = 2.8, p = 0.005) but not quadratic manner (p > 0.16). Thus, the stress movie clip evoked a wide range of arousal levels, and heart rate, a physiological index of arousal, converged with subjective arousal ratings of the movie clip.
Figure 3.

Continuous mean arousal and valence ratings for the movie clip provided by an independent sample of participants. The movie clip evoked a wide range of arousal and valence levels.
Within-network cohesion and arousal response
After calculating within-network cohesion (Fig. 2), heart rate was examined in relation to within-network cohesion of the salience, executive control, and default mode networks for each participant (Fig. 4). Consistent with the extant literature linking salience network response to stress (Hermans et al., 2011; McMenamin et al., 2014), salience network cohesion monotonically increased as arousal increased (t(111) = 3.4, p < 0.001). However, contrary to prediction, cohesion within the executive control network was not significantly related to heart rate. With respect to the default mode network, linear (t(111) = 2.4, p = 0.020) and quadratic (t(111) = 2.8, p = 0.005) terms were significant, demonstrating that default mode network cohesion increased especially under moderate to high levels of arousal. Finally, the positive linear relationship between heart rate and within-network cohesion was marginally stronger for the salience network compared with the executive control network (t(111) = 1.8, p = 0.07). All other comparisons between networks were not significantly different [(1) salience vs executive control networks, quadratic, t(111) = 0.2, p = 0.83; (2) salience vs default mode network, linear, t(111) = 1.1, p = 0.26; (3) salience vs default mode network, quadratic, t(111) = −0.8, p = 0.41; (4) executive control vs default mode network, linear, t(111) = −1.0, p = 0.33; (5) executive control vs default mode network, quadratic, t(111) = −1.2, p = 0.23]. Therefore, within-network cohesion generally increased with heart rate, and the salience and default mode networks in particular showed positive relationships between within-network cohesion and arousal. These effects cannot be attributed purely to physiological effects as the methods of calculating network cohesion accounted for responses observed in out-of-network brain regions to control for nonspecific levels of cohesion.
Figure 4.
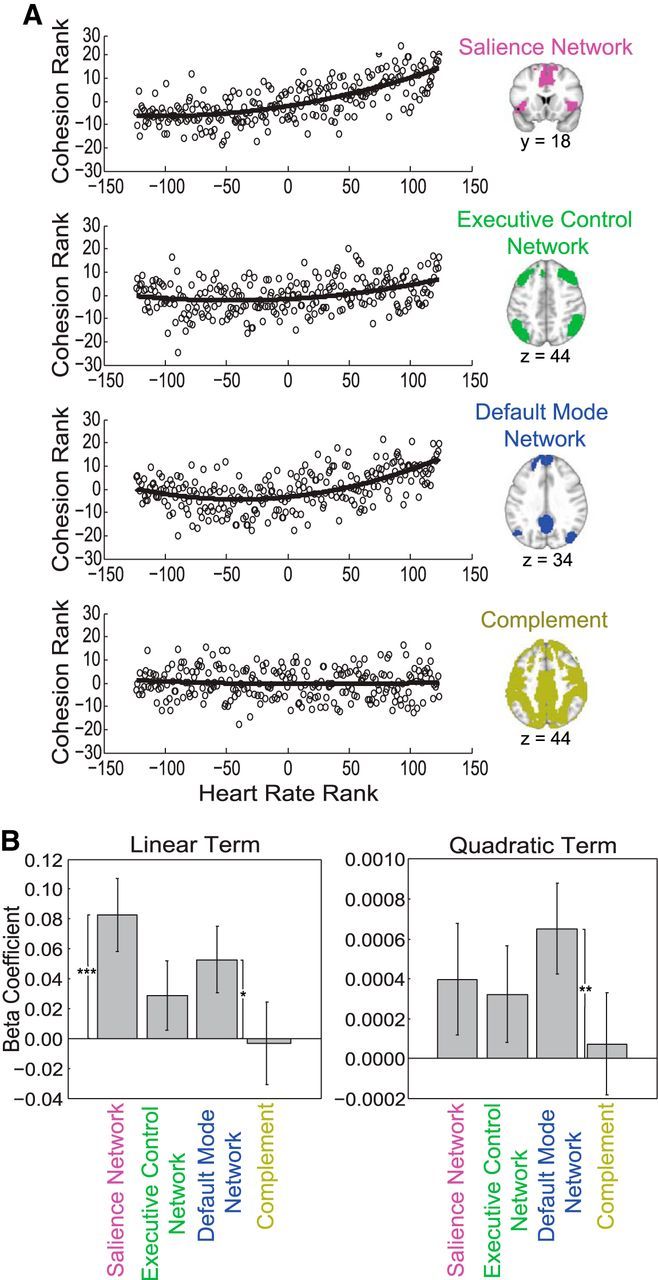
Within-network cohesion for the salience network, executive control network, default mode network, and complement mask as a function of heart rate, a physiological index of arousal. A, Circles represent the mean network cohesion rank across participants for each heart rate rank. B, There was a significant positive linear relationship between heart rate and salience network cohesion, as well as heart rate and default mode network cohesion. There was also a positive quadratic relationship between heart rate and default mode network cohesion. *p < 0.05, **p < 0.01, ***p < 0.001.
Between-network cohesion and arousal response
The mean between-network cohesion across time was first calculated for each participant, and then tested across participants, revealing that the networks in general behaved similarly rather than reciprocally (salience-executive control network, t(111) = 8.3, p < 0.001; salience-default mode network, t(111) = 20.3, p < 0.001; executive control-default mode network, t(111) = 17.2, p < 0.001).
Cohesion between networks was then related to continuous heart rate (Fig. 5). Only the salience–executive control network pair showed a significant negative quadratic relationship (t(111) = −2.8, p = 0.006) with no linear component (p > 0.65) between heart rate and between-network cohesion, such that cohesion was low at both low and high levels of arousal, but high at moderate levels of arousal. No other between-network pairs showed significant linear or quadratic relationships (all t(111) < 1, not significant. The salience–executive control network quadratic relationship with heart rate significantly differed from the salience–default mode network and executive control–default mode network quadratic relationships with heart rate (F(1, 111) = 7.2, p = 0.008). Taken together, arousal specifically related to salience–executive control network cohesion, which was highest under moderate levels of arousal.
Figure 5.
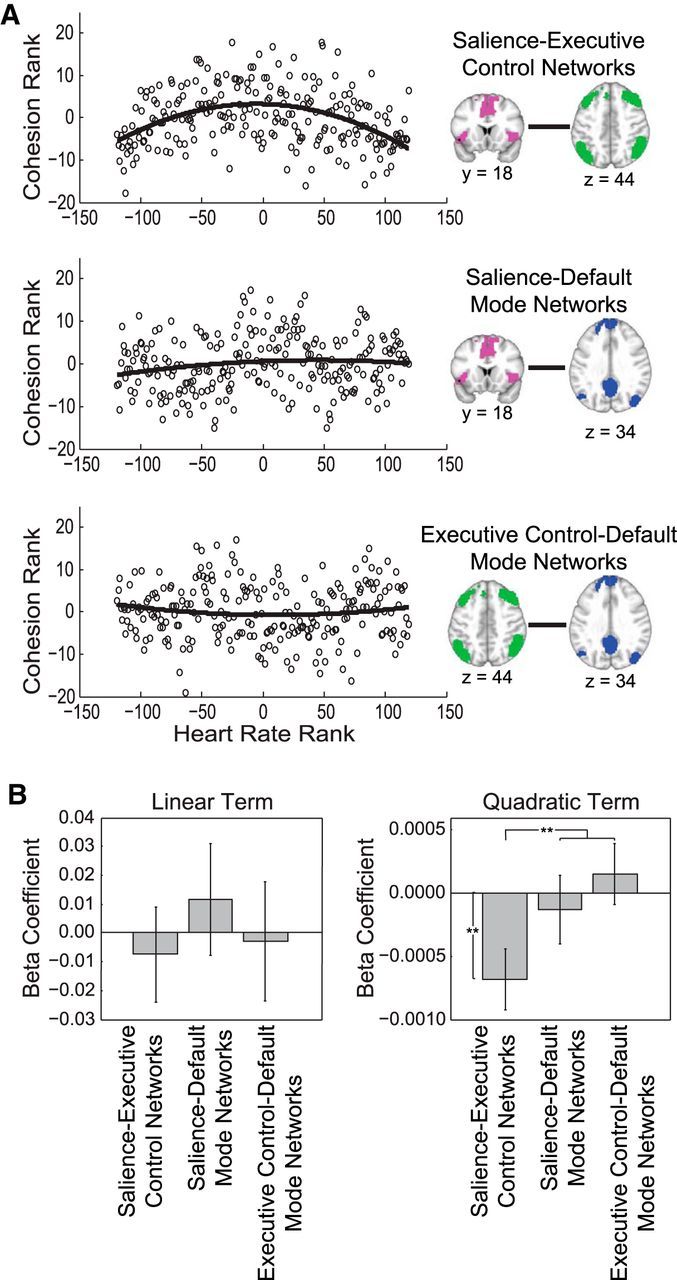
Between-network cohesion for salience network, executive control network, and default mode network pairs as a function of heart rate. A, Circles represent the mean between-network cohesion rank across participants for each heart rate rank. B, There was a significant negative quadratic relationship between heart rate and salience–executive control network cohesion. The salience–executive control network quadratic relation with heart rate also differed from the salience–default mode network and executive control–default mode network quadratic relations. **p < 0.01.
Mean activity and arousal response
We examined the relationship of within-network and between-network activity with arousal using the same methodological steps of relating within-network cohesion to arousal. These results demonstrated that arousal was not related to within-network activity (all t(111) ≤1, not significant) or to activity in any between-network pair in a linear or quadratic manner (salience–executive control network, linear, t(111) < 1, not significant; salience–executive control network, quadratic: t(111) = −1.6, p = 0.40; salience–default mode network, linear and quadratic: t(111) < 1, not significant; executive control–default mode network, linear, t(111) = 1.3, p = 0.20; executive control–default mode network, quadratic: t(111) < 1, not significant).
Validation of the network cohesion measure
Finally, Figure 6 demonstrates that the network cohesion index indeed captured the entire network rather than just a small portion of voxels or specific edges that would have suggested motion-related artifacts.
Figure 6.

Validation of the salience, executive control, and default mode networks. Areas significantly correlated with the eigenvector describing the underlying temporal patterns of each network are shown. Results were thresholded using a Gaussian mixture model approach to demonstrate that the network cohesion index indeed captured the entire network rather than just a small portion of voxels or specific edges. Colored outlines depict the a priori regions of interest that defined each network.
Discussion
Our study extends existing knowledge about changes in neural circuits by demonstrating that cohesion both within and between large-scale networks dynamically varies according to arousal level. Most notably, our results show that salience network cohesion has a monotonically increasing association with arousal, while salience–executive control network cohesion has an inverted-U relationship with arousal. These results highlight and extend network models emphasizing the role of the salience network in network switching (Menon and Uddin, 2010; Menon, 2011), as well as the effects of stress on salience and executive control network functioning (Hermans et al., 2014).
Arousal and salience network cohesion
Our results broaden the current understanding of salience network function by demonstrating a linearly increasing relationship between salience network cohesion and arousal, which can be observed on a moment-to-moment basis across a broad range of arousal levels. This is consistent with neurobiological evidence showing that arousing and stressful environments trigger a widespread cascade of neurochemical changes thought to rapidly coordinate and adjust brain functioning at the level of large-scale neural systems (Joëls and Baram, 2009). For instance, arousal levels vary according to firing patterns of LC neurons (Aston-Jones and Cohen, 2005; Valentino and Van Bockstaele, 2008) that project to distant sites to release norepinephrine (Rajkowski et al., 1998; Valentino and Van Bockstaele, 2008). Norepinephrine released from the LC has recently been proposed to bias perception and memory toward salient and high-priority stimuli by creating “norepinephrine hot spots” in salience network structures (Mather et al., 2015). Importantly, the salience network helps guide adaptive behavior (Bressler and Menon, 2010), tag salient stimuli for further processing (Menon and Uddin, 2010; Menon, 2011), and coordinate interactions between other large-scale networks (Menon and Uddin, 2010). Indeed, it has been shown that acute stress increases responsivity and connectivity within the salience network, and β-adrenergic blocking agents reduce the salience network response by blocking the action of norepinephrine (Hermans et al., 2011). While numerous studies have shown salience network enhancement in response to stress, it has also been shown that network responses to stressors are not static (McMenamin et al., 2014). As a result, we adapted existing methods of measuring network cohesion (Raz et al., 2012) to create a novel dynamic network cohesion measure that enabled us to examine how network changes unfold as a function of arousal level on a moment-to-moment basis.
Communication between salience and executive control networks
Based on existing behavioral and neurobiological research (Yerkes and Dodson, 1908; Arnsten, 2009), we hypothesized that arousal would have an inverted-U-shaped relationship with executive control network cohesion. Although the lack of a significant relationship between executive control network cohesion and heart rate may suggest that arousal levels were not high enough to reach the supraoptimal breakdown of the executive control network, the inverted-U shaped relationship between arousal and salience-executive control between-network cohesion suggests that this is not the case. More specifically, instead of increased and subsequent decreased executive control network cohesion from low to moderate to high arousal, we found that executive control network cohesion remained stable regardless of arousal level, but was highly coupled with the salience network only at moderate arousal. This corresponds with the proposed “circuit-breaking” function of the salience network and the LC, in which the salience network communicates with the executive control network to disrupt ongoing cognitive activity when salient stimuli are detected (Corbetta and Shulman, 2002). In response to task-relevant stimuli, LC neurons shift from inactive to phasic responding under moderate arousal when attention is focused (Aston-Jones et al., 1999), thus altering norepinephrine release in an arousal-dependent manner. Phasic noradrenergic activity and engagement of salience network regions then resets executive control network nodes to support executive functioning (Bouret and Sara, 2005; Sara and Bouret, 2012). Effective connectivity analyses, in which the right anterior insula in particular has been shown to have a critical role in activating the executive control network (Sridharan et al., 2008; Goulden et al., 2014), as well as a transcranial magnetic stimulation study, which used excitatory stimulation of a salience network node to increase within-salience network and within-executive control network connectivity (Chen et al., 2013), provide further evidence of the salience network influencing the executive control network (Uddin, 2015). Together, the salience network engages the executive control network, likely through phasic norepinephrine signaling, in the presence of salient stimuli to alter cognitive and behavioral functioning. Determining which nodes are driving the between-network coordination will be an important next step. It is also important to note that just as with other fMRI connectivity methods, the between-network cohesion measure does not guarantee direct interactions between nodes of two networks, and may instead reflect networks that are both engaged but operating independently. Nevertheless, we propose that salience network-related switches that engage the executive control network occur specifically under moderate arousal after considering our results with the extant literature.
Breakdown of network coordination under high arousal
This adaptive network switching function may break down at high levels of arousal, such as in hypervigilant or distractible states in which LC neurons are tonically active (Aston-Jones et al., 1999). Our finding of reduced salience–executive control between-network cohesion at high arousal suggests that optimal executive control network engagement triggered by the salience network (Sridharan et al., 2008; Goulden et al., 2014) does not occur in hypervigilant or distractible states, thereby supporting the inverted-U-shaped interaction of the two networks. Although salience monitoring in the high-arousal state still occurs, as reflected by the high within-salience network cohesion, subsequent network switching and executive control network engagement may be unable to follow the frequent signals sent by the salience network. This may be due to an overload of cognitive demands placed on the executive control network, such as simultaneously supporting attentional shifts, recollection of relevant memories, and regulation of behavioral responses to the arousing material. Multitasking is associated with delayed activity in the executive control network (Sigman and Dehaene, 2008), and the posterior lateral prefrontal cortex, a core node of the executive control network, is thought to be a bottleneck region in multitask processing (Dux et al., 2006). However, whether activity and connectivity within a network increases (Buchweitz et al., 2012) or decreases (Newman et al., 2007) during multitasking depends on the automaticity and similarity of the tasks. Thus, the executive control network may not shut down under high arousal as previously proposed (Arnsten, 1998; Hermans et al., 2014), but may instead still be active in supporting a variety of demands related to being in a high-arousal state. However, explicit links between high arousal and increased multitasking behavior have not yet been established.
Between-network coordination
Notably, the typical opposing relationship observed between the executive control and default mode networks reported in resting-state studies that use global-signal regression was not observed here in the presence of continuous stimuli. This could be explained by our method; to control for nonspecific cohesion in out-of-network brain regions, we normalized against regions not included in the salience, executive control, or default mode networks, instead of using global-signal correction, which mathematically mandates negative correlations (Fox et al., 2009). As a result, cohesion in the salience, executive control, and default mode networks were all positively correlated, albeit at varying levels. Similarity of behavior across all networks may reflect entrainment by the physical features of the movie itself, or the presence of a constant external stimulus may have prevented suppression of the executive control network in the low-arousal state that most resembles resting state. Additionally, the unexpected increased within-default mode network cohesion especially from moderate to high arousal may reflect greater self-focused reappraisal, a core function of the default mode network (Buckner et al., 2008) that requires mentally reframing events to alter the personal relevance and emotional impact of an experience. The demand for self-focused reappraisal may be particularly great during moderate to high arousal levels, reflected by increased within-default mode network cohesion, if participants were following instructions to watch the movie clip from the perspective of a bystander or if participants were using coping mechanisms to process the aversive cinematographic material. Both of these situations require the use of theory of mind, a mentalizing ability to ascribe mental states to oneself and others to explain and predict behavior, which robustly activates the default mode network (Spreng and Grady, 2010).
Implications for psychopathology
Importantly, our results extend a prominent triple network model of psychopathology (Menon, 2011) by suggesting that stress-related mental disorders involve inadequate network switching due to frequent or constant high-arousal states. Similar to our findings of increased salience network cohesion under high arousal, increased activity and connectivity within the salience network has been consistently shown in anxiety disorders, such as post-traumatic stress disorder (Etkin and Wager, 2007; Sylvester et al., 2012). Our finding of decreased salience–executive control between-network cohesion related to arousal also expands research demonstrating reduced functional connectivity between salience and executive control network nodes in individuals with high trait anxiety (Basten et al., 2011) and generalized anxiety disorder (Etkin et al., 2009). Therefore, network patterns observed here under high arousal resemble network-level aberrations observed in stress-related psychopathology. Understanding the dynamics of large-scale neural systems at varying levels of arousal and stress is indeed a crucial step toward developing a circuit-level understanding of stress-related mental disorders (Insel et al., 2010; Deisseroth, 2014).
Conclusions
Our findings suggest that the coordination of complex cognitive processes that allow for adaptive responding according to one's arousal level is supported by changes in cohesion within and between large-scale brain networks. More specifically, increased salience-related functioning with heightening arousal is underpinned by the monotonically increasing relationship between arousal and salience network cohesion. In contrast, coordination between salience and executive functions is optimal under moderate arousal, as reflected by the peak salience–executive control network cohesion in this state. In this way, changes in cohesion within and between large-scale brain networks may explain shifts in cognitive functioning during acute stress, and may play an important role in the development and maintenance of stress-related mental disorders.
Footnotes
This work was supported by the National Science Foundation (DGE0824162 to C.B.Y.), the Netherlands Organisation for Scientific Research (918.66.613 to G.F.; 451.07.019 to E.J.H.), the European Research Council (ERC-2015-CoG 682591 to E.J.H.), the BrainTrain Consortium under the EU PF7 Health Cooperation Program (602186 to T.H. and G.R.), and the Israeli Ministry of Science, Technology and Space (to T.H. and G.R.). The authors also acknowledge excellent contributions to data acquisition from Sabine Kooijman, Nicole Driessen, Anita Harteveld, and Yuen Fang.
The authors declare no competing financial interests.
References
- Arnsten AF. The biology of being frazzled. Science. 1998;280:1711–1712. doi: 10.1126/science.280.5370.1711. [DOI] [PubMed] [Google Scholar]
- Arnsten AF. Stress signalling pathways that impair prefrontal cortex structure and function. Nat Rev Neurosci. 2009;10:410–422. doi: 10.1038/nrn2648. [DOI] [PMC free article] [PubMed] [Google Scholar]
- Aston-Jones G, Cohen JD. An integrative theory of locus coeruleus-norepinephrine function: adaptive gain and optimal performance. Annu Rev Neurosci. 2005;28:403–450. doi: 10.1146/annurev.neuro.28.061604.135709. [DOI] [PubMed] [Google Scholar]
- Aston-Jones G, Rajkowski J, Cohen J. Role of locus coeruleus in attention and behavioral flexibility. Biol Psychiatry. 1999;46:1309–1320. doi: 10.1016/S0006-3223(99)00140-7. [DOI] [PubMed] [Google Scholar]
- Attenborough D. Life. London: Bridge Entertainment; 2010. [Google Scholar]
- Barsegyan A, Mackenzie SM, Kurose BD, McGaugh JL, Roozendaal B. Glucocorticoids in the prefrontal cortex enhance memory consolidation and impair working memory by a common neural mechanism. Proc Natl Acad Sci U S A. 2010;107:16655–16660. doi: 10.1073/pnas.1011975107. [DOI] [PMC free article] [PubMed] [Google Scholar]
- Basten U, Stelzel C, Fiebach CJ. Trait anxiety modulates the neural efficiency of inhibitory control. J Cogn Neurosci. 2011;23:3132–3145. doi: 10.1162/jocn_a_00003. [DOI] [PubMed] [Google Scholar]
- Bouret S, Sara SJ. Network reset: a simplified overarching theory of locus coeruleus noradrenaline function. Trends Neurosci. 2005;28:574–582. doi: 10.1016/j.tins.2005.09.002. [DOI] [PubMed] [Google Scholar]
- Bradley MM, Lang PJ. Measuring emotion: the Self-Assessment Manikin and the Semantic Differential. J Behav Ther Exp Psychiatry. 1994;25:49–59. doi: 10.1016/0005-7916(94)90063-9. [DOI] [PubMed] [Google Scholar]
- Bressler SL, Menon V. Large-scale brain networks in cognition: emerging methods and principles. Trends Cogn Sci. 2010;14:277–290. doi: 10.1016/j.tics.2010.04.004. [DOI] [PubMed] [Google Scholar]
- Buchweitz A, Keller TA, Meyler A, Just MA. Brain activation for language dual-tasking: listening to two people speak at the same time and a change in network timing. Hum Brain Mapp. 2012;33:1868–1882. doi: 10.1002/hbm.21327. [DOI] [PMC free article] [PubMed] [Google Scholar]
- Buckner RL, Andrews-Hanna JR, Schacter DL. The brain's default network: anatomy, function, and relevance to disease. Ann NY Acad Sci. 2008;1124:1–38. doi: 10.1196/annals.1440.011. [DOI] [PubMed] [Google Scholar]
- Chen AC, Oathes DJ, Chang C, Bradley T, Zhou ZW, Williams LM, Glover GH, Deisseroth K, Etkin A. Causal interactions between fronto-parietal central executive and default-mode networks in humans. Proc Natl Acad Sci U S A. 2013;110:19944–19949. doi: 10.1073/pnas.1311772110. [DOI] [PMC free article] [PubMed] [Google Scholar]
- Corbetta M, Shulman GL. Control of goal-directed and stimulus-driven attention in the brain. Nat Rev Neurosci. 2002;3:201–215. doi: 10.1038/nrn755. [DOI] [PubMed] [Google Scholar]
- Deisseroth K. Circuit dynamics of adaptive and maladaptive behaviour. Nature. 2014;505:309–317. doi: 10.1038/nature12982. [DOI] [PMC free article] [PubMed] [Google Scholar]
- Dux PE, Ivanoff J, Asplund CL, Marois R. Isolation of a central bottleneck of information processing with time-resolved FMRI. Neuron. 2006;52:1109–1120. doi: 10.1016/j.neuron.2006.11.009. [DOI] [PMC free article] [PubMed] [Google Scholar]
- Etkin A, Wager TD. Functional neuroimaging of anxiety: a meta-analysis of emotional processing in PTSD, social anxiety disorder, and specific phobia. Am J Psychiatry. 2007;164:1476–1488. doi: 10.1176/appi.ajp.2007.07030504. [DOI] [PMC free article] [PubMed] [Google Scholar]
- Etkin A, Prater KE, Schatzberg AF, Menon V, Greicius MD. Disrupted amygdalar subregion functional connectivity and evidence of a compensatory network in generalized anxiety disorder. Arch Gen Psychiatry. 2009;66:1361–1372. doi: 10.1001/archgenpsychiatry.2009.104. [DOI] [PMC free article] [PubMed] [Google Scholar]
- Fernández G, Weis S, Stoffel-Wagner B, Tendolkar I, Reuber M, Beyenburg S, Klaver P, Fell J, de Greiff A, Ruhlmann J, Reul J, Elger CE. Menstrual cycle-dependent neural plasticity in the adult human brain is hormone, task, and region specific. J Neurosci. 2003;23:3790–3795. doi: 10.1523/JNEUROSCI.23-09-03790.2003. [DOI] [PMC free article] [PubMed] [Google Scholar]
- Fox MD, Zhang D, Snyder AZ, Raichle ME. The global signal and observed anticorrelated resting state brain networks. J Neurophysiol. 2009;101:3270–3283. doi: 10.1152/jn.90777.2008. [DOI] [PMC free article] [PubMed] [Google Scholar]
- Golub GH, Reinsch C. Singular value decomposition and least-squares solutions. Numer Math. 1970;14:403–420. doi: 10.1007/BF02163027. [DOI] [Google Scholar]
- Goulden N, Khusnulina A, Davis NJ, Bracewell RM, Bokde AL, McNulty JP, Mullins PG. The salience network is responsible for switching between the default mode network and the central executive network: replication from DCM. Neuroimage. 2014;99:180–190. doi: 10.1016/j.neuroimage.2014.05.052. [DOI] [PubMed] [Google Scholar]
- Hartvig NV, Jensen JL. Spatial mixture modeling of fMRI data. Hum Brain Mapp. 2000;11:233–248. doi: 10.1002/1097-0193(200012)11:4<233::AID-HBM10>3.0.CO;2-F. [DOI] [PMC free article] [PubMed] [Google Scholar]
- Hermans EJ, van Marle HJ, Ossewaarde L, Henckens MJ, Qin S, van Kesteren MT, Schoots VC, Cousijn H, Rijpkema M, Oostenveld R, Fernández G. Stress-related noradrenergic activity prompts large-scale neural network reconfiguration. Science. 2011;334:1151–1153. doi: 10.1126/science.1209603. [DOI] [PubMed] [Google Scholar]
- Hermans EJ, Henckens MJ, Joëls M, Fernández G. Dynamic adaptation of large-scale brain networks in response to acute stressors. Trends Neurosci. 2014;37:304–314. doi: 10.1016/j.tins.2014.03.006. [DOI] [PubMed] [Google Scholar]
- Insel T, Cuthbert B, Garvey M, Heinssen R, Kozak M, Pine DS, Quinn K, Sanislow C, Steinberg J, Wang P. Research Domain Criteria (RDoC): toward a new classification framework for research on mental disorders. Am J Psychiat. 2010;167:748–751. doi: 10.1176/appi.ajp.2010.09091379. [DOI] [PubMed] [Google Scholar]
- Ishii A, Karasuyama T, Kikuchi T, Tanaka M, Yamano E, Watanabe Y. The neural mechanisms of re-experiencing mental fatigue sensation: a magnetoencephalography study. PLoS One. 2015;10:e0122455. doi: 10.1371/journal.pone.0122455. [DOI] [PMC free article] [PubMed] [Google Scholar]
- Jenkinson M, Bannister P, Brady M, Smith S. Improved optimization for the robust and accurate linear registration and motion correction of brain images. Neuroimage. 2002;17:825–841. doi: 10.1006/nimg.2002.1132. [DOI] [PubMed] [Google Scholar]
- Joëls M, Baram TZ. The neuro-symphony of stress. Nat Rev Neurosci. 2009;10:459–466. doi: 10.1038/nrn2632. [DOI] [PMC free article] [PubMed] [Google Scholar]
- Kinnison J, Padmala S, Choi JM, Pessoa L. Network analysis reveals increased integration during emotional and motivational processing. J Neurosci. 2012;32:8361–8372. doi: 10.1523/JNEUROSCI.0821-12.2012. [DOI] [PMC free article] [PubMed] [Google Scholar]
- Mather M, Clewett D, Sakaki M, Harley CW. Norepinephrine ignites local hot spots of neuronal excitation: how arousal amplifies selectivity in perception and memory. Behav Brain Sci. 2015;1:1–100. doi: 10.1017/S0140525X15000667. [DOI] [PMC free article] [PubMed] [Google Scholar]
- McMenamin BW, Langeslag SJ, Sirbu M, Padmala S, Pessoa L. Network organization unfolds over time during periods of anxious anticipation. J Neurosci. 2014;34:11261–11273. doi: 10.1523/JNEUROSCI.1579-14.2014. [DOI] [PMC free article] [PubMed] [Google Scholar]
- Menon V. Large-scale brain networks and psychopathology: a unifying triple network model. Trends Cogn Sci. 2011;15:483–506. doi: 10.1016/j.tics.2011.08.003. [DOI] [PubMed] [Google Scholar]
- Menon V, Uddin LQ. Saliency, switching, attention and control: a network model of insula function. Brain Struct Funct. 2010;214:655–667. doi: 10.1007/s00429-010-0262-0. [DOI] [PMC free article] [PubMed] [Google Scholar]
- Newman SD, Keller TA, Just MA. Volitional control of attention and brain activation in dual task performance. Hum Brain Mapp. 2007;28:109–117. doi: 10.1002/hbm.20257. [DOI] [PMC free article] [PubMed] [Google Scholar]
- Noé G. Irréversible. The Netherlands: Paradiso Entertainment; 2008. [Google Scholar]
- Pruim RH, Mennes M, van Rooij D, Llera A, Buitelaar JK, Beckmann CF. ICA-AROMA: a robust ICA-based strategy for removing motion artifacts from fMRI data. Neuroimage. 2015;112:267–277. doi: 10.1016/j.neuroimage.2015.02.064. [DOI] [PubMed] [Google Scholar]
- Qin S, Hermans EJ, van Marle HJ, Luo J, Fernández G. Acute psychological stress reduces working memory-related activity in the dorsolateral prefrontal cortex. Biol Psychiatry. 2009;66:25–32. doi: 10.1016/j.biopsych.2009.03.006. [DOI] [PubMed] [Google Scholar]
- Qin S, Cousijn H, Rijpkema M, Luo J, Franke B, Hermans EJ, Fernández G. The effect of acute moderate psychological stress on working memory-related neural activity is modulated by a genetic variation in catecholaminergic function in humans. Front Integr Neurosci. 2012;6:16. doi: 10.3389/fnint.2012.00016. [DOI] [PMC free article] [PubMed] [Google Scholar]
- Rajkowski J, Kubiak P, Ivanova S, Aston-Jones G. State-related activity, reactivity of locus ceruleus neurons in behaving monkeys. Adv Pharmacol. 1998;42:740–744. doi: 10.1016/s1054-3589(08)60854-6. [DOI] [PubMed] [Google Scholar]
- Raz G, Winetraub Y, Jacob Y, Kinreich S, Maron-Katz A, Shaham G, Podlipsky I, Gilam G, Soreq E, Hendler T. Portraying emotions at their unfolding: a multilayered approach for probing dynamics of neural networks. Neuroimage. 2012;60:1448–1461. doi: 10.1016/j.neuroimage.2011.12.084. [DOI] [PubMed] [Google Scholar]
- Sara SJ, Bouret S. Orienting and reorienting: the locus coeruleus mediates cognition through arousal. Neuron. 2012;76:130–141. doi: 10.1016/j.neuron.2012.09.011. [DOI] [PubMed] [Google Scholar]
- Seeley WW, Menon V, Schatzberg AF, Keller J, Glover GH, Kenna H, Reiss AL, Greicius MD. Dissociable intrinsic connectivity networks for salience processing and executive control. J Neurosci. 2007;27:2349–2356. doi: 10.1523/JNEUROSCI.5587-06.2007. [DOI] [PMC free article] [PubMed] [Google Scholar]
- Shirer WR, Ryali S, Rykhlevskaia E, Menon V, Greicius MD. Decoding subject-driven cognitive states with whole-brain connectivity patterns. Cereb Cortex. 2012;22:158–165. doi: 10.1093/cercor/bhr099. [DOI] [PMC free article] [PubMed] [Google Scholar]
- Sigman M, Dehaene S. Brain mechanisms of serial and parallel processing during dual-task performance. J Neurosci. 2008;28:7585–7598. doi: 10.1523/JNEUROSCI.0948-08.2008. [DOI] [PMC free article] [PubMed] [Google Scholar]
- Smith SM, Jenkinson M, Woolrich MW, Beckmann CF, Behrens TE, Johansen-Berg H, Bannister PR, De Luca M, Drobnjak I, Flitney DE, Niazy RK, Saunders J, Vickers J, Zhang Y, De Stefano N, Brady JM, Matthews PM. Advances in functional and structural MR image analysis and implementation as FSL. Neuroimage. 2004;23(Suppl 1):S208–S219. doi: 10.1016/j.neuroimage.2004.07.051. [DOI] [PubMed] [Google Scholar]
- Spreng RN, Grady CL. Patterns of brain activity supporting autobiographical memory, prospection, and theory of mind, and their relationship to the default mode network. J Cogn Neurosci. 2010;22:1112–1123. doi: 10.1162/jocn.2009.21282. [DOI] [PubMed] [Google Scholar]
- Sridharan D, Levitin DJ, Menon V. A critical role for the right fronto-insular cortex in switching between central-executive and default-mode networks. Proc Natl Acad Sci U S A. 2008;105:12569–12574. doi: 10.1073/pnas.0800005105. [DOI] [PMC free article] [PubMed] [Google Scholar]
- Sylvester CM, Corbetta M, Raichle ME, Rodebaugh TL, Schlaggar BL, Sheline YI, Zorumski CF, Lenze EJ. Functional network dysfunction in anxiety and anxiety disorders. Trends Neurosci. 2012;35:527–535. doi: 10.1016/j.tins.2012.04.012. [DOI] [PMC free article] [PubMed] [Google Scholar]
- Uddin LQ. Salience processing and insular cortical function and dysfunction. Nat Rev Neurosci. 2015;16:55–61. doi: 10.1038/nrn3857. [DOI] [PubMed] [Google Scholar]
- Valentino RJ, Van Bockstaele E. Convergent regulation of locus coeruleus activity as an adaptive response to stress. Eur J Pharmacol. 2008;583:194–203. doi: 10.1016/j.ejphar.2007.11.062. [DOI] [PMC free article] [PubMed] [Google Scholar]
- Wager TD, Waugh CE, Lindquist M, Noll DC, Fredrickson BL, Taylor SF. Brain mediators of cardiovascular responses to social threat: Part I: reciprocal dorsal and ventral subregions of the medial prefrontal cortex and heart-rate reactivity. Neuroimage. 2009;47:821–835. doi: 10.1016/j.neuroimage.2009.05.043. [DOI] [PMC free article] [PubMed] [Google Scholar]
- Watson D, Clark LA, Tellegen A. Development and validation of brief measures of positive and negative affect: the PANAS scales. J Pers Soc Psychol. 1988;54:1063–1070. doi: 10.1037/0022-3514.54.6.1063. [DOI] [PubMed] [Google Scholar]
- Whitfield-Gabrieli S, Ford JM. Default mode network activity and connectivity in psychopathology. Annu Rev Clin Psychol. 2012;8:49–76. doi: 10.1146/annurev-clinpsy-032511-143049. [DOI] [PubMed] [Google Scholar]
- Yerkes RM, Dodson JD. The relation of strength of stimulus to rapidity of habit-formation. J Comp Neurol Psychol. 1908;18:459–482. doi: 10.1002/cne.920180503. [DOI] [Google Scholar]