

Abstract
Oligodendrocyte precursor cells (OPCs) act as a reservoir of new oligodendrocytes (OLs) in homeostatic and pathological conditions. OPCs are activated in response to injury to generate myelinating OLs, but the underlying mechanisms remain poorly understood. Here, we show that chromodomain helicase DNA binding protein 7 (Chd7) regulates OPC activation after spinal cord injury (SCI). Chd7 is expressed in OPCs in the adult spinal cord and its expression is upregulated with a concomitant increase in Sox2 expression after SCI. OPC-specific ablation of Chd7 in injured mice leads to reduced OPC proliferation, the loss of OPC identity, and impaired OPC differentiation. Ablation of Chd7 or Sox2 in cultured OPCs shows similar phenotypes to those observed in Chd7 knock-out mice. Chd7 and Sox2 form a complex in OPCs and bind to the promoters or enhancers of the regulator of cell cycle (Rgcc) and protein kinase Cθ (PKCθ) genes, thereby inducing their expression. The expression of Rgcc and PKCθ is reduced in the OPCs of the injured Chd7 knock-out mice. In cultured OPCs, overexpression and knock-down of Rgcc or PKCθ promote and suppress OPC proliferation, respectively. Furthermore, overexpression of both Rgcc and PKCθ rescues the Chd7 deletion phenotypes. Chd7 is thus a key regulator of OPC activation, in which it cooperates with Sox2 and acts via direct induction of Rgcc and PKCθ expression.
SIGNIFICANCE STATEMENT Spinal cord injury (SCI) leads to oligodendrocyte (OL) loss and demyelination, along with neuronal death, resulting in impairment of motor or sensory functions. Oligodendrocyte precursor cells (OPCs) activated in response to injury are potential sources of OL replacement and are thought to contribute to remyelination and functional recovery after SCI. However, the molecular mechanisms underlying OPC activation, especially its epigenetic regulation, remain largely unclear. We demonstrate here that the chromatin remodeler chromodomain helicase DNA binding protein 7 (Chd7) regulates the proliferation and identity of OPCs after SCI. We have further identified regulator of cell cycle (Rgcc) and protein kinase Cθ (PKCθ) as novel targets of Chd7 for OPC activation.
Keywords: chromatin remodeler, NG2 cells, oligodendrocyte, oligodendrocyte precursor cell
Introduction
Oligodendrocytes (OLs) are the myelinating cells of the CNS, which enable saltatory conduction of action potentials and provide trophic support to maintain axonal integrity (Simons and Nave, 2015). During CNS development, OLs arise through the following stages: oligodendrocyte precursor cell (OPC) specification from multipotent neural precursor cells (NPCs), OPC differentiation into immature OLs, and maturation into myelinating OLs (Fancy et al., 2011; Gallo and Deneen, 2014; Bergles and Richardson, 2015). A large number of OPCs persist into adulthood and are widely distributed throughout the adult CNS (Dawson et al., 2003; Rivers et al., 2008; Kang et al., 2010; Zawadzka et al., 2010; Young et al., 2013). Adult OPCs, which retain the ability to generate new OLs, are maintained in a quiescent state under normal circumstances (Dawson et al., 2003; Rivers et al., 2008; Kang et al., 2010; Zawadzka et al., 2010; Young et al., 2013).
Spinal cord injury (SCI) leads to OL loss and demyelination, along with neuronal death, resulting in impairment of motor or sensory functions. In response to SCI, OPCs change rapidly from a quiescent state to one of active proliferation (McTigue et al., 2001; Dimou and Gallo, 2015; Franklin and Goldman, 2015). The activated OPCs are potential sources of OL replacement and are thought to contribute to remyelination and functional recovery after SCI (Li and Leung, 2015; Fernandez-Castaneda and Gaultier, 2016; Levine, 2016). However, the molecular mechanisms underlying OPC activation after injury are still poorly understood.
Oligodendrogenesis is regulated by extrinsic signals such as fibroblast growth factor (FGF), platelet-derived growth factor (PDGF), and neuronal activity, as well as intrinsically by transcription factors and epigenetic mechanisms, including histone modification, DNA methylation, and chromatin remodeling (Zuchero and Barres, 2013; Emery and Lu, 2015; Moyon et al., 2016). Although the roles of transcription factors in oligodendrogenesis are relatively well known (Küspert and Wegner, 2016), how epigenetic factors control oligodendrogenesis is only beginning to be understood. Chromatin remodeling, regulated by ATP-dependent chromatin remodeling complexes, plays critical roles in OL development. The ATP-dependent SWI/SNF chromatin-remodeling enzyme Brg1 is recruited by Olig2 to the enhancer regions of OL-related genes and is required for oligodendrogenesis, although Brg1 has been reported to play distinct roles in OL specification, differentiation, and maturation (Yu et al., 2013; Bischof et al., 2015; Matsumoto et al., 2016).
Chromodomain helicase DNA binding protein 7 (Chd7) is another ATP-dependent chromatin-remodeling enzyme and is a member of the Chd family of chromatin remodelers (Hall and Georgel, 2007). Heterozygous mutations of the CHD7 gene are the major cause for human CHARGE syndrome, a complex developmental disorder characterized by multiple congenital anomalies (coloboma of the eye, heart defects, atresia of the choanae, severe retardation of growth and development, genital abnormalities, and ear abnormalities) (Bergman et al., 2011; Basson and van Ravenswaaij-Arts, 2015). Chd7 binds to the enhancer regions and near transcription start sites marked by H3K4 methylation to regulate gene transcription (Schnetz et al., 2009; Schnetz et al., 2010). Chd7 controls the proliferation, quiescence, and neurogenesis of neural stem cells (Layman et al., 2009; Hurd et al., 2010; Feng et al., 2013; Micucci et al., 2014; Jones et al., 2015; Ohta et al., 2016). In addition, it has been reported recently that Chd7 and Sox10 form a complex and cooperatively regulate OL differentiation and myelination (He et al., 2016). However, the role of Chd7 in OPC regulation remains largely unknown.
In this study, we provide evidence that Chd7 regulates OPC activation after SCI. OPC-specific deletion of Chd7 in a mouse model of SCI and Chd7 ablation in OPC cultures revealed that Chd7 is required for the maintenance of the proliferative OPC phenotype. Moreover, we have identified Sox2 as binding partner of Chd7 and regulator of cell cycle (Rgcc) and protein kinase Cθ (PKCθ) as direct targets of the Chd7–Sox2 complex in OPCs. Our results suggest that Chd7 and Sox2 cooperatively regulate OPC activation through the induction of Rgcc and PKCθ expression after injury.
Materials and Methods
Animals.
Chd7flox/flox mice [European Mouse Mutant Archive (EMMA) ID, EM:04817] (http://www.informatics.jax.org/allele/MGI:4433295) were obtained from the EMMA mouse repository in Munich, Germany. PDGFRα-CreER mice (Kang et al., 2010) were obtained from The Jackson Laboratory (stock no. 018280; https://www.jax.org/strain/018280). CAG-CAT-EGFP mice (Kawamoto et al., 2000) (http://www.informatics.jax.org/allele/MGI:3652575) were kindly provided by J. Miyazaki. These mice were maintained in a C57BL/6J background. C57BL/6J (https://www.jax.org/strain/000664) and pregnant ICR mice (http://www.criver.com/products-services/basic-research/find-a-model/cd-1-mouse) were obtained from Charles River Laboratories. All mice were maintained and studied according to protocols approved by the Animal Care and Use Committees of the National Rehabilitation Center for Persons with Disabilities.
Surgical procedures and behavioral analysis.
Both male and female adult mice (8–10 weeks of age) were used throughout the experiments except for the behavioral analysis, for which only adult female mice were used. Animals were deeply anesthetized via intraperitoneal injection of an anesthetic mixture of medetomidine (0.3 mg/kg), midazolam (4 mg/kg), and butorphanol (5 mg/kg). The spinal column was exposed from the eighth to the 10th thoracic (T8–T10) level and a laminectomy was performed at the T9 level. The lateral processes at the T8 and the T10 levels were stabilized with immobilized forceps attached to a commercially available SCI device (Infinite Horizons impactor; Precision Systems) and an impact force of 60 kdyn was delivered. After injury, hemostasis was obtained and the skin was sutured. To provide a more rapid recovery from anesthesia, the mice were injected intraperitoneally with atipamezole (0.3 mg/kg). Mice were monitored daily for general health state, mobility within the cage, infections, and autophagy of the toes throughout the experiment. Bladders were expressed manually twice daily for the first week after the operation and once daily thereafter as required. Mice with surgical site infection or disruption were excluded from the experiment. Hindlimb locomotor function was evaluated with the locomotor open-field rating scale on the Basso Mouse Scale (BMS).
Tamoxifen and BrdU administration.
Tamoxifen (Sigma-Aldrich) was dissolved in sunflower seed oil (Sigma-Aldrich) at 20 mg/ml and administered intraperitoneally to adult mice at a dose of 50 μg/g body weight once a day for 5 consecutive days. Injured mice received intraperitoneal injections of 5-bromo-2′-deoxyuridine (BrdU, 50 mg/kg; Sigma-Aldrich) 4 times every 2 h at 3 d postinjury (dpi). Intact adult mice were provided with drinking water containing 1 mg/ml BrdU and 1% sucrose, which was exchanged every 2 d for 8 d, and additionally received intraperitoneal injections of BrdU (50 mg/kg) once daily for 8 d. To induce Cre-mediated recombination in OPCs during development, tamoxifen (80 μg/g of body weight) was administered to pregnant dams at embryonic day 13.5 (E13.5) and embryos were analyzed at E15.5. BrdU (50 mg/kg) was administered intraperitoneally to pregnant dams 2 h before sampling.
Antibodies.
Immunostaining was performed with the following antibodies: Chd7 (Abcam, ab31824, rabbit, 1:500 dilution; OriGene, TA309607, rabbit, 1:500; Abcam, ab134832, goat, 1:200; Santa Cruz Biotechnology, sc390742, mouse, 1:200), Olig2 (Millipore, AB9610, rabbit, 1:1000; Millipore, MABN50, mouse, 1:500), Sox10 (Santa Cruz Biotechnology, sc17342, goat, 1:500; Abcam, ab155279, mouse, 1:5000), Sox2 (Santa Cruz Biotechnology, sc17320, goat, 1:200), CC1 (Millipore, OP80, mouse, 1:500), glutathione S-transferase π (GSTπ) (BD Biosciences, 610719, mouse, 1:1000), GFAP (Millipore, MAB360, mouse, 1:1000; Millipore, AB5804, rabbit, 1:1000; Abcam, ab4674, chicken, 1:2000), NG2 (Millipore, AB5320, rabbit, 1:200), PDGFRα (BD Biosciences, 558774, rat, 1:200), myelin-associated glycoprotein (MAG) (Millipore, MAB1567, mouse, 1:400), NFIA (Sigma-Aldrich, HPA006111, rabbit, 1:200), Myelin basic protein (MBP) (Bio-Rad, MCA409S, rat, 1:200), Galactocerebroside (GalC) (Millipore, MAB342, mouse, 1:500), Ki67 (Abcam, ab15580, rabbit, 1:1000), cleaved caspase 3 (Cell Signaling Technology, 9661, rabbit, 1:1000), Rgcc (Sigma-Aldrich, SAB1101621, rabbit, 1:200), PKCθ (Abcam, ab109481, rabbit, 1:200), and GFP (MBL, 598, rabbit, 1:2000; Abcam, ab13970, chicken, 1:2000). Immunoreactive cells were visualized by staining with secondary antibodies conjugated with Alexa Fluor 350, 488, 568, 594, 633, or 647 (1:400; Thermo Fisher Scientific).
Plasmid constructs and retrovirus production.
The retroviral vectors pcUXIE and pMX-IRES-EGFP (pMXIG) (Morita et al., 2000) were kindly provided by H. Song and T. Kitamura, respectively, and the plasmid pCAG-IRES-EGFP (pCAGIG) was kindly provided by C. L. Cepko and T. Matsuda. Human Chd7 cDNA was obtained from Promega. Human Sox2, mouse Rgcc, and mouse PKCθ cDNAs were obtained from transOMIC Technologies. Cre and CreERT2 cDNAs were gifts from A. Chenn (Addgene plasmid #26647) and C.L. Cepko (Addgene plasmid #14797), respectively. These cDNAs were subcloned into pcUXIE, pMXIG, or pCAGIG. The pSIREN-shLuc (control shRNA), pSIREN-shChd7 (Chd7 shRNA), pSIREN-shSox2 (Sox2 shRNA), pSIREN-shRgcc (Rgcc shRNA), and pSIREN-shPKCθ (PKCθ shRNA) retroviral constructs were generated as specified by the manufacturer (Clontech). The pSIREN shRNA vector was modified to express GFP under the control of the phosphoglycerate kinase (PGK) gene promoter by replacement of the puromycin resistance gene with the GFP gene, thus allowing the simultaneous expression of GFP and the shRNA of interest. The target sequences were as follows: Chd7 shRNA #1, 5′-GCTGATGACTGGAAGAAATCG-3′; Sox2 shRNAs #1 and #2, 5′-GACGCTCATGAAGAAGGATAA-3′ and 5′-GCTTAAATTTAGGACCGTTAC-3′, respectively; Rgcc shRNAs #1 and #2, 5′-GCGCCACTTCCACTATGAGGA-3′ and 5′-GCAAATCGGCTACTAGAATCT-3′, respectively. PKCθ shRNAs #1 and #2, 5′-GCAGTGATCGCCTGTTATAGA-3′ and 5′-GCGACTTAATGTACCACATCC-3′, respectively. All viral vectors and pVSV-G were introduced into the packaging cell lines Plat-GP by transfection with polyethyleneimine (PEI) (Polysciences). The culture supernatants were harvested 3 d after transfection, centrifuged at 3000 rpm for 5 min at room temperature (RT), and filtered through 0.45 μm pore size filters (Corning) to remove cellular debris. The viral supernatants were concentrated by ultracentrifugation at 25000 rpm for 2 h at 4°C and virus pellets were resuspended in DMEM (Thermo Fisher Scientific, 11995-065).
OPC culture and retrovirus infection.
Oligosphere culture (Chen et al., 2007; Pedraza et al., 2008) was performed with some modifications. E15.5 mouse embryos were collected from timed pregnant mice and placed in DMEM/F-12 HAM (Sigma-Aldrich, D8062). The forebrain was removed from the rest of the embryo under dissection microscope (Zeiss, SV-11). The tissue was dissociated by incubation in a low-Ca2+, high-Mg2+ artificial CSF containing the following (in mm): 124 NaCl, 5 KCl, 3.2 MgCl2, 0.1 CaCl2, 26 NaHCO3, and 10 D-glucose, along with 100 units/ml penicillin and 100 μg/ml streptomycin (Thermo Fisher Scientific) containing 0.05% (w/v) trypsin (Sigma-Aldrich), 0.67 mg/ml hyaluronidase (Sigma-Aldrich), and 0.1 mg/ml deoxyribonuclease I (Roche) at 37°C for 10 min. Subsequently, trypsin was neutralized with 0.7 mg/ml ovomucoid (Sigma-Aldrich) and the resultant tissue suspension was triturated mechanically to yield a single-cell suspension. The cells were filtered through a sterile nylon mesh (40 μm; Corning), washed twice with DMEM/F-12 (Thermo Fisher Scientific, 11330-032), and cultured in DMEM/F-12 supplemented with B-27 supplement (Thermo Fisher Scientific), FGF2 (20 ng/ml) (Peprotech), EGF (20 ng/ml) (Roche), and heparin (2 μg/ml) (Sigma-Aldrich). Primary spheres were dissociated at day 2 after seeding, replated, and cultured in DMEM/F-12 supplemented with B-27 supplement, FGF2 (10 ng/ml), PDGF-AA (10 ng/ml) (Peprotech), and heparin (2 μg/ml). Secondary spheres were dissociated at day 4, plated at a density of 5 × 10⁴ cells/ml, and cultured with FGF2, PDGF-AA, B-27 supplement, and N2 supplement (Thermo Fisher Scientific). Half of the medium was replaced with fresh medium every other day for 8 d. The tertiary spheres, referred to as oligospheres, were dissociated, seeded in culture dishes or glass chambers coated with poly-D-lysine (PDL, 100 μg/ml) (Sigma-Aldrich), and cultured with FGF2, PDGF-AA, and B-27 and N2 supplements. OPCs were incubated with retrovirus for 8 h and then washed with the culture medium. Two days after infection, the cells were subjected to proliferation and differentiation assays. For the proliferation assay, dividing cells were labeled with 5-ethynyl-2′-deoxyuridine (EdU, 4 μm) (Thermo Fisher Scientific) for 2 h. For the differentiation assay, the cells were cultured for 5 d without FGF2 and PDGF-AA and with B-27 and N2 supplements and triiodothyronine (T3, 40 ng/ml) (Sigma-Aldrich). To induce Cre recombination in cultured OPCs, 4-hydroxytamoxifen (4-OHT, 1 μm) (Sigma-Aldrich) was added to the cultures.
Cell culture and transfection.
293T cells (ATCC) were maintained in DMEM (Wako, 044-29765) containing 10% fetal bovine serum (FBS) (Thermo Fisher Scientific). The cells were transfected using PEI. The medium was replaced 6 h after transfection and the cells were harvested at 48 h after transfection.
Tissue preparation and immunostaining.
Mice were anesthetized with pentobarbital (50 mg/kg) and perfused transcardially with 4% paraformaldehyde (PFA; TAAB Laboratories Equipment). The adult spinal cords were removed and postfixed with 4% PFA overnight at 4°C. Embryos were fixed with 4% PFA for 10 h at 4°C. The tissues were cryoprotected with 20% sucrose overnight at 4°C, followed by 30% sucrose overnight at 4°C, and embedded in Tissue-Tek OCT compound (Sakura Finetek). Transverse sections (thickness of 16 μm for adult spinal cords and 14 μm for embryos) were incubated in a blocking solution (4% donkey serum; Millipore) for 2 h at RT, with primary antibodies overnight at RT, and then with secondary antibodies for 2 h at RT. BrdU staining was performed using a Frontier BrdU Immunohistochemistry Kit (Exalpha Biologicals). FluoroMyelin Red staining was performed according to the manufacturer's protocol (1:200; Thermo Fisher Scientific). Cell nuclei were stained with Hoechst 33342 (Sigma-Aldrich). The slides were mounted with ProLong Gold Antifade Reagent (Thermo Fisher Scientific) and images were captured with a BZ-9000 digital microscope system (Keyence). For immunocytochemistry, cultured cells were fixed with 4% PFA for 20 min at RT and incubated in a blocking solution (10% FBS; Thermo Fisher Scientific) for 30 min at RT. The cells were incubated with primary antibodies for 3 h and then with secondary antibodies for 1 h at RT. EdU staining was performed using a Click-iT EdU Imaging Kit (Thermo Fisher Scientific).
Reverse transcription (RT) and real-time PCR analysis.
Total RNA was isolated using an RNeasy Mini Kit (Qiagen) and portions (1 μg) of the RNA were subjected to RT using a ReverTra Ace qPCR RT Kit (Toyobo). The resulting cDNA was subjected to real-time PCR analysis in an Applied Biosystems 7500 Real Time PCR System with Power SYBR Green PCR Master Mix (Thermo Fisher Scientific). Glyceraldehyde-3-phosphate dehydrogenase (GAPDH) mRNA was examined as an internal control. The primers (sense and antisense, respectively) were as follows: mouse Chd7, 5′-AGAAAAGCCTTGTGCAAAGCC-3′ and 5′-CCAGCCGTAAACCAGCAGATT-3′; mouse Sox2, 5′-AACGCCTTCATGGTATGGTCC-3′ and 5′-GGACAAAAGTTTCCACTCCGC-3′; mouse PDGFRα, 5′-CATTTGGAAGCAGAAACCACG-3′ and 5′-AGTCGTAAGGCAACTGCATGG-3′; mouse Myt1, 5′-TCATCACCCACAGACAGCTGA-3′ and 5′-AAGTTGCAATGATCCCCTGG-3′; mouse CSPG4, 5′-ATTCCCCATCCACATTGGTG-3′ and 5′-AGCCAACTTGCCATGGTGA-3′; mouse Hes5, 5′-ACCGCATCAACAGCAGCATAG-3′ and 5′-CGAAGGCTTTGCTGTGTTTCA-3′; mouse Sox9, 5′-CCAACATTGAGACCTTCGACGT-3′ and 5′-ATGCCGTAACTGCCAGTGTAGG-3′; mouse Id2, 5′-CCCAGAACAAGAAGGTGACCA-3′ and 5′-TGATGCAGGCTGACGATAGTG-3′; mouse Sox10, 5′-TCTCACGACCCCAGTTTGACT-3′ and 5′-GCCCCATGTAAGAAAAGGCTG-3′; mouse Olig2, 5′-CCACGTCTTCCACCAAGAAAG-3′ and 5′-ATCTTGGAGAGCTTGCGCA-3′; mouse Rgcc, 5′-TCTCCAACCAACTCCTCTCCA-3′ and 5′-TGTCCAGATCGGCAATGAAG-3′; mouse PKCθ, 5′-AAATAAATCGGCCGGTCCTC-3′ and 5′-TCCCAACATCTTGTGCAGGAT-3′; and mouse GAPDH, 5′-GCAAAGTGGAGATTGTTGCCAT-3′ and 5′-CCTTGACTGTGCCGTTGAATTT-3′.
Chromatin immunoprecipitation (ChIP) assay.
OPCs were cultured with FGF2, PDGF-AA, and B-27 and N2 supplements on PDL-coated dishes. The ChIP assay was performed using a ChIP-IT Express Enzymatic Kit (Active Motif) with some modifications. The cells were fixed with 1% formaldehyde and the cross-linking reaction was terminated by the addition of glycine. The cross-linked chromatin was sheared into fragments by enzymatic digestion at 37°C for 10 min and the fragments were then incubated overnight at 4°C with antibodies to Chd7 (Abcam, ab176807, rabbit, 2 μg), Sox2 (R&D Systems, AF2018, goat, 2 μg), or H3K27ac (Abcam, ab4729, rabbit, 2 μg) or with normal rabbit IgG (Santa Cruz Biotechnology, sc2027, 2 μg) or normal goat IgG (Santa Cruz Biotechnology, sc2028, 2 μg). After the addition of Dynabeads Protein G (Thermo Fisher Scientific), the mixture was incubated with rotation for 3 h. The beads were then isolated and washed consecutively with a low-salt solution (0.1% SDS, 1% Triton X-100, 2 mm EDTA, 20 mm Tris-HCl, pH 8.1, 150 mm NaCl), a high-salt solution (0.1% SDS, 1% Triton X-100, 2 mm EDTA, 20 mm Tris-HCl, pH 8.1, 500 mm NaCl), and an LiCl solution (0.25 m LiCl, 1% Nonidet P-40, 1% sodium deoxycholate, 1 mm EDTA, 10 mm Tris-HCl, pH 8.1), and then twice with a Tris-EDTA solution (10 mm Tris-HCl, pH 8.0, 1 mm EDTA). Immune complexes were eluted from the beads with a solution containing 10 mm dithiothreitol, 1% SDS, and 0.1 m NaHCO3, after which NaCl was added to a final concentration of 0.2 m and the eluate was incubated at 65°C overnight. Proteins were eliminated by digestion with proteinase K (Thermo Fisher Scientific) at 45°C for 1 h and the remaining DNA was purified using a QIAquick spin column (Qiagen). The eluted DNA was subjected to real-time PCR analysis in an Applied Biosystems 7500 Real Time PCR System with Power SYBR Green PCR Master Mix (Thermo Fisher Scientific). The amount of target genomic DNA was normalized by that of the input. The PCR primers (sense and antisense, respectively) were as follows: Rgcc gene R1, 5′-ACACCGTGTGGTCTGGCCT-3′ and 5′-TCTCCGGTCTGTGGAACTGC-3′; R2, 5′-TGGGTGCACTCATCATCAGG-3′ and 5′-TGCTTTGCCCAGGGTCTTT-3′; R3, 5′-ACGCTGTGAGCTGCCATGTA-3′ and 5′-GTCAGAGGACCTGGGTTTGG-3′; R4, 5′-AAGATGCTGGGCACTATGGC-3′ and 5′-TTCACCTGTCCTGCACTGGA-3′; R5, 5′-TTGCGGCTCTTGGCATATC-3′ and 5′-CAATTAGCAGCGATGATGGCT-3′; and R6, 5′-TTTCCTAGTGGGACAGGCTCC-3′ and 5′-ACAGCACATGGGATGCTCAC-3′. PKCθ geneR1, 5′-TGTGGCCATTTAAAGATGATGTATG-3′ and 5′-CTCCTCAGCAGGCTTCTGGT-3′; R2, 5′-TCTGGCCTTCCTGTACTGCA-3′ and 5′-TCGCGCACTTAATAAAATTACATTTT-3′; R3, 5′-CGAAAAGTTGCTGCCGAAAT-3′ and 5′-TGATGTTTTGAACTGCTGTAAACTGT-3′; R4, 5′-TTCAGCTAAGCAAGAAGAGACTGC-3′ and 5′-GCCTGAGTGCCAGAAAGGG-3′; R5, 5′-TGGAGGTGCCAAAGATCAGG-3′ and 5′-TTGCAAGAGACATTCGGGTG-3′; R6, 5′-AAGGCTCGCTGATCCCATTA-3′ and 5′-AAGATCCTTCGAGCGTGCTG-3′; R7, 5′-AGGTCCTCATTGGGCCTGAT-3′ and 5′-CCTCAGAAGGCTGGGATTCC-3′; and R8, 5′-TCCATGGAAGCCTTTTGTGC-3′ and 5′-CCCAACACATGGTGAGCCA-3′.
Immunoprecipitation and Western blot analysis.
The transfected 293T cells were lysed in a lysis buffer containing 50 mm HEPES-NaOH, pH 7.5, 50 mm NaCl, 0.5% Triton X-100, 1 mm EDTA, 1 mm EGTA, 1 mm dithiothreitol, 1 mm phenylmethylsulfonyl fluoride, 0.5% protease inhibitor mixture (Sigma-Aldrich), 1 mm Na3VO4, 10 mm NaF, and 20 mm β-glycerophosphate, and the cell lysates were centrifuged at 15,000 rpm for 10 min at 4°C. The supernatants were incubated overnight at 4°C with antibodies to Sox2 (Santa Cruz Biotechnology, sc17320, goat) and Chd7 (Cell Signaling Technology, 6505, rabbit). After the addition of Dynabeads Protein G (Thermo Fisher Scientific), the mixture was incubated with rotation for 3 h. The immunoprecipitates were washed 4 times with a lysis buffer and subjected to immunoblotting with antibodies to Chd7 (Cell Signaling Technology, 6505, rabbit, 1:1000) and Sox2 (Santa Cruz Biotechnology, sc17320, goat, 1:200). Immunoreactive bands were visualized with secondary horseradish peroxidase-conjugated antibodies (Promega, W4011, rabbit, 1:4000; Promega, V8051, goat, 1:5000), and Chemi-Lumi One (Nacalai Tesque) or ECL Prime Western Blotting Detection Reagent (GE Healthcare). For immunoprecipitation of endogenous Chd7 and Sox2, oligospheres were incubated with 2 mm dithiobis(succinimidyl propionate) (Thermo Fisher Scientific) in PBS for 2 h at 4°C and crosslinking was terminated with 20 mm Tris-HCl, pH 8.0, at RT. Immunoprecipitation was performed using a Nuclear Complex Co-IP Kit (Active Motif) according to the manufacturer's instructions.
Proximity ligation assay (PLA).
OPCs were cultured with FGF2, PDGF-AA, and B-27 and N2 supplements on PDL-coated dishes. PLA was performed using a Duolink in situ red starter kit (Sigma-Aldrich) according to the manufacturer's instructions. OPCs were fixed with 4% PFA for 20 min at RT and incubated in a blocking solution (Sigma-Aldrich) for 30 min at 37°C. The cells were incubated with antibodies to Sox2 (Santa Cruz Biotechnology, sc17320, goat, 1:200) and to Chd7 (OriGene, TA309607, rabbit, 1:500), normal rabbit IgG (Santa Cruz Biotechnology, sc2027, 1:400), and normal goat IgG (Santa Cruz Biotechnology, sc2028, 1:400) for 3 h, with secondary antibodies conjugated with oligonucleotides (Sigma-Aldrich, PLA probe anti-rabbit PLUS, DUO92002; PLA probe anti-goat MINUS, DUO92006) for 1 h at 37°C; in ligation–ligase solution for 30 min at 37°; and in amplification–polymerase solution for 100 min at 37°C. The slides were mounted with mounting medium containing DAPI (Sigma-Aldrich).
Microarray analysis.
OPCs derived from E15.5 mouse forebrain were infected with control or Chd7 knock-down viruses and virus-infected OPCs were harvested 3 d after infection. Total RNA was isolated using an RNeasy Plus Mini Kit (Qiagen). Microarray analysis was performed using 3D-Gene Mouse Oligo chip 24k (Toray Industries). The microarray data are available in the Gene Expression Omnibus (GEO) database (accession number GSE95347). Gene ontology (GO) analysis was performed using ToppFun (ToppGene Suite; https://toppgene.cchmc.org).
Experimental design and statistical analysis.
Female adult mice (8–10 weeks of age) were used for immunohistochemical analysis of the sections of intact spinal cord (see Figs. 1, 10). At least three transverse sections of intact spinal cord were observed and, for quantification, in total, >200 marker-positive cells were counted for each immunostaining (see Fig. 1). Both male and female adult mice (8–10 weeks of age) and embryonic mice (E15.5) were used for immunohistochemical analysis of spinal cord sections from control and Chd7 conditional knock-out mice (see Figs. 2, 3, 4, 5, 10). In the injured spinal cords, at least three transverse sections from the lesion epicenter and areas within 600 μm rostral and caudal to the epicenter were selected from each animal. In intact adult and embryonic mice, at least three transverse sections of spinal cords were chosen from each animal. For quantification, in total, >600 GFP+ cells were counted for each genotype and the percentages of marker-positive cells among total GFP+ cells were determined. For the behavioral analysis, adult female mice were used for each genotype (control, n = 5 animals; Chd7 cKO, n = 6 animals; see Fig. 4H). For all analyses using cultured OPCs, at least three independent experiments were performed (see Figs. 1, 6, 7, 8, 9, 11, 12) and, for quantification, in total, >600 GFP+ cells (see Figs. 6, 7, 11, 12) were counted for each sample. The number of animals or independent experiments is shown in the Results section and in the legends for each figure. Quantitative data are presented as means ± SD and were analyzed with the two-tailed unpaired Student's t test. BMS scores were presented as median ± SEM and the Mann–Whitney U test was used to compare the difference in the BMS scores between groups. A p-value of <0.05 was considered statistically significant. Degrees of freedom, t-values, and p-values are shown in the Results section and in the legends for each figure.
Figure 1.
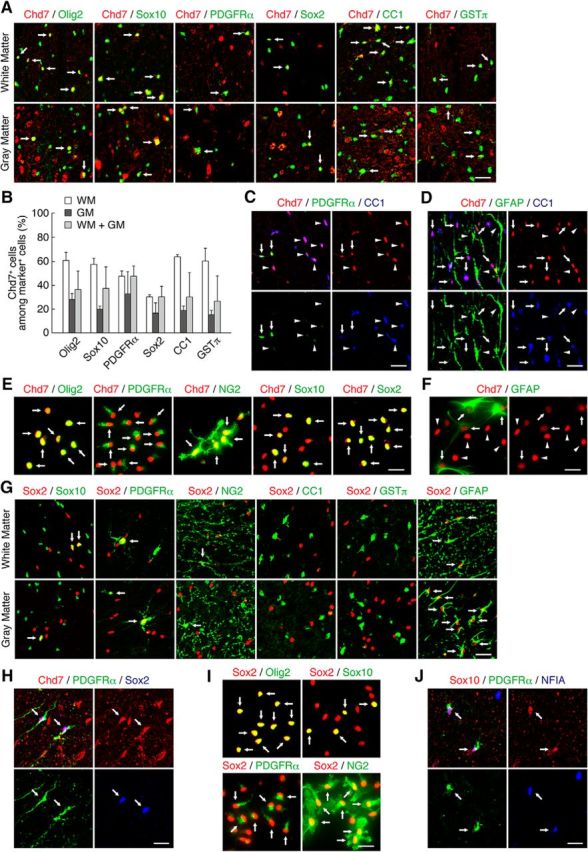
Expression of Chd7 and Sox2 in the adult mouse spinal cord and in cultured OPCs. A, Double staining for Chd7 and either Olig2, Sox10, PDGFRα-GFP, Sox2, CC1, or GSTπ in the WM and GM of the spinal cord is shown. B, Quantitation of the percentages of Chd7+ cells among marker-positive cells in A. Data are shown as means ± SD (n = 3–9 slices from 3 animals). C, Chd7+/PDGFRα-GFP+/CC1− cells (arrows) and Chd7+/PDGFRα-GFP−/CC1+ cells (arrowheads) in the adult spinal cord. D, Chd7+/GFAP−/CC1+ cells (arrows) and Chd7−/GFAP+/CC1− cells (arrowheads) in the adult spinal cord. E, OPCs derived from the E15.5 mouse forebrain were cultured with FGF2 and PDGF-AA. Double staining for Chd7 and either Olig2, PDGFRα, NG2, Sox10, or Sox2 in cultured OPCs is shown. F, Chd7low/GFAP+ cells (arrows) and Chd7high/GFAP− cells (arrowheads) in cultured OPCs. G, Double staining for Sox2 and either Sox10, PDGFRα-GFP, NG2, CC1, GSTπ, or GFAP in the WM and GM of the spinal cord. H, Triple staining for Chd7, PDGFRα, and Sox2 in the adult spinal cord. I, OPCs were cultured with FGF2 and PDGF-AA. Double staining for Sox2 and either Olig2, Sox10, PDGFRα, or NG2 in cultured OPCs is shown. J, Triple staining for Sox10, PDGFRα, and NFIA in the adult spinal cord. Arrows indicate double-positive (A, E, G, I) and triple-positive (H, J) cells. Scale bars: A, C, D, G, H, J, 50 μm; E, F, I, 25 μm.
Figure 10.

Chd7 is necessary for the induction of expression of Rgcc and PKCθ. A, Double staining for Rgcc and either Chd7 or Sox2 in the adult spinal cord. B, Double staining for PKCθ and either Chd7 or Sox2 in the adult spinal cord. C, Double staining for Rgcc and either Olig2, Sox10, PDGFRα-GFP, or GFAP in the adult spinal cord. D, Double staining for PKCθ and either Olig2, Sox10, PDGFRα-GFP, or GFAP in the adult spinal cord. E–G, Injured spinal cords of control and Chd7 cKO mice were isolated at 3 dpi and immunostained for Rgcc (E), PKCθ (F), and GFP. The percentages of marker-positive cells among total GFP+ cells were determined as means ± SD (n = 9 slices from 3 animals, Rgcc: Chd7 cKO, t(4) = 6.14, p = 0.0040; PKCθ: Chd7 cKO, t(4) = 4.55, p = 0.0100; unpaired Student's t test) (G). cKO, Conditional knock-out. Bottom, Higher-magnification views of the boxed areas in E and F. Arrows indicate double-positive cells (A–F). *p < 0.01, **p < 0.05 versus corresponding control value. Scale bars, 100 μm (E, F), 50 μm (A–D), and 25 μm (higher-magnification views in E, F).
Figure 2.
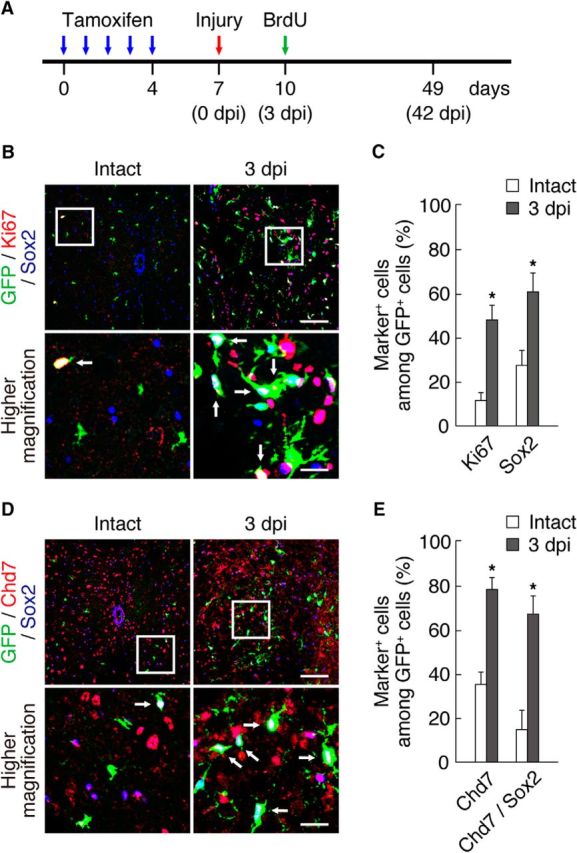
Expression of Chd7 and Sox2 in OPCs after SCI. A, Schematic diagram of the experimental design for this figure and Figures 3 and 4. Tamoxifen was administered once a day for 5 consecutive days (blue arrows), contusive SCI was performed on the mice 3 d after the last tamoxifen injection (red arrow), and BrdU was injected into the mice at 3 dpi (green arrow). The mice were analyzed at 3 and 42 dpi. B–E, The intact and injured (3 dpi) spinal cords of PDGFRα-CreER;CAG-CAT-EGFP mice were isolated and subjected to immunohistofluorescence analysis with antibodies to Ki67, Sox2, and GFP (B) and to Chd7, Sox2, and GFP (D). The percentages of marker-positive cells among total GFP+ cells were determined as means ± SD (n = 9 slices from 3 animals, Ki67: 3 dpi, t(4) = 8.35, p = 0.0010; Sox2: 3 dpi, t(4) = 5.26, p = 0.0060; Chd7: 3 dpi, t(4) = 9.11, p = 0.0010; Chd7/Sox2: 3 dpi, t(4) = 6.79, p = 0.0020; unpaired Student's t test) (C, E). Bottom, Higher-magnification views of the boxed areas in B and D. Arrows indicate triple-positive cells (B, D). *p < 0.01 versus value for intact spinal cord. Scale bars, 100 μm (B, D) and 25 μm (higher-magnification views in B, D).
Figure 3.

Chd7 is necessary for OPC proliferation after injury and the maintenance of OPC identity. A, Tamoxifen was administered to control (PDGFRα-CreER;Chd7+/+;CAG-CAT-EGFP) and Chd7 cKO (PDGFRα-CreER;Chd7flox/flox;CAG-CAT-EGFP) mice once a day for 5 consecutive days. Three days after the last tamoxifen injection, the spinal cords of control and Chd7 cKO mice were isolated and immunostained for Chd7 and GFP. Arrows and arrowheads indicate Chd7+/GFP+ cells and Chd7−/GFP+ cells, respectively. B–D, Injured spinal cords of control and Chd7 cKO mice were isolated at 3 dpi and subjected to immunohistofluorescence analysis with antibodies to BrdU and GFP (B) and to Ki67 and GFP (C). The percentages of marker-positive cells among total GFP+ cells were determined as means ± SD (n = 9 slices from 3 animals, BrdU: Chd7 cKO, t(4) = 5.99, p = 0.0040; Ki67: Chd7 cKO, t(4) = 3.40, p = 0.0270; unpaired Student's t test) (D). E, F, Injured spinal cords of control and Chd7 cKO mice were isolated at 3 dpi and immunostained for cleaved caspase 3 (cl-Casp3) and GFP (E). The percentages of cl-Casp3+ cells among total GFP+ cells were determined as means ± SD (n = 9 slices from 3 animals, cl-Casp3: Chd7 cKO, t(4) = 1.23, p = 0.2840; unpaired Student's t test) (F). G–I, Injured spinal cords of control and Chd7 cKO mice were isolated at 3 dpi and immunostained for NG2 (G), Sox10 (H), and GFP. The percentages of marker-positive cells among total GFP+ cells were determined as means ± SD (n = 9 slices from 3 animals, NG2: Chd7 cKO, t(4) = 5.51, p = 0.0050; Sox10: Chd7 cKO, t(4) = 12.61, p = 0.0001; unpaired Student's t test) (I). cKO, Conditional knock-out; NS, nonsignificant. Bottom, Higher-magnification views of the boxed areas in A–C, E, G, and H. Arrows indicate marker-positive/GFP+ cells (B, C, G, H). *p < 0.01, **p < 0.05 versus corresponding control value. Scale bars, 100 μm (A–C, E, G, H) and 25 μm (higher-magnification views in A–C, E, G, H).
Figure 4.

Chd7 is necessary for OPC differentiation into OLs and remyelination after SCI. A–C, Injured spinal cords of control and Chd7 cKO mice were isolated at 42 dpi and subjected to immunostaining for GSTπ (A), Sox10 (B), and GFP. The percentages of marker-positive cells among total GFP+ cells were determined as means ± SD (n = 15–20 slices from 3–4 animals, GSTπ: Chd7 cKO, t(5) = 6.70, p = 0.0020; Sox10: Chd7 cKO, t(6) = 4.10, p = 0.0060; unpaired Student's t test) (C). D, E, Intact spinal cords of wild-type mice and the injured (42 dpi) spinal cords of control and Chd7 cKO mice were subjected to FluoroMyelin staining (D). The ratios of FluoroMyelin-positive area to the total section area were quantified as means ± SD (n = 9 slices from 3 animals, FluoroMyelin: Chd7 cKO, t(4) = 3.03, p = 0.0390; unpaired Student's t test) (E). F, G, Injured spinal cords of control and Chd7 cKO mice were isolated at 42 dpi and immunostained for GFAP, Sox10, and GFP (F). The percentages of GFAP+ cells among total GFP+ cells were determined as means ± SD (n = 20 slices from 4 animals, GFAP: Chd7 cKO, t(6) = 2.66, p = 0.0370; unpaired Student's t test) (G). H, Open-field locomotor recovery was assessed using the BMS in control and Chd7 cKO mice for 42 d after SCI. Data are median ± SEM (control: n = 5 animals, Chd7 cKO: n = 6 animals, Chd7 cKO: 28 d, p = 0.0300; 35 d, p = 0.0040; 42 d, p = 0.0090; Mann–Whitney U test). cKO, Conditional knock-out. Bottom, Higher-magnification views of the boxed areas in A and B. Arrows indicate marker-positive/GFP+ cells (A, B). Arrowheads and arrow indicate GFAP−/Sox10+/GFP+ cells and GFAP+/Sox10−/GFP+ cells, respectively (F). *p < 0.01, **p < 0.05 versus corresponding control value. Scale bars, 100 μm (A, B, D) and 25 μm (F and higher-magnification views in A, B).
Figure 5.
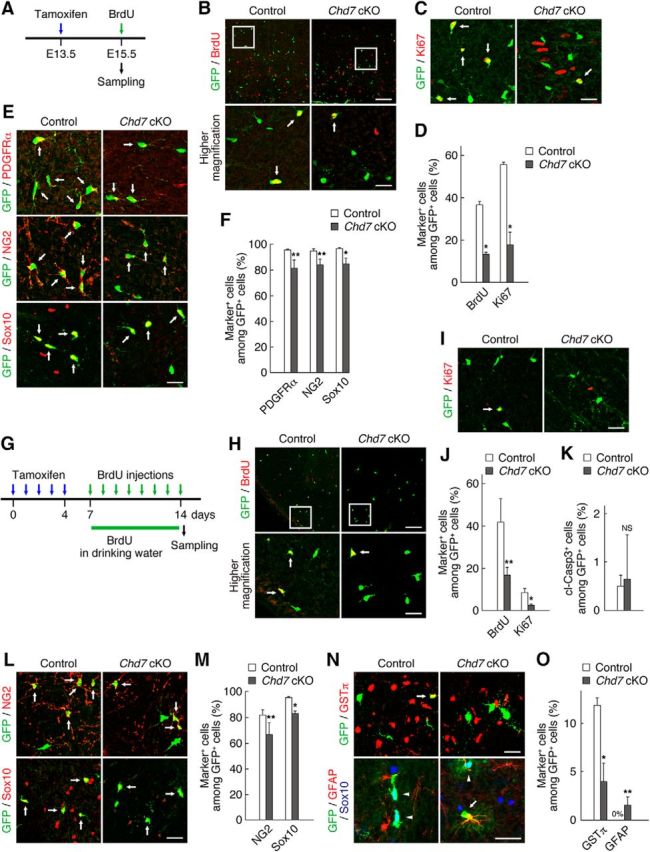
Chd7 is necessary for OPC proliferation and identity maintenance in the developing and intact adult spinal cord. A, Schematic diagram of the experimental design. Tamoxifen was administered to pregnant dams at E13.5 (blue arrow) and embryos were analyzed at E15.5. BrdU was injected intraperitoneally to pregnant dams 2 h before sampling (green arrow). B–F, Spinal cord sections of control and Chd7 cKO mouse embryos were immunostained for BrdU (B), Ki67 (C), PDGFRα, NG2, Sox10 (E), and GFP. The percentages of marker-positive cells among total GFP+ cells were determined as means ± SD (n = 9 slices from 3 animals, BrdU: Chd7 cKO, t(4) = 21.70, p = 0.0001; Ki67: Chd7 cKO, t(4) = 10.79, p = 0.0004; PDGFRα: Chd7 cKO, t(4) = 3.73, p = 0.0202; NG2: Chd7 cKO, t(4) = 4.42, p = 0.0114; Sox10: Chd7 cKO, t(4) = 4.64, p = 0.0097; unpaired Student's t test) (D, F). G, Schematic diagram of the experimental design. Tamoxifen was administered to adult control and Chd7 cKO mice once a day for 5 consecutive days (blue arrows). After tamoxifen treatment, BrdU was administered to the mice via the drinking water (green line) and by intraperitoneal injections for 8 d (green arrows). Two hours after the last BrdU injection, the intact spinal cords of control and Chd7 cKO mice were isolated and immunostained for BrdU (H), Ki67 (I), cleaved caspase 3 (cl-Casp3) (K), NG2, Sox10 (L), GSTπ, GFAP, Sox10 (N), and GFP. The percentages of marker-positive cells among total GFP+ cells were determined as means ± SD (n = 9–12 slices from 3 to 4 animals, BrdU: Chd7 cKO, t(4) = 3.71, p = 0.0206; Ki67: Chd7 cKO, t(4) = 5.18, p = 0.0065; cl-Casp3: Chd7 cKO, t(4) = 0.26, p = 0.8061; NG2: Chd7 cKO, t(6) = 3.01, p = 0.0236; Sox10: Chd7 cKO, t(4) = 9.35, p = 0.0007; GSTπ: Chd7 cKO, t(4) = 6.62, p = 0.0026; GFAP: Chd7 cKO, t(6) = 3.68, p = 0.0102; unpaired Student's t test) (J, K, M, O). cKO, Conditional knock-out; NS, nonsignificant. Bottom, Higher-magnification views of the boxed areas in B and H. Arrows indicate marker-positive/GFP+ cells (B, C, E, H, I, L, and top in N). Arrowheads and arrow indicate GFAP−/Sox10+/GFP+ cells and GFAP+/Sox10−/GFP+ cells, respectively (bottom in N). *p < 0.01, **p < 0.05 versus corresponding control value. Scale bars, 100 μm (B, H) and 25 μm (C, E, I, L, N and higher-magnification views in B, H).
Figure 6.

Chd7 is necessary for OPC proliferation, the maintenance of OPC identity, and OL differentiation in vitro. A, B, OPCs derived from Chd7flox/flox mice were infected with retroviruses encoding GFP alone (control) or GFP plus Cre and then cultured with FGF2 and PDGF-AA. Three days after infection, the cells were immunostained for Chd7 and GFP (A). Arrows and arrowheads indicate Chd7+/GFP+ cells and Chd7−/GFP+ cells, respectively. The cells were also harvested 3 d after infection and the expression level of Chd7 mRNA was measured by quantitative RT-PCR analysis (B). Data are expressed relative to the control value and are means ± SD (n = 3 experiments, Chd7: Cre, t(4) = 57.32, p = 0.0001; unpaired Student's t test). C–H, Chd7flox/flox OPCs infected with retroviruses for control or Cre were cultured with FGF2 and PDGF-AA. Three days after infection, the cells were labeled with EdU for 2 h and were stained for cleaved caspase 3 (cl-Casp3) (C), EdU, Ki67 (E), PDGFRα, Sox10 (G), and GFP. The percentages of marker-positive cells among total GFP+ cells were quantified as means ± SD (n = 3 experiments, cl-Casp3: Cre, t(4) = 0.81, p = 0.462; n = 5 experiments, EdU: Cre, t(8) = 5.77, p = 0.0004; Ki67: Cre, t(8) = 4.99, p = 0.0011; n = 3 experiments, PDGFRα: Cre, t(4) = 23.26, p = 0.0001; Sox10: Cre, t(4) = 12.60, p = 0.0002; unpaired Student's t test) (D, F, H). I, J, Chd7flox/flox OPCs infected with retroviruses for control or Cre were cultured with FGF2 and PDGF-AA. Two days after infection, the cells were induced to differentiate without FGF2 and PDGF-AA, and with T3 for 5 d, after which the cells were immunostained for Sox10, MBP, GFAP, and GFP. The percentages of marker-positive cells among total GFP+ cells were determined as means ± SD (n = 3 experiments, Sox10: Cre, t(4) = 27.05, p = 0.0001; MBP: Cre, t(4) = 12.99, p = 0.0002; GFAP: Cre, t(4) = 7.25, p = 0.0019; unpaired Student's t test). K, Chd7flox/flox OPCs infected with retroviruses for control or CreERT2 were cultured with FGF2 and PDGF-AA. Two days after infection, the cells were induced to differentiate without FGF2 and PDGF-AA and with T3 and treated with 4-OHT 8 h after induction of differentiation. After 5 d, the cells were immunostained for MBP and GFP. The percentages of marker-positive cells among total GFP+ cells were determined as means ± SD (n = 3 experiments, MBP: control + 4-OHT, t(4) = 0.19, p = 0.8563; CreERT2, t(4) = 0.71, p = 0.5144; CreERT2 + 4-OHT, t(4) = 18.83, p = 0.0001; unpaired Student's t test). NS, Nonsignificant. Arrows indicate marker-positive/GFP+ cells (C, E, G, I). *p < 0.01 versus corresponding control value. Scale bars: I, 50 μm; A, C, E, G, 25 μm.
Figure 7.
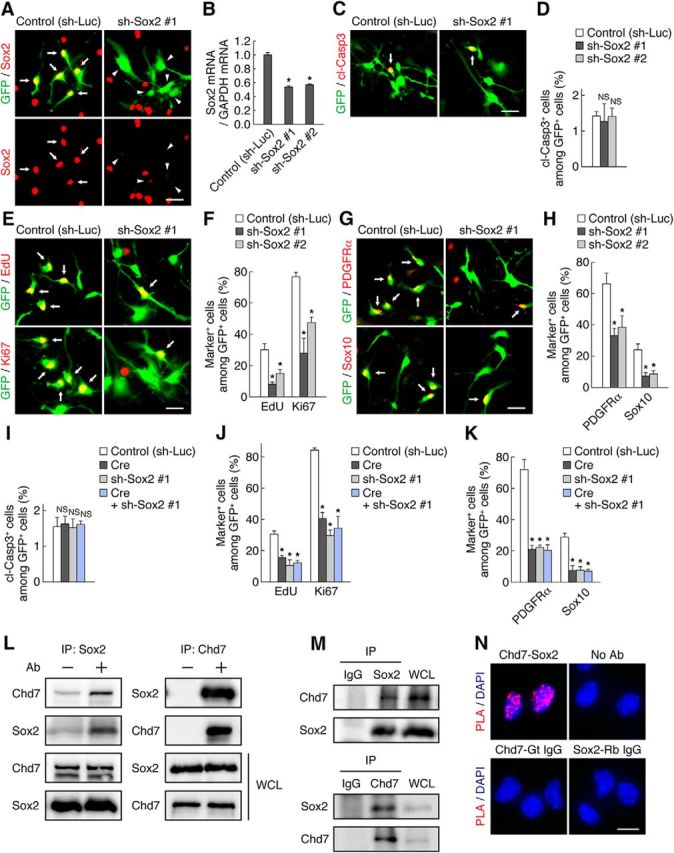
Sox2 is necessary for OPC proliferation and identity maintenance in vitro. A, OPCs were infected with retroviruses encoding GFP together with either a control shRNA (sh-Luc) or a Sox2 shRNA (sh-Sox2 #1) and were then cultured with FGF2 and PDGF-AA. Three days after infection, the cells were immunostained for Sox2 and GFP. Arrows and arrowheads indicate Sox2high/GFP+ cells and Sox2low/GFP+ cells, respectively. B, OPCs were infected with retroviruses for control, sh-Sox2 #1, or sh-Sox2 #2. The cells were harvested 3 d after infection and knock-down efficiency of the shRNAs was determined by quantitative RT-PCR analysis. Data are expressed relative to the control value and are means ± SD (n = 3 experiments, Sox2: sh-Sox2 #1, t(4) = 26.19, p = 0.0001; sh-Sox2 #2, t(4) = 25.04, p = 0.0001; unpaired Student's t test). C–H, OPCs infected with retroviruses for control, sh-Sox2 #1, or sh-Sox2 #2 were cultured with FGF2 and PDGF-AA. Three days after infection, the cells were labeled with EdU for 2 h and were stained for cleaved caspase 3 (cl-Casp3) (C), EdU, Ki67 (E), PDGFRα, Sox10 (G), and GFP. The percentages of marker-positive cells among total GFP+ cells were quantified as means ± SD (n = 3 experiments, cl-Casp3: sh-Sox2 #1, t(4) = 0.50, p = 0.6399; sh-Sox2 #2, t(4) = 0.06, p = 0.95; EdU: sh-Sox2 #1, t(4) = 8.78, p = 0.0009; sh-Sox2 #2, t(4) = 5.43, p = 0.0056; Ki67: sh-Sox2 #1, t(4) = 8.53, p = 0.0010; sh-Sox2 #2, t(4) = 10.99, p = 0.0004; PDGFRα: sh-Sox2 #1, t(4) = 6.93, p = 0.0023; sh-Sox2 #2, t(4) = 4.73, p = 0.0091; Sox10: sh-Sox2 #1, t(4) = 6.75, p = 0.0025; sh-Sox2 #2, t(4) = 6.15, p = 0.0035; unpaired Student's t test) (D, F, H). I–K, OPCs infected with retroviruses for control, Cre, sh-Sox2 #1, or Cre plus sh-Sox2 #1 were cultured with FGF2 and PDGF-AA. Three days after infection, the cells were labeled with EdU for 2 h and were stained for cl-Casp3 (I), EdU, Ki67 (J), PDGFRα, Sox10 (K), and GFP. The percentages of marker-positive cells among total GFP+ cells were quantified as means ± SD (n = 3 experiments, cl-Casp3: Cre, t(4) = 0.40, p = 0.7050; sh-Sox2 #1, t(4) = 0.14, p = 0.8924; Cre + sh-Sox2 #1, t(4) = 0.37, p = 0.7280; EdU: Cre, t(4) = 9.71, p = 0.0006; sh-Sox2 #1, t(4) = 8.30, p = 0.0011; Cre + sh-Sox2 #1, t(4) = 11.36, p = 0.0003; Ki67: Cre, t(4) = 18.18, p = 0.0001; sh-Sox2 #1, t(4) = 24.37, p = 0.0001; Cre + sh-Sox2 #1, t(4) = 11.15, p = 0.0004; PDGFRα: Cre, t(4) = 12.62, p = 0.0002; sh-Sox2 #1, t(4) = 13.12, p = 0.0002; Cre + sh-Sox2 #1, t(4) = 12.19, p = 0.0003; Sox10: Cre, t(4) = 8.83, p = 0.0009; sh-Sox2 #1, t(4) = 10.34, p = 0.0005; Cre + sh-Sox2 #1, t(4) = 12.91, p = 0.0002; unpaired Student's t test). L, 293T cells were transfected with plasmids for Chd7 and Sox2. The cell lysates were subjected to co-immunoprecipitation and Western blot analysis. M, Lysates of OPCs cultured with FGF2 and PDGF-AA were subjected to coimmunoprecipitation and Western blot analysis. N, OPCs cultured with FGF2 and PDGF-AA were subjected to PLA with antibodies to Chd7 and to Sox2, normal rabbit IgG, and normal goat IgG. PLA signals (red) indicate the interaction between Chd7 and Sox2. Cell nuclei were stained with DAPI. NS, Nonsignificant; IP, immunoprecipitation; WCL, whole-cell lysate; Gt, goat; Rb, rabbit. Arrows indicate marker-positive/GFP+ cells (C, E, G). *p < 0.01 versus corresponding control value. Scale bars: A, C, E, G, 25 μm; N, 10 μm.
Figure 8.
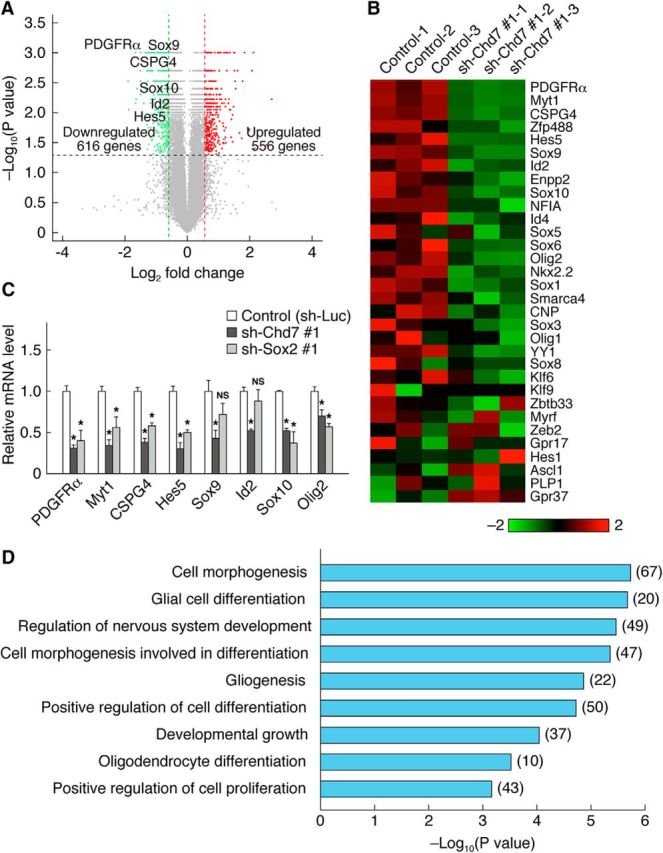
Chd7 regulates the expression of OL-related genes. A, Volcano plot of microarray data showing gene expression changes between control and Chd7 knock-down cells. Red and green dots represent genes significantly upregulated (fold change >1.5, p < 0.05) and downregulated (fold change <0.66, p < 0.05) in Chd7 knock-down cells, respectively. B, Heat map representing the expression of OL-related genes in control and Chd7 knock-down cells from three independent cultures. The color scale represents normalized gene expression levels (red, upregulated expression levels; green, downregulated expression levels). C, OPCs infected with retroviruses for control, sh-Chd7 #1, or sh-Sox2 #1 were cultured with FGF2 and PDGF-AA. The cells were harvested 3 d after infection and the relative mRNA abundance for the indicated proteins was measured by quantitative RT-PCR analysis. Data are shown as means ± SD (n = 3 experiments, PDGFRα: sh-Chd7 #1, t(4) = 14.82, p = 0.0001; sh-Sox2 #1, t(4) = 7.03, p = 0.0021; Myt1: sh-Chd7 #1, t(4) = 12.39, p = 0.0002; sh-Sox2 #1, t(4) = 5.32, p = 0.0060; CSPG4: sh-Chd7 #1, t(4) = 15.18, p = 0.0001; sh-Sox2 #1, t(4) = 12.47, p = 0.0002; Hes5: sh-Chd7 #1, t(4) = 11.40, p = 0.0003; sh-Sox2 #1, t(4) = 11.37, p = 0.0003; Sox9: sh-Chd7 #1, t(4) = 6.01, p = 0.0038; sh-Sox2 #1, t(4) = 2.63, p = 0.0577; Id2: sh-Chd7 #1, t(4) = 15.43, p = 0.0001; sh-Sox2 #1, t(4) = 1.39, p = 0.2346; Sox10: sh-Chd7 #1, t(4) = 26.29, p = 0.0001; sh-Sox2 #1, t(4) = 7.77, p = 0.0015; Olig2: sh-Chd7 #1, t(4) = 5.19, p = 0.0065; sh-Sox2 #1, t(4) = 10.32, p = 0.0005; unpaired Student's t test). NS, Nonsignificant. *p < 0.01 versus control value. D, GO analysis of genes downregulated in Chd7 knock-down cells. The number of genes belonging to each category is shown in parentheses.
Figure 9.

Rgcc and PKCθ are direct targets of Chd7 and Sox2. A, Heat map representing the expression of Rgcc and PKCθ in control and Chd7 knock-down cells from three independent cultures. The color scale represents normalized gene expression levels (red, upregulated expression levels; green, downregulated expression levels). B, OPCs infected with retroviruses for control, sh-Chd7 #1, or sh-Sox2 #1 were cultured with FGF2 and PDGF-AA. The cells were harvested 3 d after infection and the relative mRNA abundance for Rgcc and PKCθ was measured by quantitative RT-PCR analysis. Data are shown as means ± SD (n = 3 experiments, Rgcc: sh-Chd7 #1, t(4) = 15.66, p = 0.0001; sh-Sox2 #1, t(4) = 3.80, p = 0.0191; PKCθ: sh-Chd7 #1, t(4) = 17.14, p = 0.0001; sh-Sox2 #1, t(4) = 6.43, p = 0.0030; unpaired Student's t test). C–H, OPCs cultured with FGF2 and PDGF-AA were subjected to ChIP analysis with antibodies to Chd7, Sox2 (D, G), and H3K27ac (E, H). Six different regions (R1–R6) of the Rgcc gene locus (C) and eight different regions (R1–R8) of the PKCθ gene locus (F) were tested in OPCs. Data are expressed as fold enrichment relative to control IgG. Data are shown as means ± SD (n = 3–6). *p < 0.01, **p < 0.05 versus corresponding control value.
Figure 11.

Rgcc and PKCθ are necessary for OPC proliferation and the maintenance of OPC identity. A, OPCs infected with retroviruses encoding GFP together with either a control shRNA (sh-Luc), an Rgcc shRNA (sh-Rgcc #1 or #2), or a PKCθ shRNA (sh-PKCθ #1 or #2) were cultured with FGF2 and PDGF-AA. Three days after infection, knock-down efficiency of the shRNAs was determined by quantitative RT-PCR analysis. Data are expressed relative to the control value and are means ± SD (n = 3 experiments, Rgcc: sh-Rgcc #1, t(4) = 40.92, p = 0.0001; sh-Rgcc #2, t(4) = 18.26, p = 0.0001; PKCθ: sh-PKCθ #1, t(4) = 12.09, p = 0.0003; sh-PKCθ #2, t(4) = 12.92, p = 0.0002; unpaired Student's t test). B–G, OPCs infected with retroviruses for control, sh-Rgcc #1, sh-Rgcc #2, sh-PKCθ #1, or sh-PKCθ #2 were cultured with FGF2 and PDGF-AA. Three days after infection, the cells were labeled with EdU for 2 h and were stained for EdU, Ki67 (B), PDGFRα, Sox10 (D), cleaved caspase 3 (cl-Casp3) (F), and GFP. The percentages of marker-positive cells among total GFP+ cells were quantified as means ± SD (n = 3 experiments, EdU: sh-Rgcc #1, t(4) = 6.33, p = 0.0032; sh-Rgcc #2, t(4) = 4.94, p = 0.0078; sh-PKCθ #1, t(4) = 6.56, p = 0.0028; sh-PKCθ #2, t(4) = 5.98, p = 0.0039; Ki67: sh-Rgcc #1, t(4) = 15.62, p = 0.0001; sh-Rgcc #2, t(4) = 5.29, p = 0.0061; sh-PKCθ #1, t(4) = 12.37, p = 0.0002; sh-PKCθ #2, t(4) = 11.91, p = 0.0003; PDGFRα: sh-Rgcc #1, t(4) = 11.62, p = 0.0003; sh-Rgcc #2, t(4) = 11.59, p = 0.0003; sh-PKCθ #1, t(4) = 24.78, p = 0.0001; sh-PKCθ #2, t(4) = 14.35, p = 0.0001; Sox10: sh-Rgcc #1, t(4) = 9.65, p = 0.0006; sh-Rgcc #2, t(4) = 6.86, p = 0.0024; sh-PKCθ #1, t(4) = 6.97, p = 0.0022; sh-PKCθ #2, t(4) = 5.54, p = 0.0052; cl-Casp3: sh-Rgcc #1, t(4) = 0.10, p = 0.9182; sh-Rgcc #2, t(4) = 0.15, p = 0.8836; sh-PKCθ #1, t(4) = 0.27, p = 0.7983; sh-PKCθ #2, t(4) = 0.03, p = 0.9715; unpaired Student's t test) (C, E, G). NS, Nonsignificant. Arrows indicate marker-positive/GFP+ cells (B, D, F). *p < 0.01 versus corresponding control value. Scale bars, 25 μm (B, D, F).
Figure 12.

Overexpression of Rgcc or PKCθ rescues the Chd7 deletion phenotypes. A, B, OPCs were infected with retroviruses encoding GFP alone (control), GFP plus Rgcc, or GFP plus PKCθ, and then cultured with FGF2 and PDGF-AA. Three days after infection, the expression level of Rgcc (A) and PKCθ (B) mRNAs was measured by quantitative RT-PCR analysis. Data are expressed relative to the control value and are means ± SD (n = 3 experiments, Rgcc: Rgcc, t(4) = 24.97, p = 0.0001; PKCθ: PKCθ, t(4) = 6.91, p = 0.0023; unpaired Student's t test). C, D, OPCs infected with retroviruses for control, Cre, Rgcc, Cre plus Rgcc, PKCθ, Cre plus PKCθ, or Cre plus Rgcc plus PKCθ were cultured with FGF2 and PDGF-AA. Three days after infection, the cells were labeled with EdU for 2 h and stained for EdU, Ki67 (C), PDGFRα, Sox10 (D), and GFP. The percentages of marker-positive cells among total GFP+ cells were quantified as means ± SD (n = 3 experiments, EdU: Cre, t(4) = 5.38, p = 0.0057; Rgcc, t(4) = 4.62, p = 0.0099; Cre + Rgcc, t(4) = 2.85, p = 0.0460 vs control; t(4) = 4.91, p = 0.0080 vs Cre; PKCθ, t(4) = 4.86, p = 0.0082; Cre + PKCθ, t(4) = 2.94, p = 0.0420 vs control; t(4) = 4.72, p = 0.0091 vs Cre; Cre + Rgcc + PKCθ, t(4) = 1.24, p = 0.2820 vs control; t(4) = 7.86, p = 0.0014 vs Cre; Ki67: Cre, t(4) = 16.63, p = 0.0001; Rgcc, t(4) = 5.66, p = 0.0048; Cre + Rgcc, t(4) = 6.42, p = 0.0030 vs control; t(4) = 6.49, p = 0.0029 vs Cre; PKCθ, t(4) = 5.10, p = 0.0069; Cre + PKCθ, t(4) = 15.84, p = 0.0001 vs control; t(4) = 6.01, p = 0.0038 vs Cre; Cre + Rgcc + PKCθ, t(4) = 1.92, p = 0.1264 vs control; t(4) = 13.52, p = 0.0002 vs Cre; PDGFRα: Cre, t(4) = 10.42, p = 0.0005; Rgcc, t(4) = 1.31, p = 0.2592; Cre + Rgcc, t(4) = 4.58, p = 0.0102 vs control; t(4) = 5.31, p = 0.0060 vs Cre; PKCθ, t(4) = 4.36, p = 0.0120; Cre + PKCθ, t(4) = 6.01, p = 0.0038 vs control; t(4) = 7.65, p = 0.0016 vs Cre; Cre + Rgcc + PKCθ, t(4) = 0.22, p = 0.8335 vs control; t(4) = 9.78, p = 0.0006 vs Cre; Sox10: Cre, t(4) = 16.85, p = 0.0001; Rgcc, t(4) = 0.46, p = 0.6642; Cre + Rgcc, t(4) = 6.10, p = 0.0036 vs control; t(4) = 8.38, p = 0.0011 vs Cre; PKCθ, t(4) = 7.39, p = 0.0018; Cre + PKCθ, t(4) = 4.22, p = 0.0134 vs control; t(4) = 9.41, p = 0.0007 vs Cre; Cre + Rgcc + PKCθ, t(4) = 1.21, p = 0.2926 vs control; t(4) = 8.00, p = 0.0013 vs Cre; unpaired Student's t test) *p < 0.01, **p < 0.05 versus corresponding control value. #p < 0.01 versus Cre value. E, Model for OPC activation by Chd7. In response to injury, the expression level of Chd7 and Sox2 is upregulated in activated OPCs, in which they form a complex and induce directly the expression of PKCθ and Rgcc, which are essential for OPC proliferation and the maintenance of OPC identity.
Results
Chd7 is expressed in OL lineage cells
We first characterized the expression pattern of Chd7 in the intact adult spinal cord. Chd7 expression was detected in OL lineage cells positive for Olig2 or Sox10 or in glial cells positive for Sox2 in the white matter (WM) and gray matter (GM) of the spinal cord (Fig. 1A,B). Consistent with a previous report (He et al., 2016), Chd7 was expressed in differentiated OLs positive for CC1 or GSTπ (Fig. 1A,B). To determine whether OPCs express Chd7, we used PDGFRα-CreER;CAG-CAT-EGFP mice (Kawamoto et al., 2000; Kang et al., 2010) in which PDGFRα+ OPCs and their progeny were marked with GFP expressed under the control of the PDGFRα gene promoter after tamoxifen treatment. Many PDGFRα-GFP+ OPCs expressed Chd7 in the WM and GM of the spinal cord, although its expression level in OPCs was a little weaker than that in CC1+ OLs (Fig. 1A–C). In contrast, Chd7 was expressed at a very low level, if any, in GFAP+ astrocytes (Fig. 1D). These results suggest that Chd7 is expressed in OPCs as well as in differentiated OLs in the adult spinal cord.
We next examined Chd7 expression in OPC cultures. Under our culture conditions, the majority of the cells cultured with FGF2 and PDGF-AA expressed OPC markers such as Olig2 (95.7%), NG2 (82.6%), and PDGFRα (70.6%). It has been shown that OPCs can give rise to both OLs and astrocytes when cultured in vitro (Raff et al., 1983). In agreement with this, our OPC cultures contained a small fraction of astrocytes (6.5%). Most OPCs positive for Olig2, NG2, and PDGFRα expressed Chd7 highly, whereas GFAP+ astrocytes expressed Chd7 at a very low level (Fig. 1E,F). To examine Chd7 expression in OLs, OPCs were induced to differentiate in the presence of T3 for 5 d after the removal of FGF2 and PDGF-AA. Chd7 expression was detected in OLs positive for GalC, MAG, or MBP, or in Olig2+ or Sox10+ cells (Chd7+/marker-positive cells: GalC, 97.7%; MAG, 98.1%; MBP, 97.4%; Olig2, 97.8%; Sox10, 97.8%). These expression patterns in vitro also suggest that Chd7 is expressed in both OPCs and differentiated OLs.
Chd7 is coexpressed with Sox2 in activated OPCs after SCI
Although Sox2 is well known as a marker for multipotent NPCs (Reiprich and Wegner, 2015), it is also expressed in OPCs of the developing and adult CNS (Shen et al., 2008; Lee et al., 2013; Hoffmann et al., 2014; Zhao et al., 2015). Therefore, we investigated the expression pattern of Sox2 in the adult spinal cord and in OPC cultures. Sox2 was expressed in a subpopulation of Sox10+ cells and PDGFRα-GFP+ or NG2+ OPCs, but not in CC1+ or GSTπ+ OLs in the WM and GM of the spinal cord (Fig. 1G). In contrast, the majority of GFAP+ astrocytes expressed Sox2 in the spinal cord (Fig. 1G). Given that most astrocytes expressed Sox2 but not Chd7 (Sox2+/Chd7−), at least a subpopulation of the cells that were double positive for Sox2 and Chd7 (Sox2+/Chd7+) appears to be OPCs (Fig. 1A,D,G). We indeed observed that Sox2 and Chd7 were coexpressed in PDGFRα+ OPCs in the intact adult spinal cord (Fig. 1H). In OPC cultures, under growth conditions, Sox2 was expressed in most Olig2+ or Sox10+ cells or in PDGFRα+ or NG2+ OPCs (Fig. 1I). Under differentiation conditions, Sox2 expression persisted in PDGFRα+ or NG2+ OPCs, whereas it disappeared in the majority of GalC+, MBP+, or MAG+ OLs (Sox2+/marker-positive cells: PDGFRα, 97.3%; NG2, 96.4%; GalC, 4.3%; MBP, 2.4%; MAG, 1.1%). These results suggest that Sox2 is highly expressed in OPCs and its expression level decreases as OPC differentiation proceeds. Furthermore, we found that most Sox2+ cells expressed Chd7 under growth conditions (Fig. 1E), suggesting that Sox2 was coexpressed with Chd7 in OPCs in vitro.
It has been shown that quiescent adult OPCs become activated to proliferate and Sox2 expression is upregulated after SCI (Lee et al., 2013). Given that Chd7 was coexpressed with Sox2 in dividing OPCs cultured with growth factors, we hypothesized that Chd7 is expressed in activated Sox2+ OPCs in the injured spinal cord. To examine this possibility, we used PDGFRα-CreER;CAG-CAT-EGFP mice (Kawamoto et al., 2000; Kang et al., 2010). Tamoxifen was administered once a day for 5 consecutive days, contusive SCI was performed on the mice 3 d after the last tamoxifen injection, and the phenotypes of GFP+ cells were characterized at 3 dpi (Fig. 2A). A small fraction of GFP+ cells expressed Ki67, a proliferative marker, or Sox2 in the intact spinal cord (Fig. 2B,C), suggesting that the majority of GFP+ cells are nonproliferative cells such as quiescent or differentiated cells. Interestingly, the population of Sox2+/GFP+ cells was slightly higher than that of Ki67+/GFP+ cells in the intact spinal cord, suggesting that Sox2 expression remains in the cells of OL lineage after cell cycle exit, as reported previously (Hoffmann et al., 2014). In the injured spinal cord, we observed that the number of GFP+ cells increased markedly around the injury epicenter and exhibited altered morphologies, with hypertrophic cell bodies and multiple processes (Fig. 2B). In addition, the percentage of Ki67+ or Sox2+ cells among GFP+ cells in the injured spinal cord increased significantly compared with the intact spinal cord (Fig. 2B,C), indicating that Sox2 expression was upregulated in GFP+ OPCs and that the cells became active in response to SCI. Furthermore, we found an increase in the percentage of Chd7+ cells or Chd7+/Sox2+ cells after injury (Fig. 2D,E). These results suggest that Chd7 expression in OPCs is upregulated with a concomitant increase in Sox2 expression after injury and that Chd7 is coexpressed with Sox2 in activated OPCs.
Chd7 is required for OPC activation after SCI
Given that we found that Chd7 is expressed in activated OPCs, we next investigated whether Chd7 regulates OPC activation after SCI. To delete Chd7 expression selectively in OPCs, we generated PDGFRα-CreER;Chd7flox/flox;CAG-CAT-EGFP mice (referred to as Chd7 cKO), allowing the identification and tracking of Chd7 cKO cells. We confirmed the ablation of Chd7 expression in Chd7 cKO mice, but not in control mice (PDGFRα-CreER;Chd7+/+;CAG-CAT-EGFP), after tamoxifen treatment by immunohistochemical analysis of the sections of intact spinal cord (Fig. 3A). Under our experimental conditions, 57.8% of NG2+ OPCs became GFP-positive in the spinal cord of control mice and the efficiency of Chd7 deletion was 89.7% in the intact spinal cord of Chd7 cKO mice. To examine the effect of Chd7 ablation on OPC proliferation, control and Chd7 cKO mice were injected with BrdU at 3 dpi after administering tamoxifen and inducing SCI, as shown in Figure 2A. The ablation of Chd7 expression resulted in reduced BrdU incorporation and a decrease in the fraction of Ki67+ cells compared with control (Fig. 3B–D). This was not due to an increase in cell death because there was no significant difference in the percentage of cells positive for cleaved caspase 3, a marker for apoptosis, between control and Chd7 cKO mice (Fig. 3E,F). We also found that the fraction of NG2+ cells was reduced in Chd7 cKO mice (Fig. 3G,I). Although it is possible that this is attributable to enhanced OPC differentiation into OLs, we observed that Chd7 deletion decreased the percentage of Sox10+ cells (Fig. 3H,I), suggesting that some Chd7 cKO cells do not appear to be OL lineage cells. Furthermore, Chd7 cKO attenuated the percentage of GSTπ+ OLs or Sox10+ cells (Fig. 4A–C) and FluoroMyelin staining showed more severe disruption of myelin in Chd7 cKO mice than in control mice at 42 dpi (Fig. 4D,E). We thus examined the phenotypes of Chd7 cKO cells and found that a subpopulation of the Chd7 cKO cells developed into GFAP+ astrocytes (Fig. 4F,G). Together, these results suggest that Chd7 is required for OPC proliferation and identity maintenance, as well as OL differentiation. Moreover, we investigated whether deletion of the Chd7 gene affects hindlimb locomotor recovery after SCI. Open-field locomotor recovery was assessed using the BMS in control and Chd7 cKO mice. Consistent with defects in OL differentiation (myelination) (Fig. 4A–E), Chd7 cKO mice performed significantly worse than control mice at 28, 35, and 42 d after SCI (Fig. 4H).
Chd7 is required for OPC proliferation and identity maintenance under normal circumstances
Given that we found that Chd7 regulates OPC activation under pathological conditions, we further investigated whether Chd7 regulates the proliferation and identity of OPCs under normal conditions. In the embryonic mouse spinal cord, OPCs appear in a ventral progenitor domain called the pMN around E12.5 (Fancy et al., 2011; Gallo and Deneen, 2014; Bergles and Richardson, 2015). These OPCs proliferate rapidly and migrate away from the ventricular zone to populate the entire spinal cord. After the production of the ventrally derived OPCs, a second wave of OPC production begins in the dorsal spinal cord around E15.5 (Fancy et al., 2011; Gallo and Deneen, 2014; Bergles and Richardson, 2015). A large number of OPCs persist into adulthood and are maintained in a slowly proliferative or a quiescent state in the adult spinal cord (Dawson et al., 2003; Rivers et al., 2008; Kang et al., 2010; Zawadzka et al., 2010; Young et al., 2013). We first investigated whether Chd7 is required for OPC proliferation and identity maintenance in the developing spinal cord. To ablate Chd7 in embryonic OPCs, tamoxifen was administered to pregnant dams at E13.5 and embryos were analyzed at E15.5 (Fig. 5A). BrdU-labeling experiments and Ki67 staining revealed that OPC proliferation was significantly reduced in Chd7 cKO mice (Fig. 5B–D). Cells double positive for cleaved caspase 3 and GFP were not observed in either control or Chd7 cKO mice (n = 9 slices from 3 animals; control, 0%; Chd7 cKO, 0%). Furthermore, Chd7 deletion decreased the percentage of PDGFRα+, NG2+, or Sox10+ cells compared with control (Fig. 5E,F). These results suggest that Chd7 is necessary for OPC proliferation and the maintenance of OPC identity during development.
We next investigated the effect of Chd7 ablation on OPC proliferation and identity maintenance in the intact adult spinal cord. After tamoxifen treatment, BrdU was administered to intact adult mice via the drinking water and by intraperitoneal injections for 8 d to label slowly dividing adult OPCs (Fig. 5G). OPC-specific ablation of Chd7 in the intact adult spinal cord had similar effects on OPC proliferation, survival, and identity maintenance as that in the developing spinal cord (Fig. 5H–M). We further observed a decrease in the percentage of GSTπ+ OLs and the appearance of GFAP+/GFP+ cells in Chd7 cKO mice (Fig. 5N,O). Together with our observations in injured mice (Fig. 3), these results suggest that Chd7 regulates the proliferation and identity of OPCs under both normal and pathological conditions.
Chd7 and Sox2 regulate proliferation and identity of the OPC
To determine whether Chd7 plays a similar role in OPC regulation in vitro, we genetically ablated Chd7 in cultured OPCs. OPCs derived from Chd7flox/flox mice were infected with retroviruses encoding GFP alone (control) or GFP together with Cre and cultured under growth or differentiation conditions. Ablation of Chd7 expression was confirmed by immunocytochemistry and quantitative RT-PCR analysis (Fig. 6A,B). Compared with the control, Chd7 ablation reduced OPC proliferation, as assessed by EdU incorporation and immunostaining of Ki67, whereas it did not affect the survival of OPCs, as evaluated by cleaved caspase 3 staining (Fig. 6C–F). Ablation of Chd7 also decreased the percentage of PDGFRα+ or Sox10+ cells under growth conditions (Fig. 6G,H). These results suggest that Chd7 is required for OPC proliferation and the maintenance of OPC identity, but not its survival in vitro. Furthermore, ablation of Chd7 reduced the percentage of Sox10+ cells and that of MBP+ OLs (Fig. 6I,J). Conversely, it increased the fraction of GFAP+ astrocytes markedly (Fig. 6I,J), suggesting that Chd7 also regulates OPC differentiation into OLs. Given that ablation of Chd7 affected OPC proliferation and identity maintenance, it may be possible that the impaired OPC differentiation observed in Chd7 deletion cells is a secondary consequence of the reduced OPC proliferation and the loss of OPC identity caused by Chd7 ablation. To exclude this possibility, we deleted Chd7 in OL lineage cells during differentiation stage and examined its effect on OL differentiation. Chd7flox/flox OPCs were infected with CreERT2 retrovirus and treated with 4-OHT 8 h after induction of differentiation. Ablation of Chd7 during the differentiation step of OLs suppressed the production of MBP+ OLs (Fig. 6K). This result may suggest that Chd7 is likely to regulate OL differentiation independently of its role in OPC proliferation and identity maintenance.
Given that we found that Chd7 is coexpressed with Sox2 in activated OPCs, we next investigated whether Sox2 also regulates the proliferation and identity of OPCs by knock-down of Sox2 with two different short hairpin RNAs (shRNAs, sh-Sox2 #1 and #2) (Fig. 7A,B). In agreement with the phenotypes of Chd7 deletion cells, knock-down of Sox2 reduced the percentage of EdU+, Ki67+, PDGFRα+, or Sox10+ cells compared with control, whereas it did not affect the survival of OPCs significantly (Fig. 7C–H). These results suggest that Sox2 is also required for OPC proliferation and identity maintenance. We further ablated both Chd7 and Sox2 simultaneously in OPCs. Double ablation of Chd7 and Sox2 did not enhance single deletion phenotypes (Fig. 7I–K), implying that Chd7 and Sox2 act in the same signaling pathway. We thus examined the interaction between Chd7 and Sox2. Coimmunoprecipitation experiments showed that Chd7 interacted physically with Sox2 in 293T cells transfected with Chd7 and Sox2 and that endogenous Chd7 and Sox2 formed a complex in cultured OPCs (Fig. 7L,M). PLA further confirmed the interaction between endogenous Chd7 and Sox2 in OPCs (Fig. 7N). Together, these results suggest that Chd7 and Sox2 form a complex and cooperatively regulate the proliferation and identity of OPCs.
However, given that Sox2, but not Chd7, was expressed in astrocytes (Fig. 1G), Sox2 and Chd7 may have distinct roles in astrocyte differentiation. We therefore examined the effect of Sox2 knock-down on astrocyte differentiation. In contrast to Chd7 ablation, which promoted the production of astrocytes under differentiation conditions (Fig. 6I,J), Sox2 knock-down had no effect on astrocyte differentiation [GFAP+ cells/GFP+ cells: control (sh-Luc), 19.98 ± 2.14%; and sh-Sox2 #1, 22.60 ± 3.74%; n = 4 experiments, t(6) = 1.21, p = 0.2696; unpaired Student's t test]. These results suggest that Chd7 and Sox2 play distinct roles in astrocyte differentiation, although they act cooperatively to regulate OPC proliferation.
Chd7 and Sox2 regulate the expression of OL-related genes
To elucidate the molecular mechanisms of how Chd7 regulates OPC activation, we performed transcriptome analysis of OPCs after Chd7 knock-down (the knock-down efficiency of sh-Chd7 #1 at the mRNA level: 65%). Our microarray analysis revealed that 616 genes were upregulated and 556 genes were downregulated in Chd7 knock-down cells compared with control cells (Fig. 8A). We found that the expression level of many OL-related genes, including PDGFRα, Sox10, NG2 (also known as CSPG4), Olig2, Myt1, and Hes5, was reduced in Chd7 knock-down cells (Fig. 8B). In contrast, knock-down of Chd7 increased the expression level of some astrocyte-related genes, such as Gfap (1.35-fold), Acsbg1 (1.42-fold), Gjb6 (also known as Connexin 30, 1.88-fold), Gja1 (also known as Connexin 43, 1.31-fold), Slc6a9 (also known as Glyt1, 2.26-fold), Btbd17 (1.83-fold), Megf10 (1.64-fold), and Sparcl1 (also known as Hevin, 1.44-fold). We validated that Chd7 knock-down in OPCs decreased the expression of OL-related genes by quantitative RT-PCR analysis (Fig. 8C). Furthermore, their expression level was also reduced by Sox2 knock-down (Fig. 8C). GO analysis revealed that downregulated genes in Chd7 knock-down cells were enriched for biological processes related to positive regulation of cell proliferation, oligodendrocyte differentiation, and gliogenesis (Fig. 8D). These results suggest that Chd7 and Sox2 are likely to control cooperatively a gene regulatory network involved in oligodendrogenesis.
Rgcc and PKCθ are direct targets of the Chd7-Sox2 complex
Among the downregulated genes in the microarray analysis of Chd7 knock-down cells, we explored the genes involved in cell proliferation. The expression level of Rgcc and PKCθ in Chd7 knock-down cells was remarkably reduced in our microarray data (Fig. 9A). Rgcc (also known as RGC32) was originally identified as a gene that is induced by complement activation in OLs (Badea et al., 1998). Although it has been reported that overexpression of Rgcc increased DNA synthesis in the hybrid cells formed by fusion of OLs and C6 glioma cell lines (Badea et al., 1998), its role in OL lineage cells remains largely unknown. PKCθ (also known as Prkcq) promotes cell proliferation in several cell types, such as T cells and gastrointestinal stromal tumor cells (Black and Black, 2012), but its role in the CNS remains unclear. We thus focused on Rgcc and PKCθ as candidate regulators of OPC proliferation. Quantitative RT-PCR analysis confirmed a marked decrease in the expression of Rgcc and PKCθ in Chd7 knock-down cells (Fig. 9B). Knock-down of Sox2 also reduced their expression (Fig. 9B). To further determine whether Chd7 and Sox2 induce Rgcc and PKCθ expression directly, we performed ChIP analysis. ChIP analysis revealed that both Chd7 and Sox2 were highly enriched in the R1, R2, and R3 regions of Rgcc gene locus and around the R3 region of PKCθ gene locus in OPCs (Fig. 9C,D,F,G). Chd7- and Sox2-binding regions in Rgcc and PKCθ gene loci coincided with active promoter and enhancer regions marked by acetylation of H3K27 (H3K27ac) (Fig. 9E,H), suggesting that Chd7 and Sox2 bind directly to the promoters or enhancers of Rgcc and PKCθ genes and thereby activate their transcription. Given that these results suggested that Rgcc and PKCθ are direct targets of Chd7 and Sox2 in OPCs, we next investigated whether Rgcc and PKCθ are colocalized with Chd7 and Sox2 in the intact adult spinal cord. Many Rgcc+ or PKCθ+ cells expressed Chd7 and a subpopulation of Rgcc+ or PKCθ+ cells expressed Sox2 (Fig. 10A,B). In addition, Rgcc and PKCθ were expressed in Olig2+ or Sox10+ cells and PDGFRα-GFP+ OPCs (Fig. 10C,D), suggesting that Rgcc and PKCθ are expressed in OPCs in the adult spinal cord. Interestingly, many GFAP+ astrocytes expressed Rgcc, but not PKCθ (Fig. 10C,D). Consistent with our observation, a transcriptome database of neural cell types has shown that Rgcc is enriched in OPCs and astrocytes and that PKCθ is highly expressed in OPCs and newly formed OLs (Zhang et al., 2014). We further found that the fraction of Rgcc+ or PKCθ+ cells was reduced in Chd7 cKO mice (Fig. 10E–G), suggesting that Chd7 is required for the induction of expression of Rgcc and PKCθ in vivo.
Rgcc and PKCθ regulate the proliferation and identity of OPCs
To investigate whether Rgcc and PKCθ, like Chd7 and Sox2, are involved in OPC proliferation and identity maintenance, we performed their knock-down experiments in OPC cultures. Knock-down of either Rgcc or PKCθ was verified by quantitative RT-PCR analysis (Fig. 11A). Knock-down of Rgcc or PKCθ decreased the percentage of EdU+, Ki67+, PDGFRα+, or Sox10+ cells compared with control, whereas their knock-down had no effect on cell survival (Fig. 11B–G). These results suggest that Rgcc and PKCθ are required for OPC proliferation and identity maintenance.
Conversely, overexpression of Rgcc or PKCθ increased the percentage of EdU+ or Ki67+ cells (Fig. 12A–C), suggesting that Rgcc and PKCθ promote OPC proliferation. PKCθ overexpression increased the fraction of PDGFRα+ or Sox10+ cells, whereas Rgcc overexpression failed to do so (Fig. 12D). Furthermore, overexpression of Rgcc or PKCθ in Chd7 deletion cells partially rescued the Chd7 deletion phenotypes, which are characterized by decreased proliferative capacity and loss of OPC identity, and the phenotypes were fully restored by overexpression of both Rgcc and PKCθ (Fig. 12C,D). These results suggest that Rgcc and PKCθ act downstream of a Chd7-Sox2 complex and are key mediators that promote OPC proliferation and maintain OPC identity.
Discussion
Our study demonstrates that Chd7 regulates the proliferation and identity of OPCs after SCI. Chd7 is expressed in OPCs, where its expression level is upregulated, with a concomitant increased expression of Sox2, in response to injury. Chd7 and Sox2 form a complex and this binds to the regulatory regions of the Rgcc and PKCθ genes to induce their expression. Rgcc and PKCθ mediate Chd7 function in OPC activation (Fig. 12E).
It has been shown recently that Chd7 regulates OL differentiation, myelination, and remyelination after demyelinating injury (He et al., 2016). We also observed that ablation of Chd7 expression reduced OL differentiation in the injured spinal cord (Fig. 4A–E) and in cultured OPCs (Fig. 6I,J). In contrast to our observation (Fig. 3), this earlier report showed that deletion of Chd7 in OPCs did not affect OPC formation and its proliferation rates in the postnatal mouse brain and that, after lysolecithin-induced demyelination in the adult spinal cord and brain, the OPC number in the lesion sites was comparable between control and Chd7 cKO mice (He et al., 2016). What is the difference between these two observations? One possibility may be due to the differences in the Cre lines used. We used PDGFRα-CreER mice, whereas a previous study (He et al., 2016) used Olig1-Cre mice, in which Cre activity was already detected at E12.5 (Xin et al., 2005). In the condition of chronic Chd7 loss, the lack of phenotype for OPC proliferation may be attributed to the compensatory action of other molecules during embryonic development. In contrast, we deleted Chd7 acutely in the spinal cord using a tamoxifen-inducible PDGFRα-CreER line. Another possibility may be the differences in the types of injury used in these experiments. We used a mouse model of contusive SCI, whereas a previous report (He et al., 2016) used one of lysolecithin-induced focal demyelination. Interestingly, it has been reported that ependymal cells proliferate extensively after injury in a model of contusive SCI, but not in a lysolecithin model of focal demyelination or in an experimental autoimmune encephalomyelitis model of multifocal demyelination (Lacroix et al., 2014). This suggests that different types of injury lead to distinct reactions in the cells. Therefore, the differences in the types of injury may affect Chd7 function in OPC regulation. The function of Brg1, another chromatin remodeler, has been examined using different Cre lines and it has been shown that it acts at multiple steps of the OL lineage (Yu et al., 2013; Bischof et al., 2015; Matsumoto et al., 2016). Similarly, it is possible that Chd7 plays distinct roles at distinct steps during OL lineage progression.
Chd7 is believed to be recruited to specific regions of target genes through interaction with pioneer transcription factors (Basson and van Ravenswaaij-Arts, 2015). Brg1 interacts physically with Olig2 and is recruited to the enhancers of target genes by Olig2 to initiate OL differentiation (Yu et al., 2013). Although it has been reported that Chd7 interacts with Sox10 and that they cooccupy the same regulatory sites of target genes, this study considered that Chd7 is targeted in the regulatory regions first and Sox10 is recruited subsequently according to the analysis of Chd7- and Sox10-binding cistrome (He et al., 2016). Rather, this study pointed out that Olig2 might act as a prepatterning factor that recruits Chd7 to regulatory regions of target genes from the analysis of Chd7- and Olig2-binding cistrome (He et al., 2016). We found that Chd7 interacts with Sox2 in proliferative OPCs and that they cooccupy the same regulatory regions of Rgcc and PKCθ genes (Figs. 7M,N, 9D,G). Like Olig2, it may be possible that Sox2 acts as a pioneer transcription factor and recruits Chd7 to the regulatory regions of target genes. During neurogenesis, Sox2 acts as a pioneer factor that already binds to neural enhancers in ES cells to establish neural competence (Bergsland et al., 2011; Wegner, 2011). Interestingly, it has been reported that Chd7 and Sox2 form a complex to induce the expression of target genes in NPCs (Engelen et al., 2011). Further studies are warranted to determine whether Sox2 is a pioneer factor during oligodendrogenesis. Moreover, previous reports (Layman et al., 2009; Engelen et al., 2011; Micucci et al., 2014; Reiprich and Wegner, 2015; Ohta et al., 2016) and our results may suggest that Chd7 and Sox2 are used to regulate cell proliferation in both NPCs and OPCs.
Both Sox10 and Sox2 were coexpressed with Chd7 in OPCs (Fig. 1A,B,E,G–I). This implies that Chd7 and Sox2 predominantly execute a proliferation program, whereas the OL differentiation program by Chd7 and Sox10 is inhibited in OPCs. How is this possible? NFIA is expressed in OPCs, interacts physically with Sox10, and antagonizes the ability of Sox10 to induce myelin genes, with the expression level of NFIA being downregulated before myelin gene expression (Glasgow et al., 2014). Consistent with this, we also found that NFIA was coexpressed with Sox10 in PDGFRα+ OPCs in the adult spinal cord (Fig. 1J). Furthermore, Hes5, Sox5, and Sox6 are expressed in OPCs and prevent Sox10 from activating OL differentiation genes (Liu et al., 2006; Stolt et al., 2006). Therefore, it may be possible that these molecules inhibit the progression of the differentiation program by Chd7 and Sox10 and thereby a Chd7-Sox2 complex can activate a transcriptional program for OPC proliferation.
We identified Rgcc and PKCθ as novel targets of Chd7 and Sox2 for OPC activation (Fig. 9). Consistent with our findings that it promotes OPC proliferation, Rgcc enhances cell cycle progression, in which Cdk1 is activated by a direct interaction with Rgcc in smooth muscle cells (Vlaicu et al., 2008). In addition, Rgcc is overexpressed in various types of tumors (Vlaicu et al., 2008), suggesting that it regulates cell proliferation. PKCθ regulates the activation and proliferation of T cells, in which it regulates Cyclin D3 and p27Kip1 positively and negatively, respectively (Black and Black, 2012). PKCθ also acts as a positive regulator of proliferation by repressing the expression of p21Cip1 and/or p27Kip1 in gastrointestinal stromal tumor cells and breast cancer cells (Black and Black, 2012). Given that Rgcc and PKCθ control cell cycle regulators in various types of cells other than neural cells and that cell cycle regulators including Cdk2 and p27Kip1 are essential for the proliferation and differentiation of OPCs (Gallo and Deneen, 2014; Franklin and Goldman, 2015; Moyon et al., 2016), it is likely that Rgcc and PKCθ promote OPC proliferation through the control of cell cycle regulators. Further studies on downstream events of Rgcc and PKCθ will enable us to understand how they regulate OPC proliferation.
Gene expression profiling of glioblastoma multiforme (GBM) revealed that human GBM is classified into four distinct subtypes; proneural, neural, classical, and mesenchymal (Verhaak et al., 2010). The proneural subtype possesses a similar expression profile to that of OPCs and OPCs are thought to be the cell of origin for glioma in a mouse model of glioma (Verhaak et al., 2010; Lei et al., 2011; Liu et al., 2011). These findings may suggest the possibility that the proliferation of OPCs and GBM cells is regulated by common molecular mechanisms. Indeed, the expression level of Sox2, which is a proneural signature gene, is upregulated in GBM and Sox2 plays important roles in the proliferation and maintenance of glioma stem cells and tumorigenicity (Garros-Regulez et al., 2016). Interestingly, it has been reported that the proneural signature contains the Chd7 gene and the Sox2 gene (Verhaak et al., 2010) and that the expression level of Sox2, Chd7, Rgcc, and PKCθ is upregulated in mouse glioma cells (Lei et al., 2011; Alcantara Llaguno et al., 2015). Furthermore, the expression of Rgcc and PKCθ has been shown to be reduced in Sox2 knock-down GBM cells (Berezovsky et al., 2014). These reports may suggest that Chd7, Rgcc, and PKCθ are potential novel therapeutic targets for GBM.
In traumatic injury such as SCI, mature OLs are highly susceptible to damage, resulting in the loss of OLs around the lesion site (Li and Leung, 2015; Fernandez-Castaneda and Gaultier, 2016; Levine, 2016). Because proliferating OPCs are the major source of newly generated OLs after injury (Li and Leung, 2015; Fernandez-Castaneda and Gaultier, 2016; Levine, 2016), enhancing the expansion of endogenous OPCs may be a therapeutic approach for OL regeneration and remyelination. Although reactive astrocytes are major constituents of the glial scar that prevents axonal regeneration, activated OPCs also participate in the formation of the glial scar (Li and Leung, 2015; Fernandez-Castaneda and Gaultier, 2016; Levine, 2016). Furthermore, OPCs are involved in neuroinflammation after injury (Li and Leung, 2015; Fernandez-Castaneda and Gaultier, 2016; Levine, 2016). Given these detrimental effects on tissue repair, inhibiting the activation and expansion of OPCs may contribute to the repair of the injured spinal cord. Therefore, proper control of OPC activation at the proper timing is necessary for tissue repair after SCI. Chd7, Rgcc, and PKCθ, novel regulators for OPC activation, may serve as potential targets for controlling OPC activation to promote functional recovery after SCI.
Footnotes
This work was supported by the Japan Society for the Promotion of Science (KAKENHI Grants JP26282159 and JP15K06792) and the Japanese Ministry of Education, Culture, Sports, Science and Technology (MEXT-Supported Program for the Strategic Research Foundation at Private Universities, 2015–2019, Grant S1511017). We thank J. Miyazaki (Osaka University) for CAG-CAT-EGFP transgenic mice; C. L. Cepko (Harvard University), T. Matsuda (Kyoto University), T. Kitamura (The University of Tokyo), A. Chenn (University of Illinois), and H. Song (Johns Hopkins University) for plasmids; and Y. Ryu, S. Murase, T. Maekawa, N. Kume (Research Institute, National Rehabilitation Center for Persons with Disabilities), and Y. Ichihara (Tottori University) for technical assistance.
The authors declare no competing financial interests.
References
- Alcantara Llaguno SR, Wang Z, Sun D, Chen J, Xu J, Kim E, Hatanpaa KJ, Raisanen JM, Burns DK, Johnson JE, Parada LF (2015) Adult lineage-restricted CNS progenitors specify distinct glioblastoma subtypes. Cancer Cell 28:429–440. 10.1016/j.ccell.2015.09.007 [DOI] [PMC free article] [PubMed] [Google Scholar]
- Badea TC, Niculescu FI, Soane L, Shin ML, Rus H (1998) Molecular cloning and characterization of RGC-32, a novel gene induced by complement activation in oligodendrocytes. J Biol Chem 273:26977–26981. 10.1074/jbc.273.41.26977 [DOI] [PubMed] [Google Scholar]
- Basson MA, van Ravenswaaij-Arts C (2015) Functional insights into chromatin remodelling from studies on CHARGE Syndrome. Trends Genet 31:600–611. 10.1016/j.tig.2015.05.009 [DOI] [PMC free article] [PubMed] [Google Scholar]
- Berezovsky AD, Poisson LM, Cherba D, Webb CP, Transou AD, Lemke NW, Hong X, Hasselbach LA, Irtenkauf SM, Mikkelsen T, deCarvalho AC (2014) Sox2 promotes malignancy in glioblastoma by regulating plasticity and astrocytic differentiation. Neoplasia 16:193–206, 206.e19–25. 10.1016/j.neo.2014.03.006 [DOI] [PMC free article] [PubMed] [Google Scholar]
- Bergles DE, Richardson WD (2015) Oligodendrocyte development and plasticity. Cold Spring Harb Perspect Biol 8:a020453. 10.1101/cshperspect.a020453 [DOI] [PMC free article] [PubMed] [Google Scholar]
- Bergman JE, Janssen N, Hoefsloot LH, Jongmans MC, Hofstra RM, van Ravenswaaij-Arts CM (2011) CHD7 mutations and CHARGE syndrome: the clinical implications of an expanding phenotype. J Med Genet 48:334–342. 10.1136/jmg.2010.087106 [DOI] [PubMed] [Google Scholar]
- Bergsland M, Ramsköld D, Zaouter C, Klum S, Sandberg R, Muhr J (2011) Sequentially acting Sox transcription factors in neural lineage development. Genes Dev 25:2453–2464. 10.1101/gad.176008.111 [DOI] [PMC free article] [PubMed] [Google Scholar]
- Bischof M, Weider M, Küspert M, Nave KA, Wegner M (2015) Brg1-dependent chromatin remodelling is not essentially required during oligodendroglial differentiation. J Neurosci 35:21–35. 10.1523/JNEUROSCI.1468-14.2015 [DOI] [PMC free article] [PubMed] [Google Scholar]
- Black AR, Black JD (2012) Protein kinase C signaling and cell cycle regulation. Front Immunol 3:423. 10.3389/fimmu.2012.00423 [DOI] [PMC free article] [PubMed] [Google Scholar]
- Chen Y, Balasubramaniyan V, Peng J, Hurlock EC, Tallquist M, Li J, Lu QR (2007) Isolation and culture of rat and mouse oligodendrocyte precursor cells. Nat Protoc 2:1044–1051. 10.1038/nprot.2007.149 [DOI] [PubMed] [Google Scholar]
- Dawson MR, Polito A, Levine JM, Reynolds R (2003) NG2-expressing glial progenitor cells: an abundant and widespread population of cycling cells in the adult rat CNS. Mol Cell Neurosci 24:476–488. 10.1016/S1044-7431(03)00210-0 [DOI] [PubMed] [Google Scholar]
- Dimou L, Gallo V (2015) NG2-glia and their functions in the central nervous system. Glia 63:1429–1451. 10.1002/glia.22859 [DOI] [PMC free article] [PubMed] [Google Scholar]
- Emery B, Lu QR (2015) Transcriptional and epigenetic regulation of oligodendrocyte development and myelination in the central nervous system. Cold Spring Harb Perspect Biol 7:a020461. 10.1101/cshperspect.a020461 [DOI] [PMC free article] [PubMed] [Google Scholar]
- Engelen E, Akinci U, Bryne JC, Hou J, Gontan C, Moen M, Szumska D, Kockx C, van Ijcken W, Dekkers DH, Demmers J, Rijkers EJ, Bhattacharya S, Philipsen S, Pevny LH, Grosveld FG, Rottier RJ, Lenhard B, Poot RA (2011) Sox2 cooperates with Chd7 to regulate genes that are mutated in human syndromes. Nat Genet 43:607–611. 10.1038/ng.825 [DOI] [PubMed] [Google Scholar]
- Fancy SP, Chan JR, Baranzini SE, Franklin RJ, Rowitch DH (2011) Myelin regeneration: a recapitulation of development? Annu Rev Neurosci 34:21–43. 10.1146/annurev-neuro-061010-113629 [DOI] [PubMed] [Google Scholar]
- Feng W, Khan MA, Bellvis P, Zhu Z, Bernhardt O, Herold-Mende C, Liu HK (2013) The chromatin remodeler CHD7 regulates adult neurogenesis via activation of SoxC transcription factors. Cell Stem Cell 13:62–72. 10.1016/j.stem.2013.05.002 [DOI] [PubMed] [Google Scholar]
- Fernandez-Castaneda A, Gaultier A (2016) Adult oligodendrocyte progenitor cells: multifaceted regulators of the CNS in health and disease. Brain Behav Immun 57:1–7. 10.1016/j.bbi.2016.01.005 [DOI] [PMC free article] [PubMed] [Google Scholar]
- Franklin RJ, Goldman SA (2015) Glia disease and repair-remyelination. Cold Spring Harb Perspect Biol 7:a020594. 10.1101/cshperspect.a020594 [DOI] [PMC free article] [PubMed] [Google Scholar]
- Gallo V, Deneen B (2014) Glial development: the crossroads of regeneration and repair in the CNS. Neuron 83:283–308. 10.1016/j.neuron.2014.06.010 [DOI] [PMC free article] [PubMed] [Google Scholar]
- Garros-Regulez L, Garcia I, Carrasco-Garcia E, Lantero A, Aldaz P, Moreno-Cugnon L, Arrizabalaga O, Undabeitia J, Torres-Bayona S, Villanua J, Ruiz I, Egaña L, Sampron N, Matheu A (2016) Targeting SOX2 as a therapeutic strategy in glioblastoma. Front Oncol 6:222. [DOI] [PMC free article] [PubMed] [Google Scholar]
- Glasgow SM, Zhu W, Stolt CC, Huang TW, Chen F, LoTurco JJ, Neul JL, Wegner M, Mohila C, Deneen B (2014) Mutual antagonism between Sox10 and NFIA regulates diversification of glial lineages and glioma subtypes. Nat Neurosci 17:1322–1329. 10.1038/nn.3790 [DOI] [PMC free article] [PubMed] [Google Scholar]
- Hall JA, Georgel PT (2007) CHD proteins: a diverse family with strong ties. Biochem Cell Biol 85:463–476. 10.1139/O07-063 [DOI] [PubMed] [Google Scholar]
- He D, Marie C, Zhao C, Kim B, Wang J, Deng Y, Clavairoly A, Frah M, Wang H, He X, Hmidan H, Jones BV, Witte D, Zalc B, Zhou X, Choo DI, Martin DM, Parras C, Lu QR (2016) Chd7 cooperates with Sox10 and regulates the onset of CNS myelination and remyelination. Nat Neurosci 19:678–689. 10.1038/nn.4258 [DOI] [PMC free article] [PubMed] [Google Scholar]
- Hoffmann SA, Hos D, Küspert M, Lang RA, Lovell-Badge R, Wegner M, Reiprich S (2014) Stem cell factor Sox2 and its close relative Sox3 have differentiation functions in oligodendrocytes. Development 141:39–50. 10.1242/dev.098418 [DOI] [PMC free article] [PubMed] [Google Scholar]
- Hurd EA, Poucher HK, Cheng K, Raphael Y, Martin DM (2010) The ATP-dependent chromatin remodeling enzyme CHD7 regulates pro-neural gene expression and neurogenesis in the inner ear. Development 137:3139–3150. 10.1242/dev.047894 [DOI] [PMC free article] [PubMed] [Google Scholar]
- Jones KM, Sarić N, Russell JP, Andoniadou CL, Scambler PJ, Basson MA (2015) CHD7 maintains neural stem cell quiescence and prevents premature stem cell depletion in the adult hippocampus. Stem Cells 33:196–210. 10.1002/stem.1822 [DOI] [PMC free article] [PubMed] [Google Scholar]
- Kang SH, Fukaya M, Yang JK, Rothstein JD, Bergles DE (2010) NG2+ CNS glial progenitors remain committed to the oligodendrocyte lineage in postnatal life and following neurodegeneration. Neuron 68:668–681. 10.1016/j.neuron.2010.09.009 [DOI] [PMC free article] [PubMed] [Google Scholar]
- Kawamoto S, Niwa H, Tashiro F, Sano S, Kondoh G, Takeda J, Tabayashi K, Miyazaki J (2000) A novel reporter mouse strain that expresses enhanced green fluorescent protein upon Cre-mediated recombination. FEBS Lett 470:263–268. 10.1016/S0014-5793(00)01338-7 [DOI] [PubMed] [Google Scholar]
- Küspert M, Wegner M (2016) SomethiNG 2 talk about-Transcriptional regulation in embryonic and adult oligodendrocyte precursors. Brain Res 1638:167–182. 10.1016/j.brainres.2015.07.024 [DOI] [PubMed] [Google Scholar]
- Lacroix S, Hamilton LK, Vaugeois A, Beaudoin S, Breault-Dugas C, Pineau I, Lévesque SA, Grégoire CA, Fernandes KJ (2014) Central canal ependymal cells proliferate extensively in response to traumatic spinal cord injury but not demyelinating lesions. PLoS One 9:e85916. 10.1371/journal.pone.0085916 [DOI] [PMC free article] [PubMed] [Google Scholar]
- Layman WS, McEwen DP, Beyer LA, Lalani SR, Fernbach SD, Oh E, Swaroop A, Hegg CC, Raphael Y, Martens JR, Martin DM (2009) Defects in neural stem cell proliferation and olfaction in Chd7 deficient mice indicate a mechanism for hyposmia in human CHARGE syndrome. Hum Mol Genet 18:1909–1923. 10.1093/hmg/ddp112 [DOI] [PMC free article] [PubMed] [Google Scholar]
- Lee HJ, Wu J, Chung J, Wrathall JR (2013) SOX2 expression is upregulated in adult spinal cord after contusion injury in both oligodendrocyte lineage and ependymal cells. J Neurosci Res 91:196–210. 10.1002/jnr.23151 [DOI] [PubMed] [Google Scholar]
- Lei L, Sonabend AM, Guarnieri P, Soderquist C, Ludwig T, Rosenfeld S, Bruce JN, Canoll P (2011) Glioblastoma models reveal the connection between adult glial progenitors and the proneural phenotype. PLoS One 6:e20041. 10.1371/journal.pone.0020041 [DOI] [PMC free article] [PubMed] [Google Scholar]
- Levine J. (2016) The reactions and role of NG2 glia in spinal cord injury. Brain Res 1638:199–208. 10.1016/j.brainres.2015.07.026 [DOI] [PMC free article] [PubMed] [Google Scholar]
- Li N, Leung GK (2015) Oligodendrocyte precursor cells in spinal cord injury: a review and update. Biomed Res Int 2015:235195. 10.1155/2015/235195 [DOI] [PMC free article] [PubMed] [Google Scholar]
- Liu A, Li J, Marin-Husstege M, Kageyama R, Fan Y, Gelinas C, Casaccia-Bonnefil P (2006) A molecular insight of Hes5-dependent inhibition of myelin gene expression: old partners and new players. EMBO J 25:4833–4842. 10.1038/sj.emboj.7601352 [DOI] [PMC free article] [PubMed] [Google Scholar]
- Liu C, Sage JC, Miller MR, Verhaak RG, Hippenmeyer S, Vogel H, Foreman O, Bronson RT, Nishiyama A, Luo L, Zong H (2011) Mosaic analysis with double markers reveals tumor cell of origin in glioma. Cell 146:209–221. 10.1016/j.cell.2011.06.014 [DOI] [PMC free article] [PubMed] [Google Scholar]
- Matsumoto S, Banine F, Feistel K, Foster S, Xing R, Struve J, Sherman LS (2016) Brg1 directly regulates Olig2 transcription and is required for oligodendrocyte progenitor cell specification. Dev Biol 413:173–187. 10.1016/j.ydbio.2016.04.003 [DOI] [PMC free article] [PubMed] [Google Scholar]
- McTigue DM, Wei P, Stokes BT (2001) Proliferation of NG2-positive cells and altered oligodendrocyte numbers in the contused rat spinal cord. J Neurosci 21:3392–3400. [DOI] [PMC free article] [PubMed] [Google Scholar]
- Micucci JA, Layman WS, Hurd EA, Sperry ED, Frank SF, Durham MA, Swiderski DL, Skidmore JM, Scacheri PC, Raphael Y, Martin DM (2014) CHD7 and retinoic acid signaling cooperate to regulate neural stem cell and inner ear development in mouse models of CHARGE syndrome. Hum Mol Genet 23:434–448. 10.1093/hmg/ddt435 [DOI] [PMC free article] [PubMed] [Google Scholar]
- Morita S, Kojima T, Kitamura T (2000) Plat-E: an efficient and stable system for transient packaging of retroviruses. Gene Ther 7:1063–1066. 10.1038/sj.gt.3301206 [DOI] [PubMed] [Google Scholar]
- Moyon S, Liang J, Casaccia P (2016) Epigenetics in NG2 glia cells. Brain Res 1638:183–198. 10.1016/j.brainres.2015.06.009 [DOI] [PMC free article] [PubMed] [Google Scholar]
- Ohta S, Yaguchi T, Okuno H, Chneiweiss H, Kawakami Y, Okano H (2016) CHD7 promotes proliferation of neural stem cells mediated by MIF. Mol Brain 9:96. 10.1186/s13041-016-0275-6 [DOI] [PMC free article] [PubMed] [Google Scholar]
- Pedraza CE, Monk R, Lei J, Hao Q, Macklin WB (2008) Production, characterization, and efficient transfection of highly pure oligodendrocyte precursor cultures from mouse embryonic neural progenitors. Glia 56:1339–1352. 10.1002/glia.20702 [DOI] [PMC free article] [PubMed] [Google Scholar]
- Raff MC, Miller RH, Noble M (1983) A glial progenitor cell that develops in vitro into an astrocyte or an oligodendrocyte depending on culture medium. Nature 303:390–396. 10.1038/303390a0 [DOI] [PubMed] [Google Scholar]
- Reiprich S, Wegner M (2015) From CNS stem cells to neurons and glia: Sox for everyone. Cell Tissue Res 359:111–124. 10.1007/s00441-014-1909-6 [DOI] [PubMed] [Google Scholar]
- Rivers LE, Young KM, Rizzi M, Jamen F, Psachoulia K, Wade A, Kessaris N, Richardson WD (2008) PDGFRA/NG2 glia generate myelinating oligodendrocytes and piriform projection neurons in adult mice. Nat Neurosci 11:1392–1401. 10.1038/nn.2220 [DOI] [PMC free article] [PubMed] [Google Scholar]
- Schnetz MP, Bartels CF, Shastri K, Balasubramanian D, Zentner GE, Balaji R, Zhang X, Song L, Wang Z, Laframboise T, Crawford GE, Scacheri PC (2009) Genomic distribution of CHD7 on chromatin tracks H3K4 methylation patterns. Genome Res 19:590–601. 10.1101/gr.086983.108 [DOI] [PMC free article] [PubMed] [Google Scholar]
- Schnetz MP, Handoko L, Akhtar-Zaidi B, Bartels CF, Pereira CF, Fisher AG, Adams DJ, Flicek P, Crawford GE, Laframboise T, Tesar P, Wei CL, Scacheri PC (2010) CHD7 targets active gene enhancer elements to modulate ES cell-specific gene expression. PLoS Genet 6:e1001023. 10.1371/journal.pgen.1001023 [DOI] [PMC free article] [PubMed] [Google Scholar]
- Shen S, Sandoval J, Swiss VA, Li J, Dupree J, Franklin RJ, Casaccia-Bonnefil P (2008) Age-dependent epigenetic control of differentiation inhibitors is critical for remyelination efficiency. Nat Neurosci 11:1024–1034. 10.1038/nn.2172 [DOI] [PMC free article] [PubMed] [Google Scholar]
- Simons M, Nave KA (2015) Oligodendrocytes: myelination and axonal support. Cold Spring Harb Perspect Biol 8:a020479. 10.1101/cshperspect.a020479 [DOI] [PMC free article] [PubMed] [Google Scholar]
- Stolt CC, Schlierf A, Lommes P, Hillgärtner S, Werner T, Kosian T, Sock E, Kessaris N, Richardson WD, Lefebvre V, Wegner M (2006) SoxD proteins influence multiple stages of oligodendrocyte development and modulate SoxE protein function. Dev Cell 11:697–709. 10.1016/j.devcel.2006.08.011 [DOI] [PubMed] [Google Scholar]
- Verhaak RG, et al. (2010) Integrated genomic analysis identifies clinically relevant subtypes of glioblastoma characterized by abnormalities in PDGFRA, IDH1, EGFR, and NF1. Cancer Cell 17:98–110. 10.1016/j.ccr.2009.12.020 [DOI] [PMC free article] [PubMed] [Google Scholar]
- Vlaicu SI, Cudrici C, Ito T, Fosbrink M, Tegla CA, Rus V, Mircea PA, Rus H (2008) Role of response gene to complement 32 in diseases. Arch Immunol Ther Exp (Warsz) 56:115–122. 10.1007/s00005-008-0016-3 [DOI] [PMC free article] [PubMed] [Google Scholar]
- Wegner M. (2011) SOX after SOX: SOXession regulates neurogenesis. Genes Dev 25:2423–2428. 10.1101/gad.181487.111 [DOI] [PMC free article] [PubMed] [Google Scholar]
- Xin M, Yue T, Ma Z, Wu FF, Gow A, Lu QR (2005) Myelinogenesis and axonal recognition by oligodendrocytes in brain are uncoupled in Olig1-null mice. J Neurosci 25:1354–1365. 10.1523/JNEUROSCI.3034-04.2005 [DOI] [PMC free article] [PubMed] [Google Scholar]
- Young KM, Psachoulia K, Tripathi RB, Dunn SJ, Cossell L, Attwell D, Tohyama K, Richardson WD (2013) Oligodendrocyte dynamics in the healthy adult CNS: evidence for myelin remodeling. Neuron 77:873–885. 10.1016/j.neuron.2013.01.006 [DOI] [PMC free article] [PubMed] [Google Scholar]
- Yu Y, Chen Y, Kim B, Wang H, Zhao C, He X, Liu L, Liu W, Wu LM, Mao M, Chan JR, Wu J, Lu QR (2013) Olig2 targets chromatin remodelers to enhancers to initiate oligodendrocyte differentiation. Cell 152:248–261. 10.1016/j.cell.2012.12.006 [DOI] [PMC free article] [PubMed] [Google Scholar]
- Zawadzka M, Rivers LE, Fancy SP, Zhao C, Tripathi R, Jamen F, Young K, Goncharevich A, Pohl H, Rizzi M, Rowitch DH, Kessaris N, Suter U, Richardson WD, Franklin RJ (2010) CNS-resident glial progenitor/stem cells produce Schwann cells as well as oligodendrocytes during repair of CNS demyelination. Cell Stem Cell 6:578–590. 10.1016/j.stem.2010.04.002 [DOI] [PMC free article] [PubMed] [Google Scholar]
- Zhang Y, Chen K, Sloan SA, Bennett ML, Scholze AR, O'Keeffe S, Phatnani HP, Guarnieri P, Caneda C, Ruderisch N, Deng S, Liddelow SA, Zhang C, Daneman R, Maniatis T, Barres BA, Wu JQ. An RNA-sequencing transcriptome and splicing database of glia, neurons, and vascular cells of the cerebral cortex. J Neurosci 34:11929–11947. 10.1523/JNEUROSCI.1860-14.2014 [DOI] [PMC free article] [PubMed] [Google Scholar]
- Zhao C, Ma D, Zawadzka M, Fancy SP, Elis-Williams L, Bouvier G, Stockley JH, de Castro GM, Wang B, Jacobs S, Casaccia P, Franklin RJ (2015) Sox2 sustains recruitment of oligodendrocyte progenitor cells following CNS demyelination and primes them for differentiation during remyelination. J Neurosci 35:11482–11499. 10.1523/JNEUROSCI.3655-14.2015 [DOI] [PMC free article] [PubMed] [Google Scholar]
- Zuchero JB, Barres BA (2013) Intrinsic and extrinsic control of oligodendrocyte development. Curr Opin Neurobiol 23:914–920. 10.1016/j.conb.2013.06.005 [DOI] [PMC free article] [PubMed] [Google Scholar]