

Abstract
Transcriptional deregulation and changes in mitochondrial bioenergetics, including pyruvate dehydrogenase (PDH) dysfunction, have been described in Huntington's disease (HD). We showed previously that the histone deacetylase inhibitors (HDACIs) trichostatin A and sodium butyrate (SB) ameliorate mitochondrial function in cells expressing mutant huntingtin. In this work, we investigated the effect of HDACIs on the regulation of PDH activity in striatal cells derived from HD knock-in mice and YAC128 mice. Mutant cells exhibited decreased PDH activity and increased PDH E1alpha phosphorylation/inactivation, accompanied by enhanced protein levels of PDH kinases 1 and 3 (PDK1 and PDK3). Exposure to dichloroacetate, an inhibitor of PDKs, increased mitochondrial respiration and decreased production of reactive oxygen species in mutant cells, emphasizing PDH as an interesting therapeutic target in HD. Treatment with SB and sodium phenylbutyrate, another HDACI, recovered cell viability and overall mitochondrial metabolism in mutant cells. Exposure to SB also suppressed hypoxia-inducible factor-1 (HIF-1α) stabilization and decreased the transcription of the two most abundant PDK isoforms, PDK2 and PDK3, culminating in increased PDH activation in mutant cells. Concordantly, PDK3 knockdown improved mitochondrial function, emphasizing the role of PDK3 inactivation on the positive effects achieved by SB treatment. YAC128 mouse brain presented higher mRNA levels of PDK1–3 and PDH phosphorylation and decreased energy levels that were significantly ameliorated after SB treatment. Furthermore, enhanced motor learning and coordination were observed in SB-treated YAC128 mice. These results suggest that HDACIs, particularly SB, promote the activity of PDH in the HD brain, helping to counteract HD-related deficits in mitochondrial bioenergetics and motor function.
SIGNIFICANCE STATEMENT The present work provides a better understanding of mitochondrial dysfunction in Huntington's disease (HD) by showing that the pyruvate dehydrogenase (PDH) complex is a promising therapeutic target. In particular, the histone deacetylase inhibitor sodium butyrate (SB) may indirectly (through reduced hypoxia-inducible factor 1 alpha stabilization) decrease the expression of the most abundant PDH kinase isoforms (e.g., PDK3), ameliorating PDH activity and mitochondrial metabolism and further affecting motor behavior in HD mice, thus constituting a promising agent for HD neuroprotective treatment.
Keywords: Huntington disease, metabolism, mitochondria, PDH kinase, pyruvate dehydrogenase, sodium butyrate
Introduction
Huntington's disease (HD) is an autosomal-dominant neurodegenerative disease characterized by the expression of mutant huntingtin (mHTT), bearing an expanded polyglutamine tract in its N-terminus, and progressive loss of striatal and cortical neurons (Gil and Rego, 2008). Among several targets, mHTT affects mitochondrial homeostasis (Gil and Rego, 2008) and disturbs gene expression by interfering with nuclear transcription (co)factors (Zhai et al., 2005; Benn et al., 2008), some linked to mitochondrial biogenesis and function (Cui et al., 2006; Cunha-Oliveira et al., 2012). mHTT also affects mitochondrial transmembrane potential (Naia et al., 2015), calcium-buffering capacity (Damiano et al., 2010), oxidative phosphorylation (Schatz, 1995; Milakovic and Johnson, 2005), and the production of reactive oxygen species (ROS) that originate in mitochondria (Ribeiro et al., 2014).
Symptomatic and presymptomatic HD patients evidence altered brain glucose metabolism in the caudate, putamen, cortex, and CSF (Kuhl et al., 1982; Kuwert et al., 1989; Jenkins et al., 1993; Koroshetz et al., 1997). The onset of energy and mitochondrial modifications at presymptomatic stages suggest that energy deficits may constitute early phenomena in HD pathogenesis (Mochel and Haller, 2011). Previously, we observed reduced activity of complex I in mitochondria from platelets of presymptomatic and symptomatic HD carriers (Silva et al., 2013). Moreover, bioenergetic dysfunction in HD human cybrids was associated with decreased pyruvate dehydrogenase (PDH) activity and protein levels and increased phosphorylation/inactivation of the E1alpha subunit (Ferreira et al., 2011). PDH was shown to be impaired in HD human brains (Sorbi et al., 1983; Butterworth et al., 1985) and the PDH indirect activator dichloroacetate (DCA) showed protective effects in HD mouse models (Andreassen et al., 2001), revealing PDH as a central player in HD-associated mitochondrial dysfunction. This is in agreement with the observation of elevated lactate levels in the striatum of presymptomatic HD patients (Jenkins et al., 1998), which suggests the occurrence of PDH defects in vivo. The PDH complex (PDC) is a large complex of three functional enzymes, E1, E2, and E3, and the current understanding of PDC regulation involves inhibitory serine phosphorylation of PDH E1alpha by specific PDH kinases (PDKs), whereas dephosphorylation of PDH E1alpha by PDH phosphatases (PDPs) activates the PDC (Harris et al., 2002; Patel and Korotchkina, 2006). Importantly, the activity of PDKs may be regulated at the transcriptional level (Kim et al., 2006; Patel and Korotchkina, 2006), suggesting that PDC dysfunction may be related to transcriptional deregulation in HD.
Gene transcription is generally favored by histone acetylases, whereas histone deacetylases (HDACs) mainly repress gene expression (Struhl, 1998), similarly to mHTT. Previous studies indicated that HDAC inhibitors (HDACIs) ameliorate the transcriptional changes in HD (Zuccato et al., 2010). A phase I clinical trial with the HDACI sodium phenylbutyrate (PB) showed recovery of expression of 12 transcripts that were upregulated in untreated HD patients (Borovecki et al., 2005; Hogarth et al., 2007; Brett et al., 2014). In addition, we showed previously that mHTT induced deficits in mitochondrial calcium handling, which was ameliorated by treatment with HDACIs, namely trichostatin A (TSA), a pan-lysine HDACI, and sodium butyrate (SB), which acts on class I and IIa HDACs, preferentially modulating Lys acetylation sites in the nucleus (Oliveira et al., 2006; Schölz et al., 2015), similarly to PB. Therefore, in the present work, we analyzed the influence of TSA, SB, and PB in improving PDC function in striatal cells expressing full-length mHTT and confirmed the effect of SB in YAC128 mouse model. Our results suggest that the HDACI SB promotes PDH activity in both in vitro and ex vivo models by regulating the expression of PDKs, helping to counteract HD-related deficits in mitochondrial function. In addition, SB improved brain mitochondrial bioenergetics and positively influenced motor learning and coordination in YAC128 mice.
Materials and Methods
Materials
Fetal bovine serum (FBS) and penicillin/streptomycin were from Invitrogen. DMEM, Opti-MEM, bovine serum albumin (BSA), trypan blue (0.4%), nicotinamide adenine dinucleotide hydrate (NAD), coenzyme A (CoA), carbonyl cyanide 4-(trifluoromethoxy) phenylhydrazone (FCCP), thiamine pyrophosphate (TPP+), pyruvate, acetyl-L-carnitine (ALCAR), DCA, TSA, SB, and PB were from Sigma Aldrich. Calcium chloride and MgCl2 were from Merck. PureZOL RNA isolation reagent, iScript cDNA Synthesis kit, SsoFast EvaGreen Supermix, Protein Assay and PVDF membranes were from Bio-Rad. The Phospho-PDH in-cell ELISA kit and NAD/NADH kit were from Abcam. Lipofectamine 3000 was from Thermo Fisher Scientific. The XF Cell Mito Stress Test Kit and XF24 cell culture microplates were from Seahorse Bioscience. Mini-osmotic pumps were from Alzet. Isoflurane was from Esteve. All other reagents were of analytical grade.
Cell culture and treatments
Immortalized striatal neurons derived from knock-in mice expressing full-length normal (STHdh7/7, clone 2aA5, RRID:CVCL_M590, referred as wild-type cells) or full-length mHtt with 111 glutamines (STHdh111/111, clone 109-1A, RRID:CVCL_M591, referred as mutant cells) were generously provided by Dr. Marcy MacDonald (Massachusetts General Hospital, Charleston, MA) and treated according to slight modifications of established procedures (Trettel et al., 2000). Briefly, cells were grown adherent at 33°C in DMEM supplemented with 10% FBS, 4 mm glutamine, 100 U/ml penicillin, 0.1 mg/ml streptomycin, and 400 g/ml geneticin in an atmosphere of 95% air/5% CO2. Twenty-four hours before the experiment (and 1 d after cell plating), the cells were incubated with TSA (10, 50, and 100 nm), SB (100, 250, and 500 μm), PB (100, 250, and 500 μm), ALCAR (100 μm, 500 μm, and 5 mm), or DCA (300 μm, 1 mm, and 3 mm).
For hypoxia-inducible factor 1 alpha (HIF-1α) stabilization/accumulation, striatal cells were maintained for 1 h before the experiment in a controlled hypoxic atmosphere (0.1%–0.5% O2; Forma Anaerobic System, Thermo Fisher Scientific) at 33°C. The HIF-1α subunit is continuously synthesized and degraded under normoxic conditions, but accumulates rapidly after exposure to low oxygen tensions (Salceda and Caro, 1997).
Constructs and transfection
Immortalized striatal cells were cultured in DMEM supplemented with 10% FBS and transfected on the following day (80% confluence) with the pLKO.1/shRNA-PDK3 vector (clone ID: TRCN0000023835; Dharmacon), designed by the RNAi Consortium, or the pLKO.1-scrambled negative control (TRC-RHS6848; Open Biosystems). STHdh cells were transfected with 0.75 μg of DNA/cm2 of growth area in opti-MEM without FBS or antibiotics, following the Lipofectamine 3000 (ThermoFisher Scientific) manufacturer instructions. Medium was changed 4 h after transfection and cells were cultured for 48 h.
Total cell extracts
Adherent cells were washed 2 times in ice-cold PBS containing the following (in mm): 137 NaCl, 2.7 KCl, 1.8 KH2PO4, 10 Na2HPO4 · 2H2O, pH 7.4, and then scraped in 500 μl of lysis buffer (150 mm NaCl, 50 mm Tris, 5 mm EGTA, 1% Triton X-100; 0.5% deoxycholate, 0.1% SDS, pH 7.5) supplemented with 1 mm DTT, 1 mm PMSF, 1 μg/ml protease cocktail inhibitor (containing chymostatin, pepstatin A, leupeptin, and antipain), 1 μm TSA (HDAC inhibitor), and 10 mm nicotinamide (sirtuins inhibitor). Cellular extracts were frozen three times in liquid nitrogen and then sonicated for 30 s and centrifuged at 20,800 × g for 10 min (Eppendorf Centrifuge 5417R) to remove cell debris. The pellet was discarded, the supernatant (total extract) collected, and the protein content quantified with the Bio-Rad protein assay. Extracts were stored at −20°C until being used for Western blotting experiments.
For the analysis of PDH activity, cell extracts were obtained by scraping the cells using 100 μl of buffer containing 25.0 mm KH2PO4, 0.5 mm EDTA, pH 7.25, supplemented with 0.01% Triton X-100.
NAD+/NADH quantification
The total levels of NAD+ and NADH were measured using a commercially available kit (Abcam) following the manufacturer's instructions. Briefly, cells were plated in six-well plates and cell extracts were obtained with NADH/NAD extraction buffer. The samples were frozen three times in liquid nitrogen and centrifuged at 20,800 × g for 10 min (Eppendorf Centrifuge 5417R) to remove cell debris. The extracted samples were divided in two: one remained in ice (total NAD) and the other one was heated to 60°C for 30 min to decompose NAD+ (NADH). Both samples were transferred to a 96-well plate and a NAD+-cycling mixture enzyme was added and incubated at room temperature for 5 min to convert NAD+ to NADH. Finally, NADH developer was added into each well and the reaction occurred at room temperature for 2 h. Absorbance was monitored using a microplate reader Spectra Max Plus 384 (Molecular Devices) at 450 nm.
PDH activity assay
PDH activity was assayed at 30°C by measuring the reduction of NAD+ at 340 nm in a Spectra Max Plus 384 microplate reader (Molecular Devices) upon mixing 9 μg of protein with 0.5 mm NAD+ in the presence of 200 μm TPP+, 40 μm CoA, and 4.0 mm pyruvate. The assay was performed in the presence of 2.5 μm rotenone to prevent NADH consumption by complex I (Zhou et al., 2009). PDH activity was calculated as absorbance units per minute per milligram of protein and converted to the percentage of wild-type control cells.
Determination of PDH E1alpha subunit protein levels and phosphorylation
PDH expression and phosphorylation were assessed using the Phospho-PDH In-Cell ELISA kit from Abcam and following the manufacturer's instructions. Briefly, cells were plated in 96-well plates, transfected with shRNA-PDK3 or scramble shRNA control or incubated with the HDACI compounds, and fixed with 3.7% formaldehyde in PBS. Cells were permeabilized, blocked, and incubated overnight with an antibody against total PDH E1alpha, combined with another antibody against one of the phosphorylated forms of PDH E1alpha at Ser293 (site 1), Ser300 (site 2), or Ser232 (site 3). Separate secondary antibodies were used against PDH E1alpha or the phosphorylated serines and developed by dual colorimetric detection. Cell density was normalized after Janus green staining. Absorbance was monitored using a microplate reader Spectra Max Plus 384 (Molecular Devices).
Cell viability assessment
At the time of cell incubation with the different compounds, the culture medium was replaced for fresh medium. The nuclear morphology of the striatal wild-type and mutant cells exposed to different concentrations of the compounds (TSA, PB, SB, ALCAR, and DCA) was analyzed by fluorescence microscopy using a double-staining procedure with Hoechst 33342 and propidium iodide (PI). After a washing step with saline medium containing the following (in mm): 120 NaCl, 3.5 KCl, 0.4 KH2PO4, 20 HEPES, 5 NaHCO3, 1.2 Na2SO4, and 15 glucose, the cells were incubated with 4 μg/ml Hoechst 33342 for 15 min, washed 2 times with saline medium, and incubated with 4 μg/ml PI for 3 min in the dark at room temperature. Cells were washed three times in saline medium to remove extracellular dyes and further examined and scored as depicted in Figure 2 by analyzing images taken in the AxioObserver Z1 upright microscope (Zeiss).
Figure 2.
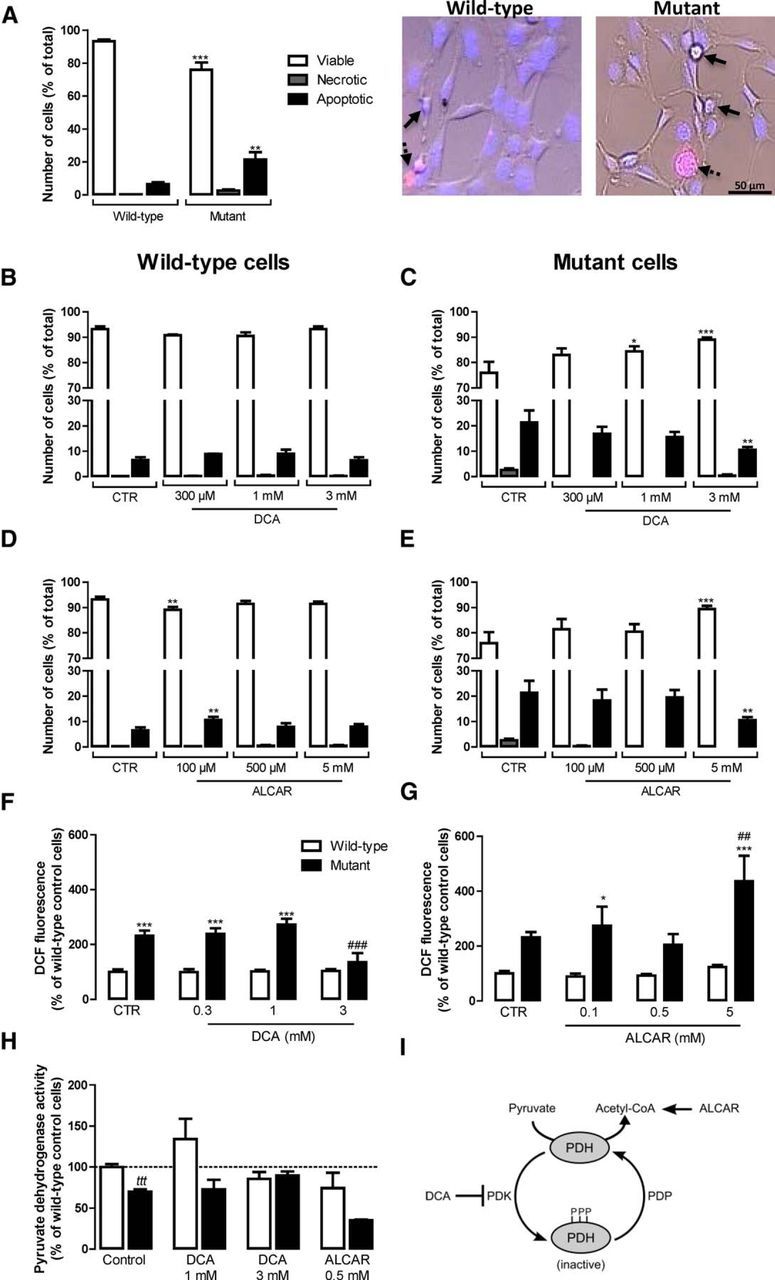
Protective effect of PDH modulators in striatal mutant cells. Cell viability (A–E) and redox signaling (F, G) of wild-type and mutant cells was analyzed 24 h after incubation with different concentrations of the PDH activator DCA (0.3–3 mm) or the acetyl-coenzyme A donor ALCAR (0.1–5 mm). The effects of these compounds were assessed on PDH activity (H) and their mechanisms of action are represented in I. A–E, To analyze cell viability, cells were stained with fluorescent Hoechst 33342 (blue) and propidium iodide (red) dyes and visualized by fluorescence microscopy as in the images shown in A to evaluate the nuclear morphology (DNA condensation and fragmentation) to assess apoptotic cell death (full arrows) and plasma membrane integrity to assess the number of necrotic cells (dashed arrows). Cell viability, necrosis, and apoptosis were expressed as a percentage of the total number of cells. In A–E, statistical analysis was performed by one-way ANOVA. F, G, To analyze altered redox signaling, cells were loaded with DCFH2-DA (20 μm) for 30 min 24 h after exposure to DCA or ALCAR and the fluorescence of DCF (480 nm excitation, 550 nm emission) resulting from the probe oxidation was followed continuously for 1 h at 33°C and corrected for total protein. Results are expressed as mean ± SEM of three experiments performed in triplicate or quadruplicate. The wild-type control (CTR) 100% of DCF fluorescence was 3.67 × 10⁶ ± 0.7 × 10⁶ RFU/min/mg protein. In F and G, statistical analysis was performed by two-way ANOVA, followed by Bonferroni post test, and revealed a significant interaction between genotype and treatment in F (F(3, 38) = 6.161, p < 0.0016) and a significant effect of ALCAR treatment in G (F(3, 40) = 3.558, p < 0.0225). H, PDH activity was measured by spectrophotometry. Results are expressed as mean ± SEM of three independent experiments (performed in triplicate) and wild-type values (100%) correspond to 1178.00 ± 247.00 AU/min/mg protein. Statistical significance: *p < 0.05 or ***p < 0.001 compared with the respective wild-type condition and ##p < 0.01 or ###p < 0.001 compared with control (untreated) condition. For H, tttp < 0.001 by the Student's t test.
Analysis of oxidative stress
Cells (plated in 96-well plates) were loaded for 30 min with 20 μm dihydro-dichlorofluorescein diacetate (DCFH2-DA), a stable, nonfluorescent, cell-permeable compound, at 33°C in Na+ medium containing the following (in mm): 135 NaCl, 5 KCl, 0.4 KH2PO4, 1.8 CaCl2, 20 HEPES, and 5.5 glucose, pH 7.4. When internalized by the cell, DCFH2-DA is hydrolyzed to DCFH by intracellular esterases, retained inside the cell, and rapidly oxidized to the highly green fluorescent compound 2,7-dichlorofluorescein (DCF), a redox indicator probe that responds to changes in intracellular iron signaling and peroxynitrite formation (Kalyanaraman et al., 2012). DCF fluorescence (480 nm excitation, 550 nm emission) was monitored continuously for 1 h at 33°C using a Spectrofluorometer Gemini EM (Molecular Devices) microplate reader. DCF fluorescence was corrected for variations in total protein content in the wells after quantification of cell protein in each well by the Bio-Rad protein assay.
Oxygen consumption rate (OCR) measurements
Oxygraph oxygen electrode.
To measure the OCR, cells were plated in 75 cm2 flasks and incubated on the following day in the absence or presence of 500 μm SB, 250 μm PB, or 3 mm DCA for 24 h. Cells were detached by trypsinization and trypsin was inactivated by adding culture medium containing FBS. The cells were then washed in prewarmed (33°C) respiration buffer containing the following (in mm): 132 NaCl, 4 KCl, 1 CaCl2, 1.2 NaH2PO4, 1.4 mm MgCl2, 6 glucose, and 10 HEPES, pH 7.4, and resuspended in 300 μl of respiration buffer. The rate of O2 consumption was recorded under constant magnetic stirring in an Oxygraph DW1 oxygen electrode chamber (Hansatech Instruments) previously calibrated for the oxygen dissolved at 33°C in oxygenated water (maximum) and in N2-saturated water (minimum). After recording the basal rate of oxygen consumption, cells were sequentially exposed to oligomycin (10 μg/ml) to avoid the reversal of ATP synthase and FCCP (2.5 μm) to assess maximal respiration rates. Potassium cyanide (KCN) (700 μm) was then added to confirm mitochondrial O2 consumption, manifested as a decrease in O2 consumption due to inhibition of mitochondrial complex IV. At the end of the experiment, the cells were pelleted, resuspended in 1 m NaOH, and protein was quantified by the Bio-Rad protein assay. Results are expressed in nanomoles of O2 per minute per milligram of protein.
Cell respirometry.
OCR of transfected striatal cells was measured using the XF24 flux analyzer (Seahorse Bioscience) following the manufacturer's instructions. Striatal cells were grown on the 24-well custom plates at 30,000 cells per well and transfected 48 h before the experiment (as described in the “Constructs and transfection” session) or incubated with 500 μm SB 24 h before the experiment. Before running the experiment, cell culture medium was removed and cells were washed once with 1 ml of DMEM 5030 medium, pH 7.4, supplemented with 4.5 g/L glucose and 4 mm glutamine and then incubated in 450 μl of supplemented DMEM at 33°C in a CO2-free incubator for 1 h. Four baseline measurements of OCR were sampled before sequential injection of mitochondrial inhibitors and four metabolic determinations were sampled after the addition of each mitochondrial inhibitor before injection of the subsequent inhibitors. The mitochondrial inhibitors used were oligomycin A (1 μm), FCCP (0.9 μm), and antimycin A (1 μm) plus rotenone (1 μm). OCR was automatically calculated and recorded using Seahorse Bioscience software. After the assays, the protein level was determined for each well to confirm equal cell density per well. Results are expressed in picomoles of O2 per minute per microgram of protein.
YAC128 mice surgery
YAC128 mice, described previously by Slow et al. (2003), express full-length mutant HTT with ∼128 CAG repeats from a yeast artificial chromosome (YAC) transgene (RRID: MGI_MGI:3613515). YAC128 (line HD53) and wild-type mice were housed in the housing facility of the Center for Neuroscience and Cell Biology and Faculty of Medicine at the University of Coimbra (Coimbra, Portugal) under conditions of controlled temperature (22–23°C) and under a 12 h light/12 h dark cycle with lights on at 07:00 h. All studies were performed according to the Helsinki Declaration and the Guide for the Care and Use of Laboratory Animals from the National Institutes of Health. Food and water were available ad libitum throughout the experiment. Animals used in this study (total of 9–13 9-month-old male mice per treatment) were maintained in accordance with the guidelines of the Institutional Animal Care and Use of Committee and were performed in accordance with the European Community directive (2010/63/EU). All efforts were made to minimize animal suffering and to reduce the number of animals used. Animals were subjected to small surgeries for the subcutaneous implantation (and removal) of mini-osmotic pumps (28 d pumps, model 2004; Alzet). Each pump was filled with saline (0.9% NaCl) or SB (1 mg/kg/d) diluted in saline solution. For the subcutaneously implantation of the pumps, animals were anesthetized with isofluorane using a vaporizer apparatus (EZ Anesthesia) and immediately afterward received a subcutaneous injection of butorphanol (1:50; 2.5 ml/kg), a morphine-type synthetic opioid analgesic. Animals were kept with the pumps for 30 d (2 more days than the treatment itself because, in order to start releasing the solutions, the pump needs to be at the same temperature as the animal's body). To remove the pumps, mice were subjected to the same surgical procedure as described above. The body weight was measured for all animals after treatment. Behavior analysis was performed 2 d after the surgery (recovery period).
Rotarod motor evaluation
Mice were allowed to adapt to the behavior test room for 2 h before the behavior studies. Procedures were consistent for all subjects and tests made at minimum noise levels. Motor coordination and motor learning were assessed on a rotarod apparatus (Letica Scientific Instruments) using a previously described procedure (Naia et al., 2016b). Behavior equipment was cleaned thoroughly with 70% ethanol before each animal trial. Separate cohorts of mice were trained at a fixed speed of 4 rotations per minute (rpm) to a maximum time of 40 s. The training time (motor learning) corresponds to the time it took the mice to stand on the rod without falling for 40 consecutive seconds. Motor coordination and balance were assessed using the accelerating rotarod task after all of the animals learned the previous task. In this test, the rotarod accelerated from 5 to 40 rpm over 5 min and the latency to fall was recorded for each of the four trials for each mouse. Resting time between each trial was set for 30 min.
Total fractions of YAC128 mice cortex
Total fractions from cerebral cortex were obtained from SB or saline-treated YAC128 and wild-type mice brains. Animals were killed by very rapid decapitation in accordance to European Union guideline 86/609/EEC and Annex II of Portuguese Law No. 113/2013. Mice brains were collected and the cortex from one brain hemisphere was dissected on ice (0–4°C) and homogenized in lysis buffer, as described for total cell extracts, which was supplemented with 100 nm okadaic acid, 25 mm NaF, 1 mm Na3VO4, 1 mm DTT, 1 mm PMSF, 1 μg/ml protease inhibitor mixture (chymostatin, pepstatin A, leupeptin, and antipain), 1 μm TSA (HDACI) plus 10 mm nicotinamide (sirtuins inhibitor) at 4°C. Samples were then incubated on ice for 30 min and centrifuged at 20,800 × g for 10 min at 4°C to discard intact organelles and dead cells. All samples were kept at −80°C until use.
Western blotting
Total extracts, obtained as described previously, were denatured with denaturing buffer (50 mm Tris-HCl pH 6.8, 2% SDS, 5% glycerol, 600 mm DTT, and 0.01% bromophenol blue) at 95°C, for 5 min. Equivalent amounts of protein were separated by 7.5–12% SDS-PAGE gel electrophoresis and electroblotted onto PVDF membranes (Bio-Rad). The membranes were blocked for 1 h in Tris-buffered saline (TBS) solution containing 0.1% Tween (TBS-Tween) and 5% fat-free milk or 5% BSA, followed by an overnight incubation with primary antibodies (Table 1) at 4°C with gentle agitation. Membranes were then washed 3 times for 15 min each time with TBS-Tween and incubated with secondary antibodies conjugated with alkaline phosphatase (1:20,000) for 1 h at room temperature with gentle agitation. Immunoreactive bands were visualized after incubation with ECF substrate (GE Healthcare), which is converted into a highly fluorescent product reagent by alkaline phosphatase. This product strongly fluoresces at 540–560 nm when the blots are illuminated with UV light (maximum excitation at 430 nm) in a Versa Doc 3000 Imaging System (Bio-Rad). Bands were quantified using Quantity One software (Bio-Rad).
Table 1.
List of the primary antibodies used in this work
| Primary antibody | Molecular weight (kDa) | Reference | Dilution | Host species |
|---|---|---|---|---|
| Anti-acetyl-histone 3 | 17 | 06-599 (Millipore, RRID: AB_2115283) | 1:750 | Rabbit |
| Anti-histone 3 | 17 | #9715 (Cell Signaling Technology, RRID: AB_331563) | 1:2000 | Rabbit |
| Anti-PDH kinase 1 (PDK1) | 47 | #3820 (Cell Signaling Technology, RRID: AB_1904078) | 1:1000 | Rabbit |
| Anti-PDK kinase 3 (PDK3) | 47 | ab182574 (Abcam, RRID: AB_2631347) | 1:1000 | Rabbit |
| Anti-pSer232 PDH-E1α | 44 | AP1063 (Millipore, RRID: AB_10616070) | 1:750 | Rabbit |
| Anti-PDH-E1α | 43 | #2784 (Cell Signaling Technology, RRID: AB_2162928) | 1:1000 | Rabbit |
| Anti-PDH phosphatase (PDPc) | 53 | sc-87354 (Santa Cruz, RRID: AB_2017921) | 1:200 | Goat |
| Anti-HIF-1α | ∼130 | Ab1 (Abcam, RRID: AB_296474) | 1:500 | Mouse |
| Anti-tubulin | 50 | T6199 (Sigma-Aldrich, RRID: AB_477583) | 1:1000 | Mouse |
| Anti-β-actin | 42 | A5316 (Sigma-Aldrich, RRID: AB_476743) | 1:5000 | Mouse |
Measurement of intracellular levels of adenine nucleotides
Striatal cells were washed and then scraped with ice-cold PBS and cortex from one mouse brain hemisphere was homogenized with ice-cold PBS. The same volume of 0.6 m perchloric acid supplemented with 25 mm EDTA-Na+ was added. Extracts were then centrifuged at 20,800 × g for 2 min at 4°C to remove cell debris. The resulting pellet was solubilized with 1 m NaOH and further analyzed for total protein content by the Bio-Rad protein assay. After neutralization with 10 m KOH/1.5 m Tris, samples were centrifuged at 20,800 × g for 5 min at 4°C. The resulting supernatants were assayed for ATP, ADP, and AMP determination by separation in a reverse-phase high-performance liquid chromatography with detection at 254 nm. The chromatographic apparatus used was a Beckman-System Gold controlled by a computer. The detection wavelength was 254 nm and the column used was a Lichrospher 100 RP-18 (5 μm). An isocratic elution with 100 mm phosphate buffer (KH2PO4), pH 6.5, and 1% methanol was performed with a flow rate of 1 ml/min. Peak identity was determined by following the retention time of standards. Energy charge was used as a measurement of general energy status of mice cortex, taking into account ATP, ADP, and AMP concentrations, and was calculated according to the following formula: (ATP + 1/2*ADP)/(ATP + ADP + AMP).
Analysis of gene expression by qRT-PCR
Total RNA was extracted with TRIzol reagent (Life Technologies) for cell extracts or with Purezol (Bio-Rad) for tissue extracts, following the manufacturers' protocols, and quantified using a Nanodrop 2000 (Thermo Fisher Scientific), confirming that A260/280 and A260/230 were >1.9. RNA integrity was verified with the Experion RNA StdSens kit (Bio-Rad) for cell extracts or by 1.0% agarose gel electrophoresis for tissue extracts and RNA was converted into cDNA using the iScript cDNA synthesis kit (Bio-Rad) following the manufacturer's instructions. qRT-PCR was performed using the SsoFast Eva Green Supermix in a CFX96 real-time PCR system (Bio-Rad), with the primers defined in Table 2 at 500 nm (for cell extracts) or 300 nm (for tissue extracts). Amplification of 12.5 ng (for cell extracts) or 10 ng (for tissue extracts) of template was performed with an initial cycle of 30 s at 95.0°C, followed by 40 cycles of 5 s at 95°C plus 5 s at 63°C (for cell extracts) or 61°C (for tissue extracts). At the end of each cycle, Eva green fluorescence was recorded to enable determination of Cq. After amplification, melting temperature of the PCR products were determined by performing melting curves, with 0.5°C increments every 5 s, from 65°C to 95°C, with fluorescence recording after each temperature increment. For each set of primers, amplification efficiency was assessed and no template and no transcriptase controls were run. For cell extracts, relative normalized expression was determined with CFX96 Manager software (version 3.0; Bio-Rad), using TATA-binding protein (TBP) as the reference gene. Normalization was also performed for the reference gene hypoxanthine guanine phosphoribosyl transferase (Hprt; accession number NM_013556.2), with similar results. For tissue extracts, beta-actin (NM_007393.3), POLR2F (NM_027231.1), GAPDH (NM_008084.2), and Hprt (NM_013556.2) were tested as reference genes, but none of these genes was stable in YAC128 mice treated with SB. Therefore, normalizations were performed in relation to wild-type mice treated with saline.
Table 2.
Sequence (5′–3′) of primers used for qRT-PCR experiments
| Gene | Accession no. | Forward primer | Reverse primer |
|---|---|---|---|
| PDHA1 | NM_008810 | TCATCACTGCCTATCGAGCAC | GTTGCCTCCATAGAAGTTCTTGG |
| PDK1 | NM_172665 | GGACTTCGGGTCAGTGAATGC | CGCAGAAACATAAACGAGGTCT |
| PDK2 | NM_133667.2 | CGGACTCTAAGCCAGTTCACA | GTGGGCACCACGTCATTGT |
| PDK3 | NM_145630.2 | CCGTCGCCACTGTCTATCAA | TGCGCAGAAACATATAGGAAGTTT |
| PDK4 | NM_013743.2 | CCGCTTAGTGAACACTCCTTC | TCTACAAACTCTGACAGGGCTTT |
| PDP1 | NM_001098231.1 | CGGGCACTGCTACCTATCCTT | ACAATTTGGACGCCTCCTTACT |
| NM_001098230.1 | |||
| NM_001033453.3 | |||
| PDP2 | NM_001024606.1 | GGCTGAGCATTGAAGAAGCATT | GCCTGGATTTCTAGCGAGATGT |
| TBP | NM_013684.3 | ACCGTGAATCTTGGCTGTAAAC | TCAGCATTTCTTGCACGAAGT |
Statistical analysis
Results are expressed as mean ± SEM of the number of independent experiments indicated in the figure legends. Comparisons between multiple groups were performed with two-way or one-way ANOVA, followed by Bonferroni post hoc test, for comparison between experimental groups. Comparison between two groups was performed with the Student's t test (GraphPad Prism Version 6.0, RRID: SCR:002798). The F test was performed to determine the interaction term. Significance was accepted at p < 0.05.
Results
PDH dysfunction in cells expressing mutant huntingtin
Mitochondrial bioenergetics has been described to be altered in HD (Cunha-Oliveira et al., 2012). PDC is a central mitochondrial enzyme complex in cellular bioenergetics, linking glycolysis to the TCA cycle and oxidative phosphorylation (Harris et al., 2002; Patel and Korotchkina, 2006). PDC activity can be modulated by phosphorylation (Kolobova et al., 2001) and deregulation of PDC activity and phosphorylation was previously shown by us in HD human cybrids, together with decreased mitochondrial NADH/total NAD ratio (Ferreira et al., 2011).
Using HD mutant mouse striatal cells, we observed an increase in mitochondrial NAD+/NADH levels by 2.3-fold (p < 0.001; Fig. 1A), suggesting a dysfunction in cellular dehydrogenases. We also assessed PDH activity by following the production of NADH that accompanies the irreversible conversion of pyruvate into acetyl-CoA; a decrease in PDH activity by ∼30% (p < 0.0001) was observed in mutant cells, compared with wild-type striatal cells (Fig. 1B), which may explain the substantial increase in pyruvate levels detected in mutant cells (Naia et al., 2016a). The protein levels of the E1alpha subunit of PDH, along with its phosphorylation at three regulatory sites [Ser293 (site 1), Ser300 (site 2), or Ser232 (site 3)], were assessed using a kit based on an immunocytochemistry protocol (Fig. 1C,D). The total protein levels of the PDH E1alpha subunit (Fig. 1C) were decreased by ∼33% (p < 0.0001) in mutant cells compared with wild-type cells. In mutant striatal cells, all three regulatory serines exhibited pronouncedly high phosphorylation levels (Fig. 1D). In Ser232, the increase reached 2.4-fold (p < 0.001) compared with wild-type cells. This serine corresponds to the regulatory site 3 of PDH and is phosphorylated by PDK1, which activity seems to be mainly regulated by gene expression (Patel and Korotchkina, 2006). Consistent with increased Ser232 phosphorylation, PDK1 protein levels were found to be increased by 54% (p < 0.05) in mutant cells (Fig. 1E). In addition, we analyzed the protein levels of PDK3 and the catalytic subunit of the PDH phosphatase PDP1, PDP1c (Fig. 1F,G), described to be the most abundant forms of PDK and PDP, respectively, in the brain (Kolobova et al., 2001; Patel and Korotchkina, 2006). Consistent with the phosphorylation levels of the PDH E1alpha subunit, we detected an increase by ∼39% in PDK3 protein levels (p < 0.05; Fig. 1F), whereas PDP1c protein levels decreased by ∼30% (p < 0.05; Fig. 1G) in mutant striatal cells.
Figure 1.

Deregulation of NAD+/NADH ratio and PDH activity, E1alpha subunit expression, and phosphorylation in cells expressing mutant huntingtin (STHdhQ111/Q111). NAD+/NADH ratio (A) and PDH activity (B) were measured in total extracts of wild-type and mutant cells. Total PDH E1alpha protein levels (C) and phosphorylation at regulatory serines 293 (site 1), 300 (site 2), or 232 (site 3) (D) were assessed using the phospho-PDH in cell ELISA kit. Protein levels of PDK1 (E), PDK3 (F), and PDP1c (G) in wild-type and mutant cells were determined by Western blotting. Data are shown as the mean ± SEM of total NAD+/NADH ratio (in pmol/mg protein), total PDH activity (in slope/mg protein), PDH E1alpha/Janus green, phosphorylated form/total PDH E1alpha. Where mentioned, the average value obtained for wild-type was considered 100%. Absolute values for wild-type controls were 1178.00 ± 247.00 AU/min/mg protein (B), 3.60 ± 0.98 (C), 3.94 ± 1.16 for pSer293, 3.28 ± 0.62 for pSer300, and 4.32 ± 1.42 for pSer232 (D). Statistical analysis was performed by Student's t test; tp < 0.05, tttp < 0.001, and ttttp < 0.0001 compared with the respective wild-type/control cells.
PDH activation rescues cell viability and ROS production in mutant cells
HD is characterized by a large number of cellular abnormalities, including an increase in ROS production (Ribeiro et al., 2012, 2014) that may lead to protein and lipid oxidation and ultimately to a decrease in cell viability (Sorolla et al., 2010).
We assessed the viability of wild-type and mutant cells by fluorescence microscopy. Mutant cells presented lower cell viability (∼76% viable cells) compared with wild-type cells (∼93% viable cells). Accordingly, the number of apoptotic mutant cells increased by 3.25-fold (p < 0.01) compared with the wild-type cell line (Fig. 2A).
To assess the role of PDH dysfunction in cell viability, cells were treated with DCA or ALCAR for 24 h before the experiments. DCA is a PDK inhibitor shown previously to increase PDH activity and decrease E1alpha subunit turnover (Fouque et al., 2003), whereas ALCAR allows overpassing the PDH impairment by translocating through the inner mitochondrial membrane, being converted into acetyl-CoA by carnitine acyltransferases and thus directly “feeding” the TCA cycle (Jones et al., 2010; Fig. 2I). DCA (0.3–3 mm) or ALCAR (0.5 and 5 mm) did not affect the viability of wild-type cells significantly (Fig. 2B,D). At 100 μm, ALCAR had slight toxic effects in wild-type cells, decreasing cell viability by ∼4% (p < 0.01; Fig. 2D). In mutant cells, DCA (0.3–1 mm) and ALCAR (0.1–0.5 mm) did not affect cell viability (Fig. 2C,E). Interestingly, the higher concentrations of both compounds, 3 mm DCA and 5 mm ALCAR, similarly increased mutant cell viability by decreasing the percentage of apoptotic cells by ∼11% (p < 0.01; Fig. 2C,E).
Our group has shown recently that ROS levels increase in striatal mutant cells (Ribeiro et al., 2012, 2014). Indeed, mutant cells showed a great capacity of oxidizing DCFH2 to DCF (by ∼2.3-fold, p < 0.001; Fig. 2F,G), a fluorescent redox probe that can be oxidized by peroxynitrite (ONOO−) and resulting ROS such as hydroxyl radicals (·OH) and intracellular iron signaling (Kalyanaraman et al., 2012). ALCAR at the highest concentration (5 mm) enhanced DCF fluorescence in mutant cells, by ∼2-fold (p < 0.01) over basal conditions (Fig. 2G). Conversely, 3 mm DCA completely prevented the increase in DCF fluorescence in mutant cells (Fig. 2F).
To determine whether DCA or ALCAR affected PDH activity in our model, we incubated the cells for 24 h with these compounds (Fig. 2H). ALCAR (0.5 mm) showed a tendency to decrease PDH activity, probably due to PDH end product inhibition by high levels of acetyl-CoA. This effect, associated with increased ROS levels, highly compromises the beneficial effects of ALCAR in these cells. Nevertheless, incubation with 3 mm DCA almost completely recovered PDH activity in mutant cells, suggesting a high correlation of increased PDH activity, decreased ROS levels, and increased cell viability.
HDACIs rescue cell viability and mitochondrial function in mutant cells
HDACIs were shown previously to prevent cell death (Beal and Ferrante, 2004) and ameliorate mitochondrial Ca2+ handling (Oliveira et al., 2006) in HD models. Therefore, we evaluated the protective effect of HDACIs in mutant and wild-type cells incubated for 24 h with 10, 50, and 100 nm TSA (a pan-lysine deacetylase inhibitor) and 100, 250, and 500 μm PB or SB (which act preferentially on HDAC classes I and IIa). Cells were labeled with Hoechst and PI fluorescent dyes to analyze the nuclear morphology and to evaluate apoptotic and necrotic cell death (Fig. 3). Exposure to PB or SB did not affect the number of necrotic or apoptotic wild-type cells at any of the concentrations tested (Fig. 3C,E). However, TSA exhibited toxic effects in wild-type cells (Fig. 3A). At 10 nm, TSA induced a decrease by ∼3% (p < 0.05) in viable cells and, at 100 nm, this HDACI induced a decrease by ∼7% (p < 0.001) in viable cells, accompanied by an increase of ∼6% (p < 0.001) in apoptotic wild-type cells (Fig. 3A). Converesely, in mutant cells, cell viability was recovered in the presence of the HDACIs (Fig. 3B,D,F). All concentrations of PB and SB tested induced a significant increase in the percentage of viable mutant cells (between 8.7% and 14.5% for PB and 13.9% and 16.1% for SB), together with a decrease in apoptotic cells (between 8.8% and 12.3% for PB and 10.4% and 13.9% for SB) (Fig. 3D,F). TSA showed protective effects over mutant cell viability at the lowest concentration tested (10 nm) only, increasing the number of viable cells by ∼12% (p < 0.05; Fig. 3B).
Figure 3.

Protective effect of HDACIs on mutant cell viability. After 24 h of incubation with TSA (10–100 nm), PB (100–500 μm), and SB (100–500 μm), wild-type (A, C, E) and mutant (B, D, F) cells were stained with Hoechst and PI fluorescent dyes to evaluate apoptotic cell death by following the nuclear morphology (DNA condensation and fragmentation) and plasma membrane integrity (to assess the number of necrotic cells) by fluorescence microscopy, as detailed in Figure 2. Results are expressed as the mean ± SEM of three independent experiments (performed in quadruplicate). Statistical analysis was performed by one-way ANOVA, followed by Bonferroni post test: *p < 0.05, **p < 0.01, and ***p < 0.001 compared with the respective control.
To assess whether recovery of cell viability in the presence of the HDACIs was accompanied by improvement in mitochondrial function, we tested the effect of the most promising compounds, SB and PB, on mitochondrial respiration and adenine nucleotide levels (Fig. 4). Mutant cells exhibited a decrease in mitochondrial respiration under basal conditions (by ∼44%, p < 0.01; Fig. 4A) and the difference was still observed in the presence of the uncoupler FCCP (by ∼50%, p < 0.05), although FCCP enhanced O2 consumption by ∼2-fold (Fig. 4B). Mutant cells also presented lower ATP (by ∼20%, p < 0.05), ADP (by ∼45%, p < 0.001), and AMP (by ∼60%, p < 0.05) levels compared with wild-type cells (Fig. 4C–E). In the presence of PB (250 μm) and SB (500 μm), the respiratory activity of mutant cells recovered to nearly the levels observed in wild-type cells (Fig. 4A,B). Treatment with SB (500 μm) also restored intracellular ATP levels in mutant cells (Fig. 4C). Remarkably, DCA (3 mm) improved mitochondrial respiration in mutant cells (Fig. 4A,B), which may be associated with its effect on PDH activity (Fig. 2H).
Figure 4.

Protective effect of HDACIs on mitochondrial function in HD striatal cells. Oxygen consumption by wild-type and mutant cells was measured in an O2 Clark electrode, after 24 h of incubation with PB (250 μm), SB (500 μm), and DCA (3 mm) before (A) and after (B) sequential addition of oligomycin (2.5 μg/ml) and FCCP (2.5 μm) and compared with untreated controls. Dotted lines in A represent average control basal values for wild-type and mutant cells and dotted lines in B represent control FCCP-stimulated respiration of wild-type and mutant cells. C–E, Energy metabolism in wild-type and mutant cells was evaluated by measurement of ATP (C), ADP (D), and AMP (E) levels by high-performance liquid chromatography after 24 h of incubation with PB and SB. Results are expressed as mean ± SEM of 4–5 independent experiments. Statistical analysis was performed by two-way ANOVA, followed by Bonferroni post hoc test. A significant effect of the treatment was found in A [F(3, 28) = 9.102, p = 0.0002], B [F(3, 28) = 4.291, p = 0.0134] and D [F(2, 15) = 4.024, p = 0.0399], with *p < 0.05, **p < 0.01, ***p < 0.001 compared with the respective control. tp < 0.05, ttp < 0.01, compared with the respective control, by the Student's t test.
To evaluate the changes in acetylation of nuclear targets by HDACIs, we analyzed histone 3 (H3) acetylation in wild-type and mutant cells by Western blotting (Fig. 5). Mutant cells showed a tendency for a slight decrease in H3 acetylation (data not shown), as described previously (Oliveira et al., 2006). TSA (at 100 nm) significantly increased H3 acetylation in both wild-type (by ∼2.3-fold, p < 0.01; Fig. 5A) and mutant cells (by ∼2.1-fold, p < 0.05; Fig. 5B). At nontoxic concentrations (10 and 50 nm), TSA showed a tendency for an increase in H3 acetylation in wild-type and mutant cells, which was not statistically significant. PB (Fig. 5C,D) and SB (Fig. 5E,F) showed a higher effect at 500 μm, increasing H3 acetylation by ∼1.6-fold (p < 0.001) and ∼2.1-fold (p < 0.01), respectively, in wild-type cells and by 1.4-fold (p < 0.01) and 1.3-fold (p < 0.01), respectively, in mutant cells. At 250 μm, PB and SB also showed a nonsignificant tendency for increased H3 acetylation in mutant cells by ∼1.4-fold and 1.3-fold, respectively. Although these results show a positive correlation between H3 acetylation and viability, lower doses of HDACIs that decreased apoptosis in mutant cells did not always increase H3 acetylation, suggesting that the beneficial effects of HDACIs may be much broader than the simple regulation of a specific histone. Consistent with this, the three HDACI tested were previously shown to regulate core histones H2A, H2B, and H4 (Schölz et al., 2015).
Figure 5.

Effectiveness of HDACI in increasing the acetylation of histone H3 in wild-type and mutant cells. Wild-type and mutant cells were incubated for 24 h with different concentrations of the HDACI TSA (10–100 nm; A, B), PB (100–500 μm; C, D) and SB (100–500 μm; E, F) and total extracts and Western blots were obtained as described in Material and Methods. Results are expressed as mean ± SEM of five to eight independent experiments. Statistical analysis was performed by one-way ANOVA followed by Bonferroni post hoc test: *p < 0.05, **p < 0.01, and ***p < 0.001 compared with the respective control.
HDACIs rescue PDH dysfunction in mutant cells
To determine whether the protective effects achieved by HDACIs on mitochondrial function and viability could reflect a recovery of PDH function, we next evaluated the effect of HDACIs on the protein (Fig. 6A,C) and phosphorylation (Fig. 6B,D) levels of the PDH E1alpha subunit. TSA at 100 nm was not used due to the decrease in cell viability in wild-type cells and the lack of significant protection in mutant cells. In wild-type cells, 10 nm TSA and 500 μm PB increased the protein levels of E1alpha subunit by 1.4-fold and 1.5-fold (p < 0.05), respectively (Fig. 6A). In addition, 250 μm PB and 500 μm SB increased E1alpha PDH subunit levels in mutant cells by 1.3-fold and 1.4-fold (p < 0.001), respectively (Fig. 6C).
Figure 6.

Effect of HDACIs on PDH E1alpha protein levels and phosphorylation in mutant striatal cells. Wild-type (A, B) and mutant (C, D) striatal cells were incubated for 24 h with different concentrations of HDACI, TSA (10 and 50 nm), PB (250 and 500 μm), and SB (500 μm) and the levels of expression (A, C) and phosphorylation (B, D) of PDH subunit E1alpha were assessed using phospho-PDH in the cell ELISA kit. Results are expressed as mean ± SEM of three to five independent experiments (performed in duplicates or triplicates). For each graph, the wild-type (100%) values were 1.96 ± 0.96 for PDH E1alpha (A), 4.67 ± 1.33 for pSer293, 3.31 ± 1.12 for pSer300, and 7.99 ± 2.33 for pSer232 (B). The mutant control (100%) values correspond to 6.01 ± 1.93 for PDH E1alpha (C), 3.34 ± 2.32 for pSer293, 2.00 ± 1.35 for pSer300, and 2.85 ± 0.93 for pSer232 (D). Statistical analysis was performed by one-way ANOVA, followed by Bonferroni post hoc test: *p < 0.05, **p < 0.01, and ***p < 0.001 compared with wild-type cells.
In wild-type cells, 250 μm PB decreased the phosphorylation of PDH E1alpha at serine 232 by ∼33% (p < 0.01; Fig. 6B). Furthermore, 500 μm PB significantly decreased PDH E1alpha phosphorylation at all serines by ∼31% (p < 0.05) for Ser293, 22.5% (p < 0.01) for Ser300, and 44.5% (p < 0.001) for Ser232 (Fig. 6B). SB (at 500 μm) also significantly decreased PDH E1alpha phosphorylation at Ser293 and Ser232 (p < 0.05) in wild-type cells (Fig. 6B). In mutant cells, phosphorylation at Ser293 (site 1) decreased by ∼33.6% (p < 0.01) in the presence of 250 μm PB (Fig. 6D). Importantly, in mutant cells, 500 μm SB was the most efficient condition by decreasing the phosphorylation at all three serines, reducing the phosphorylation of Ser293 by ∼41.6% (p < 0.01), Ser300 by 46.5% (p < 0.05), and Ser232 by 29.4% (p < 0.05) (Fig. 6D), in good agreement with the positive results obtained in mitochondrial function (Fig. 4). In contrast, 10 nm TSA increased Ser232 phosphorylation in these cells (p < 0.05; Fig. 6D), suggesting its inefficacy in rescuing HD-related PDH dysfunction.
Rescuing of PDH-related mitochondrial dysfunction by SB is associated with decreased gene expression of PDKs
As described previously, inactivation of PDH by phosphorylation is catalyzed by one of four PDK isoforms. Apart from the four PDKs, there are two isoforms of PDPs (PDP1 and PDP2) present in mammalian cells (Karpova et al., 2003; Rardin et al., 2009). Because 500 μm SB decreased PDH phosphorylation in mutant cells in all serine residues tested, we assessed the effect of this compound on mRNA expression of each of its regulatory kinases and phosphatases, namely PDK1–4 and PDP1–2, respectively, and the expression of PDHA1, the gene that encodes the PDH E1 alpha subunit, in wild-type and mutant cells (Fig. 7). Consistent with what was described previously in the brain (Bowker-Kinley et al., 1998; Patel and Korotchkina, 2006), PDK2 and PDK3 were the most abundant PDK isoforms, whereas PDK1 exhibited low expression and PDK4 mRNA was almost negligible in wild-type and mutant mouse striatal cells; as for the phosphatases, PDP1 was ∼8-fold more abundant than PDP2 in both striatal cell lines (Fig. 7A). Therefore, untreated mutant cells presented no significant changes in the mRNA levels of PDHA1 or any of the regulatory kinases or phosphatases.
Figure 7.

Effect of SB on mRNA expression of PDH-related genes and associated HIF-1α transcription factor in HD knock-in striatal cells. Cells were incubated in the absence or presence of 500 μm SB for 24 h and total RNA was extracted, converted into cDNA, and amplified by qRT-PCR, as described in the Materials and Methods. Gene expression was normalized to the reference gene TBP (A–G). A, Comparison of mRNA expression levels of PDHA1, PDKs, and PDPs in wild-type and mutant cells. B–G, Effect of SB on PDHA1 (B), PDP1 (C), PDP2 (D), PDK1 (E), PDK2 (F), and PDK3 (G). In H and I, striatal cells were submitted to hypoxia for 1 h after SB treatment at different time points (H) or for 24 h (I). Protein levels of HIF-1α in wild-type and mutant cells were determined by Western blotting. Results are the mean ± SEM of four to five independent experiments performed in duplicate (for qRT-PCR experiments). Statistical analysis by two-way ANOVA revealed a strong significant effect of SB treatment in F (F(1, 25) = 27.31, p < 0.0001) and G (F(1, 22) = 19.68, p = 0.0002); *p < 0.05 compared with the respective control. No significant interaction was found between genotype and treatment. In I, ttp < 0.01, tttp < 0.001 compared with the mutant or wild-type control, respectively, by Student's t test.
Consistently with mRNA data (Fig. 7C,E), SB (500 μm) did not affect PDK1 or PDP1 protein levels (data not shown). However, exposure to SB (500 μm) induced a decrease in the expression of PDK2 by ∼39% (p < 0.01) and 24.5% (p < 0.05) in wild-type and mutant cells, respectively (Fig. 7F). This was accompanied by a decrease in the expression of PDK3 by ∼26.5% (p < 0.05) and 19.6% (p < 0.05) in wild-type and mutant cells, respectively (Fig. 7G), suggesting that the decrease in the PDH E1alpha phosphorylation observed in the presence of SB may be associated with decreased transcription of PDK2 and PDK3.
To confirm this hypothesis, we also looked into transcription factors that control the upregulation of PDKs. Elevated mitochondrial-derived ROS, as observed in STHdhQ111/Q111 cells (Ribeiro et al., 2013), have been implicated in the activation and stabilization of HIF-1α, an important component of the oxygen-sensing pathway that has been largely described as a suppressor of metabolism and mitochondrial oxygen consumption (Papandreou et al., 2006) by directly trans-activating the genes encoding for PDK1 (Kim et al., 2006), as well as PDK2 and PDK3 (Lu et al., 2008; Prigione et al., 2014). In striatal cells preincubated at different time points with SB (500 μm), we induced hypoxia for 1 h to allow HIF-1α stabilization/accumulation because at normal O2/ROS levels, it is rapidly degraded by the proteasome (Chandel et al., 1998; Movafagh et al., 2015). At control conditions or in cells treated with SB for 4 or 8 h, oxygen depletion benefited HIF-1α accumulation (Fig. 7H). However, after 24 h of SB incubation, a significant decrease in HIF-1α levels was observed in both wild-type (p < 0.001) and mutant cells (p < 0.01; Fig. 7H,I). Similar results were obtained with TSA (100 nm; data not shown), suggesting an effect primarily mediated by HDACIs activity. HIF-1α acetylation was shown to enhance its ubiquitination (Jeong et al., 2002; Kong et al., 2006), corroborating the hypothesis that HDACIs may be critical for HIF-1α proteasomal degradation and consequent PDK2 and PDK3 transcriptional inhibition. The forkhead box O1 (FoxO1) also regulates PDK gene expression (Jeong et al., 2012) and acetylation attenuates its transcriptional activity (Daitoku et al., 2011); however, no changes in acetyl-FoxO1 levels were observed in either wild-type or mutant cells treated with SB (data not shown). Therefore, we showed that SB treatment could reduce PDH E1alpha phosphorylation/inactivation through decreased HIF-1α and related PDK2 and PDK3 expression.
To further link PDK inhibition with improved mitochondrial function (observed in Fig. 4), we knocked down (KD) PDK3 because this enzyme can incorporate almost 50% more phosphate than PDK2 (Kolobova et al., 2001). The KD was confirmed by the 50% and 79% reduction of PDK3 protein levels in wild-type and mutant cells, respectively (Fig. 8A). PDK3 KD significantly reduced PDH E1alpha phosphorylation at Ser293 (by ∼47.4% and 47.7% in wild-type and mutant cells, respectively) and Ser300 (by ∼43.7% and 49.6% in wild-type and mutant cells, respectively) (Fig. 8B). PDH E1alpha phosphorylation at Ser232 (site 3) was not changed significantly because it is phosphorylated by PDK1 (Kolobova et al., 2001). Mitochondrial function was evaluated by the OCR using the Seahorse Bioscience XF24 flux analyzer. We measured basal respiratory capacity, oligomycin-sensitive respiration coupled to ATP synthesis, and maximal respiration in the presence of FCCP (Fig. 8C). At the end of the experiment, striatal cells were treated with a combination of rotenone and antimycin A to assess nonmitochondrial respiration. Although the decrease in basal respiration in mutant cells was not statistically significant, maximal respiratory capacity was significantly reduced by ∼43.7% (p < 0.001) in these cells. Exposure to SB (500 μm) increased basal respiration by ∼2.2-fold (p < 0.05) and ATP production by ∼1.5-fold (Fig. 8Ci,Ciii) and almost recovered maximal respiration in mutant cells (Fig. 8Cii), corroborating the previous results (Fig. 4A,B). Remarkably, PDK3 KD increased by 1.5-fold (p < 0.05) and 3.0-fold (p < 0.001) the basal respiration in wild-type and mutant cells, respectively (Fig. 8Ci). Likewise, maximal respiration and ATP production were enhanced after PDK3 KD in both wild-type (by ∼1.5-fold and 1.6-fold, respectively) and mutant cells (2.3-fold and 2.0-fold, respectively) (p < 0.05). These results confirmed that reduced PDK3 expression counteracts mitochondrial dysfunction observed in HD mutant cells and that SB treatment may exert its effect through partial suppression of PDK3 expression, as shown in Figure 7.
Figure 8.

PDK3 KD decreases PDH phosphorylation and improves mitochondrial respiration. Striatal cells were transfected with plko.1-shRNA against PDK3 or plko.1-scramble vector 48 h before the experiments or incubated for 24 h with 500 μm SB. The efficacy of the KD was confirmed by Western blotting probed for PDK3 (A) and by decreased PDH E1alpha subunit phosphorylation at Ser293 and Ser300 (B). Statistical analysis was performed by two-way ANOVA and a significant interaction between genotype and PDK3KD was found (F(2, 40) = 3.675, p = 0.0343). In addition, PDK3KD had a significant effect on Ser293 (F(2, 40) = 7.693, p = 0.0015) and Ser300 (F(2, 40) = 27.62, p < 0.0001) phosphorylation. The OCR was measured with a Seahorse Bioscience XF24 flux analyzer (C). Basal mitochondrial respiration is represented in Ci and exhibits a significant interaction between genotype and treatment (F(3, 25) = 3.248, p = 0.0387). A strong, significant effect of treatment on basal respiration was also observed (F(3, 25) = 12.57, p < 0.0001). Striatal cells were treated for the indicated times with 1 μm oligomycin A, 0.9 μm FCCP, and 1 μm antimycin A plus 1 μm rotenone to determine the proportion of oxygen consumption due to ATP turnover (Ciii) and maximal rate of respiration (Cii). PDK3KD or SB treatment had a significant effect on both Cii (F(3, 26) = 4.817, p = 0.0085) and Ciii (F(3, 26) = 4.436, p = 0.0120). Results are expressed as mean ± SEM of three to four independent experiments. Statistical significance: *p < 0.05, **p < 0.01, ***p < 0.001, and ****p < 0.0001 compared with untransfected cells; ####p < 0.0001 compared with mutant untransfected cells; $p < 0.05, $$p < 0.01, and $$$$p < 0.0001 compared with plko.1-transfected cells by two-way ANOVA followed by Bonferroni post test; tttp < 0.001 compared with the wild-type (Wt) control (in Cii) by Student's t test.
SB rescues PDH metabolism and motor balance in HD mice
To confirm the relevance of these results in an HD animal model, we analyzed phospho-PDH-related metabolism in the cortex of 9-month-old YAC128 and wild-type mice treated with 1 mg/kg/d SB or vehicle solution. In addition, the significance of in vivo PDC activation was validated by behavior studies (Fig. 9). YAC128 mice at 9 months of age were described previously to exhibit motor abnormalities with dysfunctional open-field activity and rotarod performance abnormalities, followed by brain weight loss and evident striatal atrophy (Slow et al., 2003; Van Raamsdonk et al., 2005). In addition, cortical metabolic defects related with decreased sterol levels were described previously at this age (Valenza et al., 2007), suggesting that metabolic alterations in this brain region precede cortical atrophy, which is significant at 12 months of age (Van Raamsdonk et al., 2005). In the present study, YAC128 mouse cortex presented lower levels of acetylated H3, by ∼58% (p < 0.05), compared with wild-type mice. Importantly, SB treatment increased H3 acetylation in both wild-type (p < 0.01) and YAC128 (p < 0.01) mice, the latter presenting acetylation levels comparable to those observed in saline-treated wild-type mice (Fig. 9A). Moreover, YAC128 mice presented an increase of ∼50% (p < 0.05) in PDH E1 alpha subunit phosphorylated at Ser232 (Fig. 9B) and an increase by ∼1.88-fold (p < 0.0001), 1.80-fold (p < 0.0001), and 3.44-fold (p < 0.001), respectively, in cortical PDK1–3 mRNA levels compared with wild-type mice (Fig. 9C). These mice also showed a tendency for decreased cortical ATP/ADP levels (by ∼45%, p = 0.07) and reduced energy charge (by ∼68%, p < 0.01) (Fig. 9D,E). SB-treated YAC128 and wild-type animals showed a large reduction in PDK1–3 mRNA levels in the cortex. In wild-type mice cortex, SB treatment induced a reduction in PDK1–3 mRNA levels, respectively, by ∼87.7% (p < 0.001), 85.2% (p < 0.001), and 96.7% (p < 0.05) compared with saline-treated wild-type mice (Fig. 9C). Importantly, in the brain cortex of YAC128 mice, SB treatment induced a reduction in phosphorylated PDH levels (at Ser232) by ∼62% (p < 0.001; Fig. 9B) and in mRNA levels of PDK1–3, respectively, by ∼91.7% (p < 0.0001), ∼90.2% (p < 0.0001), and ∼98.4%, respectively (p < 0.0001; Fig. 9C). The recovery of PDC function by SB normalized both ATP/ADP levels and energy charge (Fig. 9D,E), corroborating the changes observed in SB-treated HD cell line, and regularized YAC128 mice body weight (data not shown), reported to be augmented due to their genetic background (Van Raamsdonk et al., 2006).
Figure 9.

SB treatment recovers PDH function, energy metabolism, and motor coordination in YAC128 mice. Histone 3 acetylation (AcH3; n = 6/7; A), PDH E1 alpha subunit phosphorylation at Ser232 (n = 5; B), relative mRNA expression of PDK1–3 (n = 6/8; C), ATP/ADP ratio (n = 4/5; D), and energy charge (n = 4/5; E) were analyzed in cortical brain fractions from YAC128 (HD53 line) and wild-type mice after treatment with saline (control group) or SB (1 mg/kg/d) for 28 d. Behavioral analysis was performed in a rotarod apparatus in a fixed speed (5 rpm; motor learning; F) and in accelerated speed (from 5 to 40 rpm; motor coordination; G) (n = 9/13) and the latency to fall off was recorded, as indicated in the Materials and Methods. Data are shown as the mean ± SEM of the indicated animals from each treatment. Statistical analysis was performed by two-way ANOVA and revealed a significant interaction between genotype and SB treatment shown in B (F(1, 31) = 6.113, p = 0.0191), D (F(1, 14) = 5.627, p = 0.0326), and E (F(1, 14) = 9.536, p = 0.0086). A strong significant effect of SB treatment is shown in A (F(1, 31) = 25.22, p < 0.0001), B (F(1, 31) = 16.08, p = 0.0004), and G (F(1, 58) = 16,90, p = 0.0001). In G, there is a significant effect of the genotype (F(1, 67) = 14,66, p = 0.0003). Statistical significance: *p < 0.05, **p < 0.01, ***p < 0.001, and ****p < 0.0001 compared with wild-type saline-treated group; ##p < 0.01, ###p < 0.001, and ####p < 0.0001 compared with the respective saline-treated group; and &&&p < 0.001 between the three cohorts of mice throughout trials 2 to 4 by two-way ANOVA followed by Bonferroni post test and by Student's t test: tp < 0.05 (in C).
Behavior analysis demonstrated that saline-treated YAC128 mice display impaired motor learning; that is, when placed at a constant rotating rod (5 rpm) in the rotarod apparatus, they took twice as long to learn the task compared with saline-treated wild-type mice (p < 0.01; Fig. 9F). Consistent with this, the accelerated task showed that YAC128 mice not only exhibited deficits in motor learning, because there was no improvement between sequential trials, but also showed lack of balance and coordination with a latency to fall by 40%, 38%, and 45% lower in trials 2, 3, and 4, respectively, compared with wild-type mice (p = 0.0003; Fig. 9G). After SB treatment, YAC128 mice showed an improvement in motor learning in fixed-speed task, which was corroborated in the accelerated task, in which SB-treated YAC128 mice showed increasing progress of latency to fall throughout the trials (p = 0.0001), resembling the values of saline-treated wild-type mice in the two last trials (Fig. 9F,G). The results suggest that both saline-treated wild-type and SB-treated YAC128 mice are more capable of learning, associated with a better motor coordination, in relation to saline-treated YAC128 mice.
Discussion
The present work shows that full-length mHTT inhibits PDH activity by decreasing the PDH E1alpha subunit and increasing its phosphorylation at three serine regulatory sites. The positive regulation of these sites is governed by enhanced PDK1 and PDK3 protein levels and reduced PDP1c. Reestablishment of PDH function in HD cells by HDACI and DCA was linked to increased mitochondrial function and decreased ROS and cell death. Treatment with SB efficiently decreased PDH phosphorylation due to reduced mRNA expression of PDKs, in particular PDK3 (the most active and abundant PDK isoform in the brain), in HD striatal cells and YAC128 mouse brain, improving mitochondrial function and bioenergetics and positively influencing motor learning and coordination in YAC128 transgenic mice.
PDH dysfunction in HD models
In early 1980s, Sorbi et al. (1983) described decreased PDC activity in HD human brain, suggesting a possible role of this enzymatic complex in mitochondrial deficits linked to bioenergetic dysfunction in HD. As shown previously by us, the use of pyruvate instead of glucose as an energetic substrate accentuated the bioenergetic evidences of mitochondrial dysfunction in HD striatal neurons (Oliveira et al., 2006); moreover, metabolically supplementing mitochondria with pyruvate under glycolysis inhibition did not recover ATP levels in HD cybrids, which, together with a decreased mitochondrial NADH/NADt ratio and unaltered activity of mitochondrial complexes I–IV, signalized alterations in mitochondrial function upstream oxidative phosphorylation (Ferreira et al., 2010, 2011). Here, we showed decreased PDH activity in striatal STHdhQ111/Q111 cells, which may be explained by decreased PDH E1alpha protein levels and higher phosphorylation at three regulatory serines (293, 300, and 232) of E1alpha subunit. Moreover, YAC128 mouse cortex exhibited increased PDH E1alpha phosphorylation at Ser232. Similar findings were described by us in HD cybrids (Ferreira et al., 2011) and in primary YAC128 cortical neurons (Naia et al., 2016a) exhibiting higher phosphorylation of PDH E1alpha at Ser232 and Ser293. This suggested dysfunctional mechanisms responsible for phosphorylation/dephosphorylation of these regulatory sites (Rardin et al., 2009). Indeed, mutant cells showed increased PDK1 and PDK3 protein levels, accompanied by decreased levels of the catalytic subunit of the most abundant PDH phosphatase, PDP1c. Decreased E1alpha protein levels could be due to alterations in protein expression (Perluigi et al., 2005) in response to modified transcription factors known to regulate PDH, such as PGC-1alpha (Kiilerich et al., 2010), described to be altered in HD models, including STHdhQ111/Q111 cells (Cui et al., 2006). Nevertheless, expression of PDHA gene, which encodes for PDH E1alpha subunit, was not significantly affected in mutant cells. Similarly, no changes in mRNA levels of PDKs or PDPs were observed in HD cells. Therefore, altered protein turnover and degradation might explain modified protein levels of PDH E1alpha, PDK1, PDK3, and PDP1c. Conversely, saline-treated YAC128 mice showed increased mRNA expression of PDK1–3. An increase in ROS levels in mutant cells may also contribute to inhibit PDH activity because this enzyme was shown to suffer oxidative modifications (Vlessis et al., 1991; Tabatabaie et al., 1996; Samikkannu et al., 2003). Indeed, H2O2-induced oxidative stress was shown to activate PDK1 (Prasad et al., 2000).
The central role of PDH in cellular bioenergetics makes it a suitable therapeutic target to revert bioenergetic changes in HD. DCA ameliorates PDH deficits by increasing PDH activity through decreased activity of its inhibitory kinases, PDKs, and also by decreasing PDH E1alpha subunit turnover (Morten et al., 1998; Fouque et al., 2003). DCA was shown previously to have beneficial effects in R6/2 and N171-82Q HD mouse models by restoring the active form of PDH (Andreassen et al., 2001). The evidence that DCA decreases apoptosis in mutant cells suggests that altered mitochondrial bioenergetics plays an important role in cell death. Importantly, DCA increased PDH activity and restored mitochondrial respiration and ROS levels in mutant cells, suggesting that higher ROS in mutant cells could be related to lower NADH/NAD+ ratio due to PDH deficiency (Ferreira et al., 2011) and/or to a failure of oxidative phosphorylation.
HDACIs and mitochondrial dysfunction
Transcriptional deregulation is a recognized mechanism of HD pathogenesis (Sugars and Rubinsztein, 2003) and increasing gene transcription with HDACIs is an interesting strategy to recover mitochondrial function and energy metabolism in HD. HDACIs were first described to increase acetylation of histones and other chromatin-associated proteins, but more recent reports showed that these pharmacological compounds also modulate the activity of nonhistone substrates across the cell (Schölz et al., 2015). HDACIs were found to have beneficial effects in HD by reducing cell death (Beal and Ferrante, 2004), ameliorating mitochondrial Ca2+ handling (Oliveira et al., 2006), dynamics (Guedes-Dias et al., 2015), and metabolism (Jia et al., 2012). HDACIs were also shown to ameliorate the axonal transport in HD cells (Dompierre et al., 2007) and the neurodegenerative phenotype in HD mice (Ferrante et al., 2003; Thomas et al., 2008).
Here, we show that exposure to HDACIs enhances H3 acetylation and STHdhQ111/Q111 cell viability, suggesting that altered gene expression may be linked to neuronal death in HD. Importantly, PDH dysfunction in mutant cells could be reversed by HDACIs. Both PB (250 μm) and SB (500 μm) increased PDH E1alpha subunit protein levels in mutant cells; moreover, SB decreased the phosphorylation of E1alpha subunit at all regulatory sites, whereas PB decreased Ser293 phosphorylation. This alteration in PDH phosphorylation suggests that HDACIs interfere with enzymes that regulate PDH phosphorylation, namely PDKs and PDPs, and/or with related transcription factors (Rardin et al., 2009), supporting a broader action of HDACIs beyond histones as nuclear targets.
Several lines of evidence propose that mitochondrial ROS are sufficient for the stabilization of HIF-1α under normoxia (Brunelle et al., 2005; Kaelin, 2005). Under these conditions, HIF-1α escapes degradation and translocates to the nucleus, initiating the transcription of several metabolism-related genes, including PDK1–3 (Kim et al., 2006; Prigione et al., 2014), culminating in decreased PDH activity. We observed that the HDACI SB produced a marked inhibition of HIF-1α accumulation, suggesting increased degradation. Earlier studies demonstrated that therapeutic concentrations of HDACI are sufficient to repress HIF-1α activation (Fath et al., 2006; Kong et al., 2006; Kim et al., 2007). Acetylation of HIF-1α (at Lys532) enhances its ubiquitination, targeting HIF-1α for proteasomal degradation (Jeong et al., 2002; Kim et al., 2007). Therefore, SB-mediated protection in mutant cells occurs through modulation of HIF-1α degradation, which may decrease mRNA expression of PDK2 and PDK3, enhancing PDH E1alpha activity. Indeed, PDK and PDP activities have been described to be mainly regulated by changes in gene expression (Harris et al., 2002; Sugden and Holness, 2006). The isoenzyme PDK3 was found to have high specific activity and an ∼2-fold higher ability to incorporate phosphate than PDK2 (Bowker-Kinley et al., 1998; Kolobova et al., 2001). In agreement, genetic suppression of PDK3 reduced PDH E1alpha sites 1 and 2 phosphorylation, greatly increasing mitochondrial respiration in mutant cells, corroborating the previous hypothesis. Analysis of the mRNA levels of PDK1–3 and PDH phosphorylation in SB-treated YAC128 mice confirmed the relevance of data obtained in striatal cells. We found increased PDH E1alpha phosphorylation (at Ser232) and mRNA expression of PDK1–3 in the cortex of YAC128 mice, which were largely reduced in SB-treated animals. Moreover, SB-treated YAC128 mice showed improved cortical energy levels and increased H3 acetylation. Of major importance, SB treatment improved YAC128 motor learning and function at conditions at which it also rescued PDH activity, reinforcing the protective role of this HDACI.
We have provided evidence of HDACIs as potential neuroprotective compounds in neurodegeneration research and therapy; however, major challenges remain in the identification of their primary targets because it is difficult to reconcile whether the observed effects are exclusively at the epigenetic level. SB treatment was reported to potentially increase 3112 acetylation sites in a cell-based acetylome analysis (Schölz et al., 2015). Indeed, in addition to nuclear effects, HDACIs, including SB, might modulate mitochondrial targets directly. PDH E1alpha was reported to be acetylated at Lys321, facilitating Ser293 phosphorylation and reducing PDC activity (Fan et al., 2014), in contrast to the effect of HDACI found in the present study. In turn, acetylation of the PDH E2 subunit increased PDC activity (Behal et al., 1993). In the latter case, lysine acetylation could prevent lysine ubiquitination, preventing protein degradation by proteasomal or lysosomal machineries and resulting in increased protein half-life (Sadoul et al., 2008; Zhao et al., 2010). Conversely, as with HIF-1α at Lys532, lysine acetylation can promote ubiquitination, leading to protein degradation. Therefore, in addition to the indirect effect of HDACIs on PDH activity via PDK gene transcription through regulation of HIF-1α stabilization, these compounds may interfere with protein turnover directly by increasing acetylation and possibly modulating the ubiquitination and degradation processes. Therefore, future studies will benefit from the identification/design of HDAC-selective inhibitors.
Overall, this work brings a better understanding of mitochondrial dysfunction in HD-affected cells by providing evidence for a central role of PDH deregulation. Our data provide support for PDH as a promising therapeutic target in HD, as summarized in Figure 10. In addition, SB was shown to be a promising neuroprotective agent for the treatment of mitochondrial bioenergetic dysfunction in HD striatal cells and YAC128 mice by decreasing the expression of the most abundant PDK isoforms.
Figure 10.

PDH as a therapeutic target in HD: effect of sodium butyrate. Expression of full-length mutant huntingtin caused decreased cell viability associated with decreased mitochondrial respiration and ATP levels and increased ROS levels. Mitochondrial dysfunction in mutant cells was linked to decreased PDH activity. Decreased PDH E1alpha protein levels and increased PDH phosphorylation/inactivation at all three regulatory sites (at Ser293, Ser300 and Ser232) accounted for by this decrease as a consequence of increased protein levels of PDK1 and PDK3 and decreased levels of PDP1c in HD striatal cells and enhanced PDK1–3 mRNA levels in YAC128 mouse brain cortex. SB, as an HDAC class I and IIa inhibitor, significantly increased histone H3 acetylation. Under these conditions, decreased levels of HIF-1α (which, when acetylated, is degraded by the proteasome) might decrease PDK transcription. Indeed, SB treatment reduced PDK1 (in YAC128 mice only), PDK2, and PDK3 mRNA levels and consequently PDH phosphorylation, culminating in increased PDH activity, mitochondrial respiration, and ATP production. Behavior analysis revealed that SB treatment increased the latency to fall off of the rotarod in YAC128 mice, equaling the time of vehicle-treated wild-type mice. Data suggest that HDACIs, particularly SB, ameliorate mitochondrial metabolic function in HD through expression of PDKs and modified PDH activity, which leads to an improved HD phenotype. In this scheme, the text in red represents an increased effect induced by full-length mutant huntingtin compared with the control. The green arrows show the changes induced by SB treatment.
Footnotes
This work was supported by projects PTDC/SAU-FCF/108056/2008, EXPL/BIM-MEC/2220/2013, PEst-C/SAU/LA0001/2013-2014, and UID/NEU/04539/2013 funded by Fundação para a Ciência e a Tecnologia (FCT), Portugal, cofinanced by Programa Operacional Competitividade e Internacionalização (COMPETE), Quadro de Referência Estratégica Nacional (QREN), European Union (Fundo Europeu de Desenvolvimento Regional); Santa Casa da Misericórdia de Lisboa (SCML), Mantero Belard Neuroscience Prize (first edition); and Fundação Luso-Americana para o Desenvolvimento (FLAD) Life Science 2020 project. T.C.-O. and T.R.R. were supported by FCT postdoctoral fellowships SFRH/BPD/34711/2007 and SFRH/BPD/44246/2008, respectively; M.R. and L.N. were supported by the doctoral fellowships SFRH/BD/41285/2007 and SFRH/BD/86655/2012, respectively, cofinanced by the Programa Operacional Potencial Humano, QREN, and the European Union. We thank Dr. Henrique Girão (Institute for Biomedical Imaging and Life Sciences, Faculty of Medicine, University of Coimbra) for kindly providing the antibody against HIF-1α.
The authors declare no competing financial interests.
References
- Andreassen OA, Ferrante RJ, Huang HM, Dedeoglu A, Park L, Ferrante KL, Kwon J, Borchelt DR, Ross CA, Gibson GE, Beal MF (2001) Dichloroacetate exerts therapeutic effects in transgenic mouse models of Huntington's disease. Ann Neurol 50:112–117. 10.1002/ana.1085 [DOI] [PubMed] [Google Scholar]
- Beal MF, Ferrante RJ (2004) Experimental therapeutics in transgenic mouse models of Huntington's disease. Nat Rev Neurosci 5:373–384. 10.1038/nrn1386 [DOI] [PubMed] [Google Scholar]
- Behal RH, Buxton DB, Robertson JG, Olson MS (1993) Regulation of the pyruvate dehydrogenase multienzyme complex. Annu Rev Nutr 13:497–520. [DOI] [PubMed] [Google Scholar]
- Benn CL, Sun T, Sadri-Vakili G, McFarland KN, DiRocco DP, Yohrling GJ, Clark TW, Bouzou B, Cha JH (2008) Huntingtin modulates transcription, occupies gene promoters in vivo, and binds directly to DNA in a polyglutamine-dependent manner. J Neurosci 28:10720–10733. 10.1523/JNEUROSCI.2126-08.2008 [DOI] [PMC free article] [PubMed] [Google Scholar]
- Borovecki F, Lovrecic L, Zhou J, Jeong H, Then F, Rosas HD, Hersch SM, Hogarth P, Bouzou B, Jensen RV, Krainc D (2005) Genome-wide expression profiling of human blood reveals biomarkers for Huntington's disease. Proc Natl Acad Sci U S A 102:11023–11028. 10.1073/pnas.0504921102 [DOI] [PMC free article] [PubMed] [Google Scholar]
- Bowker-Kinley MM, Davis WI, Wu P, Harris RA, Popov KM (1998) Evidence for existence of tissue-specific regulation of the mammalian pyruvate dehydrogenase complex. Biochem J 329:191–196. 10.1042/bj3290191 [DOI] [PMC free article] [PubMed] [Google Scholar]
- Brett AC, Rosenstock TR, Rego AC (2014) Current therapeutic advances in patients and experimental models of Huntington's Disease. Curr Drug Targets 15:313–334. 10.2174/1389450114666131124140704 [DOI] [PubMed] [Google Scholar]
- Brunelle JK, Bell EL, Quesada NM, Vercauteren K, Tiranti V, Zeviani M, Scarpulla RC, Chandel NS (2005) Oxygen sensing requires mitochondrial ROS but not oxidative phosphorylation. Cell Metab 1:409–414. 10.1016/j.cmet.2005.05.002 [DOI] [PubMed] [Google Scholar]
- Butterworth J, Yates CM, Reynolds GP (1985) Distribution of phosphate-activated glutaminase, succinic dehydrogenase, pyruvate dehydrogenase and gamma-glutamyl transpeptidase in post-mortem brain from Huntington's disease and agonal cases. J Neurol Sci 67:161–171. 10.1016/0022-510X(85)90112-1 [DOI] [PubMed] [Google Scholar]
- Chandel NS, Maltepe E, Goldwasser E, Mathieu CE, Simon MC, Schumacker PT (1998) Mitochondrial reactive oxygen species trigger hypoxia-induced transcription. Proc Natl Acad Sci U S A 95:11715–11720. 10.1073/pnas.95.20.11715 [DOI] [PMC free article] [PubMed] [Google Scholar]
- Cui L, Jeong H, Borovecki F, Parkhurst CN, Tanese N, Krainc D (2006) Transcriptional repression of PGC-1alpha by mutant huntingtin leads to mitochondrial dysfunction and neurodegeneration. Cell 127:59–69. 10.1016/j.cell.2006.09.015 [DOI] [PubMed] [Google Scholar]
- Cunha-Oliveira T, Ferreira IL, Cristina A (2012) Consequences of mitochondrial dysfunction in Huntington's disease and protection via phosphorylation pathways. In: InTech: Huntington's disease: core concepts and current advances. Available from: https://estudogeral.sib.uc.pt/handle/10316/18507.
- Daitoku H, Sakamaki J, Fukamizu A (2011) Regulation of FoxO transcription factors by acetylation and protein-protein interactions. Biochim Biophys Acta 1813:1954–1960. 10.1016/j.bbamcr.2011.03.001 [DOI] [PubMed] [Google Scholar]
- Damiano M, Galvan L, Déglon N, Brouillet E (2010) Mitochondria in Huntington's disease. Biochim Biophys Acta 1802:52–61. 10.1016/j.bbadis.2009.07.012 [DOI] [PubMed] [Google Scholar]
- Dompierre JP, Godin JD, Charrin BC, Cordelières FP, King SJ, Humbert S, Saudou F (2007) Histone deacetylase 6 inhibition compensates for the transport deficit in Huntington's disease by increasing tubulin acetylation. J Neurosci 27:3571–3583. 10.1523/JNEUROSCI.0037-07.2007 [DOI] [PMC free article] [PubMed] [Google Scholar]
- Fan J, et al. (2014) Tyr phosphorylation of PDP1 toggles recruitment between ACAT1 and SIRT3 to regulate the pyruvate dehydrogenase complex. Mol Cell 53:534–548. 10.1016/j.molcel.2013.12.026 [DOI] [PMC free article] [PubMed] [Google Scholar]
- Fath DM, Kong X, Liang D, Lin Z, Chou A, Jiang Y, Fang J, Caro J, Sang N (2006) Histone deacetylase inhibitors repress the transactivation potential of hypoxia-inducible factors independently of direct acetylation of HIF-alpha. J Biol Chem 281:13612–13619. 10.1074/jbc.M600456200 [DOI] [PMC free article] [PubMed] [Google Scholar]
- Ferrante RJ, Kubilus JK, Lee J, Ryu H, Beesen A, Zucker B, Smith K, Kowall NW, Ratan RR, Luthi-Carter R, Hersch SM (2003) Histone deacetylase inhibition by sodium butyrate chemotherapy ameliorates the neurodegenerative phenotype in Huntington's disease mice. J Neurosci 23:9418–9427. [DOI] [PMC free article] [PubMed] [Google Scholar]
- Ferreira IL, Nascimento MV, Ribeiro M, Almeida S, Cardoso SM, Grazina M, Pratas J, Santos MJ, Januário C, Oliveira CR, Rego AC (2010) Mitochondrial-dependent apoptosis in Huntington's disease human cybrids. Exp Neurol 222:243–255. 10.1016/j.expneurol.2010.01.002 [DOI] [PubMed] [Google Scholar]
- Ferreira IL, Cunha-Oliveira T, Nascimento MV, Ribeiro M, Proença MT, Januário C, Oliveira CR, Rego AC (2011) Bioenergetic dysfunction in Huntington's disease human cybrids. Exp Neurol 231:127–134. 10.1016/j.expneurol.2011.05.024 [DOI] [PubMed] [Google Scholar]
- Fouque F, Brivet M, Boutron A, Vequaud C, Marsac C, Zabot MT, Benelli C (2003) Differential effect of DCA treatment on the pyruvate dehydrogenase complex in patients with severe PDHC deficiency. Pediatr Res 53:793–799. 10.1203/01.PDR.0000057987.46622.64 [DOI] [PubMed] [Google Scholar]
- Gil JM, Rego AC (2008) Mechanisms of neurodegeneration in Huntington's disease. Eur J Neurosci 27:2803–2820 10.1111/j.1460-9568.2008.06310.x [DOI] [PubMed] [Google Scholar]
- Guedes-Dias P, de Proença J, Soares TR, Leitão-Rocha A, Pinho BR, Duchen MR, Oliveira JM (2015) HDAC6 inhibition induces mitochondrial fusion, autophagic flux and reduces diffuse mutant huntingtin in striatal neurons. Biochim Biophys Acta 1852:2484–2493. 10.1016/j.bbadis.2015.08.012 [DOI] [PubMed] [Google Scholar]
- Harris RA, Bowker-Kinley MM, Huang B, Wu P (2002) Regulation of the activity of the pyruvate dehydrogenase complex. Adv Enzyme Regul 42:249–259. [DOI] [PubMed] [Google Scholar]
- Hogarth P, Lovrecic L, Krainc D (2007) Sodium phenylbutyrate in Huntington's disease: a dose-finding study. Mov Disord 22:1962–1964. 10.1002/mds.21632 [DOI] [PubMed] [Google Scholar]
- Jenkins BG, Koroshetz WJ, Beal MF, Rosen BR (1993) Evidence for impairment of energy metabolism in vivo in Huntington's disease using localized 1H NMR spectroscopy. Neurology 43:2689–2695. 10.1212/WNL.43.12.2689 [DOI] [PubMed] [Google Scholar]
- Jenkins BG, Rosas HD, Chen YC, Makabe T, Myers R, MacDonald M, Rosen BR, Beal MF, Koroshetz WJ (1998) 1H NMR spectroscopy studies of Huntington's disease: Correlations with CAG repeat numbers. Neurology 50:1357–1365. 10.1212/WNL.50.5.1357 [DOI] [PubMed] [Google Scholar]
- Jeong JW, Bae MK, Ahn MY, Kim SH, Sohn TK, Bae MH, Yoo MA, Song EJ, Lee KJ, Kim KW (2002) Regulation and destabilization of HIF-1α by ARD1-mediated acetylation. Cell 111:709–720. 10.1016/S0092-8674(02)01085-1 [DOI] [PubMed] [Google Scholar]
- Jeong JY, Jeoung NH, Park KG, Lee IK (2012) Transcriptional regulation of pyruvate dehydrogenase kinase. Diabetes Metab J 36:328–335. 10.4093/dmj.2012.36.5.328 [DOI] [PMC free article] [PubMed] [Google Scholar]
- Jia H, Pallos J, Jacques V, Lau A, Tang B, Cooper A, Syed A, Purcell J, Chen Y, Sharma S, Sangrey GR, Darnell SB, Plasterer H, Sadri-Vakili G, Gottesfeld JM, Thompson LM, Rusche JR, Marsh JL, Thomas EA (2012) Histone deacetylase (HDAC) inhibitors targeting HDAC3 and HDAC1 ameliorate polyglutamine-elicited phenotypes in model systems of Huntington's disease. Neurobiol Dis 46:351–361. 10.1016/j.nbd.2012.01.016 [DOI] [PMC free article] [PubMed] [Google Scholar]
- Jones LL, McDonald DA, Borum PR (2010) Acylcarnitines: role in brain. Prog Lipid Res 49:61–75. 10.1016/j.plipres.2009.08.004 [DOI] [PubMed] [Google Scholar]
- Kaelin WG., Jr (2005) ROS: really involved in oxygen sensing. Cell Metab 1:357–358. 10.1016/j.cmet.2005.05.006 [DOI] [PubMed] [Google Scholar]
- Kalyanaraman B, Darley-Usmar V, Davies KJ, Dennery PA, Forman HJ, Grisham MB, Mann GE, Moore K, Roberts LJ 2nd, Ischiropoulos H (2012) Measuring reactive oxygen and nitrogen species with fluorescent probes: challenges and limitations. Free Radic Biol Med 52:1–6. 10.1016/j.freeradbiomed.2011.09.030 [DOI] [PMC free article] [PubMed] [Google Scholar]
- Karpova T, Danchuk S, Kolobova E, Popov KM (2003) Characterization of the isozymes of pyruvate dehydrogenase phosphatase: Implications for the regulation of pyruvate dehydrogenase activity. Biochim Biophys Acta 1652:126–135. 10.1016/j.bbapap.2003.08.010 [DOI] [PubMed] [Google Scholar]
- Kiilerich K, Adser H, Jakobsen AH, Pedersen PA, Hardie DG, Wojtaszewski JF, Pilegaard H (2010) PGC-1alpha increases PDH content but does not change acute PDH regulation in mouse skeletal muscle. Am J Physiol Regul Integr Comp Physiol 299:R1350–R1359. 10.1152/ajpregu.00400.2010 [DOI] [PubMed] [Google Scholar]
- Kim JW, Tchernyshyov I, Semenza GL, Dang CV (2006) HIF-1-mediated expression of pyruvate dehydrogenase kinase: a metabolic switch required for cellular adaptation to hypoxia. Cell Metab 3:177–185. 10.1016/j.cmet.2006.02.002 [DOI] [PubMed] [Google Scholar]
- Kim SH, Jeong JW, Park JA, Lee JW, Seo JH, Jung BK, Bae MK, Kim KW (2007) Regulation of the HIF-1 alpha stability by histone deacetylases. Oncol Rep 17:647–651. [PubMed] [Google Scholar]
- Kolobova E, Tuganova A, Boulatnikov I, Popov KM (2001) Regulation of pyruvate dehydrogenase activity through phosphorylation at multiple sites. Biochem J 358:69–77. [DOI] [PMC free article] [PubMed] [Google Scholar]
- Kong X, Lin Z, Liang D, Fath D, Sang N, Caro J (2006) Histone deacetylase inhibitors induce VHL and ubiquitin-independent proteasomal degradation of hypoxia-inducible factor 1alpha. Mol Cell Biol 26:2019–2028. 10.1128/MCB.26.6.2019-2028.2006 [DOI] [PMC free article] [PubMed] [Google Scholar]
- Koroshetz WJ, Jenkins BG, Rosen BR, Beal MF (1997) Energy metabolism defects in Huntington's disease and effects of coenzyme Q10. Ann Neurol 41:160–165. 10.1002/ana.410410206 [DOI] [PubMed] [Google Scholar]
- Kuhl DE, Phelps ME, Markham CH, Metter EJ, Riege WH, Winter J (1982) Cerebral metabolism and atrophy in Huntington's disease determined by 18FDG and computed tomographic scan. Ann Neurol 12:425–434. 10.1002/ana.410120504 [DOI] [PubMed] [Google Scholar]
- Kuwert T, Lange HW, Langen KJ, Herzog H, Aulich A, Feinendegen LE (1989) Cerebral glucose consumption measured by PET in patients with and without psychiatric symptoms of Huntington's disease. Psychiatry Res 29:361–362. 10.1016/0165-1781(89)90090-5 [DOI] [PubMed] [Google Scholar]
- Lu CW, Lin SC, Chen KF, Lai YY, Tsai SJ (2008) Induction of pyruvate dehydrogenase kinase-3 by hypoxia-inducible factor-1 promotes metabolic switch and drug resistance. J Biol Chem 283:28106–28114. 10.1074/jbc.M803508200 [DOI] [PMC free article] [PubMed] [Google Scholar]
- Milakovic T, Johnson GV (2005) Mitochondrial respiration and ATP production are significantly impaired in striatal cells expressing mutant huntingtin. J Biol Chem 280:30773–30782. 10.1074/jbc.M504749200 [DOI] [PubMed] [Google Scholar]
- Mochel F, Haller RG (2011) Energy deficit in Huntington disease: Why it matters. J Clin Invest 121:493–499. 10.1172/JCI45691 [DOI] [PMC free article] [PubMed] [Google Scholar]
- Morten KJ, Caky M, Matthews PM (1998) Stabilization of the pyruvate dehydrogenase E1alpha subunit by dichloroacetate. Neurology 51:1331–1335. 10.1212/WNL.51.5.1331 [DOI] [PubMed] [Google Scholar]
- Movafagh S, Crook S, Vo K (2015) Regulation of hypoxia-inducible Factor-1a by reactive oxygen species: new developments in an old debate. J Cell Biochem 116:696–703. 10.1002/jcb.25074 [DOI] [PubMed] [Google Scholar]
- Naia L, Ferreira IL, Cunha-Oliveira T, Duarte AI, Ribeiro M, Rosenstock TR, Laço MN, Ribeiro MJ, Oliveira CR, Saudou F, Humbert S, Rego AC (2015) Activation of IGF-1 and insulin signaling pathways ameliorate mitochondrial function and energy metabolism in Huntington's disease human lymphoblasts. Mol Neurobiol 51:331–348. 10.1007/s12035-014-8735-4 [DOI] [PubMed] [Google Scholar]
- Naia L, Ribeiro M, Rodrigues J, Duarte AI, Lopes C, Rosenstock TR, Hayden MR, Rego AC (2016a) Insulin and IGF-1 regularize energy metabolites in neural cells expressing full-length mutant huntingtin. Neuropeptides 58:73–81. 10.1016/j.npep.2016.01.009 [DOI] [PubMed] [Google Scholar]
- Naia L, Rosenstock TR, Oliveira AM, Oliveira-Sousa SI, Caldeira GL, Carmo C, Laço MN, Hayden MR, Oliveira CR, Rego AC (2016b) Comparative mitochondrial-based protective effects of resveratrol and nicotinamide in Huntington's disease models. Mol Neurobiol. Advance online publication. Retrieved February 15, 2017. 10.1007/s12035-016-0048-3 [DOI] [PubMed] [Google Scholar]
- Oliveira JM, Chen S, Almeida S, Riley R, Gonçalves J, Oliveira CR, Hayden MR, Nicholls DG, Ellerby LM, Rego AC (2006) Mitochondrial-dependent Ca2+ handling in Huntington's disease striatal cells: effect of histone deacetylase inhibitors. J Neurosci 26:11174–11186. 10.1523/JNEUROSCI.3004-06.2006 [DOI] [PMC free article] [PubMed] [Google Scholar]
- Papandreou I, Cairns RA, Fontana L, Lim AL, Denko NC (2006) HIF-1 mediates adaptation to hypoxia by actively downregulating mitochondrial oxygen consumption. Cell Metab 3:187–197. 10.1016/j.cmet.2006.01.012 [DOI] [PubMed] [Google Scholar]
- Patel MS, Korotchkina LG (2006) Regulation of the pyruvate dehydrogenase complex. Biochem Soc Trans 34:217–222. [DOI] [PubMed] [Google Scholar]
- Perluigi M, Poon HF, Maragos W, Pierce WM, Klein JB, Calabrese V, Cini C, De Marco C, Butterfield DA (2005) Proteomic analysis of protein expression and oxidative modification in r6/2 transgenic mice: a model of Huntington disease. Mol Cell Proteomics 4:1849–1861. 10.1074/mcp.M500090-MCP200 [DOI] [PubMed] [Google Scholar]
- Prasad N, Topping RS, Zhou D, Decker SJ (2000) Oxidative stress and vanadate induce tyrosine phosphorylation of phosphoinositide-dependent kinase 1 (PDK1). Biochemistry 39:6929–6935. 10.1021/bi000387i [DOI] [PubMed] [Google Scholar]
- Prigione A, Rohwer N, Hoffmann S, Mlody B, Drews K, Bukowiecki R, Blümlein K, Wanker EE, Ralser M, Cramer T, Adjaye J (2014) HIF1α modulates cell fate reprogramming through early glycolytic shift and upregulation of PDK1–3 and PKM2. Stem Cells 32:364–376. 10.1002/stem.1552 [DOI] [PMC free article] [PubMed] [Google Scholar]
- Rardin MJ, Wiley SE, Naviaux RK, Murphy AN, Dixon JE (2009) Monitoring phosphorylation of the pyruvate dehydrogenase complex. Anal Biochem 389:157–164. 10.1016/j.ab.2009.03.040 [DOI] [PMC free article] [PubMed] [Google Scholar]
- Ribeiro M, Rosenstock TR, Cunha-Oliveira T, Ferreira IL, Oliveira CR, Rego AC (2012) Glutathione redox cycle dysregulation in Huntington's disease knock-in striatal cells. Free Radic Biol Med 53:1857–1867. 10.1016/j.freeradbiomed.2012.09.004 [DOI] [PubMed] [Google Scholar]
- Ribeiro M, Silva AC, Rodrigues J, Naia L, Rego AC (2013) Oxidizing effects of exogenous stressors in Huntington's disease knock-in striatal cells-protective effect oflcystamine and creatine. Toxicol Sci 136:487–499. 10.1093/toxsci/kft199 [DOI] [PubMed] [Google Scholar]
- Ribeiro M, Rosenstock TR, Oliveira AM, Oliveira CR, Rego AC (2014) Insulin and IGF-1 improve mitochondrial function in a PI-3K/Akt-dependent manner and reduce mitochondrial generation of reactive oxygen species in Huntington's disease knock-in striatal cells. Free Radic Biol Med 74:129–144. 10.1016/j.freeradbiomed.2014.06.023 [DOI] [PubMed] [Google Scholar]
- Sadoul K, Boyault C, Pabion M, Khochbin S (2008) Regulation of protein turnover by acetyltransferases and deacetylases. Biochimie 90:306–312. 10.1016/j.biochi.2007.06.009 [DOI] [PubMed] [Google Scholar]
- Salceda S, Caro J (1997) Hypoxia-inducible factor 1?? (HIF-1??) protein is rapidly degraded by the ubiquitin-proteasome system under normoxic conditions. Its stabilization by hypoxia depends on redox-induced changes. J Biol Chem 272:22642–22647. 10.1074/jbc.272.36.22642 [DOI] [PubMed] [Google Scholar]
- Samikkannu T, Chen CH, Yih LH, Wang AS, Lin SY, Chen TC, Jan KY (2003) Reactive oxygen species are involved in arsenic trioxide inhibition of pyruvate dehydrogenase activity. Chem Res Toxicol 16:409–414. 10.1021/tx025615j [DOI] [PubMed] [Google Scholar]
- Schatz G. (1995) Mitochondria: beyond oxidative phosphorylation. Biochim Biophys Acta 1271:123–126. [DOI] [PubMed] [Google Scholar]
- Schölz C, Weinert BT, Wagner SA, Beli P, Miyake Y, Qi J, Jensen LJ, Streicher W, McCarthy AR, Westwood NJ, Lain S, Cox J, Matthias P, Mann M, Bradner JE, Choudhary C (2015) Acetylation site specificities of lysine deacetylase inhibitors in human cells. Nat Biotechnol 33:415–423. 10.1038/nbt.3130 [DOI] [PubMed] [Google Scholar]
- Silva AC, Almeida S, Laço M, Duarte AI, Domingues J, Oliveira CR, Januário C, Rego AC (2013) Mitochondrial respiratory chain complex activity and bioenergetic alterations in human platelets derived from pre-symptomatic and symptomatic Huntington's disease carriers. Mitochondrion 13:801–809. 10.1016/j.mito.2013.05.006 [DOI] [PubMed] [Google Scholar]
- Slow EJ, van Raamsdonk J, Rogers D, Coleman SH, Graham RK, Deng Y, Oh R, Bissada N, Hossain SM, Yang YZ, Li XJ, Simpson EM, Gutekunst CA, Leavitt BR, Hayden MR (2003) Selective striatal neuronal loss in a YAC128 mouse model of Huntington disease. Hum Mol Genet 12:1555–1567. 10.1093/hmg/ddg169 [DOI] [PubMed] [Google Scholar]
- Sorbi S, Bird ED, Blass JP (1983) Decreased pyruvate dehydrogenase complex activity in Huntington and Alzheimer brain. Ann Neurol 13:72–78. 10.1002/ana.410130116 [DOI] [PubMed] [Google Scholar]
- Sorolla MA, Rodríguez-Colman MJ, Tamarit J, Ortega Z, Lucas JJ, Ferrer I, Ros J, Cabiscol E (2010) Protein oxidation in Huntington disease affects energy production and vitamin B6 metabolism. Free Radic Biol Med 49:612–621. 10.1016/j.freeradbiomed.2010.05.016 [DOI] [PubMed] [Google Scholar]
- Struhl K. (1998) Histone acetylation and transcriptional regulatory mechanisms. Genes Dev 12:599–606. 10.1101/gad.12.5.599 [DOI] [PubMed] [Google Scholar]
- Sugars KL, Rubinsztein DC (2003) Transcriptional abnormalities in Huntington disease. Trends Genet 19:233–238. 10.1016/S0168-9525(03)00074-X [DOI] [PubMed] [Google Scholar]
- Sugden MC, Holness MJ (2006) Mechanisms underlying regulation of the expression and activities of the mammalian pyruvate dehydrogenase kinases. Arch Physiol Biochem 112:139–149. 10.1080/13813450600935263 [DOI] [PubMed] [Google Scholar]
- Tabatabaie T, Potts JD, Floyd RA (1996) Reactive oxygen species-mediated inactivation of pyruvate dehydrogenase. Arch Biochem Biophys 336:290–296. 10.1006/abbi.1996.0560 [DOI] [PubMed] [Google Scholar]
- Thomas EA, Coppola G, Desplats PA, Tang B, Soragni E, Burnett R, Gao F, Fitzgerald KM, Borok JF, Herman D, Geschwind DH, Gottesfeld JM (2008) The HDAC inhibitor 4b ameliorates the disease phenotype and transcriptional abnormalities in Huntington's disease transgenic mice. Proc Natl Acad Sci U S A 105:15564–15569. 10.1073/pnas.0804249105 [DOI] [PMC free article] [PubMed] [Google Scholar]
- Trettel F, Rigamonti D, Hilditch-Maguire P, Wheeler VC, Sharp AH, Persichetti F, Cattaneo E, MacDonald ME (2000) Dominant phenotypes produced by the HD mutation in STHdh(Q111) striatal cells. Hum Mol Genet 9:2799–2809. 10.1093/hmg/9.19.2799 [DOI] [PubMed] [Google Scholar]
- Valenza M, Carroll JB, Leoni V, Bertram LN, Björkhem I, Singaraja RR, Di Donato S, Lutjohann D, Hayden MR, Cattaneo E (2007) Cholesterol biosynthesis pathway is disturbed in YAC128 mice and is modulated by huntingtin mutation. Hum Mol Genet 16:2187–2198. 10.1093/hmg/ddm170 [DOI] [PubMed] [Google Scholar]
- Van Raamsdonk JM, Pearson J, Slow EJ, Hossain SM, Leavitt BR, Hayden MR (2005) Cognitive dysfunction precedes neuropathology and motor abnormalities in the YAC128 mouse model of Huntington's disease. J Neurosci 25:4169–4180. 10.1523/JNEUROSCI.0590-05.2005 [DOI] [PMC free article] [PubMed] [Google Scholar]
- Van Raamsdonk JM, Gibson WT, Pearson J, Murphy Z, Lu G, Leavitt BR, Hayden MR (2006) Body weight is modulated by levels of full-length huntingtin. Hum Mol Genet 15:1513–1523. 10.1093/hmg/ddl072 [DOI] [PubMed] [Google Scholar]
- Vlessis AA, Muller P, Bartos D, Trunkey D (1991) Mechanism of peroxide-induced cellular injury in cultured adult cardiac myocytes. FASEB J 5:2600–2605. [DOI] [PubMed] [Google Scholar]
- Zhai W, Jeong H, Cui L, Krainc D, Tjian R (2005) In vitro analysis of huntingtin-mediated transcriptional repression reveals multiple transcription factor targets. Cell 123:1241–1253. 10.1016/j.cell.2005.10.030 [DOI] [PubMed] [Google Scholar]
- Zhao S, et al. (2010) Regulation of cellular metabolism by protein lysine acetylation. Science 327:1000–1004. 10.1126/science.1179689 [DOI] [PMC free article] [PubMed] [Google Scholar]
- Zhou Q, Lam PY, Han D, Cadenas E (2009) Activation of c-Jun-N-terminal kinase and decline of mitochondrial pyruvate dehydrogenase activity during brain aging. FEBS Lett 583:1132–1140. 10.1016/j.febslet.2009.02.043 [DOI] [PMC free article] [PubMed] [Google Scholar]
- Zuccato C, Valenza M, Cattaneo E (2010) Molecular mechanisms and potential therapeutical targets in Huntington's disease. Physiol Rev 90:905–981. 10.1152/physrev.00041.2009 [DOI] [PubMed] [Google Scholar]