

Abstract
The sensory neocortex is a highly connected associative network that integrates information from multiple senses, even at the level of the primary sensory areas. Although a growing body of empirical evidence supports this view, the neural mechanisms of cross-modal integration in primary sensory areas, such as the primary visual cortex (V1), are still largely unknown. Using two-photon calcium imaging in awake mice, we show that the encoding of audiovisual stimuli in V1 neuronal populations is highly dependent on the features of the stimulus constituents. When the visual and auditory stimulus features were modulated at the same rate (i.e., temporally congruent), neurons responded with either an enhancement or suppression compared with unisensory visual stimuli, and their prevalence was balanced. Temporally incongruent tones or white-noise bursts included in audiovisual stimulus pairs resulted in predominant response suppression across the neuronal population. Visual contrast did not influence multisensory processing when the audiovisual stimulus pairs were congruent; however, when white-noise bursts were used, neurons generally showed response suppression when the visual stimulus contrast was high whereas this effect was absent when the visual contrast was low. Furthermore, a small fraction of V1 neurons, predominantly those located near the lateral border of V1, responded to sound alone. These results show that V1 is involved in the encoding of cross-modal interactions in a more versatile way than previously thought.
SIGNIFICANCE STATEMENT The neural substrate of cross-modal integration is not limited to specialized cortical association areas but extends to primary sensory areas. Using two-photon imaging of large groups of neurons, we show that multisensory modulation of V1 populations is strongly determined by the individual and shared features of cross-modal stimulus constituents, such as contrast, frequency, congruency, and temporal structure. Congruent audiovisual stimulation resulted in a balanced pattern of response enhancement and suppression compared with unisensory visual stimuli, whereas incongruent or dissimilar stimuli at full contrast gave rise to a population dominated by response-suppressing neurons. Our results indicate that V1 dynamically integrates nonvisual sources of information while still attributing most of its resources to coding visual information.
Keywords: audiovisual, decoding, multisensory, neuronal ensembles, population, primary visual cortex
Introduction
The integration of information originating from different sensory sources is one of the hallmark functions of the brain and has been a topic of increasing interest in the past decades (Murray and Wallace, 2011; Pennartz, 2015). Our perceptual systems seem to effortlessly integrate the sensory inputs from different modalities and attribute them to the same event. This process improves our ability to detect (Lippert et al., 2007; Gleiss and Kayser, 2014), discriminate between (Leo et al., 2011), and accurately respond to (Gielen et al., 1983) multisensory stimuli compared with situations in which only unisensory stimuli are available. Perceptual integration of multimodal sensory features is thought to occur across an extensive network of cortical (Ghazanfar and Schroeder, 2006) and subcortical areas (Meredith and Stein, 1983, 1986). Cross-modal interactions have been mainly described on the single-neuron level in the superior colliculus and cortical association areas (Meredith and Stein, 1983; Ghazanfar and Schroeder, 2006; Stein and Stanford, 2008). At the level of the primary sensory neocortices, mechanisms underlying such interactions are largely unknown, especially at the level of neuronal populations as studied with single-cell resolution.
Cross-modal integration of vision and audition takes place, at least partially, in the corresponding primary sensory cortices of these modalities. The primary visual and auditory cortices share prominent direct anatomical connections (Miller and Vogt, 1984; Paperna and Malach, 1991; Falchier et al., 2002; Budinger and Scheich, 2009; Cappe et al., 2009) and receive feedback projections from the same cortical association areas (Laramée et al., 2011; Wang et al., 2012). Neurons in the primary visual cortex (V1) of anesthetized mice were shown to exhibit cross-modal sharpening of their tuning for orientation in conjunction with an enhancement of the response to the preferred orientation of the cell, particularly when a low-contrast visual stimulus was paired with an auditory stimulus (Ibrahim et al., 2016). In contrast, the presentation of a high-amplitude sound stimulus resulted in the hyperpolarization of the membrane potential of V1 neurons (Iurilli et al., 2012). This suggests that, depending on the multimodal configuration of stimulus features, V1 may adopt a different coding scheme.
Another factor influencing the cross-modal modulation of firing rates of cortical neurons is the congruency between stimuli originating from different sensory modalities. Stimuli that share an inherent semantic congruency (e.g., written letters and their pronunciation) result in increased perceptual performance (Laurienti et al., 2004) and an elevated BOLD response in the human superior temporal sulcus compared with incongruent letter–sound combinations (van Atteveldt et al., 2004). Furthermore, in the auditory cortex of nonhuman primates, the presentation of congruent combinations of lip movements and vocalizations of monkeys resulted in an elevated local field potential compared with an incongruent control stimulus (Ghazanfar et al., 2005). However, whether the congruency of low-level audiovisual stimulus features, such as spatial and temporal frequency, is encoded by single neurons in V1 is currently unknown.
In this study, we performed two-photon calcium imaging of large neuronal populations in V1 of awake mice to investigate, with single-cell resolution, how sound influences tuning properties of V1 neurons. Furthermore, we asked how the congruency between visual and auditory stimuli might influence cross-modal processing. We found subsets of V1 neurons that showed either response enhancement or suppression upon presentation of an audiovisual stimulus combination compared with a visual stimulus alone. The congruency in temporal frequency between the visual and auditory stimulus influenced response modulation; V1 neurons preferentially responded to frequency-congruent audiovisual stimuli compared with incongruent or dissimilar stimulus combinations. We conclude that auditory inputs influence V1 coding of visual stimuli by modulating the firing activity of primary sensory neurons depending on the visual stimulus drive and the temporal congruency of composite audiovisual stimuli.
Materials and Methods
Animals
All experiments were performed according to the Dutch national guidelines on the conduct of animal experiments. Male C57BL/6 mice were obtained from Harlan Sprague Dawley or from in-house breeding lines. Mice were socially housed in groups of 2–4 on a reversed 12 h light/dark cycle (lights on: 8:00 P.M.–8:00 A.M.) such that experiments were performed in their active phase. The age of the mice on the day of the experiment ranged between 80 and 216 d.
Surgical procedures
Mice were implanted with a titanium headbar on the skull over the left visual cortex (under 1–2% isoflurane anesthesia) to prepare for recording of neuronal activity in V1 of awake, head-restrained mice using calcium imaging. Before surgery, analgesia was administered via subcutaneous injection of 0.05–0.1 mg/kg buprenorphine. The headbar contained an 8 mm circular window, which was centered 3 mm posterior and 2.5 mm lateral from bregma (Paxinos and Franklin, 2004). The headbar was cemented to the skull using C&B Superbond (Sun Medical). A protective cover of cyanoacrylate glue (Locktite 401, Henkel) was applied on top of the skull, in the circular window, to prevent infections until the craniotomy was made.
To allow subsequent calcium imaging of V1 neurons, the fluorescent protein GCaMP6m was brought to expression via an injection of the viral construct AAV1.Syn.GCaMP6m.WPRE.SV40 (undiluted; Penn Vector Core). First, V1 was located within the circular window in the headbar with intrinsic signal imaging (ISI) through the intact skull (see Intrinsic optical signal imaging). Next, under analgesic and anesthetic conditions (same as described above) the protective cover was removed from the skull and a small drill hole was made through which 200–300 nl of the construct was injected at a depth of 500–700 μm from the cortical surface using a glass pipet attached to a NanoJect II injector (Drummond Scientific). Subsequently, a round craniotomy (3 mm diameter) was made in the circular window of the headbar over V1. The craniotomy was closed with a custom-made, double-layered coverglass to prevent skull regrowth. The diameter of the bottom coverglass was 3 mm, which fitted precisely in the craniotomy. It effectively replaced the lost skull with glass and applied pressure on the brain (Goldey et al., 2014; Montijn et al., 2016). The top coverglass (5 mm diameter) was glued to the skull using Locktite 410 (Henkel).
Intrinsic optical signal imaging
ISI was performed to target the viral injection and calcium imaging recordings using an Imager 3001 setup (Optical Imaging). With this technique, bulk neuronal activity can be visualized using the principle that active brain tissue refracts more light compared with inactive brain tissue. Under light anesthesia (0.5–1% isoflurane), the skull or coverglass was illuminated using 630 nm light and the amount of reflected light was measured by a CCD camera (1000m, Adimec) operating at a 1 Hz sampling rate. V1 neurons were activated by the presentation of a drifting grating stimulus, which sequentially moved in eight orientations and was presented for 8 s (1 s per orientation) with a 17 s interstimulus interval. The location of V1 was determined on-line using VDAQ software (Optical Imaging).
Calcium imaging apparatus
Awake mice were head-fixed and their bodies were positioned in a cylindrical holder to prevent movement confounds. Mice fully accustomed to the fixation device showed minimal body movement, except for occasional grooming. Two-photon imaging was performed using a Leica SP5 resonant laser scanning microscope and a Spectra-Physics Mai Tai high-performance mode-locked Ti:sapphire laser operating at an excitation wavelength of 900–940 nm. Laser power at the objective was between 14 and 21 mW. Fluorescent light was collected by a photo-multiplier tube at a wavelength of 525 nm. Using a 25× Leica objective, an imaging plane of 365 × 365 μm (512 × 512 pixels) was recorded in V1, layer II/III, at a depth of 140–200 μm from the cortical surface. Resonant mirrors allowed high-speed scanning; on-line averaging of every two imaging frames resulted in an effective sampling frequency of 14.4 Hz.
Visual and auditory stimulation
Visual stimuli were presented on a 15 inch thin-film-transistor screen (refresh rate, 60 Hz), which was positioned 16 cm from the right eye of the mouse at a 45° angle from the midline of the head. Auditory stimuli were amplified (TA1630, Sony) and presented by a tweeter (Neo CD 3.0, Audaphon) positioned 22 cm directly in front of the mouse (i.e., on the left side of the screen from the perspective of the mouse). The distance between speaker and center of the screen was 22 cm. Visual, audio, and concurrent audiovisual stimulus presentation lasted 3 s followed by a 5 s interstimulus interval, during which an isoluminant gray screen was presented.
Visual stimuli consisted of square-wave drifting gratings with a temporal frequency of 1 Hz and a spatial frequency of 0.05 cycles/°, which were presented either at full contrast or 25% contrast. To prevent edge effects, the grating was surrounded by a gray cosine-tampered circular window with a diameter of 60 retinal degrees. The starting phase of the visual stimulus was randomized each trial. Orientation tuning was investigated using bidirectional moving gratings. This approach allowed for a more precise sampling of the orientation space because opposite directions were not shown on separate trials. A drawback of this approach is that it makes it impossible to investigate direction tuning. However, we considered that drawback inconsequential because neurons in V1 of mice predominantly show orientation tuning (Niell and Stryker, 2008). The gratings moved bidirectionally in eight possible orientations; for the first 1.5 s the grating moved in one direction, after which it would move in the opposite direction for another 1.5 s. The order of directions was counterbalanced over trials. The auditory stimulus consisted of a 15 kHz tone that was frequency modulated between 14 and 16 kHz with a modulation index of 1 Hz, which was congruent with the temporal frequency of the visual stimulus. Alternatively, we presented a white-noise burst as an auditory stimulus (Ibrahim et al., 2016). The loudness of the auditory stimuli was 88 dB in both cases and the background noise of the scanner was 64 dB as measured with a Phonic PAA3 sound meter (Audio Analyzer) using A-weighting, which is less sensitive to very low-frequency sound, outside of the hearing range of mice.
A recording session consisted of visual-only (V), audiovisual (AV), and auditory-only (A) trials. The visual stimuli in the V and AV conditions were moving grating stimuli of eight different orientations. In the AV condition, this stimulus was complemented with a concurrently presented auditory stimulus. In the A condition, an auditory stimulus was presented while the screen remained isoluminant gray. This amounts to 17 unique stimuli (8 × V, 8 × AV, 1 × A). Stimuli were presented in a pseudorandom pattern: within a block of 17 stimulus presentations, each of the stimuli would be selected once. The order of stimulus presentations, however, was randomized separately for each block.
In the experiment in which the visual stimuli consisted of concentric outward moving circles, the circles were composed of a square-wave grating with a spatial frequency of 0.05 cycles/° and moved outwards with varying temporal frequencies (0.5, 1, 2, and 4 Hz). For example, at 4 Hz, four full cycles of the grating would disappear from the edge in 1 s. The concentric circles were surrounded by a 60° circular window. Auditory stimuli were similar to the first experiment but the modulation index was varied (0.5, 1, 2, or 4 Hz). A recording session included 10 presentations of all possible combinations of visual and auditory temporal frequencies. In addition, a V condition included 10 presentations of visual stimuli of all frequencies without presentation of the tone (in total, 120 stimulus presentations). All trials within one repetition were randomly shuffled.
Data analysis
Calcium imaging data processing.
Imaging frames were corrected for X–Y movement using a single-step discrete Fourier-transform realignment procedure (Guizar-Sicairos et al., 2008). Cell bodies were detected semiautomatically using a custom-written graphical user interface in the Matlab environment. Potential contamination of the soma fluorescence by the surrounding neuropil was accounted for by a neuropil-subtraction procedure. The neuropil signal was computed by taking the mean fluorescence signal from an annulus between 2 and 5 μm around the soma of each neuron, excluding the somas of neighboring neurons. This value was multiplied by 0.7 before it was subtracted from the soma fluorescence to prevent oversubtraction (Chen et al., 2013). The fluorescence response of a neuron was quantified with the ΔF/F0 metric reflecting the relative fluorescence increase (ΔF) over baseline (F0; Eq. 1):
 |
Here Fi is the fluorescence of a neuron on a single frame i and F0 is the baseline fluorescence associated with that imaging frame. To account for slow changes in overall fluorescence, the baseline was defined as the lower 50% of all fluorescence values in a 30 s sliding window preceding frame i (Greenberg et al., 2008; Goltstein et al., 2015; Montijn et al., 2016). The fluorescence response of a neuron in a given trial was defined as the average ΔF/F0 over all imaging frames during the 3 s stimulus period.
Orientation and temporal frequency tuning.
The strength of a neuron's orientation tuning was determined by computing the neuronal d' (Berens et al., 2008) as an orientation selectivity index (OSI). This measure was chosen because it takes into account response variability (Eq. 2):
 |
Here, μpref is the mean fluorescence response of the neuron when presented with its preferred orientation, and μorth is the mean response toward the orientation orthogonal to the preferred orientation. The difference between the mean responses is normalized by the pooled variance. The preferred orientation was determined as the orientation to which the neuron showed the strongest response in either the V or AV condition, depending on which condition showed the strongest response. Neurons showing an OSI >0.4 in either the V condition or the AV condition of Experiment 1 were considered orientation tuned and were included for further analysis. This value was determined by shuffling the trial labels in the V condition 500 times and calculating the OSI for all neurons every iteration. This resulted in a null distribution of OSIs for every neuron and the OSI threshold was defined as the average 99th percentile of all null distributions, which amounted to 0.4. Notably, only including neurons that were orientation selective in the V condition would have led to a bias because it neglects the subset of neurons that were only orientation selective in the AV and not the V condition. The sharpness of the tuning curves of orientation-selective neurons was defined as the inverse of the bandwidth, which reflects the broadness of the peak of the tuning curve at the preferred orientation. The bandwidth was defined as the half-width at of the maximum of a fitted Von Mises distribution to the tuning curve and was computed separately for the V and AV conditions.
In Experiment 2, only neurons tuned to the temporal frequency of the visual stimulus were included in the analysis. A neuron was deemed to be tuned to visual temporal frequency if it showed a differential response toward the four different temporal frequencies (one-way ANOVA, p < 0.01).
Response change index.
The response change index was used for quantifying response differences between stimulus conditions for each neuron. The conventional method for quantifying multisensory cue integration specifically computes enhancement or suppression (Stevenson et al., 2014). The response change index, however, normalizes response changes and can therefore be used to describe both enhancement and suppression (Eq. 3).
 |
Here FAV stands for the fluorescence response, as defined by Equation 1, evoked by the preferred orientation or temporal frequency in the AV condition and FV is the fluorescence response for the preferred orientation or temporal frequency in the V condition. This metric has a range of −1 to 1 in which negative values indicate response suppression and positive values indicate response enhancement relative to the V condition.
Population heterogeneity.
The heterogeneity of the population activity was calculated as previously described by Montijn et al. (2015). In short, the activity of each neuron was z-scored over trials after which the absolute difference in z-scored activity was calculated for each pair of neurons and the heterogeneity was defined as the average of all pairwise differences.
Bayesian decoding.
Stimulus orientation and temporal frequency were classified using a Bayesian maximum-likelihood decoder (Montijn et al., 2014). For each stimulus class (Exp. 1: orientations; Exp. 2: temporal frequencies), a likelihood function was calculated per neuron by computing the Gaussian response distribution over all trials of that class. A leave-one-out cross-validation procedure was used in which the to-be-decoded trial was excluded from the training set when determining the likelihood functions. The posterior probability could be read out for every neuron using the activity of the to-be-decoded trial. The overall resulting posterior probability of the population, P(θ|Apop), was calculated as the product of the probabilities of individual neurons (Eq. 4):
 |
Here, A is the ΔF/F0 response of each neuron i for the eight different orientations θ. The stimulus class showing the highest resulting posterior probability was taken as the stimulus class most likely presented in the to-be-decoded trial.
Jackknifing procedure for Bayesian decoding.
The contribution of a single neuron toward the decoding performance was determined with a jackknifing procedure. First, a random sample of 14 neurons was picked from the population and Bayesian decoding was performed. Subsequently, a single neuron was excluded from the sample and the decoding was repeated. If the neuron contributed to the decoding process, this would lead to a decrease in decoding performance. The difference in decoding performance between the case in which the neuron was included and the case in which it was excluded is represented in the decoding contribution measure Di (Eq. 5):
 |
Here N is the sample size of the random neuron selection (n = 14), D is the decoding performance using the entire sample and D−i is the decoding performance without neuron i. One thousand iterations were performed and the decoding contribution was determined for each neuron. Sample sizes of 8–20 neurons yielded similar results.
Whether a neuron showed a larger contribution in either the AV or V condition was determined by subtracting the Di for the AV condition from the Di obtained in the V condition.
Tone-responsive neurons.
The response of a single neuron in the A condition was calculated by taking the average response over the 10 repetitions of the tone presentation. Statistical significance of the responses was determined by shuffling the time points of the ΔF/F0 trace of each neuron and computing the average tone response. The shuffling procedure was repeated for 500 iterations, resulting in a bootstrap distribution of fluorescence responses. Statistical significance was determined at the 1% significance level; e.g., to be considered statistically significant the response of the neuron should be within the 99th percentile of the bootstrapped distribution. Furthermore, only average tone-evoked fluorescence responses >0.2 ΔF/F0 were included.
Eye tracking.
Whether the presentation of auditory stimuli was accompanied with an altered state of arousal was tested using the pupil size as a proxy for arousal (Aston-Jones and Cohen, 2005). Eye tracking was performed in five of nine mice. The pupil size and its X–Y displacement were estimated by monitoring the left (nonexposed) eye using a near-infrared CCD camera (CV-A50 IR, JAI) equipped with a high-magnification lens (MVL50M23, Navitar) at a sampling rate of 25 Hz. No infrared illumination of the eye was required because enough ambient infrared light from the two-photon scanner was present. Eye tracking was analyzed off-line using a custom-written algorithm (Zoccolan et al., 2010). For each frame, a fast radial symmetry transform was performed to locate the pupil center, from which a set of 16 rays was projected outwards in a starburst fashion. The edge of the pupil was located by transforming the frame using a Sobel operator. For each ray, the pupil boundary was determined as the maximum intensity of the Sobel-transformed image. From the set of detected pupil boundary points, outliers were rejected at 2 SD from the mean and an ellipse was fitted through all remaining points. The pupil size was determined as the surface of the fitted ellipse. The pupil size was z-scored per animal to obtain relative changes in size and, subsequently, a baseline subtraction was performed per trial by subtracting the mean size in a 2 s window preceding stimulus onset from the stimulus period.
Results
Influence of auditory input on orientation tuning
Pyramidal neurons in layer II/III of the mouse V1 are tuned to oriented bars or gratings (Ohki et al., 2005; Niell and Stryker, 2008). We investigated whether this tuning property was influenced by input from the auditory modality by recording neural populations in V1 using calcium imaging in awake head-fixed mice (Fig. 1). The mice were presented with full-contrast (100%) bidirectional square-wave moving gratings in eight orientations (V condition). Half of the stimulus presentations were accompanied by a 15 kHz tone modulated at the same frequency as the temporal frequency of the visual stimulus (AV condition; Fig. 1). We imaged 1124 neurons from nine mice (one recording session per mouse), of which 346 (30.8%) showed orientation-selective response patterns, as indicated by an OSI of >0.4 in the V and/or the AV condition.
Figure 1.

Two-photon calcium imaging of neuronal activity in layer II/III of V1 of the awake mouse and the activity patterns of orientation-selective neurons. A, Field of view of an example imaging session. Cell bodies of neurons typically consist of a darkened nucleus and green fluorescent cytosol. Blood vessels appear black. Four example neurons are indicated with white arrows and numbers. B, Fluorescence traces of four example neurons. The cell bodies of those neurons are numbered in A. Colored bars behind the traces indicate presentations of bidirectionally moving gratings. The color of the bar indicates the orientation of the grating according to the rose plot on the bottom. Crosses above the colored bars show trials that were combined with an auditory stimulus. C, Tuning curves of orientation-selective firing for the four example neurons computed across all trials that contained visual stimulation. The full scale, as indicated by the gray line, of the fluorescence response is depicted in ΔF/F in the top right corner of each rose plot.
Sound modulated the orientation tuning of a V1 neuron by either suppressing or enhancing the orientation selectivity compared with the V condition (Fig. 2A,B). Some neurons showed orientation-selective responses (OSI > 0.4) in the V condition but showed a markedly reduced selectivity in the AV condition (90 of 346; 26.0%; Fig. 2C). Other neurons were highly selective to audiovisual stimuli but to a lesser degree to visual-only stimuli (94 of 346; 27.2%). Some neurons gained and others reduced their tuning strength, but the mean orientation selectivity was not significantly different when comparing the V and AV conditions on the population level (OSI, mean ± SEM: 0.67 ± 0.05 and 0.68 ± 0.05 respectively, paired Wilcoxon signed-rank test, p = 0.74, n = 346). Additionally, the specificity or sharpness of the tuning for each neuron, defined as the inverse of the bandwidth of the tuning curve for the V and AV conditions, was not significantly different between the two conditions (18.3° ± 0.4° and 18.8° ± 0.5° respectively, paired Wilcoxon signed-rank test, p = 0.34, n = 346). Thus, individual V1 neurons showed an increase or decrease in orientation tuning, while the population as a whole did not change its orientation selectivity when an auditory component was added to visual stimulation.
Figure 2.

Multimodal stimulation results in subsets of neurons exhibiting response enhancement and suppression. A, Full-contrast visual square-wave gratings of eight orientations were presented alone (V) or together with a tone that was modulated at the same temporal frequency as the visual stimulus (AV). B, Tuning curves of six example neurons for both the V (purple) and the AV (cyan) condition. The response change index is shown next to the tuning curves as a bold number. C, Percentages of tuned neurons. D, Histogram of the change in response to the preferred orientation between the V and AV condition for each neuron. A positive response change index corresponds to a response enhancement by adding sound, whereas a negative response change indicates response suppression. The inset shows that the distribution of response changes between the V and AV conditions is broader than expected by chance, indicating that the number of neurons that showed a large positive or negative response change is larger than expected. The black curve indicates the histogram of the widths of response change distributions originating from shuffled datasets in which tone presence was shuffled. The dotted gray line indicates the 95th percentile of the shuffled distribution and the green line indicates the width of the experimentally observed response change distribution. E, The amount of response-enhancing (green) and response-suppressing (red) neurons was balanced in the population as shown by plotting the response change index of all neurons sorted from negative to positive (dotted line is midpoint of population). F, Orientation classification on the basis of random subsamples of neurons (bootstrapped 500 times) using a Bayesian decoding classifier reveals that the addition of a tone does not significantly change the amount of information regarding orientation in the population. Decoding performance is normalized to the performance at the largest sample size (80) of the V condition. Inset shows non-normalized decoding performance using the population of tuned neurons (gray lines indicate individual mice). G, Greedy decoding classification of orientation using samples of progressively decreasing decoding contribution. Left, Decoding performance was significantly better when using the ensemble of neurons that coded for the V condition (purple line), as indicated by a high decoding contribution in the V condition, compared with the ensemble that specialized in encoding audiovisual stimuli (cyan line). Right, Decoding performance in the AV condition was significantly better using the highly contributing neurons from the AV condition compared with the high contributors as determined in the V condition (dashed gray line indicates chance level, significant differences indicated by gray line above plot, paired t test, p < 0.05). H, Neurons showing a response suppression to audiovisual compared with visual-only stimuli contributed significantly more information to the V condition, whereas neurons that showed a response enhancement contributed significantly stronger to the AV condition (Kruskal–Wallis with post hoc Tukey–Kramer; dotted gray line represents chance level, significant differences indicated by solid gray line above plot; **p < 0.01). I, Pupil size, a proxy for arousal, was not significantly different between the two conditions (Wilcoxon matched-pairs signed-ranks test). Stimulus onset was centered at 0 s and lasted for 3 s as indicated by the gray box (all error bars represent SEM).
To determine the strength of the sound modulation on individual V1 neurons, we calculated a “response change index,” in which positive values indicate response enhancement and negative values indicate suppression. Across all neurons, the mean response change index was not significantly different from 0 (t test vs 0, p = 0.4, n = 346; Fig. 2D). However, the distribution of response change indices was broad, showing subsets of individual neurons at its flanks that exhibited a strong response enhancement or suppression. To assess whether more neurons than expected by chance showed a large response change, we tested the distribution width of response changes against chance level with a shuffling procedure. For each orientation, the presence or absence of a tone was randomly shuffled over stimulus presentations. The response change distribution was computed over 500 iterations of the shuffled dataset and its width was estimated by taking the SD. The SD of the original response change distribution was within the 99th percentile of the shuffled distribution of SDs. Thus, the distribution of response changes was significantly broader than expected by chance (Fig. 2D, inset). This result indicates that cross-modal stimulation modulates selective subpopulations of V1 neurons, showing a strong response suppression or enhancement while the prevalence of enhancing and suppressing neurons was balanced in the population (Fig. 2E). We found qualitatively similar results when the response variability across neurons was included in the response change index.
We additionally asked whether the auditory-induced response change of V1 neurons was dependent on the efficacy of the visual stimulus in driving the neuron to fire (Kayser et al., 2010). Indeed, we found that neurons that responded weakly to a visual stimulus showed a significant mean response enhancement when an audiovisual stimulus was presented, whereas neurons that responded strongly in the V condition showed a significant mean response suppression in the AV condition (results not shown). Considering that this computation is based on two relative, dependent measures (neural response magnitude related to visual-only stimuli and response change index), it is subject to a regression-to-the-mean effect, which may lead to a spurious correlation of the two variables (Holmes, 2009). The correlation that we found between firing rate to visual-only stimuli and the audiovisual response change index appeared not to be larger than the results found after shuffling procedures in which per orientation the V and AV trial labels were shuffled or when two halves of the visual dataset were compared against each other. Based on these results, we cannot draw conclusions on the relation between the efficacy of a stimulus driving a neuron and the cross-modal effect on response magnitude.
Neurons increasing and decreasing their activity may indicate that neural activity converges to the mean. This would result in all neurons showing more similar levels of activity, thereby reducing the dynamic range of the population response. We used the population heterogeneity (Montijn et al., 2015), which is a measure of pairwise differences between the normalized activity of neurons within the population, as a metric for converging or diverging neuronal responses. A high heterogeneity indicates that there are large intrapopulation differences of activity, whereas a low heterogeneity is, on average, indicative of small differences in activity between neurons. The addition of a tone to the visual stimulus leading to converging neural activity would be reflected in lower population heterogeneity. There was no significant difference, however, between the heterogeneity in the V and AV conditions (0.88 ± 0.019 and 0.85 ± 0.031 respectively, paired t test, p = 0.61, n = 9). We conclude that the observed auditory modulation of responses to visual stimuli does not lead to a conversion of response strength but that the dynamic response range of the population is maintained. A possible explanation is that response-enhancing neurons do not increase their response until they reach the average response of the population but increase their response to reach the upper dynamic range of the population response, while response-suppressing neurons decrease their response to the lower dynamic range.
Subsets of neurons encode either visual-only or audiovisual stimuli
A substantial number of neurons showed a response modulation when a tone was presented concurrent with a visual stimulus, suggesting that the population of V1 neurons can encode the presence of a tone. Whether this cross-modal response modulation results in a better encoding of the visual stimulus at the population level was tested using a Bayesian decoding algorithm for classification of orientation. Stimulus orientation was decoded in either the V or AV condition using subsets of randomly selected neurons of different sample sizes (5–80 neurons) taken from the entire recorded neuronal population. Orientation classification was bootstrapped 500 times per sample size with a different set of neurons on every iteration. The performance was normalized to the largest sample size of the V condition to account for interanimal differences in decoding performance (Fig. 2F). The decoding performance in the V condition was not significantly different from that in the AV condition for all tested sample sizes (paired Wilcoxon signed-rank test, p > 0.49 for all 16 tested sample sizes, n = 9; Fig. 2F). Likewise, including all tuned neurons to decode orientation yielded similar results between conditions (paired t test, p = 0.20; Fig. 2F, inset). Thus, the neuronal population as a whole does not encode the visual stimulus with more fidelity when a tone is presented.
We next asked whether the general population contains distinct subsets of neurons encoding either visual-only or audiovisual stimuli. We computed the contribution of each neuron to the decoding performance and used a “greedy” decoding procedure for this purpose. Greedy decoding was performed with the Bayesian classifier described above but it used subsets of neurons with progressively decreasing decoding contribution instead of taking random subsets of neurons. Decoding performance of the greedy decoder quickly saturated, after which adding more neurons did not improve coding efficiency, indicating that only ∼10 neurons with the highest decoding fidelity are necessary to accurately encode orientation (Fig. 2G). The orientation decoding of visual-only stimuli was significantly more accurate when using high contributors from the V condition (73.6 ± 5.4%; sample size, 40) compared with the high contributors from the AV condition (58.4 ± 7.2%; paired t test, p < 0.05, n = 9; Fig. 2G, gray line). The opposite pattern was found for decoding orientation of audiovisual stimuli. These results indicate that there are subsets of neurons in V1 that are selective for encoding either visual-only or audiovisual stimuli.
Neurons that show a cross-modal enhancement respond more strongly in the AV condition compared with the V condition, but do they also contribute more information about the orientation of the stimulus during audiovisual stimuli? This is not necessarily the case since the contribution of information of a single neuron to the population code is not only dependent on response strength but also on other factors, such as response reliability and correlated variability. We investigated this by computing the difference between the contribution to visual-only and audiovisual decoding for each neuron. The difference in decoding contribution is negative when a neuron's decoding contribution is larger in the V condition and positive when it is larger in the AV condition. Response-enhancing neurons contributed more information regarding orientation in the AV condition, whereas response-suppressing neurons contributed more information in the V condition (Kruskal–Wallis with post hoc Tukey–Kramer, p = 0.002, n = 9; Fig. 2H). Together, our results demonstrate that functionally distinct, but partially overlapping, ensembles of neurons code orientation information of composite audiovisual and visual stimuli, respectively.
Cross-modal stimuli may be perceived as more salient than unisensory stimuli, which might increase the level of arousal the mouse is experiencing. Arousal has been shown to affect the performance of mice in behavioral tasks and the membrane potential response of sensory neurons to visual stimuli according to an inverted U-shaped curve (McGinley et al., 2015). We tested whether the modulatory effects of sound on visual processing were influenced by differences in the state of arousal by comparing pupil size, as a proxy for arousal (Aston-Jones and Cohen, 2005), between audiovisual and visual-only stimulus presentations. No significant difference in mean pupil size was observed between the V and AV stimulus conditions (Wilcoxon matched-pairs signed-ranks test for all time points during stimulus presentation, all p's > 0.063, n = 5; Fig. 2I).
A potential caveat is that C57BL/6 mice may experience an age-related hearing loss, which could interfere with auditory modulation of visual stimuli (Zheng et al., 1999). Indeed, we found that the response change index correlated negatively with the age of the mice at the day of experiment (Pearson correlation, r = −0.78, p = 0.012; n = 9). Including only the data acquired of the three oldest mice (mean age: 208 ± 8 d) in our analysis yielded similar results pertaining to multisensory response enhancement and suppression compared with the younger mice, rendering unlikely that our results stem from age-related hearing loss.
Multisensory interactions resulting from low-contrast visual stimuli
Thus far, we found no net multisensory enhancement or suppression across the population of V1 neurons, which may be due to using full-contrast visual stimuli. We hypothesized that a weaker visual stimulus may on average give rise to cross-modal response enhancement because weak stimuli drive firing activity of all V1 neurons to a lesser degree compared with full-contrast visual stimuli. We tested this hypothesis in an experiment by presenting the visual stimulus at a relatively low contrast (25%; Fig. 3A) concurrently with the frequency-modulated tone [n = 4 mice, n = 547 neurons, n = 95 tuned neurons (17.4%)]. Contrary to our expectations, bimodal stimulation including low-contrast visual stimuli did not result in overall cross-modal response enhancement, but instead neurons behaved similarly to the full-contrast condition: neurons exhibited both response enhancement and suppression in approximately equal numbers (Fig. 3B,C). Likewise, the overall orientation selectivity and sharpness of tuning were not significantly different between V and AV conditions (OSI, mean ± SEM: 0.74 ± 0.09 and 0.70 ± 0.08 respectively, paired Wilcoxon signed-rank test, p = 0.19; Bandwidth: V 16.2° ± 0.8°, AV 17.0° ± 0.8°, paired Wilcoxon signed-rank test, p = 0.29, n = 95). The distribution of response changes, however, indicated the existence of response-enhancing and response-suppressing subsets of neurons in the population. Indeed, when testing the width of the response-change distribution against a shuffled dataset, the response-change distribution was broader than expected by chance (>95th percentile; Fig. 3D). When directly testing the response change indices between the 100 and 25% visual-contrast conditions, no significant difference was observed for any orientation (Wilcoxon rank-sum test with Bonferroni correction for all eight orientations, all p's > 0.05/8; Fig. 3E). These data indicate that the difference between low and high visual contrast, combined with a frequency-modulated tone, does not result in different response enhancement and suppression effects.
Figure 3.
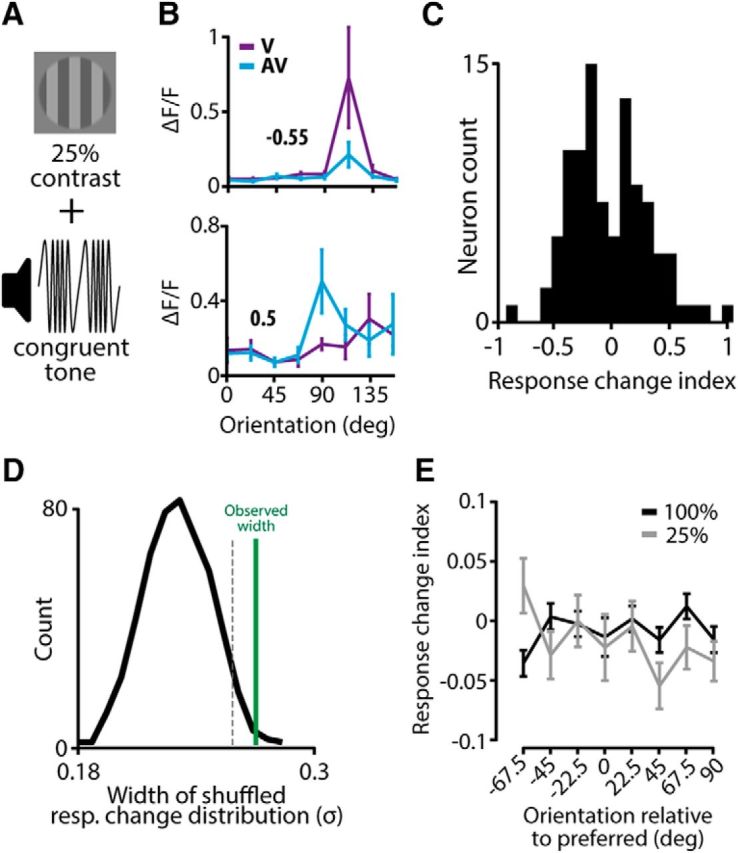
Balanced multisensory activation patterns for low-contrast visual stimuli. A, The visual stimulus was presented at a relatively low contrast (25%) and was combined with a frequency-modulated tone. B, Example tuning curves of two neurons showing either response suppression (top) or response enhancement (bottom). C, Histogram of the change in response to the preferred orientation between the V and AV conditions for each neuron. D, The distribution of response changes between the V and AV conditions is broader than expected by chance. Plotting conventions as in Figure 2E. E, The average response change was not significantly different between the full contrast (100%; black line; Fig. 2) and the low contrast (25%; gray line) for any of the eight orientations (t test with Bonferroni correction). Orientations were related to the preferred orientation of each neuron such that an orientation of 0 corresponded to the preferred orientation of that neuron. All error bars represent SEM.
Auditory stimulus features determine cross-modal V1 modulation
The results described above are not directly in line with a recent report showing exclusive response enhancement using bimodal stimuli with a low-contrast visual component (Ibrahim et al., 2016), or with the principle of inverse effectiveness. The discrepancy between our results and the literature may be explained by the fact that our auditory stimulus was always a modulated tone, the frequency of which was similar to the speed of movement of the visual gratings, whereas others often used white noise (Iurilli et al., 2012; Ibrahim et al., 2016). We tested the effect of auditory stimulus features on the neuronal correlates of multisensory integration in two additional experiments by presenting white-noise bursts (as in Ibrahim et al., 2016), together with a full-contrast [n = 4 mice, n = 545 neurons, 125 tuned neurons (22.9%)] or a low-contrast visual stimulus [n = 6 mice, n = 830 neurons, 142 tuned neurons (17.1%)]. Paired with full-contrast visual stimuli (Fig. 4A), white-noise bursts predominantly resulted in neurons exhibiting cross-modal response suppression (Fig. 4B,C). There was a small but significant overall reduction in orientation selectivity in the AV condition compared with the V condition (0.81 ± 0.09 and 0.86 ± 0.08 respectively, paired Wilcoxon signed-rank test, p = 0.0038, n = 125). Although some response-enhancing neurons were present in the population, overall there was a significant reduction in activity when white-noise bursts were presented together with a full-contrast visual stimulus (paired Wilcoxon signed-rank test, p < 10−6, n = 125; Fig. 4D). Moreover, the population response per mouse was significantly reduced (paired t test, p = 0.028, n = 4; Fig. 4D, inset). Furthermore, the tuning curves in the AV condition were on average broader compared with the situation in which no tone was presented, as reflected in an increase in bandwidth (paired Wilcoxon signed-rank test, p = 0.04; Fig. 4E).
Figure 4.

Auditory stimulus features impact on cross-modal modulation. A, A full-contrast visual stimulus was presented alone (V) or combined with white-noise bursts (AV). B, Tuning curves of two example neurons for these stimulus conditions. C, Histogram of sorted response change indices of all neurons shows that there were more response-suppressing neurons compared with response-enhancing neurons when presenting 100% contrast visual stimuli with white-noise bursts (dotted line is midpoint of population). D, Across the entire tuned population, neurons showed a weaker response during visual-only compared with audiovisual stimulation (paired Wilcoxon signed-rank test). Inset shows a significant reduction of the population response per mouse (gray lines) in the AV compared with V condition (paired t test). E, Audiovisual stimulation resulted in a broadening of the tuning curves, as indicated by a significant increase in bandwidth during audiovisual compared with visual-only stimulation. F, The visual component was presented at a low contrast (25%) together with a white-noise auditory stimulus. G, Two example tuning curves for these stimulus conditions. H, Low-contrast visual stimuli paired with noise bursts resulted in a balanced prevalence of response-enhancing and response-suppressing neurons in the population. I, Neurons showed a sharpening of their tuning curves when a low-contrast visual stimulus was paired with white noise compared with when no auditory stimulus was presented, indicated by a significant decrease in bandwidth in AV versus V conditions (paired Wilcoxon signed-rank test). J, At the preferred orientation, there was a significant difference in response change between the full visual contrast (100%) and the low visual contrast (25%) conditions (t test with Bonferroni correction; *p < 0.05; ***p < 0.001). All error bars represent SEM.
When presenting low-contrast visual stimuli together with white-noise bursts (Fig. 4F), the neuronal population was balanced between response-enhancing and response-suppressing neurons (Fig. 4G,H). Contrary to Ibrahim et al. (2016), we did not observe an overall increase in orientation selectivity when presenting white-noise bursts together with a low-contrast visual stimulus (V: 0.75 ± 0.08; AV: 0.73 ± 0.06, paired Wilcoxon signed-rank test, p = 0.19, n = 142). However, in line with Ibrahim et al. (2016), there was an overall sharpening of orientation tuning as reflected in a significant decrease in bandwidth over the tuned population (paired Wilcoxon signed-rank test, p < 10−3, n = 142; Fig. 4I). Combining low-contrast visual stimuli with white-noise bursts did not result in significant response enhancement at the preferred orientation (t test vs 0, p = 0.18, n = 142). However, compared with the full visual contrast condition, there was a significant difference in cross-modal response change at the preferred orientation whereby the full visual contrast condition was dominated by response suppression (t test with Bonferroni correction, p < 10−4, n = 142; all other orientations: p > 0.05/8); Fig. 4J). These results demonstrate that the nature of stimulus features has a profound effect on the observed neuronal mechanisms employed to integrate multisensory information.
Neurons in V1 respond to tones
A fraction of orientation-selective neurons in V1 showed a significant fluorescence response to presentations of the tone without concurrent visual stimulation [28 of 289 tuned neurons (9.7%); Fig. 5A]. Neurons showing a response in the tone-only condition did not show a bias toward response enhancement or suppression in the cross-modal condition but their response modulations were distributed evenly across the population of visually tuned neurons (Fig. 5B). Previous research in rats suggests that cross-modal interactions occur mostly at the interface of primary sensory areas (Wallace et al., 2004). We therefore expected to find a higher incidence of tone-responding neurons on the lateral side of V1, which is near the auditory cortex. We assessed whether there was a location bias for auditory-responding neurons by overlaying the two-photon imaging plane with the cortical map obtained through intrinsic optical signal imaging for each mouse (n = 6). Recording sessions on the lateral side of V1 contained more tone-responsive neurons than on the medial side (Fig. 5C). We found a significant negative correlation between the percentage of tone-responsive neurons in each imaging plane and its distance to the lateral border of V1 (Pearson's correlation, p = 0.04; Fig. 5D). In addition to being proximal to the auditory cortex, the lateral side of V1 represents the binocular zone or the medial visual field. Therefore another, more speculative, explanation for the higher incidence of tone-responsive neurons on the lateral side of V1 could be that the speaker was positioned in front of the animal, resulting in a configuration where the sound originated from the part of the visual field represented by the lateral side of V1.
Figure 5.

Neurons in V1 respond to auditory stimulation. A, Two example neurons showing a significant response when the mouse was presented with an auditory stimulus only (solid cyan line represents mean response, shaded area represents SEM). The light gray area indicates the time of stimulus presentation (t = 0 tone onset). B, Scatterplot of the response change index and change in orientation selectivity of all tuned neurons. Tone-responsive neurons are plotted in green (9.7% of the tuned population). Tone-responsive neurons did not selectively show either response enhancement or suppression in the AV condition, but were distributed evenly among the visually tuned population. C, Recording sessions on the lateral side of V1 contained more tone-responsive neurons than sessions on the medial side. Squares show imaging sites overlaid with the average intrinsic optical signal imaging map, color of the square shows the percentage of tone-responding neurons. D, Significant correlation between the distance of the center of the imaging plane to the lateral border of V1 and the percentage of tone-responsive neurons in that imaging plane (Pearson's correlation, p = 0.04).
V1 is sensitive to congruency of audiovisual stimuli
Concurrently occurring sensory stimuli in our surrounding environment often share an inherent temporal regularity or rhythmicity, e.g., the speed of self-motion generally influences both the speed of optic flow and the rate at which changes in the auditory domain will occur. We investigated whether V1 encodes frequency congruency between visual and auditory stimuli by presenting mice with concentric outward-moving circles and a concurrent frequency-modulated tone (Fig. 6A). Visual and auditory stimuli were presented at four temporal frequencies (0.5, 1, 2, and 4 Hz), resulting in 16 frequency combinations, of which some combinations were congruent (e.g., visual and audio stimuli, both 0.5 Hz) and others incongruent (e.g., visual stimulus, 0.5 Hz; auditory stimulus, 4 Hz). Additionally, a V condition contained visual stimuli in four temporal frequencies without concurrent tone presentation. Calcium imaging was performed in layer II/III of V1 of five mice (three of five were also used in the previous paradigm). A total of 584 neurons were imaged, of which 178 (30.5%) showed significant tuning to visual and/or audiovisual temporal frequency (ANOVA V and AV condition, p < 0.01) and were included for further analysis. The results were similar when only including neurons significantly tuned in the V condition or only including audiovisually tuned neurons. Most neurons were tuned to slowly moving concentric circles, which is consistent with previous literature (Marshel et al., 2011; Durand et al., 2016).
Figure 6.
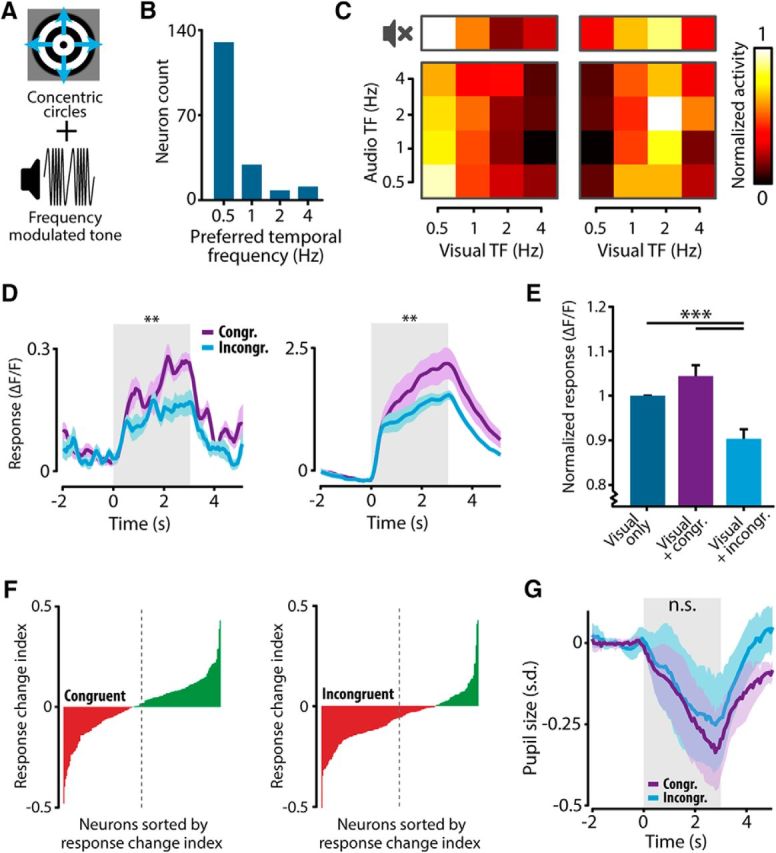
Neurons in V1 are sensitive to the congruency between visual and auditory stimuli. A, Mice were presented with concentric outward-moving circles together with a frequency-modulated tone. The temporal frequency (TF) of the visual stimulus and the modulation rate of the frequency-modulated tone could vary (0.5, 1, 2, and 4 Hz). Besides the AV condition, a V condition was also presented. B, Histogram indicating the incidence of each preferred TF in the V condition. Most neurons were tuned to slow-moving (0.5 Hz) concentric circles. C, The responses of two example neurons for all frequencies in the V (top row; no-sound symbol) and AV conditions (bottom matrix). The average fluorescence response for each combination of visual and auditory TF was normalized to the strongest response recorded and color coded in a response matrix. D, The fluorescence response to the preferred visual TF combined with a congruent (purple) or incongruent (cyan) auditory TF (same example neurons as in C). Both neurons show a stronger fluorescence response for the congruent stimulus combination (left: 0.5 Hz visual with 0.5 Hz audio; right: 2 Hz visual with 2 Hz audio) compared with the incongruent combination (left: 0.5 Hz visual with 4 Hz audio; right: 2 Hz visual with 0.5 Hz audio). E, The fluorescence response was normalized to the V condition. Neurons showed a significant response suppression when presented with an incongruent audiovisual stimulus (Kruskal–Wallis with post hoc Tukey–Kramer). F, Sorted histograms of response change indices for congruent and incongruent AV combinations show that during congruent stimuli, response-enhancing and response-suppressing neurons are proportionally present in the population, whereas during incongruent AV stimulation this balance shifts to predominantly response-suppressing neurons (dotted line indicates midpoint of the population). G, Pupil size was not significantly different during congruent and incongruent audiovisual stimulation (Wilcoxon matched-pairs signed-ranks test; **p < 0.01; ***p < 0.001). All error bars represent SEM.
The mean fluorescence response for each stimulus combination was normalized to the maximal response across all stimulus combinations recorded for that neuron and color-coded in a response matrix. The response matrices of example neurons in Figure 6C show that the tuning preference to the temporal frequencies in the V condition was preserved when a tone was concurrently presented. To investigate differences between responses to congruent and incongruent stimuli, the congruent audiovisual pairs were defined as the four combinations in which the temporal frequency of visual and auditory stimuli was the same (bottom left to top right diagonal in the response matrix; Fig. 6C), and incongruent compound stimuli were defined as four stimuli in which the temporal frequency differed (the four antidiagonal elements in the response matrix). The responses of both neurons shown in Figure 6C were stronger when their preferred visual stimulus was paired with a congruent auditory stimulus (Fig. 6D, purple line) compared with when the same visual stimulus was combined with an incongruent tone (Fig. 6D, cyan line). The response to the congruent stimulus combination was significantly stronger across the population of visually tuned neurons (paired Wilcoxon signed-rank test, p < 10−11, n = 178). We next normalized the responses of all neurons to the response in the V condition. Combining the visual stimulus with an incongruent auditory cue resulted in a significant response suppression compared with the V condition, whereas there was no significant difference between the responses to congruent audiovisual and visual-only stimuli (Fig. 6E; Kruskal–Wallis with post hoc Tukey–Kramer, p < 10−12, n = 178). The absence of a significant difference between visual-only and congruent audiovisual stimulation suggests that, like the results from Figure 2, different subsets of neurons show response enhancement and suppression. When plotting the response change index for all neurons in the population, it can be observed that the amount of response-enhancing and response-suppressing neurons is balanced when congruent audiovisual combinations were presented (t test vs 0, p = 0.77, n = 178). During incongruent audiovisual stimulation, the balance shifted to a regime in which predominantly response-suppressing neurons were present in the population (t test vs 0, p < 10−9, n = 178; Fig. 6F). These results indicate that congruency between cross-modal stimulus features is encoded at the level of V1.
In addition to finding no significant difference in pupil size between bimodal versus unisensory stimulation (Fig. 2I), we also found no significant difference in mean pupil size between trials, including congruent audiovisual stimulus pairs compared with trials of incongruent pairs (Wilcoxon matched-pairs signed-ranks test for all time points during stimulus presentation, all p's > 0.13, n = 5; Fig. 6G). These results indicate that stimulus-driven fluctuations in arousal state are not likely to account for the observed differences in response patterns between audiovisual stimulus pairs. Besides the lack of pupil size differences, there are additional indications in our data that strengthen this conclusion. First, the multisensory modulation of neuronal responses was bidirectional; i.e., neurons enhanced and suppressed their response, whereas the effect of global arousal on neuronal responses is expected to be unidirectional, provided that the heterogeneity of responses does not change (Montijn et al., 2015), as was the case in our data. Second, the response pattern to white noise in combination with visual gratings was markedly different from the congruent tone condition. If the modulatory effects were caused by arousal, the response patterns would be expected to be similar in both conditions.
Discussion
Using two-photon calcium imaging of neuronal populations in V1 of the awake mouse, we found that auditory modulation of V1 responses depended on the features of both stimulus constituents, such as visual contrast, sound composition, and temporal congruency. V1 neuronal subpopulations showed either an audiovisual response enhancement or suppression at their preferred orientation when a frequency-modulated tone was presented in concordance with a full-contrast visual grating. Whereas the subpopulation of response-enhancing neurons contained information specifically pertaining to audiovisual stimuli, visual-only stimuli were encoded by a subpopulation of response-suppressing neurons. Although low-contrast visual stimuli with frequency-modulated tones or white-noise bursts were encoded according to the same enhancement/suppression coding scheme, full-contrast visual gratings paired with white-noise auditory stimulation resulted primarily in response suppression compared with visual-only stimuli. Cross-modal influences were furthermore dependent on congruency of the audio and visual stimulus components such that neurons showed generally a stronger response when the visual stimulus was paired with a congruent auditory cue compared with an incongruent or dissimilar one. Overall, encoding of congruent stimuli adhered to the enhancement/suppression coding scheme whereas response suppressions dominated during incongruent stimuli. Last, we found a small fraction of V1 neurons responding to the presentation of an auditory stimulus without any visual input. These neurons were more prevalent on the lateral side of the visual cortex, which is the side of V1 closest to the primary auditory cortex and auditory belt regions.
Audiovisual enhancement and suppression as a dynamic coding scheme
In this study we found subpopulations of neurons exhibiting cross-modal response enhancement and suppression while the excitability of the population as a whole remained balanced. This scheme enables the neuronal population in V1 to dynamically code other sources of information while still attributing most of its resources to coding visual information. Our findings are consistent with reports about the nonhuman primate auditory cortex where neurons showed both response enhancement and suppression in response to an audiovisual cue combination (Kayser et al., 2008). This mechanism of cross-modal modulation may thus be a general coding principle used throughout the sensory cortex.
Our results deviate from a recent study concerning V1 of mice reporting that combining a white-noise burst with a low-contrast visual grating resulted in a response enhancement across all neurons in the population (Ibrahim et al., 2016). Moreover, when the authors presented the visual component at a high contrast, the observed effect was significantly decreased compared with the low-contrast condition. Across both high-contrast and low-contrast conditions, we found a net lower excitatory drive in the V1 network. Because we used similar stimulus settings as in the study of Ibrahim et al. (2016; Fig. 4), the explanation of differences in cross-modal activation patterns may be found in the global state of the mice (anesthetized vs awake), or in specific imaging and analysis settings.
We additionally showed that the congruency between stimulus features from different modalities influences cross-modal response modulation (Fig. 6). Congruency at the conceptual and semantic level can assist in attributing sensory information to the appropriate objects (Ghazanfar et al., 2005). Our results show that the brain not only codes “higher-order” conceptual congruency, but also the congruency between “low-level” stimulus features, in this case temporal frequency. Such congruency is often experienced, for example during self-motion where the flow of audio and visual information evolves coherently in time according to the running speed of the subject. This supports the body of evidence showing that neurons in the V1 are not merely feature extractors but respond to a variety of nonvisual information (Shuler and Bear, 2006; Keller et al., 2012; Goltstein et al., 2013; Poort et al., 2015).
Neuronal mechanisms of multisensory integration
On the population level in the sensory cortex, multisensory interactions have been shown to be mediated by “oscillatory phase-resetting,” where signals of one modality influence the phase at which inputs of the same or another modality arrive by resetting ongoing rhythmic activity in several frequency bands (Lakatos et al., 2008; Schroeder and Lakatos, 2009). According to this scheme, signals arriving at the peak of the oscillatory cycle will subsequently be enhanced, whereas signals arriving at the troughs will be suppressed. Temporally congruent stimulus combinations may elicit such a coordinated response in which the cross-modal information arrives at phases of the oscillatory cycle that lead to amplification (Fig. 6D–F) at the expense of unisensory information. In humans, it has been shown that temporal consistency between stimulus streams from different modalities results in a facilitation of stimulus detection (ten Oever et al., 2014) and the entrainment of cortical oscillations (Cravo et al., 2013; Ten Oever et al., 2017). A prediction that follows from this scheme is that the enhanced responses primarily contain information on the multisensory interaction, whereas suppressed responses carry unisensory representations, which is confirmed in our population-decoding analyses (Fig. 2F–H). Temporally incongruent stimulus combinations may not have the required organization to elicit phase resetting (Figs. 4A–E, 6D–F).
Divisive normalization, which operates by a pool of surrounding neurons performing a normalization of the integrated outputs of a given neuron (Carandini and Heeger, 2011), is a second population mechanism that may explain multisensory interactions mostly in associative cortices receiving feedforward information from multiple sensory areas. This model was shown to incorporate three hallmark principles of multisensory integration at the neuronal level: temporal coherence, spatial coherence, and inverse effectiveness (Ohshiro et al., 2011). According to the temporal and spatial principles, multisensory integration occurs when the receptive fields of stimulus constituents overlap, which is usually achieved when the constituents are presented closely together in time or approximately at the same location in space (Meredith et al., 1987; Kadunce et al., 2001). We presented audio and visual stimuli from nearby but not overlapping locations, and found that pairing a full-contrast moving grating with a congruently modulated tone elicited a balanced response-enhancement and response-suppression pattern, whereas incongruent or dissimilar auditory stimuli resulted in predominant response suppression. Our set-up did not test the temporal principle in the traditional way by presenting stimulus components with an offset in time, but we expanded its scope by showing that the congruency of the temporal frequency of stimuli is relevant to their encoding in V1. The cross-modal activation patterns found in this study seem not compliant with the principle of inverse effectiveness; i.e., the notion that the magnitude of multisensory enhancement is inversely proportional to the stimulus strength. We would like to note, however, that “low contrast” (25%) is meant here, as in related studies, relative to “full” or “high contrast” (100%). As mice are able to detect stimuli of 1–2% contrast (Histed et al., 2012), our low-contrast visual grating still may be perceived by the mouse as a relatively salient stimulus.
A possible cortical connectivity scheme for audiovisual integration
An unanswered question is which neural circuitry could underlie our observations. The primary auditory cortex has direct and indirect projections to V1 (Miller and Vogt, 1984; Cappe et al., 2009) and activates inhibitory interneurons in V1 (Iurilli et al., 2012). Sound was shown to elicit a suppression of vasoactive intestinal polypeptide (VIP)-expressing interneurons in V1 mediated by direct corticocortical input from A1 to layer 1 of V1 (Ibrahim et al., 2016). VIP interneurons predominantly inhibit somatostatin (SOM)-expressing interneurons, which in turn inhibit parvalbumin (PV)-expressing interneurons (Pfeffer et al., 2013) and distal dendrites of layer-II/III pyramidal neurons (Gentet, 2012). This interplay of different types of inhibitory neurons may have differential effects on the firing of pyramidal neurons. Indeed, suppression of VIP interneurons results in a disinhibition of SOM cells, of which the effect can be twofold. First, pyramidal firing may be suppressed by an enhanced inhibition of the distal dendrites of pyramidal cells by the SOM cells, and second, pyramidal cells may be excited by an inhibition of PV interneurons. This dual area-to-area action may explain why cross-modal effects may enhance or suppress visual responses.
This microcircuit, of which the causality for audiovisual response modulation awaits testing, pertains to the connections between primary auditory and visual cortices. Multisensory processing, including audiovisual interactions, however, occurs across an extensive hierarchical circuitry of sensory and associational cortices and thalamic nuclei, including the posterior parietal cortex, the prefrontal cortex, and the thalamic reticular nucleus (Raposo et al., 2014; Wimmer et al., 2015; Song et al., 2017).
Our data show that when audiovisual stimulus components are similarly temporally structured, auditory input does not drive the entire V1 neuronal population to either excitation or inhibition but that the presence of a tone is encoded by activity modulation in subsets of neurons while keeping the net excitation levels of the network unaltered. Under specific circumstances, multisensory processing may use the flexibility of the network to shift to overall suppression and possibly enhancement. A future challenge is to further identify the factors that determine multisensory processing schemes.
Footnotes
This work was supported by the Netherlands Organization for Scientific Research, Veni Grant 863.11.010 to C.S.L.; and Excellence Grant for the Brain and Cognition Project 433-09-208 and European Union Horizon 2020 Program under Grant Agreement 720270-Human Brain Project SGA1 to C.M.A.P. We thank Pieter M. Goltstein for his help with setting up the project and Pietro Marchesi for analytical assistance. For the use of GCaMP6, we thank Vivek Jayaraman, Rex Kerr, Douglas Kim, Loren Looger, and Karel Svoboda from the GENIE Project, Janelia Research Campus, Howard Hughes Medical Institute.
The authors declare no competing financial interests.
References
- Aston-Jones G, Cohen JD (2005) An integrative theory of locus coeruleus-norepinephrine function: adaptive gain and optimal performance. Annu Rev Neurosci 28:403–450. 10.1146/annurev.neuro.28.061604.135709 [DOI] [PubMed] [Google Scholar]
- Berens P, Keliris GA, Ecker AS, Logothetis NK, Tolias AS (2008) Comparing the feature selectivity of the gamma-band of the local field potential and the underlying spiking activity in primate visual cortex. Front Syst Neurosci 2:2. 10.3389/neuro.01.015.2008 [DOI] [PMC free article] [PubMed] [Google Scholar]
- Budinger E, Scheich H (2009) Anatomical connections suitable for the direct processing of neuronal information of different modalities via the rodent primary auditory cortex. Hear Res 258:16–27. 10.1016/j.heares.2009.04.021 [DOI] [PubMed] [Google Scholar]
- Cappe C, Rouiller EM, Barone P (2009) Multisensory anatomical pathways. Hear Res 258:28–36. 10.1016/j.heares.2009.04.017 [DOI] [PubMed] [Google Scholar]
- Carandini M, Heeger DJ (2011) Normalization as a canonical neural computation. Nat Rev Neurosci 13:51–62. 10.1038/nrc3398 [DOI] [PMC free article] [PubMed] [Google Scholar]
- Chen TW, Wardill TJ, Sun Y, Pulver SR, Renninger SL, Baohan A, Schreiter ER, Kerr RA, Orger MB, Jayaraman V, Looger LL, Svoboda K, Kim DS (2013) Ultrasensitive fluorescent proteins for imaging neuronal activity. Nature 499:295–300. 10.1038/nature12354 [DOI] [PMC free article] [PubMed] [Google Scholar]
- Cravo AM, Rohenkohl G, Wyart V, Nobre AC (2013) Temporal expectation enhances contrast sensitivity by phase entrainment of low-frequency oscillations in visual cortex. J Neurosci 33:4002–4010. 10.1523/JNEUROSCI.4675-12.2013 [DOI] [PMC free article] [PubMed] [Google Scholar]
- Durand S, Iyer R, Mizuseki K, de Vries S, Mihalas S, Reid RC (2016) A comparison of visual response properties in the lateral geniculate nucleus and primary visual cortex of awake and anesthetized mice. J Neurosci 36:12144–12156. 10.1523/JNEUROSCI.1741-16.2016 [DOI] [PMC free article] [PubMed] [Google Scholar]
- Falchier A, Clavagnier S, Barone P, Kennedy H (2002) Anatomical evidence of multimodal integration in primate striate cortex. J Neurosci 22:5749–5759. [DOI] [PMC free article] [PubMed] [Google Scholar]
- Gentet LJ. (2012) Functional diversity of supragranular GABAergic neurons in the barrel cortex. Front Neural Circuits 6:52. 10.3389/fncir.2012.00052 [DOI] [PMC free article] [PubMed] [Google Scholar]
- Ghazanfar AA, Schroeder CE (2006) Is neocortex essentially multisensory? Trends Cogn Sci 10:278–285. 10.1016/j.tics.2006.04.008 [DOI] [PubMed] [Google Scholar]
- Ghazanfar AA, Maier JX, Hoffman KL, Logothetis NK (2005) Multisensory integration of dynamic faces and voices in rhesus monkey auditory cortex. J Neurosci 25:5004–5012. 10.1523/JNEUROSCI.0799-05.2005 [DOI] [PMC free article] [PubMed] [Google Scholar]
- Gielen SC, Schmidt RA, Van den Heuvel PJ (1983) On the nature of intersensory facilitation of reaction time. Percept Psychophys 34:161–168. 10.3758/BF03211343 [DOI] [PubMed] [Google Scholar]
- Gleiss S, Kayser C (2014) Acoustic noise improves visual perception and modulates occipital oscillatory states. J Cogn Neurosci 26:699–711. [DOI] [PubMed] [Google Scholar]
- Goldey GJ, Roumis DK, Glickfeld LL, Kerlin AM, Reid RC, Bonin V, Schafer DP, Andermann ML (2014) Removable cranial windows for long-term imaging in awake mice. Nat Protoc 9:2515–2538. 10.1038/nprot.2014.165 [DOI] [PMC free article] [PubMed] [Google Scholar]
- Goltstein PM, Coffey EB, Roelfsema PR, Pennartz CM (2013) In vivo two-photon Ca2+ imaging reveals selective reward effects on stimulus-specific assemblies in mouse visual cortex. J Neurosci 33:11540–11555. 10.1523/JNEUROSCI.1341-12.2013 [DOI] [PMC free article] [PubMed] [Google Scholar]
- Goltstein PM, Montijn JS, Pennartz CM (2015) Effects of isoflurane anesthesia on ensemble patterns of Ca 2+ activity in mouse V1: reduced direction selectivity independent of increased correlations in cellular activity. PLoS One 10:e0118277. 10.1371/journal.pone.0118277 [DOI] [PMC free article] [PubMed] [Google Scholar]
- Greenberg DS, Houweling AR, Kerr JN (2008) Population imaging of ongoing neuronal activity in the visual cortex of awake rats. Nat Neurosci 11:749–751. 10.1038/nn.2140 [DOI] [PubMed] [Google Scholar]
- Guizar-Sicairos M, Thurman ST, Fienup JR (2008) Efficient subpixel image registration algorithms. Opt Lett 33:156–158. 10.1364/OL.33.000156 [DOI] [PubMed] [Google Scholar]
- Histed MH, Carvalho LA, Maunsell JH (2012) Psychophysical measurement of contrast sensitivity in the behaving mouse. J Neurophysiol 107:758–765. 10.1152/jn.00609.2011 [DOI] [PMC free article] [PubMed] [Google Scholar]
- Holmes NP. (2009) The principle of inverse effectiveness in multisensory integration: some statistical considerations. Brain Topogr 21:168–176. 10.1007/s10548-009-0097-2 [DOI] [PubMed] [Google Scholar]
- Ibrahim LA, Mesik L, Ji XY, Fang Q, Li HF, Li YT, Zingg B, Zhang LI, Tao HW (2016) Cross-modality sharpening of visual cortical processing through layer-1-mediated inhibition and disinhibition. Neuron 89:1031–1045. 10.1016/j.neuron.2016.01.027 [DOI] [PMC free article] [PubMed] [Google Scholar]
- Iurilli G, Ghezzi D, Olcese U, Lassi G, Nazzaro C, Tonini R, Tucci V, Benfenati F, Medini P (2012) Sound-driven synaptic inhibition in primary visual cortex. Neuron 73:814–828. 10.1016/j.neuron.2011.12.026 [DOI] [PMC free article] [PubMed] [Google Scholar]
- Kadunce DC, Vaughan JW, Wallace MT, Stein BE (2001) The influence of visual and auditory receptive field organization on multisensory integration in the superior colliculus. Exp Brain Res 139:303–310. 10.1007/s002210100772 [DOI] [PubMed] [Google Scholar]
- Kayser C, Petkov CI, Logothetis NK (2008) Visual modulation of neurons in auditory cortex. Cereb Cortex 18:1560–1574. 10.1093/cercor/bhm187 [DOI] [PubMed] [Google Scholar]
- Kayser C, Logothetis NK, Panzeri S (2010) Visual enhancement of the information representation in auditory cortex. Curr Biol 20:19–24. 10.1016/j.cub.2009.10.068 [DOI] [PubMed] [Google Scholar]
- Keller GB, Bonhoeffer T, Hübener M (2012) Sensorimotor mismatch signals in primary visual cortex of the behaving mouse. Neuron 74:809–815. 10.1016/j.neuron.2012.03.040 [DOI] [PubMed] [Google Scholar]
- Lakatos P, Karmos G, Mehta AD, Ulbert I, Schroeder CE (2008) Entrainment of neuronal oscillations as a mechanism of attentional selection. Science 320:110–113. 10.1126/science.1154735 [DOI] [PubMed] [Google Scholar]
- Laramée ME, Kurotani T, Rockland KS, Bronchti G, Boire D (2011) Indirect pathway between the primary auditory and visual cortices through layer V pyramidal neurons in V2L in mouse and the effects of bilateral enucleation. Eur J Neurosci 34:65–78. 10.1111/j.1460-9568.2011.07732.x [DOI] [PubMed] [Google Scholar]
- Laurienti PJ, Kraft RA, Maldjian JA, Burdette JH, Wallace MT (2004) Semantic congruence is a critical factor in multisensory behavioral performance. Exp Brain Res 158:405–414. 10.1007/s00221-00401913-2 [DOI] [PubMed] [Google Scholar]
- Leo F, Romei V, Freeman E, Ladavas E, Driver J (2011) Looming sounds enhance orientation sensitivity for visual stimuli on the same side as such sounds. Exp Brain Res 213:193–201. 10.1007/s00221-011-2742-8 [DOI] [PMC free article] [PubMed] [Google Scholar]
- Lippert M, Logothetis NK, Kayser C (2007) Improvement of visual contrast detection by a simultaneous sound. Brain Res 1173:102–109. 10.1016/j.brainres.2007.07.050 [DOI] [PubMed] [Google Scholar]
- Marshel JH, Garrett ME, Nauhaus I, Callaway EM (2011) Functional specialization of seven mouse visual cortical areas. Neuron 72:1040–1054. 10.1016/j.neuron.2011.12.004 [DOI] [PMC free article] [PubMed] [Google Scholar]
- McGinley MJ, David SV, McCormick DA (2015) Cortical membrane potential signature of optimal states for sensory signal detection. Neuron 87:179–192. 10.1016/j.neuron.2015.05.038 [DOI] [PMC free article] [PubMed] [Google Scholar]
- Meredith MA, Stein BE (1983) Interactions among converging sensory inputs in the superior colliculus. Science 221:389–391. 10.1126/science.6867718 [DOI] [PubMed] [Google Scholar]
- Meredith MA, Stein BE (1986) Spatial factors determine the activity of multisensory neurons in cat superior colliculus. Brain Res 365:350–354. 10.1016/0006-8993(86)91648-3 [DOI] [PubMed] [Google Scholar]
- Meredith MA, Nemitz JW, Stein BE (1987) Determinants of multisensory integration in superior colliculus neurons. I. Temporal factors. J Neurosci 7:3215–3229. [DOI] [PMC free article] [PubMed] [Google Scholar]
- Miller MW, Vogt BA (1984) Direct connections of rat visual cortex with sensory, motor, and association cortices. J Comp Neurol 226:184–202. 10.1002/cne.902260204 [DOI] [PubMed] [Google Scholar]
- Montijn JS, Vinck M, Pennartz CM (2014) Population coding in mouse visual cortex: response reliability and dissociability of stimulus tuning and noise correlation. Front Comput Neurosci 8:58. [DOI] [PMC free article] [PubMed] [Google Scholar]
- Montijn JS, Goltstein PM, Pennartz CM (2015) Mouse V1 population correlates of visual detection rely on heterogeneity within neuronal response patterns. eLife 4:e10163. 10.7554/eLife [DOI] [PMC free article] [PubMed] [Google Scholar]
- Montijn JS, Meijer GT, Lansink CS, Pennartz CM (2016) Population-level neural codes are robust to single-neuron variability from a multidimensional coding perspective. Cell Rep 16:2486–2498. 10.1016/j.celrep.2016.07.065 [DOI] [PubMed] [Google Scholar]
- Murray MM, Wallace MT, eds (2012) The neural bases of multisensory processes. Boca Raton, FL: CRC/Taylor&Francis. [PubMed] [Google Scholar]
- Niell CM, Stryker MP (2008) Highly selective receptive fields in mouse visual cortex. J Neurosci 28:7520–7536. 10.1523/JNEUROSCI.0623-08.2008 [DOI] [PMC free article] [PubMed] [Google Scholar]
- Ohki K, Chung S, Ch'ng YH, Kara P, Reid RC (2005) Functional imaging with cellular resolution reveals precise micro-architecture in visual cortex. Nature 433:597–603. 10.1038/nature03274 [DOI] [PubMed] [Google Scholar]
- Ohshiro T, Angelaki DE, DeAngelis GC (2011) A normalization model of multisensory integration. Nat Neurosci 14:775–782. 10.1038/nn.2815 [DOI] [PMC free article] [PubMed] [Google Scholar]
- Paperna T, Malach R (1991) Patterns of sensory intermodality relationships in the cerebral cortex of the rat. J Comp Neurol 308:432–456. 10.1002/cne.903080310 [DOI] [PubMed] [Google Scholar]
- Paxinos G, Franklin KBJ (2004) The mouse brain in stereotaxic coordinates, 2th ed San Diego: Elsevier/Academic. [Google Scholar]
- Pennartz CMA. (2015) The brain's representational power. Cambridge, MA: MIT. [Google Scholar]
- Pfeffer CK, Xue M, He M, Huang ZJ, Scanziani M (2013) Inhibition of inhibition in visual cortex: the logic of connections between molecularly distinct interneurons. Nat Neurosci 16:1068–1076. 10.1038/nn.3446 [DOI] [PMC free article] [PubMed] [Google Scholar]
- Poort J, Khan AG, Pachitariu M, Nemri A, Orsolic I, Krupic J, Bauza M, Sahani M, Keller GB, Mrsic-Flogel TD, Hofer SB (2015) Learning enhances sensory and multiple non-sensory representations in primary visual cortex. Neuron 86:1478–1490. 10.1016/j.neuron.2015.05.037 [DOI] [PMC free article] [PubMed] [Google Scholar]
- Raposo D, Kaufman MT, Churchland AK (2014) A category-free neural population supports evolving demands during decision-making. Nat Neurosci 17:1784–1792. 10.1038/nn.3865 [DOI] [PMC free article] [PubMed] [Google Scholar]
- Schroeder CE, Lakatos P (2009) Low-frequency neuronal oscillations as instruments of sensory selection. Trends Neurosci 32:9–18. 10.1016/j.tins.2008.09.012 [DOI] [PMC free article] [PubMed] [Google Scholar]
- Shuler MG, Bear MF (2006) Reward timing in the primary visual cortex. Science 311:1606–1609. 10.1126/science.1123513 [DOI] [PubMed] [Google Scholar]
- Song YH, Kim JH, Jeong HW, Choi I, Jeong D, Kim K, Lee SH (2017) A neural circuit for auditory dominance over visual perception. Neuron 93:940–954.e6. 10.1016/j.neuron.2017.01.006 [DOI] [PubMed] [Google Scholar]
- Stein BE, Stanford TR (2008) Multisensory integration: current issues from the perspective of the single neuron. Nat Rev Neurosci 9:255–266. 10.1038/nrn2331 [DOI] [PubMed] [Google Scholar]
- Stevenson RA, Ghose D, Fister JK, Sarko DK, Altieri NA, Nidiffer AR, Kurela LR, Siemann JK, James TW, Wallace MT (2014) Identifying and quantifying multisensory integration: a tutorial review. Brain Topogr 27:707–730. 10.1007/s10548-014-0365-7 [DOI] [PubMed] [Google Scholar]
- ten Oever S, Schroeder CE, Poeppel D, van Atteveldt N, Zion-Golumbic E (2014) Rhythmicity and cross-modal temporal cues facilitate detection. Neuropsychologia 63:43–50. 10.1016/j.neuropsychologia.2014.08.008 [DOI] [PMC free article] [PubMed] [Google Scholar]
- Ten Oever S, Schroeder CE, Poeppel D, van Atteveldt N, Mehta AD, Mégevand P, Groppe DM, Zion-Golumbic E (2017) Low-frequency cortical oscillations entrain to subthreshold rhythmic auditory stimuli. J Neurosci 37:4903–4912. 10.1523/JNEUROSCI.3658-16.2017 [DOI] [PMC free article] [PubMed] [Google Scholar]
- van Atteveldt N, Formisano E, Goebel R, Blomert L (2004) Integration of letters and speech sounds in the human brain. Neuron 43:271–282. 10.1016/j.neuron.2004.06.025 [DOI] [PubMed] [Google Scholar]
- Wallace MT, Ramachandran R, Stein BE (2004) A revised view of sensory cortical parcellation. Proc Natl Acad Sci U S A 101:2167–2172. 10.1073/pnas.0305697101 [DOI] [PMC free article] [PubMed] [Google Scholar]
- Wang Q, Sporns O, Burkhalter A (2012) Network analysis of corticocortical connections reveals ventral and dorsal processing streams in mouse visual cortex. J Neurosci 32:4386–4399. 10.1523/JNEUROSCI.6063-11.2012 [DOI] [PMC free article] [PubMed] [Google Scholar]
- Wimmer RD, Schmitt LI, Davidson TJ, Nakajima M, Deisseroth K, Halassa MM (2015) Thalamic control of sensory selection in divided attention. Nature 526:705–709. 10.1038/nature15398 [DOI] [PMC free article] [PubMed] [Google Scholar]
- Zheng QY, Johnson KR, Erway LC (1999) Assessment of hearing in 80 inbred strains of mice by ABR threshold analyses. Hear Res 130:94–107. 10.1016/S0378-5955(99)00003-9 [DOI] [PMC free article] [PubMed] [Google Scholar]
- Zoccolan D, Graham BJ, Cox DD (2010) A self-calibrating, camera-based eye tracker for the recording of rodent eye movements. Front Neurosci 4:193. 10.3389/fnins.2010.00193 [DOI] [PMC free article] [PubMed] [Google Scholar]