Abstract
Cyclic guanosine monophosphate (cGMP) plays a crucial role as a second messenger in the regulation of sensory signal transduction in many organisms. In AWC olfactory sensory neurons of Caenorhabditis elegans, cGMP also has essential and distinctive functions in olfactory sensation and adaptation. According to molecular genetic studies, when nematodes are exposed to odorants, a decrease in cGMP regulates cGMP-gated channels for olfactory sensation. Conversely, for olfactory adaptation, an increase in cGMP activates protein kinase G to modulate cellular physiological functions. Although these opposing cGMP responses in single neurons may occur at the same time, it is unclear how cGMP actually behaves in AWC sensory neurons. A hypothetical explanation for opposing cGMP responses is region-specific behaviors in AWC: for odor sensation, cGMP levels in cilia could decrease, whereas odor adaptation is mediated by increased cGMP levels in soma. Therefore, we visualized intracellular cGMP in AWC with a genetically encoded cGMP indicator, cGi500, and examined spatiotemporal cGMP responses in AWC neurons. The cGMP imaging showed that, after odor exposure, cGMP levels in AWC cilia decreased transiently, whereas levels in dendrites and soma gradually increased. These region-specific responses indicated that the cGMP responses in AWC neurons are explicitly compartmentalized. In addition, we performed Ca2+ imaging to examine the relationship between cGMP and Ca2+. These results suggested that AWC sensory neurons are in fact analogous to vertebrate photoreceptor neurons.
SIGNIFICANCE STATEMENT Cyclic guanosine monophosphate (cGMP) plays crucial roles in the regulation of sensory signal transduction in many animals. In AWC olfactory sensory neurons of Caenorhabditis elegans, cGMP also has essential and distinctive functions involving olfactory sensation and adaptation. Here, we visualized intracellular cGMP in AWC neurons with a genetically encoded cGMP indicator and examined how these different functions could be regulated by the same second messenger in single neurons. cGMP imaging showed that, after odor application, cGMP levels in cilia decreased transiently, whereas levels in dendrites and soma gradually increased. These region-specific responses indicated that the responses in AWC neurons are explicitly compartmentalized. In addition, by combining cGMP and Ca2+ imaging, we observed that AWC neurons are analogous to vertebrate photoreceptor neurons.
Keywords: C. elegans, cGMP imaging, compartment, sensory neuron
Introduction
As a second messenger in signaling pathways, cyclic guanosine monophosphate (cGMP) plays a crucial role in the regulation of sensory signal transduction. In sensory systems, cGMP mediates external stimuli and modulates cellular physiological functions involving photo and olfactory signal transduction, learning, and memory (Kaupp and Seifert, 2002; Fu and Yau, 2007; Kots et al., 2009). To control these various distinctive functions through the same messenger, spatial and temporal regulation of cGMP in single cells is necessary (Arora et al., 2013; McCormick and Baillie, 2014). To reveal these roles of cGMP, imaging techniques have been developed (Niino et al., 2009, 2010; Sprenger and Nikolaev, 2013). Although cGMP imaging has recently been used to examine cGMP changes by pharmacological stimuli in cultured cells and tissues slices and intrinsic responses in vivo (Couto et al., 2013; Sprenger and Nikolaev, 2013), region-specific cGMP responses and functions in single neurons have never been elucidated.
In Caenorhabditis elegans, cGMP is also essential for signal transduction pathways in sensory neurons (de Bono and Maricq, 2005; Bargmann, 2006; O'Halloran et al., 2009, 2012). In particular, for AWC olfactory sensory neurons, cGMP has distinctive functions involving olfactory sensation and adaptation. For olfactory sensation, cGMP is produced by receptor-like guanylate cyclase downstream in the signaling pathway from odorant receptors and regulates cGMP-gated channels (de Bono and Maricq, 2005; Bargmann, 2006). For odor adaptation, cGMP binds to cGMP-dependent protein kinase G (PKG) upon exposure to odor, leading to translocation of PKG into the nuclei to modulate cellular functions (L'Etoile et al., 2002; Lee et al., 2010). This translocation of PKG depends on intracellular cGMP levels (Lee et al., 2010; O'Halloran et al., 2012). These results suggest that cGMP levels in AWC neurons may increase when worms are exposed to odor. Simultaneously, cGMP levels may also decrease during odor exposure, resulting in closure of cGMP-gated channels and decreased Ca2+ entry in AWC neurons (Chalasani et al., 2007). These odor-induced opposing responses of cGMP may be explained by the region-specific changes in cGMP responses that differ in cilia and soma. However, it is still unclear how cGMP actually behaves in different regions of AWC neurons.
Here, we visualized region-specific cGMP responses in AWC sensory neurons with a genetically encoded cGMP indicator, cGi500 (Russwurm et al., 2007). Previous research has elucidated an increase or decrease in cGMP levels of the same gas-sensing neurons in C. elegans, which was attributed to the subcellular responses of cGMP (Couto et al., 2013). In our study focusing on subregions of AWC neurons, we showed that cGMP responses to odorants were region specific. Then, by comparing cGMP and Ca2+ imaging, we observed a relationship between the cGMP and Ca2+ responses in AWC neurons. The compartmentalized cGMP responses could result from the localization of GC. In addition, we revealed how cGMP responses to odorants were dependent on various odor stimulus conditions in worms. Finally, cGMP imaging suggested that the function of cGMP in response to odor in AWC neurons may be analogous to vertebrate photoreceptor neurons rather than vertebrate olfactory neurons.
Materials and Methods
Strains and culture.
All strains were cultured on nematode growth medium plates with Escherichia coli (OP50) at 20°C. The wild-type strain was hermaphrodite N2. In our study, we used a cGMP sensor, cGi500 (Russwurm et al., 2007), and a calcium sensor, GEM-GECO1.0 (Zhao et al., 2011). The transgenic worms were used as follows: oka6Ex[pstr-2::cGi500], oka4Ex[pstr-2::GEM-GECO1.0], oka7Ex; odr-1(n1936) X [podr-3::cGi500], and oka8Ex; daf-11(m47) V [podr-3::cGi500]. To construct the plasmids for microinjection, the Gateway system (Thermo Fisher Scientific) was used. For the destination vector of cGi500, we combined PCR fragments of the cGi500 sensor (Russwurm et al., 2007) with the pDEST vector by ligation. Other destination and entry vectors were obtained from the Comprehensive Brain Science Network in Japan. The concentration for injection was as follows: pstr-2::cGi500, 50 ng/μl; pstr-2::GEM-GECO1.0, 100 ng/μl; and podr-3::cGi500, 50 ng/μl.
Confocal images of cGi500 sensor expressed in AWC sensory neurons.
Confocal fluorescent images of cGMP sensor expression in AWC neurons were taken with an Olympus confocal microscope system (FV1000) with a 40× objective oil-immersion lens. Worms expressing cGi500 in AWC sensory neurons were immobilized with 50 mm sodium azide solution on a 2% agar pad and covered with a glass coverslip. The imaging conditions were as follows: excitation at 515 nm, 405–440/515 dichroic mirror, and emission at 530-630 nm.
Measurement equipment.
We used an Olympus inverted microscope (IX71) with a 60× objective lens (LUCPlanFLN). The mirror unit was U-MWBV2 (Olympus). The light source was an LED light, SOLA (Lumencor), and fluorescent images were captured by a 3CCD camera (C7800-20; Hamamatsu Photonics) with AQUACOSMOS software (Hamamatsu Photonics), except for subcellular cGMP imaging (see Fig. 1I).
Figure 1.
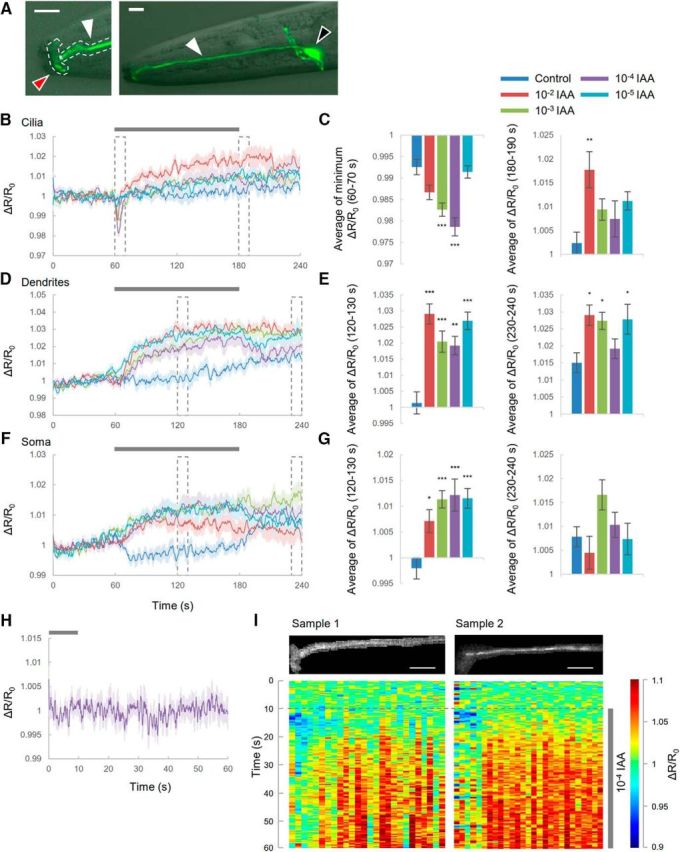
Compartmentalized cGMP responses to odor in AWC sensory neurons. A, Confocal images of pstr-2::cGi500. Black arrow indicates soma; white arrow, dendrite; and red arrow, cilia. Dotted lines indicate ROIs at either cilia or dendrites. Scale bar, 10 μm. B–G, Compartmentalized cGMP responses of AWC sensory neurons. B, D, F, Time courses of cGMP responses in cilia (B), dendrites (D), and soma (F) of AWC neurons. Traces are averages of the relative fluorescence ratio (CFP/YFP). The control corresponds to S-basal flow. Gray bar is the duration of odor stimulus. Shading in the graphs shows SEM. Dotted boxes indicate the time focused in bar graphs. C, E, G, Summaries of cGMP responses in cilia (C), dendrites (E), and soma (G) during each specified time. Error bars represent SEM. Datasets are as follows for control, 10−2, 10−3, 10−4, and 10−5 IAA, respectively: cilia and dendrites, n = 8, 9, 11, 9, and 11; soma, n = 10, 11, 11, 10, and 10 (C, left, p = 0.0801, p < 0.001, p < 0.001, p = 0.9686; C, right, p = 0.00287, p = 0.25269, p = 0.56314, and p = 0.10763; E, left, p < 0.001, p < 0.001, p = 0.0017, and p < 0.001; E, right, p = 0.0261, p = 0.0449, p = 0.8123, and p = 0.0355; G, left, p = 0.019, p < 0.001, p < 0.001, and p < 0.001; G, right, p = 0.841, p = 0.132, p = 0.939, and p = 1.000; 10−2, 10−3, 10−4, and 10−5 IAA, respectively; Dunnett's test). *p < 0.05; **p < 0.01; ***p < 0.001, significant difference. H, cGMP responses at cilia to odor removal. Time of the prior exposure to 10−4 diluted IAA was 5 min. n = 8. I, Subcellular cGMP responses at head regions. Heat maps show responses of cGMP. Horizontal axes of heat maps correspond to upper images. Resolution of the horizontal axis is 2.17 μm. Scale bar, 10 μm.
For subcellular cGMP imaging, fluorescent images were captured by a CMOS camera, ORCA-Flash4.0 V2 (C11440; Hamamatsu Photonics) with W-VIEW GEMINI (A12801-01; Hamamatsu Photonics) using HCImage Live software (Hamamatsu Photonics). The filter sets in W-VIEW GEMINI were as follows: FF509-FDi01 dichroic mirror (Semrock) and emission filters FF01-483/32-25 and FF01-542/27-25 (both from Semrock).
cGMP and Ca2+ imaging.
We observed transgenic worms fixed in microfluidic devices (Chronis et al., 2007) and changed flows of odor and S-basal (control) by switching a valve manually. To decrease noise from worm motion, a cholinergic agonist, 2 mm levamisole, was added to all solutions in imaging procedures. In our imaging, isoamyl alcohol (IAA) and benzaldehyde (Bz) were diluted with S-basal buffer.
For long-term imaging (see Fig. 1B–G, 2–4), images were captured every 600 ms. Exposure time was 200 ms. Before imaging sections, worms were exposed to S-basal buffer for 4 min in advance. For short-term imaging (see Fig. 1H,I, 5–7), images were captured every 100 ms with an exposure time of 100 ms. Unless otherwise noted, worms were exposed to S-basal buffer for 4 min in advance. To examine cGMP responses to relative changes in odor concentration (see Fig. 7), worms were exposed to diluted IAA for 2 min in advance.
Figure 7.
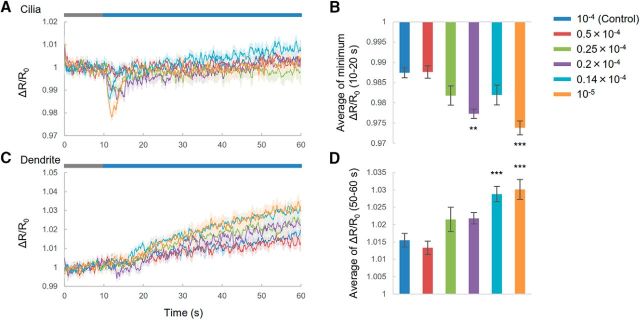
cGMP responses to relative changes in odor. A, C, cGMP responses to relative changes in diluted IAA in cilia (A) and dendrites (C). Blue bar indicates the duration of 10−4 diluted IAA application. Gray bar is the duration of the test stimulus. Shading in the graphs shows SEM. B, D, Summaries of cGMP responses. Error bar indicates SEM. Datasets are as follows for 10−4, 0.5 × 10⁻⁴, 0.25 × 10⁻⁴, 0.2 × 10⁻⁴, 0.14 × 10⁻⁴, and 10−5 IAA, respectively: cilia and dendrites, n = 10, 10, 9, 9, 11, and 10; soma, n = 10, 10, 9, 9, 11, and 10. (B, p = 1.00000, p = 0.14898, p = 0.00176, p = 0.13384, and p < 0.001; D, p = 0.953, p = 0.296, p = 0.249, p < 0.001, and p < 0.001; 0.5 × 10⁻⁴, 0.25 × 10⁻⁴, 0.2 × 10⁻⁴, 0.14 × 10⁻⁴, and 10−5 IAA, respectively; Dunnett's test). **p < 0.01 and ***p < 0.001, significant difference.
For the assessment of long-term exposure (see Fig. 5) and repeated stimuli (see Fig. 6), the concentration of IAA was 10−4. For the 10-stimulus condition (see Fig. 6D), we applied 10 stimuli and the procedures of the four-stimulus conditions (see Fig. 6A). To avoid photobleaching of the cGMP sensor, observation was performed in the first three and tenth trials.
Figure 5.
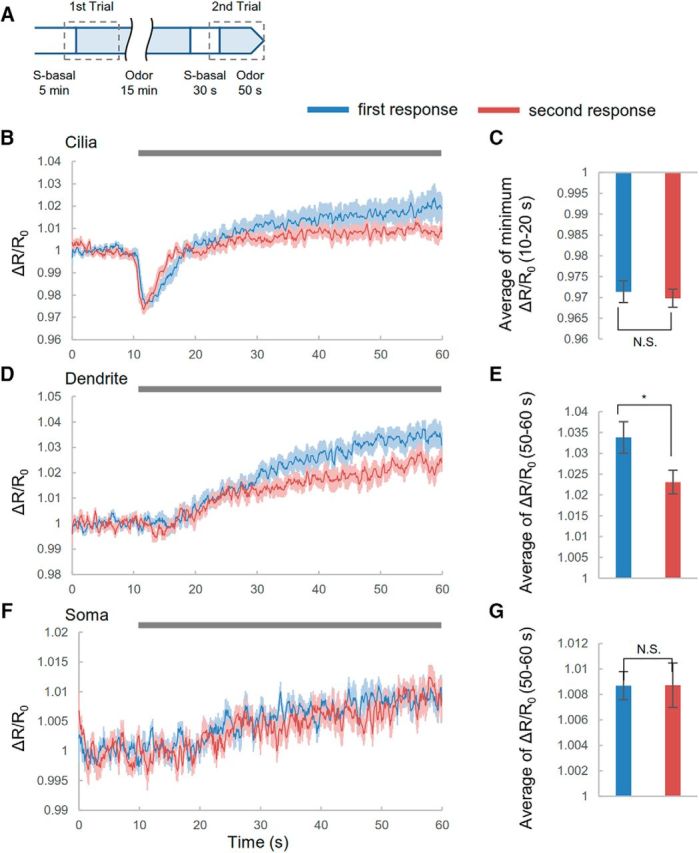
cGMP responses after exposure to odor for 15 min. A, Experimental procedure. B, D, F, cGMP responses in cilia (B), dendrites (D), and soma (F) before and after exposure to 10−4 diluted IAA for 15 min. Gray bar is the duration of odor stimulus. Shading in the graphs shows SEM. C, E, G, Summaries of cGMP responses in cilia (C), dendrites (E), and soma (F). Error bar indicates SEM. Blue indicates cGMP responses in the first trial; red indicates cGMP responses in the second trial. Datasets are as follows: cilia and dendrite, n = 9; soma, n = 8. (C, p = 0.5565; E, p = 0.02493; and G, p = 0.9856; Student's t test). *p < 0.05, significant difference.
Figure 6.
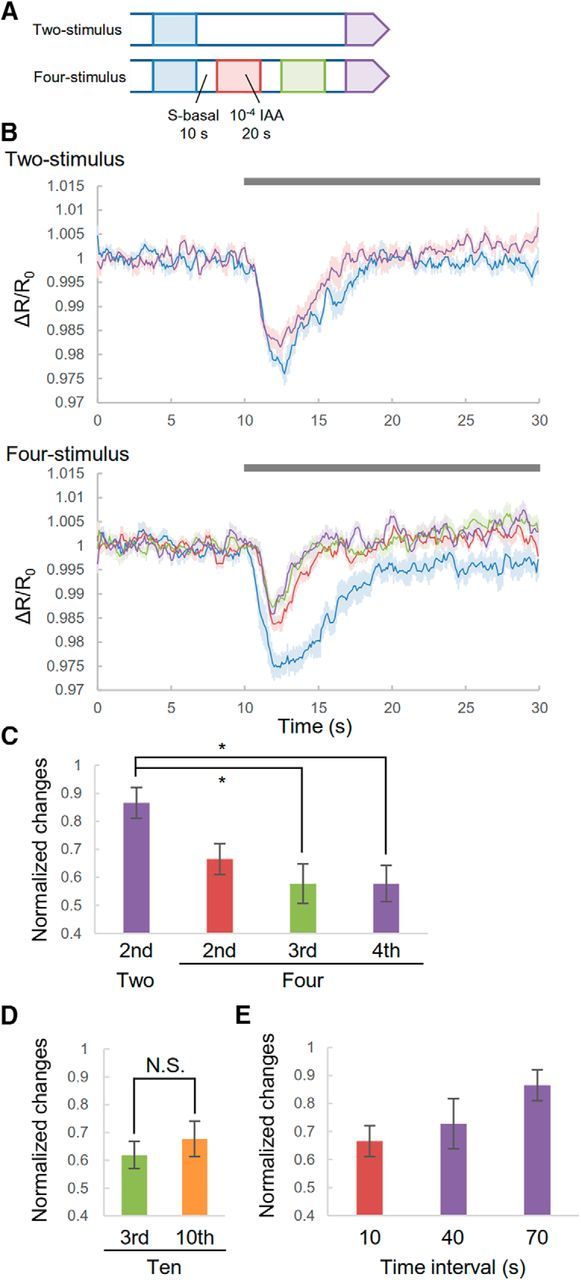
cGMP responses in cilia to repeated stimuli. A, Experimental procedure. Worms were exposed to odor for 20 s every 30 s two or four times. B, cGMP responses to odor in the two-stimulus (top) and four-stimulus conditions (bottom). Each trace was extracted from sequential data consisting of 10 s before and 20 s after odor application. Gray bar is the duration of odor stimulus. Shading in the graphs shows SEM. C, Summaries of cGMP responses. Each variation in cGMP response is normalized by the variation of the first responses. D, Third and tenth cGMP response to odor in the 10-stimulus condition. E, cGMP response to sequential application of odor for different time intervals. Each variation of the second or last cGMP responses for different time intervals was normalized by the variation of the first response. The data for 10 and 70 s are the same in C. Error bar indicates SEM. n = 10, 11, 11, and 10 (two-, four-, and 10-stimulus presentations plus 40 s time interval stimulus presentation, respectively). (C, p = 0.01977, p = 0.004951, and p = 0.003289; second, third, and last responses, respectively; D, p = 0.3652; Student's t test). *p < 0.05, significant difference with Bonferroni correction.
Data analysis.
We analyzed the imaging data with the semiautomated custom programs made with MATLAB (The MathWorks). Regions of interest (ROIs) were determined according to cell shapes (see Fig. 1A). The cGMP and Ca2+ responses were obtained by calculating fluorescence ratios, cyan fluorescent protein (CFP)/yellow fluorescent protein (YFP) and blue/green, respectively. In all figures except for subcellular cGMP imaging, ratiometric data were smoothed by using a moving average with five time points. All data were normalized by averages before stimulation.
For subcellular imaging, we specified ROIs like the images (see Fig. 1I, top). We calculated the average of fluorescent intensities in ROIs along each column and of the values for every five data points along each row. The fluorescent data were smoothed by average moving with five time points and the CFP/YFP ratio was calculated (see Fig. 1I, heat maps). In each line over time, all data were normalized by averages before stimulation.
Statistical tests were performed using Student's t test with or without Bonferroni correction (Microsoft Excel 2013) or Dunnett's test (R version 2.15.2).
Results
cGMP responses were compartmentalized in AWC olfactory sensory neurons
In AWC sensory neurons, cGMP might have distinctive region-specific roles, so we focused on three parts of the neuron: cilia, dendrites, and soma (Fig. 1A). Because fluorescent intensities of the cGMP sensor in AWC neurons are much higher in soma than in cilia and dendrites due to greater soma volume, it was impossible to measure cGMP dynamics in all parts of the neuron simultaneously. Therefore, we examined cGMP responses in either soma or at a top of the head (including cilia and dendrites; Fig. 1A).
First, individual transgenic worms were exposed to odor (10−4 diluted IAA) for 120 s (Fig. 1B–G, purple). In cilia, when animals were exposed to odor, cGMP levels decreased transiently (Fig. 1B,C). The transient declines in cGMP recovered to the basal level in 10 s. Then, the cGMP level increased slightly, but the intensities were not significantly different except for those at 10−2 diluted IAA (Fig. 1C, right). The reason that the cGMP trace at 10−2 diluted IAA was distinctive from others could be that the concentration was so high that AWC sensory neurons behaved unusually (see below, Ca2+ responses at 10−2 diluted IAA). In contrast, cGMP levels increased in dendrites and soma during odor application (Fig. 1D–G) and then decreased gradually upon odor removal. AWC sensory neurons have been shown to decrease Ca2+ in response to odor addition (on-response) and increase Ca2+ after odor removal (off-response) (see Fig. 3) (Chalasani et al., 2007). Similarly, the cGMP level at dendrites and soma changed during odor exposure, but responses at cilia were observed just after odor addition. These results indicated that cGMP responses in AWC neurons behave in a region-specific manner. Previous research has also shown that the intensity of Ca2+ responses induced by odor removal was dependent on the duration of prior odorant exposure (Chalasani et al., 2007), so it was possible that, in our experiments, exposure for 2 min was too short to induce cGMP responses after odor removal. We therefore determined whether prior long-term exposure to odor induced cGMP responses (Fig. 1H). After odor exposure for 5 min, the cGMP response did not change at all, suggesting that odor removal did not cause cGMP responses in cilia. To further characterize the spatial responses of cGMP in AWC neurons, we obtained wide-range images of worm heads (Fig. 1I, top); the cGMP responses were monitored in 2.17 μm steps from the top of the head. The results showed that the cGMP decline at the top of the head was distinctly separated from the cGMP increase at ∼10 μm from the top. Therefore, the cGMP responses are compartmentalized in AWC sensory neurons. We then investigated whether these compartmentalized cGMP responses depended on odor intensities (Fig. 1B–G). In cilia, the maximal cGMP response was observed when 10−4 diluted IAA was applied. Similarly, in soma, the cGMP increase peaked at the same concentration of IAA. Conversely, cGMP levels in dendrites did not appear to depend on odor concentration.
Figure 3.
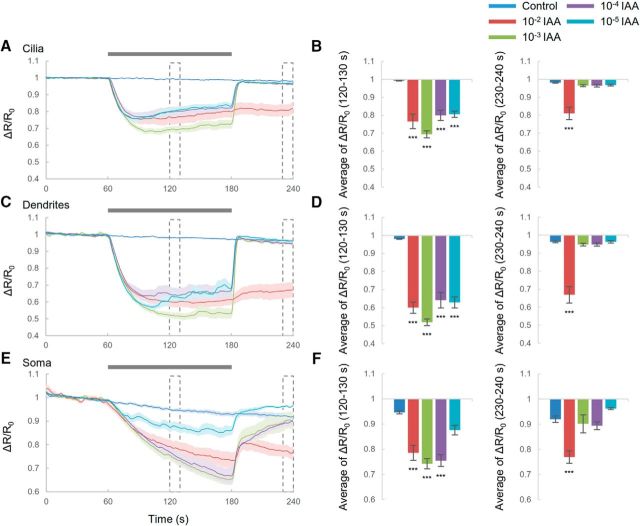
Ca2+ responses to odor in each compartment of AWC sensory neurons. A, C, E, Time courses of Ca2+ responses to IAA in cilia (A), dendrites (C), and soma (E) of AWC sensory neurons. Traces are averages of the relative fluorescence ratio (blue/green). The control corresponds to S-basal flow. Gray bar is the duration of odor stimulus. Shading in the graphs shows SEM. Dotted boxes indicate the specified time in bar graphs. B, D, F, Summaries of Ca2+ responses in cilia (B), dendrites (D), and soma (F) during each time. Error bar indicates SEM. n = 10 for each condition. (B, left, p < 10−5, p < 10−5, p < 10−5, and p < 10−5; B, right, p < 10−4, p = 0.866, p = 0.851, and p = 0.925; D, left, p < 10−9, p < 10−9, p < 10−9, and p < 10−9; D, right, p < 10−4, p = 0.968, p = 0.970, and p = 1.000; F, left, p < 0.001, p < 0.001, p < 0.001, and p = 0.0778; F, right, p < 0.001, p = 0.934, p = 0.812, and p = 0.448; 10−2, 10−3, 10−4, and 10−5 IAA, respectively; Dunnett's test). ***p < 0.001, significant difference.
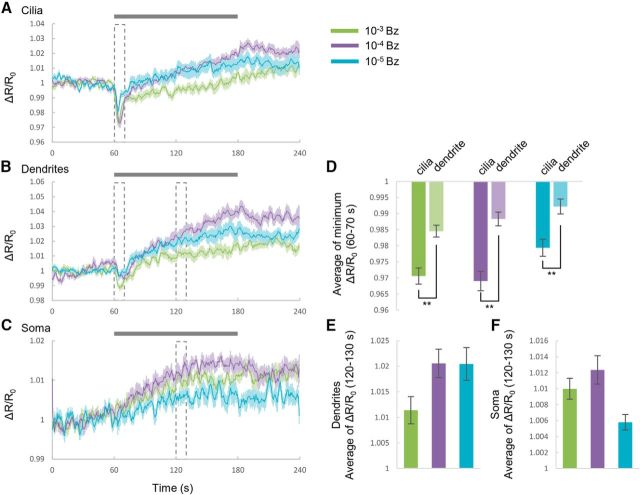
We also investigated the cGMP responses to benzaldehyde (Bz) (Fig. 2), which is also sensed by AWC through cGMP signal pathways (L'Etoile and Bargmann, 2000). In addition to the responses to IAA, the cGMP responses to Bz were observed, but these responses were slightly different in cilia and dendrites. In cilia, although the transient cGMP decrease was also observed, the cGMP level increased during odor application and decreased upon odor removal at 10−3 and 10−4 diluted Bz (Fig. 2A). In dendrites, odor addition induced a slight transient reduction of cGMP (Fig. 2B). The responses in dendrites were smaller than ones in cilia (Fig. 2D). Conversely, the responses in soma were similar to those with IAA (Fig. 2C) and the cGMP changes appeared to be dependent on the concentration of Bz (Fig. 2E,F). Therefore, although the responses to the two odorants were distinct, the compartmentalized activity may be common to odor sensation throughout the cGMP pathway in AWC sensory neurons.
Figure 2.
Compartmentalized cGMP responses to benzaldehyde in AWC sensory neurons. A–C, Time courses of cGMP responses in cilia (A), dendrites (B), and soma (C) of AWC. Traces are averages of the relative fluorescence ratio. Gray bar is the duration of odor stimulus. Shading in the graphs shows SEM. Dotted boxes indicate the time focused in bar graphs. D, Summary of transient reduction in cilia and dendrites. (p = 0.004111, p = 0.004191, and p = 0.003277; 10−3, 10−4, and 10−5, respectively). **p < 0.01, significant difference. E, F, Summaries of cGMP responses in dendrites (E) and soma (F) during 120–130 s. Error bars indicate SEM. n = 10 each region.
In cilia, cGMP can control cGMP-gated channels, which induces Ca2+ influx (Bargmann, 2006; O'Halloran et al., 2009), so we investigated whether Ca2+ responses also corresponded to cGMP responses (Fig. 3). Similar to previous research showing Ca2+ changes in soma and dendrites of AWC neurons (Chalasani et al., 2007; Kato et al., 2014), we also found that Ca2+ levels in cilia decreased after odor addition and increased after its removal (Fig. 3A,B; 10−3 to 10−5 diluted IAA), which was similar to Ca2+ changes in dendrites and soma (Fig. 3C–F). However, compared with cGMP changes in cilia (Fig. 1B), the Ca2+ changes in cilia did not show the rapid transient decrease and dependence on the concentration of IAA, indicating that they did not correspond to the cGMP responses. These results suggested the Ca2+ behavior in AWC sensory neurons is not compartmentalized like cGMP. Although the Ca2+ responses in cilia were not dependent on the concentration of IAA, the Ca2+ responses in soma showed dependence (Fig. 3F), which also existed for cGMP responses in soma. Conversely, using 10−2 diluted IAA, odor removal did not induce the Ca2+ increase in cilia, dendrites, or soma. Previous research showed that the responses to high concentration of attractive odor in AWC were different from ones to low concentration (Yoshida et al., 2012). Other research indicated that a high concentration of attractants recruit distinct neural circuits in which responses of sensory neurons generate unusual responses (Leinwand and Chalasani, 2013; Taniguchi et al., 2014). Therefore, similar mechanisms might cause the unusual Ca2+ responses to 10−2 diluted IAA. The high concentration of IAA also caused different cGMP responses in cilia compared with other conditions (Fig. 1C). Ca2+ responses were similar to cGMP responses in cilia.
ODR-1 and DAF-11 have different roles in cGMP responses in AWC sensory neurons
Previous researches have shown that two GCs, ODR-1 and DAF-11, are necessary for chemosensation in AWC (Birnby et al., 2000; L'Etoile and Bargmann, 2000). To understand the mechanisms of the compartmentalized cGMP responses, we investigated cGMP responses of animals that were deficient in these GCs (Fig. 4). For odr-1 mutants, although cGMP levels in dendrites were different between odor stimulation and the control at specific times (Fig. 4B,D), odr-1 mutants showed minimal cGMP responses to odor in any parts (Fig. 4A–D). Meanwhile, for daf-11 mutants, cGMP levels in cilia declined gradually upon odor addition (Fig. 4E,H), although cGMP levels in dendrites and soma did not change (Fig. 4F–H). Compared with the results in wild-type worms (Fig. 1B), the cGMP responses in cilia of daf-11 mutants was different (Fig. 4E). These results indicated that two GCs have distinctive roles in cGMP responses to odor stimulation. In particular, DAF-11 could be important for the compartmentalized responses because the daf-11 defect disappears cGMP responses in dendrites and soma completely.
Figure 4.
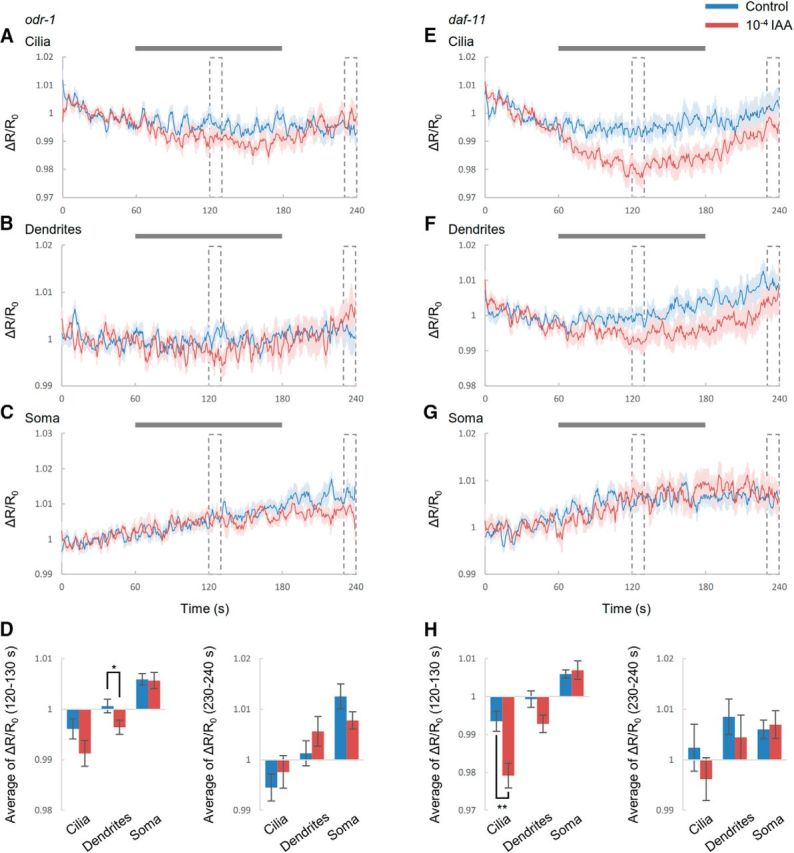
Roles of GC for cGMP responses in AWC. A–C, Time courses of cGMP responses to IAA in cilia (A), dendrites (B), and soma (C) of AWC sensory neurons in odr-1 mutants. The control corresponds to S-basal flow. Gray bar is the duration of odor stimulus. Shading in the graphs shows SEM. Dotted boxes indicate the time focused in bar graphs. D, Summaries of cGMP responses in odr-1 mutants. Error bar indicates SEM. E–G, Time courses of cGMP responses in cilia (E), dendrites (F), and soma (G) of AWC sensory neurons in daf-11 mutants. H, Summaries of cGMP responses in daf-11 mutants. n = 10 for each condition. (D, left, p = 0.149, p = 0.0432, and p = 0.902; D, right, p = 0.467, p = 0.269, and p = 0.130; H, left, p = 0.00321, p = 0.0556, and p = 0.712; H, right, p = 0.334, p = 0.482, and p = 0.780; cilia, dendrites and soma, respectively; Student's t test). *p < 0.05 and **p < 0.01 significant difference.
Long-term exposure to odor did not change cGMP responses
Long-term exposure to odorants induces olfactory adaptation in AWC neurons through cGMP signaling (L'Etoile and Bargmann, 2000; Lee et al., 2010). However, it is unclear whether modulation of cGMP in AWC neurons directly regulates cGMP-gated channels, leading to adaptation. To address this question, we investigated whether long-term exposure to odor induced changes in cGMP responses. To compare the responses of cGMP before and after odor application, we performed two trials of image acquisition for each animal (Fig. 5A). In the first trial, we determined the initial cGMP responses to odor (Fig. 5B,D,F). In the second trial, although animals had already been exposed to odor for 15 min, the cGMP response was similar in magnitude to that observed in the first trial (Fig. 5B,D,F). In cilia and soma, the amplitudes of these cGMP responses between the two trials were not significantly different (Fig. 5C,G), but the response amplitudes in dendrites did show a significant difference (Fig. 5E). We thus concluded that ∼15 min long-term exposure to odor changed the cGMP response in dendrites, but not in cilia and soma. This finding suggested that regulation of cGMP in cilia is not involved in adaptation to odorants. Previous research indicated that the adaptation at short times was induced by the phosphorylation of TAX-2 (L'Etoile et al., 2002). Therefore, rather than regulating the cGMP level, this mechanism might be important for adaptation.
Repeated stimuli induced desensitization of cGMP responses in cilia
For olfactory and photoreceptor neurons, repeated stimuli cause a decrease in responses by second messenger-mediated mechanisms (Nikonov et al., 2000; Zufall and Leinders-Zufall, 2000). Although long-term exposure did not change the cGMP responses in AWC cilia (Fig. 5), repeated stimuli could decrease cGMP responses to odor. Therefore, we investigated whether repeated stimuli changed cGMP responses in cilia. In this experiment, we compared cGMP responses under two conditions (Fig. 6A). In the four-stimulus condition, animals were exposed to odor four times for 30 s each time, whereas those in the two-stimulus condition were only stimulated twice, at the same time as the first and last stimulus of the four-stimulus experiment. Comparing the variation of each response normalized to the amplitude of the first response, we found that the third and fourth amplitudes in the four-stimulus condition were smaller than the responses in the two-stimulus condition (Fig. 6B,C). These results indicated that repeated stimuli induced a desensitization of the cGMP response. Conversely, in the four-stimulus condition, the level of reduction was almost the same. Therefore, to investigate whether further stimuli induced a further decrease of cGMP responses, we observed the tenth responses in the 10-stimulus experiments (Fig. 6D). The amplitude of tenth responses had no significance compared with the third responses. Therefore, we concluded that further stimuli did not induce additional reduction in this experimental procedure.
In the four-stimulus condition, the variation in the second response was almost the same as in later responses, so we hypothesized that the stimulus interval was important for determining response amplitudes. To investigate this, we applied two continuous stimuli to worms and changed the interval between them (Fig. 6E). As the intervals increased, the amplitudes of the normalized variations also increased, suggesting that the amplitudes of cGMP responses are dependent on the time intervals between stimuli.
cGMP responses were caused by relative changes in odor concentration
We showed previously that cGMP responses to an odor stimulus depended on the absolute concentration of odor (Fig. 1B,G). To determine whether cGMP responses were also dependent on relative concentrations, we measured cGMP responses to relative changes in odor (Fig. 7). In this experiment, odor flows began with concentrations ranging from 10−4 to 10−5 diluted IAA and then were switched to 10−4 diluted IAA. For odor concentrations ranging from 0.2 × 10⁻⁴ to 10−5 diluted IAA, cGMP responses to odor in both cilia and dendrites were detected in almost all worms, but at 0.5 × 10⁻⁴, worms showed no cGMP response. The number of animals responding and the amplitudes of their responses increased according to the magnitude of the relative changes in odor concentration. These results suggested that the cGMP responses are dependent, not only on the absolute concentration of odor, but also on relative changes in concentration.
Discussion
We used the genetically encoded cGMP sensor cGi500 to visualize compartmentalized cGMP responses in AWC sensory neurons. Imaging revealed that cGMP levels in cilia decreased transiently, whereas levels in dendrites and soma increased gradually during odor application. Compared with cGMP responses, Ca2+ responses were not compartmentalized, but Ca2+ levels in soma were dependent on the concentration of odor, consistent with the cGMP responses in soma. In addition, although cGMP responses to odor did not change with long-term exposure, repeated stimuli induced desensitization of cGMP responses corresponding to decreasing time intervals between two sequential stimuli. Finally, the amplitudes of the cGMP responses were dependent, not only on absolute concentration of odor, but also on changes in relative concentration.
In AWC sensory neurons of C. elegans, cGMP transduces sensory information (odor sensation) and regulates cellular function (odor adaptation) (de Bono and Maricq, 2005; Bargmann, 2006; O'Halloran et al., 2009, 2012). These previous studies suggested opposing cGMP responses to odor: in cilia, increased cGMP levels in response to odor sensation and decreased levels after odor adaptation. Our results indicated that these opposing cGMP responses to odor occur in a region-specific manner in AWC neurons simultaneously. In addition, these region-specific cGMP responses were explicitly separated in a single neuron (Fig. 1I). One possible mechanism for this compartmentalization is the distribution of phosphodiesterase or GC. We showed that ODR-1 and DAF-11 had different functions for cGMP regulation to odor stimulus. ODR-1 is localized to cilia of AWC neurons (L'Etoile and Bargmann, 2000), suggesting that it is crucial to sense odorants. Therefore, odr-1 mutants showed only slight cGMP responses in any parts of AWC. DAF-11 is distributed extensively throughout AWC (Birnby et al., 2000). Compared with the wild-type, daf-11 mutants did not show increases in cGMP in dendrites and soma upon odor addition, suggesting that DAF-11 could affect cGMP levels in dendrites and soma. In addition, because DAF-11 is thought to form a heterodimeric GC with ODR-1 (Morton, 2004), the deficit of DAF-11 also could influence the manner of cGMP decline in cilia. Because previous research assumed a localization in gas-sensing neurons as well (Couto et al., 2013), the distribution of proteins related to cGMP signaling pathways may determine region-specific cGMP responses to odor stimuli. Incidentally, these factors also might cause the different responses to IAA and Bz (Figs. 1, 2). Although sensing to both odors includes in cGMP signal pathways (L'Etoile and Bargmann, 2000), worms can distinguish two odors (Bargmann et al., 1993), so the components for sensing each odor might be distinct, leading to generating the different responses.
In the repeated stimuli experiments, continuous 10-time stimuli did not abolish the cGMP reduction in cilia (Fig. 6D). A previous report showed that continuous 1 s pulse stimulus of IAA reduced the amplitudes of Ca2+ responses in AWC to some extent at the beginning, but did not abolish the responses (Kato et al., 2014). This result also showed that worms might detect odor after repeated stimuli. Conversely, worms show chemotaxis by moving their heads and sensing gradients of odor (Pierce-Shimomura et al., 1999; Iino and Yoshida, 2009). Therefore, if repeated stimuli abolished responses completely, then worms could not detect the gradient of odor. Therefore, it is feasible that repeated stimuli do not abolish cGMP responses in cilia.
Compared with cGMP responses, Ca2+ responses were not compartmentalized in AWC neurons, but the changes after odor exposure were similar. The cGMP and Ca2+ responses in soma were dependent on odor concentration, but responses in dendrites were not (Figs. 1E,G, 3D,F, left graphs). In addition, the cGMP and Ca2+ responses to high odor concentration in cilia were different from low concentrations (Figs. 1C, 3B, right graphs). These results indicate a relationship between cGMP and Ca2+ in AWC neurons. This relationship between cGMP and Ca2+ is observed in vertebrate photoreceptor neurons and not in vertebrate olfactory neurons. In photoreceptor neurons, intracellular cGMP levels closely relate to Ca2+ levels (Kaupp and Seifert, 2002; Gross et al., 2015). In these neurons, decreases in Ca2+ activate GC and induce increases in cGMP levels consistent with the relationship between cGMP and Ca2+ in AWC neurons. Previous studies have also reported that AWC sensory neurons behave like vertebrate photoreceptor neurons (Chalasani et al., 2007). Therefore, our results further support the idea that the AWC neuron is analogous to a photoreceptor neuron.
Recent studies have shown compartmentalized neuronal activities in single neurons of C. elegans (Hendricks et al., 2012; Shidara et al., 2013). Here, we showed compartmentalized cGMP responses in AWC neurons. Although previous research on C. elegans has suggested that the increase or decrease in cGMP levels of the same neurons (Couto et al., 2013) could occur stochastically, our results suggest region-specific responses in single neurons. Compared with other studies using cGMP imaging (Sprenger and Nikolaev, 2013), these results are the first to our knowledge to show compartmentalized cGMP responses in single neurons in vivo.
Footnotes
This work was supported by the Japan Society for the Promotion of Science (Grant-in-Aid for JSPS Fellows Grant 14J06037) and the Ministry of Education, Science, Sports and Culture of Japan (Grant-in-Aid for Scientific Research on Innovative Areas Comprehensive Brain Science Network). We thank Prof. Viacheslav O. Nikolaev for the cGi500 plasmid. All strains were provided by the Caenorhabditis Genetics Center, which is funded by National Institutes of Health's Office of Research Infrastructure Programs (Grant P40 OD010440).
The authors declare no competing financial interests.
References
- Arora K, Sinha C, Zhang W, Ren A, Moon CS, Yarlagadda S, Naren AP (2013) Compartmentalization of cyclic nucleotide signaling: a question of when, where, and why? Pflugers Arch 465:1397–1407. 10.1007/s00424-013-1280-6 [DOI] [PMC free article] [PubMed] [Google Scholar]
- Bargmann CI. (2006) Chemosensation in C. elegans. WormBook 1–29. 10.1895/wormbook.1.123.1 [DOI] [PMC free article] [PubMed] [Google Scholar]
- Bargmann CI, Hartwieg E, Horvitz HR (1993) Odorant-selective genes and neurons mediate olfaction in C. elegans. Cell 74:515–527. 10.1016/0092-8674(93)80053-H [DOI] [PubMed] [Google Scholar]
- Birnby DA, Link EM, Vowels JJ, Tian H, Colacurcio PL, Thomas JH (2000) A transmembrane guanylyl cyclase (DAF-11) and Hsp90 (DAF-21) regulate a common set of chemosensory behaviors in Caenorhabditis elegans. Genetics 155:85–104. [DOI] [PMC free article] [PubMed] [Google Scholar]
- Chalasani SH, Chronis N, Tsunozaki M, Gray JM, Ramot D, Goodman MB, Bargmann CI (2007) Dissecting a circuit for olfactory behaviour in Caenorhabditis elegans. Nature 450:63–70. 10.1038/nature06292 [DOI] [PubMed] [Google Scholar]
- Chronis N, Zimmer M, Bargmann CI (2007) Microfluidics for in vivo imaging of neuronal and behavioral activity in Caenorhabditis elegans. Nat Methods 4:727–731. 10.1038/nmeth1075 [DOI] [PubMed] [Google Scholar]
- Couto A, Oda S, Nikolaev VO, Soltesz Z, de Bono M (2013) In vivo genetic dissection of O2-evoked cGMP dynamics in a Caenorhabditis elegans gas sensor. Proc Natl Acad Sci U S A 110:E3301–E3310. 10.1073/pnas.1217428110 [DOI] [PMC free article] [PubMed] [Google Scholar]
- de Bono M, Maricq AV (2005) Neuronal substrates of complex behaviors in C. elegans. Annu Rev Neurosci 28:451–501. 10.1146/annurev.neuro.27.070203.144259 [DOI] [PubMed] [Google Scholar]
- Fu Y, Yau KW (2007) Phototransduction in mouse rods and cones. Pflugers Arch 454:805–819. 10.1007/s00424-006-0194-y [DOI] [PMC free article] [PubMed] [Google Scholar]
- Gross OP, Pugh EN Jr, Burns ME (2015) cGMP in mouse rods: the spatiotemporal dynamics underlying single photon responses. Front Mol Neurosci 8:6. 10.3389/fnmol.2015.00006 [DOI] [PMC free article] [PubMed] [Google Scholar]
- Hendricks M, Ha H, Maffey N, Zhang Y (2012) Compartmentalized calcium dynamics in a C. elegans interneuron encode head movement. Nature 487:99–103. 10.1038/nature11081 [DOI] [PMC free article] [PubMed] [Google Scholar]
- Iino Y, Yoshida K (2009) Parallel use of two behavioral mechanisms for chemotaxis in Caenorhabditis elegans. J Neurosci 29:5370–5380. 10.1523/JNEUROSCI.3633-08.2009 [DOI] [PMC free article] [PubMed] [Google Scholar]
- Kato S, Xu Y, Cho CE, Abbott LF, Bargmann CI (2014) Temporal responses of C. elegans chemosensory neurons are preserved in behavioral dynamics. Neuron 81:616–628. 10.1016/j.neuron.2013.11.020 [DOI] [PMC free article] [PubMed] [Google Scholar]
- Kaupp UB, Seifert R (2002) Cyclic nucleotide-gated ion channels. Physiol Rev 82:769–824. 10.1152/physrev.00008.2002 [DOI] [PubMed] [Google Scholar]
- Kots AY, Martin E, Sharina IG, Murad F (2009) A short history of cGMP, guanylyl cyclases, and cGMP-dependent protein kinases. Handb Exp Pharmacol 191:1–14. 10.1007/978-3-540-68964-5_1 [DOI] [PMC free article] [PubMed] [Google Scholar]
- Lee JI, O'Halloran DM, Eastham-Anderson J, Juang BT, Kaye JA, Scott Hamilton O, Lesch B, Goga A, L'Etoile ND (2010) Nuclear entry of a cGMP-dependent kinase converts transient into long-lasting olfactory adaptation. Proc Natl Acad Sci U S A 107:6016–6021. 10.1073/pnas.1000866107 [DOI] [PMC free article] [PubMed] [Google Scholar]
- Leinwand SG, Chalasani SH (2013) Neuropeptide signaling remodels chemosensory circuit composition in Caenorhabditis elegans. Nat Neurosci 16:1461–1467. 10.1038/nn.3511 [DOI] [PMC free article] [PubMed] [Google Scholar]
- L'Etoile ND, Bargmann CI (2000) Olfaction and odor discrimination are mediated by the C. elegans guanylyl cyclase ODR-1. Neuron 25:575–586. 10.1016/S0896-6273(00)81061-2 [DOI] [PubMed] [Google Scholar]
- L'Etoile ND, Coburn CM, Eastham J, Kistler A, Gallegos G, Bargmann CI (2002) The cyclic GMP-dependent protein kinase EGL-4 regulates olfactory adaptation in C. elegans. Neuron 36:1079–1089. 10.1016/S0896-6273(02)01066-8 [DOI] [PubMed] [Google Scholar]
- McCormick K, Baillie GS (2014) Compartmentalisation of second messenger signalling pathways. Curr Opin Genet Dev 27:20–25. 10.1016/j.gde.2014.02.001 [DOI] [PubMed] [Google Scholar]
- Morton DB. (2004) Invertebrates yield a plethora of atypical guanylyl cyclases. Mol Neurobiol 29:97–116. 10.1385/MN:29:2:097 [DOI] [PubMed] [Google Scholar]
- Niino Y, Hotta K, Oka K (2009) Simultaneous live cell imaging using dual FRET sensors with a single excitation light. PLoS One 4:e6036. 10.1371/journal.pone.0006036 [DOI] [PMC free article] [PubMed] [Google Scholar]
- Niino Y, Hotta K, Oka K (2010) Blue fluorescent cGMP sensor for multiparameter fluorescence imaging. PLoS One 5:e9164. 10.1371/journal.pone.0009164 [DOI] [PMC free article] [PubMed] [Google Scholar]
- Nikonov S, Lamb TD, Pugh EN Jr (2000) The role of steady phosphodiesterase activity in the kinetics and sensitivity of the light-adapted salamander rod photoresponse. J Gen Physiol 116:795–824. 10.1085/jgp.116.6.795 [DOI] [PMC free article] [PubMed] [Google Scholar]
- O'Halloran DM, Altshuler-Keylin S, Lee JI, L'Etoile ND (2009) Regulators of AWC-mediated olfactory plasticity in Caenorhabditis elegans. PLoS Genet 5:e1000761. 10.1371/journal.pgen.1000761 [DOI] [PMC free article] [PubMed] [Google Scholar]
- O'Halloran DM, Hamilton OS, Lee JI, Gallegos M, L'Etoile ND (2012) Changes in cGMP levels affect the localization of EGL-4 in AWC in Caenorhabditis elegans. PLoS One 7:e31614. 10.1371/journal.pone.0031614 [DOI] [PMC free article] [PubMed] [Google Scholar]
- Pierce-Shimomura JT, Morse TM, Lockery SR (1999) The fundamental role of pirouettes in Caenorhabditis elegans chemotaxis. J Neurosci 19:9557–9569. [DOI] [PMC free article] [PubMed] [Google Scholar]
- Russwurm M, Mullershausen F, Friebe A, Jäger R, Russwurm C, Koesling D (2007) Design of fluorescence resonance energy transfer (FRET)-based cGMP indicators: a systematic approach. Biochem J 407:69–77. 10.1042/BJ20070348 [DOI] [PMC free article] [PubMed] [Google Scholar]
- Shidara H, Kobayashi J, Tanamoto R, Hotta K, Oka K (2013) Odorant-induced membrane potential depolarization of AIY interneuron in Caenorhabditis elegans. Neurosci Lett 541:199–203. 10.1016/j.neulet.2013.02.016 [DOI] [PubMed] [Google Scholar]
- Sprenger JU, Nikolaev VO (2013) Biophysical techniques for detection of cAMP and cGMP in living cells. Int J Mol Sci 14:8025–8046. 10.3390/ijms14048025 [DOI] [PMC free article] [PubMed] [Google Scholar]
- Taniguchi G, Uozumi T, Kiriyama K, Kamizaki T, Hirotsu T (2014) Screening of odor-receptor pairs in Caenorhabditis elegans reveals different receptors for high and low odor concentrations. Sci Signal 7:ra39. 10.1126/scisignal.2005136 [DOI] [PubMed] [Google Scholar]
- Yoshida K, Hirotsu T, Tagawa T, Oda S, Wakabayashi T, Iino Y, Ishihara T (2012) Odour concentration-dependent olfactory preference change in C. elegans. Nat Commun 3:739. 10.1038/ncomms1750 [DOI] [PubMed] [Google Scholar]
- Zhao Y, Araki S, Wu J, Teramoto T, Chang YF, Nakano M, Abdelfattah AS, Fujiwara M, Ishihara T, Nagai T, Campbell RE (2011) An expanded palette of genetically encoded Ca2+ indicators. Science 333:1888–1891. 10.1126/science.1208592 [DOI] [PMC free article] [PubMed] [Google Scholar]
- Zufall F, Leinders-Zufall T (2000) The cellular and molecular basis of odor adaptation. Chem Senses 25:473–481. 10.1093/chemse/25.4.473 [DOI] [PubMed] [Google Scholar]


