

Abstract
MicroRNAs (miRNA) play an important role in post-transcriptional gene regulation of several physiological and pathological processes. In multiple sclerosis (MS), a chronic inflammatory and degenerative disease of the CNS, and in its mouse model, the experimental autoimmune encephalomyelitis (EAE), miRNA dysregulation has been mainly related to immune system dysfunction and white matter (WM) pathology. However, little is known about their role in gray matter pathology. Here, we explored miRNA involvement in the inflammation-driven alterations of synaptic structure and function, collectively known as synaptopathy, a neuropathological process contributing to excitotoxic neurodegeneration in MS/EAE. Particularly, we observed that miR-142-3p is increased in the CSF of patients with active MS and in EAE brains. We propose miR-142-3p as a molecular mediator of the IL-1β-dependent downregulation of the glial glutamate-aspartate transporter (GLAST), which causes an enhancement of the glutamatergic transmission in the EAE cerebellum. The synaptic abnormalities mediated by IL-1β and the clinical and neuropathological manifestations of EAE disappeared in miR-142 knock-out mice. Furthermore, we observed that in vivo miR-142-3p inhibition, either by a preventive and local treatment or by a therapeutic and systemic strategy, abolished IL-1β- and GLAST-dependent synaptopathy in EAE wild-type mice. Consistently, miR-142-3p was responsible for the glutamatergic synaptic alterations caused by CSF of patients with MS, and CSF levels of miR-142-3p correlated with prospective MS disease progression. Our findings highlight miR-142-3p as key molecular player in IL-1β-mediated synaptic dysfunction, possibly leading to excitotoxic damage in both EAE and MS diseases. Inhibition of miR-142-3p could be neuroprotective in MS.
SIGNIFICANCE STATEMENT Current studies suggest the role of glutamate excitotoxicity in the development and progression of multiple sclerosis (MS) and of its mouse model experimental autoimmune encephalomyelitis (EAE). The molecular mechanisms linking inflammation and synaptic alterations in MS/EAE are still unknown. Here, we identified miR-142-3p as a determinant molecular actor in inflammation-dependent synaptopathy typical of both MS and EAE. miR-142-3p was upregulated in the CSF of MS patients and in EAE cerebellum. Inhibition of miR-142-3p, locally in EAE brain and in a MS chimeric ex vivo model, recovered glutamatergic synaptic enhancement typical of EAE/MS. We proved that miR-142-3p promoted the IL-1β-dependent glutamate dysfunction by targeting glutamate-aspartate transporter (GLAST), a crucial glial transporter involved in glutamate homeostasis. Finally, we suggest miR-142-3p as a negative prognostic factor in patients with relapsing-remitting multiple sclerosis.
Keywords: CSF, experimental autoimmune encephalomyelitis, glial glutamate transporter, glutamate excitotoxicity, microRNA, multiple sclerosis
Introduction
Gray matter pathology underlies the development of disability in multiple sclerosis (MS). It reflects a combination of demyelination, neuronal loss/atrophy, neurite transection, and reduced synapses or glial density (Wegner et al., 2006; Compston and Coles, 2008; Chard and Miller, 2009; Siffrin et al., 2010; Dutta et al., 2011; Geurts et al., 2012; Ciccarelli et al., 2014). Imbalance between glutamatergic and GABAergic transmission occurs in MS and in its animal model experimental autoimmune encephalomyelitis (EAE), representing a possible cause of excitotoxic damage (Sarchielli et al., 2003; Clements et al., 2008; Centonze et al., 2009; Bhat et al., 2010; Rossi et al., 2011, 2012b, Mandolesi et al., 2012, 2013; Kostic et al., 2013; Azevedo et al., 2014; Ciccarelli et al., 2014; for review see Mandolesi et al., 2015). Inflammatory cytokines, released from infiltrating T cells and from activated microglia and astroglia, participate in such synaptic and neuronal alterations (Centonze et al., 2009; Mandolesi et al., 2012, 2013, 2015; Rossi et al., 2012a; Steinman, 2013; Mori et al., 2014), which are ongoing processes largely independent of axonal demyelination and transection. Because synaptic dysfunction and loss are reversible, targeting mechanisms that protect or repair synapses would enable clinical interventions at both early and late stages of MS (Mandolesi et al., 2015).
The molecular mechanisms at the basis of inflammation-driven synaptopathy are largely elusive. Small noncoding microRNAs (miRNAs) regulate several physiological and pathological processes by repressing post-transcriptionally target messenger RNAs (mRNAs) (Bartel, 2009), and are good candidates in the inflammatory synaptic damage (Ceman and Saugstad, 2011). Significant changes of miRNA expression profiles have been detected in blood cells of patients with MS and in lesions of the white matter (WM) both in MS and in EAE (Junker et al., 2011; Angerstein et al., 2012; Lescher et al., 2012; Thamilarasan et al., 2012; Ode et al., 2013; Gandhi, 2015). Recently, profiling of miRNAs has been explored also in the CSF of MS patients (Haghikia et al., 2012; Bergman et al., 2016), as potential diagnostic marker. Dysregulated miRNAs have been associated with astrocyte activation and infiltrating immune cells in WM lesions (Junker et al., 2011; Ode et al., 2013; Ma et al., 2014), and it has also been observed that demyelination affects neuronal miRNAs in MS hippocampus (Dutta et al., 2013).
However, direct proof of the involvement of miRNAs on MS neurodegenerative processes, which occur independently of demyelination, is still lacking. Recently, we provided in vivo evidence of defective glutamate uptake and excitotoxic damage in the EAE cerebellum, a pathological process dependent on IL-1β signaling (Mandolesi et al., 2013). Because altered glutamate homeostasis contributes to the neurodegenerative damage in both MS and EAE (Mandolesi et al., 2015), here we investigated miRNA dysregulation as a possible key determinant of synaptic dysfunction associated with inflammatory insults in these diseases.
Materials and Methods
Mice.
Female wild-type (WT) C57BL/6 mice (kindly provided by European Mouse Mutant Archive, EMMA, Monterotondo Rome, Italy) and miR-142-deficient C57BL/6 LacZ gene knock-in mice (miR-142 KO) (Mildner et al., 2013) with the relative WT female littermates were used for the experiments. Mice were housed under constant conditions in an animal facility with a regular 12 h light/dark cycle. Food and water were supplied ad libitum. All the efforts were made to minimize the number of animals used and their suffering. In particular, when animals experienced hindlimb weakness, moistened food and water were made easily accessible to the animals on the cage floor. Mice with hindlimb paresis received glucose solution by subcutaneous injection or food by gavage during the entire procedure. In the rare presence of a tetraparalyzed animal, death was provided. Animal experiments were performed according to the Internal Institutional Review Committee, the European Directive 2010/63/EU and the European Recommendations 526/2007, and the Italian D.Lgs 26/2014.
EAE induction and EAE symptom evaluation.
EAE was induced in 6- to 8-week-old mice by active immunization with an emulsion of myelin oligodendrocyte glycoprotein peptide 35–55 (MOG35–55) in Complete Freund's Adjuvant (CFA), followed by intravenous administration of pertussis toxin (500 ng) on the day of immunization and 2 d later (Centonze et al., 2009; Mandolesi et al., 2012, 2013). Control animals received the same treatment as EAE mice without the immunogen MOG peptide (referred to as hereafter as “CFA”). Animals were scored daily for clinical symptoms of EAE according to the following scale: 0 = no clinical signs; 1 = flaccid tail; 2 = hindlimb weakness; 3 = hindlimb paresis; 4 = tetraparalysis; and 5 = death due to EAE; intermediate clinical signs were scored by adding 0.5. For each animal, the onset day was recorded as the day post immunization (dpi) when it showed the first clinical manifestations (score > 0). All experiments were performed at the acute phase of the disease (20–28 dpi).
Whole-cerebellum RNA extraction, miRNA profiling, and qRT-PCR.
Total RNA was extracted from EAE and CFA cerebella according to the standard miRNeasy Mini kit protocol (QIAGEN). Next, dual-color microarray experiments (Exiqon) were performed (n = 2, 21 dpi) as previously described (Mannironi et al., 2013). To validate microarray results, qRT-PCR analysis was performed (4 or 5 mice per group, 21 dpi). A total of 250 ng of total RNA was reverse-transcribed using miScript II RT Kit (QIAGEN) according to the manufacturer's instructions, and 1 ng of cDNA was amplified with miScript SYBR Green PCR Kit (QIAGEN) in triplicate using the 7900HT Fast Real Time PCR system (Applied Biosystems). miRNA relative quantification was performed using the comparative cycle threshold (2−ΔΔCt) method. U6B was used as endogenous control. miScript Universal Primer, and specific primers targeting the RNA of interest were provided by QIAGEN (U6B miScript Primer Assay, catalog #MS00029204; miR-142-3p miScript Primer Assay, catalog #MS00006055). For Slc1a3 mRNA quantification, 15 ng of the same cDNA was amplified with SensiMix SYBR Hi-Rox kit (Bioline, Meridian Life Science) and β-actin was used as internal control. Primer sequences were as follows: Actb (NM_007393): CCTAGCACCATGAAGATCAAGATCA (sense), AAGCCATGCCAATGTTGTCTCT (antisense); and Slc1a3 (NM_148938): GCAGTGGACTGGTTTCTGGACC (sense), ACGGGTTTCTCCGGTTCATT (antisense).
CD3+ cell isolation, RNA extraction, and qRT-PCR.
T lymphocytes were isolated from the spleens of 5 EAE and 6 CFA mice using magnetic cell sorting separation (CD3 microbeads kit; Miltenyi Biotec), as in Mandolesi et al. (2013). After total RNA extraction by MiRNeasy Micro kit (QIAGEN) according to the manufacturer's instructions, qRT-PCR was performed as described for murine cerebellum.
Cytokine treatments in glial cells, RNA extraction, and qRT-PCR.
Primary glial cultures were obtained from dissociated cerebella of newborn WT mice (postnatal days 4–5). Cells were plated in low glucose DMEM (catalog #BE12–707F, Lonza) supplemented with 10% heat-inactivated FBS (catalog #SH30071.03, Hyclone, Thermo Scientific), 2 mm glutamine (catalog #25030–032, Invitrogen), 50 U/ml penicillin and 50 μg/ml streptomycin (catalog #15070–063, Invitrogen), on 10 cm dishes (Falcon) coated with poly-l-lysine (P2636, Sigma-Aldrich), and were cultured in a 5% CO2-humidified incubator at 37°C. Glial cells were expanded for 12–14 d; and the day before the experiment, 3 × 10⁵ cells/well were plated on poly-l-lysine coated 6-multiwell plates (Falcon). Then, cells were treated with IL-1β (30 ng/ml, R&D Systems), TNF (10 ng/ml, R&D Systems), LPS (100 ng/ml, Sigma), or vehicle for 24 h before harvest in Qiazol (QIAGEN). Total RNA was extracted by miRNeasy Mini kit (QIAGEN), and miR-142-3p expression was evaluated using miR-142-3p TaqMan miRNA assay (catalog #000464) and TaqMan miRNA Reverse Transcription Kit according to the manufacturer's instructions (Applied Biosystems). Each reaction of amplification was performed in triplicates with SensiMix SYBR II Probe Hi-Rox Kit (Bioline, Meridian Life Science); data, normalized to U6B snRNA and control samples, are represented as 2−ΔΔCt.
Primary glial cells were properly activated in each experimental condition as demonstrated by qRT-PCR analysis of miR-146a-5p levels (TaqMan microRNA assay, catalog #000468) and quantification of IL-1β, TNF, IL-6 mRNAs (High-Capacity cDNA Reverse Transcription Kit, Applied Biosystems; SensiMix SYBR Hi-Rox kit, Bioline, Meridian Life Science), all indicators of an inflammatory response (data not shown; n = 4 for each experimental conditions; p < 0.001, unpaired Student's t test). Primer sequences were as follows: IL-1β (NM_008361): GGACCTTCCAGGATGAGGACAT (sense), GCTCATGGAGAATATCACTTGTTGG (antisense); IL-6 (NM_031168): AAGAGTTGTGCAATGGCAATTCT (sense), TCCAGTTTGGTAGCATCCATCA (antisense); and TNF (NM_013693): CCTCTTCTCATTCCTGCTTGTGG (sense), ACTTGGTGGTTTGCTACGACG (antisense).
The BV2 immortalized murine microglial cells were cultured in complete DMEM (catalog #61965-026, Invitrogen) at 37°C in 5% CO2 and were plated 8 × 10⁵ per well in 6-multiwell plates (Falcon) for the 24 h treatment with IL-1β, TNF, or LPS. miR-142-3p quantification was performed as in primary glial cells.
RNA ISH and immunohistochemistry.
Cerebella were collected, fresh frozen in OCT, and sectioned at 20 μm onto Superfrost Plus slides. ISH was performed using LNA probes complementary to miR-142-3p and labeled with digoxigenin at both 3′ and 5′ ends (catalog #88086-15, Exiqon). Hybridizations with LNA Scramble-miR probe (catalog #99004-15, Exiqon) were used as negative control. Briefly, sections were fixed in 4% PFA, digested with proteinase K for 6 min, acetylated, and hybridized with the probes in 50% formamide, 5× SSC, 5× Denhardt's solution, 500 μg/ml salmon sperm DNA, and 250 μg/ml tRNA overnight at 52°C. After posthybridization washes with 50% formamide, 2× SSC at 50°C, and 2× SSC at ambient temperature, sections were blocked and incubated overnight with mouse anti-digoxigenin-AP (1:1000, Roche), and signal was visualized using BCIP/NBT. The sections were then incubated with rabbit anti-Iba1 (1:500, Wako), mouse anti-GFAP (1:400, Millipore), or rat anti-CD3 (1:400, Bio-Rad), detected with DAB using peroxidase-labeled secondary antibodies (Vector Laboratories; ABC HRP kits) for cerebellar sections. ISH was performed similarly for primary glial cell cultures, where donkey anti-mouse Alexa-488 or anti-rabbit Cy3 was used to detect for GFAP and Iba-1, respectively. Images were acquired with a Stereo Investigator System (MicroBrightField), composed of a Zeiss Axioimager.M2 microscope and Stereo Investigator software package System (MicroBrightField), using 4× and 10× objectives and saved in TIFF format.
Patient recruitment and CSF withdrawal.
After patient admittance at the Neurology Clinic of the University Hospital Tor Vergata of Rome, neurological assessment, brain MRI scan, and CSF withdrawal were performed in sequence, within 24 h, according to standard clinical practice. Thirty patients with relapsing-remitting multiple sclerosis (RRMS) (age: 36.5 ± 2.0 years; female/male: 21/9) were recruited in the study, according to the following inclusion criteria: diagnosis of RRMS according to the 2010 revision of McDonald criteria (Polman et al., 2011); age comprised between 18 and 60 years (inclusive); no immunomodulatory or immunosuppressive treatment before the CSF withdrawal; and ability to provide written informed consent.
Exclusion criteria were as follows: comorbidities for neurological diseases other than MS (i.e., Parkinson disease, Alzheimer disease, stroke); and history or presence of any unstable medical condition, such as malignancy or infection.
Eighteen patients with RRMS (age: 32.1 ± 2.4 years; female/male: 15/3) showed active inflammatory brain lesions measured using gadolinium (Gd)-enhanced brain MRI or clinical signs indicative of an acute relapse (active RRMS). The remaining 12 patients with RRMS (age 43.2 ± 2.3 years; female/male: 6/6) did not show any neuroradiological or clinical signs/symptoms indicative of ongoing brain inflammation (nonactive RRMS). Disease duration was estimated as the number of years from onset to the most recent assessment of disability (active MS: 4.8 ± 1.3 years; nonactive MS: 8.8 ± 1.2 years). Disability was certified by a qualified neurologist using the Expanded Disability Status Scale (EDSS; active-RRMS: 1.8 ± 0.2; nonactive RRMS: 1.7 ± 0.3). In a subgroup of 21 patients with RRMS who returned to scheduled follow-up visits, the EDSS score, evaluated 2–5 years after diagnosis, was combined with disease duration to calculate the Progression Index (= EDSS/disease duration). As controls, we recruited 12 age- and sex-matched subjects (age: 37.3 ± 3.8 years; female/male: 9/3) who underwent lumbar puncture because of a clinical suspicion of acute peripheral neuropathy, meningitis, or subarachnoidal hemorrhage, which were not confirmed.
The study was approved by the institutional review board and followed the principles of the declaration of Helsinki. All study participants gave their written informed consent to the study.
RNA extraction from human CSF and miR-142-3p quantification.
After the collection of CSF samples (0.5–2 ml), cellular elements were removed immediately by centrifugation (1300 rpm, 10 min) and supernatants were stored at −80°C. Hemorrhagic CSFs were not included. Total RNA was extracted from 200 μl of CSF using mirVana PARIS kit (Ambion, Invitrogen), according to Burgos et al. (2013). A total of 1 μg of carrier RNA (MS2 RNA) and 0.02 fmol of synthetic spike-in (cel-miR-39-3p) were added before extraction, respectively, to increase RNA yield and to control efficiency of both extraction and qRT-PCR, as recommended by Exiqon for subsequent applications. Then, miRNA levels were detected using miRCURY LNA Universal RT microRNA PCR system (Exiqon) according to the manufacturer's protocol on a 7900HT Fast Real Time PCR system (Applied Biosystems, Invitrogen). miR-142-3p values were normalized to spiked-in cel-miR-39–3p (Haghikia et al., 2012; Freischmidt et al., 2013, 2014; Sohn et al., 2015; Ahlbrecht et al., 2016) by the ΔCt calculation.
miR-142-3p target prediction.
Prediction analysis of the miR-142-3p was done using three prediction algorithms: microT version 3.0 (http://diana.imis.athena-innovation.gr/DianaTools/index.php?r=microT_CDS/index), TargetScan 5.2 (www.targetscan.org), and PicTar (http://pictar.mdc-berlin.de). Candidate genes identified by at least two algorithms were analyzed by DAVID 6.7 (http://david.abcc.ncifcrf.gov/) for functional annotation and clustering, tissue expression, and pathway assignment. Identification of Slc1a3 as potential target of miR-142-3p was done by microT version 3.0 and TargetScan 5.2.
Plasmids and luciferase assays.
miR-142 overexpression plasmid (pU1-miR-142/CMV-GFP) was generated by adding the U1 snRNA expression cassette to lentiviral vector p207.pRRLsinPPTs.hCMV.GFP.WPRE (p207, kindly provided by Prof. Naldini) and by cloning a fragment of the pri-miR-142 into the U1 cassette (Denti et al., 2004), thanks to Sigma-Aldrich's Gene Synthesis Services. The dual-luciferase control plasmid (Luc, catalog #CMIT000001-MT01) and the dual-luciferase vector bearing the full-length 3′-UTR of Slc1a3 mRNA (NM_148938) downstream the Firefly luciferase gene (Luc-3′-UTR WT) were purchased from GeneCopoeia. Mutated Slc1a3 3′UTR plasmid (Luc-3′-UTR MUT) was generated by the substitution of three nucleotides pairing to miR-142-3p seed: WT binding site, 5′-ACACUAC-3′; mutated binding site, 5′-ACUACAC-3′(Sigma-Aldrich).
We cultured HEK293T cells in DMEM (catalog #41966-029, Invitrogen) containing 10% FBS (catalog #SH30071.03, Hyclone, Thermo Scientific), 100 U/ml penicillin G, and 100 mg/ml streptomycin (catalog #15070-063 Invitrogen) at 37°C in 5% CO2. The day before transfection, cells were plated 1.2 × 10⁵ per well in 24-multiwell plates (Falcon). A total of 50 ng of the luciferase constructs (Luc, Luc-3′-UTR WT or Luc-3′-UTR MUT) together with 450 ng of the vector driving the miR-142 expression (pU1-miR-142) or the empty vector were transfected by 1 μl of Lipofectamine 2000 (Invitrogen) in HEK293T cells. After 48 h, cells were lysed and luciferase activities were measured with the Dual Luciferase Reporter Assay System (Promega). Six biological replicates were performed and each Firefly luciferase reading results normalized to Renilla luciferase activity.
LNA anti-miR-142-3p in vivo treatments.
Two in vivo delivery strategies were adopted to inhibit miR-142-3p action by antisense LNA/DNA oligonucleotides with phosphorothioate modifications. Preventive (starting 1 week before the immunization) and intracerebroventricular administration of LNA anti-miR-142-3p (catalog #426804, Exiqon) was performed by implantation of subcutaneous Alzet osmotic minipumps (Mandolesi et al., 2013), which allowed the continuous intracranial infusion of the drug (29.8 pmol/d; total amount 0.295 mg/kg) for 4 weeks. Mice administered with LNA scramble (catalog #1990020, Exiqon) were used as controls. Two independent immunizations were performed (at least 8 mice per group/immunization). The therapeutic and systemic delivery of LNA anti-miR-142-3p (AAGTAGGAAACACTAC, Exiqon large-scale synthesis) or scrambled control (ACGTCTATACGCCCA, Exiqon large-scale synthesis) was performed by intravenous injections of 14 mg/kg every 4 d (Stenvang et al., 2012), starting from the onset of the EAE disease (score ≥ 0.5). All mice (7 per group) received at least four intravenous injections and were killed within 24 h after the last dose (total amount 56 mg/kg).
Electrophysiology.
Mice were killed by cervical dislocation, and cerebellar parasagittal slices (210 μm) were prepared from fresh cerebellum using a vibratome (for details see Mandolesi et al., 2013). Briefly, after 1 h of recovery time in a chamber containing oxygenated ACSF, spontaneous EPSCs were recorded from Purkinje cells (PCs) by means of whole cell patch-clamp technique in the presence of bicuculline (Mandolesi et al., 2013). When specified, IL-1β (30 ng/ml) was applied in the bathing ACSF (Mandolesi et al., 2013). In some experiments, cerebellar slices were incubated in the presence of murine EAE CD3+ lymphocytes (Mandolesi et al., 2013) or human CSFs and miR-142-3p inhibitor (for details, see specific section). Spontaneous synaptic event recording, data storing, and analysis were performed as described by Mandolesi et al. (2013). One to six cells per animal were recorded. Two to five animals per group were used.
Immunofluorescence and imaging analysis.
The immunofluorescence experiments were performed on mice at the peak of the EAE (21 dpi, score ≥ 2) from at least two different immunization experiments, similarly to Mandolesi et al. (2013). The following primary antibodies were used overnight at 4°C in Triton X-100 0.25%: rat anti-CD3 (1:250, AbD Serotec), goat anti-IL-1β (1:200; R&D Systems), and rabbit anti-Iba1 (1:750 for cerebellar section; Wako). The appropriate mix of secondary antibodies was used (1:200) at room temperature for 2 h: AlexaFluor-488 or AlexaFluor-647-conjugated donkey anti-goat (1:200; Invitrogen) and AlexaFluor-488- or Cy3-conjugated donkey anti-rabbit or anti-rat (1:200; Jackson ImmunoResearch Laboratories). All images were acquired using an LSM7 Zeiss confocal laser-scanner microscope (Zeiss) with a 20× (zoom 0.5×) or 63× (oil, NA: 1.4; zoom: 0.5×, z-step: 1 μm) objectives for cerebellar sections. For glial cultures we used a 20× (1.5× zoom, single section) and 100× (oil, NA 1.3, zoom 1×, z-step: 1 μm) objectives. All images had a pixel resolution of 1024 × 1024. The confocal pinhole was kept at 1.0, the gain and the offset were lowered to prevent saturation in the brightest signals, and sequential scanning for each channel was performed. z-stacks images were acquired, z-projected, and exported in TIFF file format and adjusted for brightness and contrast as needed by National Institutes of Health ImageJ software. Smooth filter was used to reduce noise on stacks and z-projections. All qualitative analyses were performed on at least 4 images acquired from at least 4 serial sections per animal, from at least two independent experiments (Mandolesi et al., 2013).
IL-1β incubation on cerebellar slices for miR-142-3p quantification and Western blot (WB) analysis.
IL-1β (30 ng/ml, R&D Systems) or vehicle was incubated for 10 min on fresh cerebellar slices, prepared as for electrophysiological experiments. After total RNA extraction by miRNeasy Micro kit (QIAGEN), miR-142-3p expression was evaluated in treated cerebellar slices from 4 mice, as reported for glial cells. For WB experiments, IL-1β-incubated cerebellar slices from 1 WT mouse and 3 miR-142 KO mice were homogenized in RIPA buffer plus protease inhibitor mixture (Sigma) and sonicated. After quantification (Mandolesi et al., 2013), proteins were separated by electrophoresis on 10% SDS-polyacrylamide gel and transferred onto nitrocellulose membranes (Protran; Whatman). Membrane was probed with antibodies against glutamate-aspartate transporter (GLAST, 1:5000; Abcam) or β-actin (1:20,000; Sigma) at room temperature for 30 min or 1 h, respectively, and incubated with peroxidase-labeled antibodies followed by visualization with ECL reagent (GE Healthcare). Densitometric analysis of protein levels was performed with ImageJ software (http://rsb.info.nih.gov/ij/). WB results were presented as data normalized to control values.
Incubation of human CSF on cerebellar slices and electrophysiology.
A pool of miR-142-3p-high-level CSFs, collected from 10 active RRMS patients, was incubated for 1h on cerebellar parasagittal slices prepared from healthy mice and used for electrophysiological experiments. Patch-clamp technique in whole-cell configuration was performed on PCs to record sEPSC (as described in the electrophysiology method section and in Mandolesi et al., 2013) in a solution composed by ACSF and CSF in ratio 1:1 at room temperature (Rossi et al., 2012a). To assess miR-142-3p electrophysiological effects, LNA anti-miR-142-3p was preincubated for 1 h with pooled miR-142-3p-high-level CSFs before performing electrophysiological recordings.
Statistical analysis.
We performed all statistical analyses with Prism GraphPad 6.0 and IBM SPSS Statistics 15.0. Data distribution was tested for normality by using Kolmogorov–Smirnov test and Shapiro–Wilk test. Differences between two groups were analyzed using two-tailed Student's t test, Wilcoxon's test, Mann–Whitney U test, Fisher's exact test, or log-rank test, as appropriate. Multiple comparisons were performed by ANOVA followed by Tukey HSD or by Kruskal–Wallis test followed by Mann–Whitney test. To determine whether two cumulative distributions of spontaneous synaptic activity were significantly different, the Kolmogorov–Smirnov test was used. The relationships between miR-142-3p CSF levels and demographic or clinical parameters were explored through Spearman correlation analysis. Data were presented as the mean ± SEM, except when it is specified differently. The significance level is established at p < 0.05.
Results
miR-142-3p is highly expressed in the cerebellum of EAE mice
First, we examined global miRNA expression in the cerebellum of mice with MOG35–55-EAE (21 dpi; when clinical signs were evident, score ≥ 2.5) by means of two-color microarray experiments. The hybridization of total RNA to a LNA platform allowed us to detect 182 miRNAs in our samples. As shown in Figure 1A, miRNA expression profile was altered in EAE cerebellum, indicating three increased (log2-ratio > 0.5) and three decreased miRNAs (log2-ratio < −0.5) compared with controls (CFA). Among miRNAs positively regulated, we found miR-142-3p as the most induced miRNA in EAE cerebella (log2-ratio = 1.14). Next, to obtain a further quantitative analysis, we performed qRT-PCR analysis of miR-142-3p on a larger sample of mice. As shown in Figure 1B, miR-142-3p was significantly upregulated of approximately sevenfold in EAE compared with CFA mice (p = 0.011), validating the array data.
Figure 1.
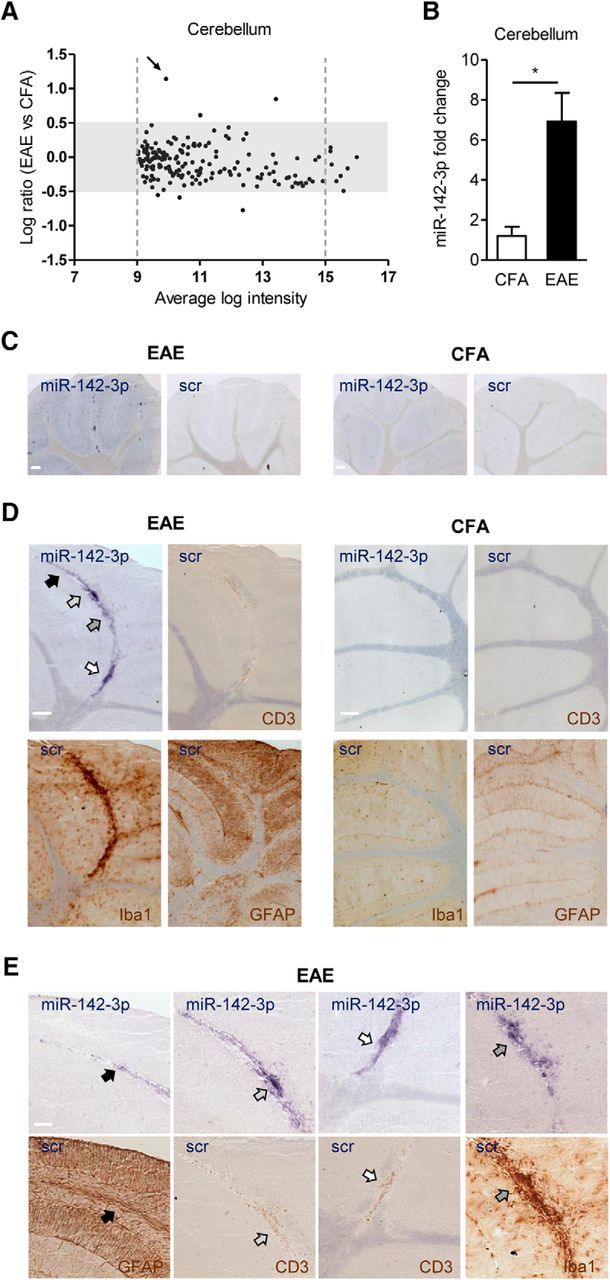
miR-142-3p is highly expressed in the EAE cerebellum, in particular in the inflammatory lesions of the WM. A, Two-color microarray analysis of miRNA differential expression in the EAE cerebellum (n = 2, 21 dpi). The plot represents relative change values, expressed as log2-ratio (EAE vs CFA), plotted against average log intensity ((log2Hy5 + log2Hy3)/2). Only miRNAs with 9 < log intensity < 15 (into the dotted gray lines) and with a log2-ratio > 0.5 or < −0.5 (out of the gray rectangle) were considered, to avoid nonlinear effects caused by the noise floor at low intensities or by saturation at high intensities. Black arrow indicates miR-142-3p in the plot. B, miR-142-3p quantification by qRT-PCR in the EAE cerebellum (CFA, n = 4; EAE, n = 5). Data were normalized to U6B by ΔΔCt calculation (mean ± SEM vs controls). *p < 0.05 (unpaired t test). C–E, ISH with miR-142-3p probe in sagittal cerebellar sections of both EAE and CFA mice. C, Low magnification of cerebellar slices derived from EAE and CFA showing ISH with miR-142-3p probe and with scramble (scr) probe. Of note, miR-142-3p staining was prominent in EAE relative to CFA slices, whereas scr staining on adjacent slices was almost undetectable. D, High magnification of cerebellar lobules showing higher ISH reactivity of miR-142-3p (blue) in WM lesions of EAE cerebellum compared with CFA (top left panels, respectively). The adjacent serial sections in each experimental group represent immunostaining (brown) of infiltrating lymphocytes (CD3, top right), microglial cells (Iba1, bottom left), and astroglial cells (GFAP, bottom right). A remarkable inflammatory reaction is evident in the WM lesions of EAE compared with CFA mice. Negative controls with scr probe have been included. E, Higher magnifications of D reveal that in EAE cerebellum miR-142-3p is enriched in proximity of positive immunostaining (brown) for CD3, Iba1, and GFAP, as indicated by arrows in the adjacent serial sections of EAE mice. Scale bars: C, D, 200 μm; E, 100 μm.
In principle, this altered miRNA expression profile might reflect the presence of infiltrating immune cells, changes in brain resident cells, or both. To investigate this aspect, we performed ISH of miR-142-3p and scramble (scr) probes on cerebellar slices of both EAE and control mice. As shown in Figure 1C, the ISH reaction product specific of miR-142-3p was evident in most of the cerebellar layers with more intense localization in the WM of EAE compared with CFA. Conversely, the scr probe was almost undetectable in the adjacent serial cerebellar sections of both EAE and CFA mice. Of note, the staining of miR-142-3p in the WM was prominent in the inflammatory lesions typical of the EAE cerebellum, where CD3+ infiltrating lymphocytes, astroglia, and microglia activation predominate. Accordingly, Figure 1D, E shows a higher miR-142-3p signal in correspondence of a strong immunoreactivity of antibodies against CD3 (for T cells), Iba1 (for microglia), and GFAP (for glial cells), in EAE cerebellum relative to CFA.
Together, these results demonstrate that miR-142-3p is highly expressed in the EAE cerebellum, in particular in the inflammatory lesions of the WM.
miR-142-3p is overexpressed in immune cells following inflammatory stimulation
To further assign the differentially expressed miRNA to specific cell types, we analyzed CD3+-T lymphocytes and activated microglia and astroglia cells under inflammatory conditions. By qRT-PCR analysis, we observed abundant miR-142-3p expression in CD3+ lymphocytes (Fig. 2A) isolated from spleens of EAE mice relative to CFA CD3+ (p = 0.0098). Furthermore, we performed in vitro experiments by using primary cerebellar glial cells (Fig. 2B) and microglia BV2 cell line (data not shown). Following 24 h incubation with IL-1β (30 ng/ml), TNF (10 ng/ml), or LPS (100 ng/ml), qRT-PCR quantification showed an increase of miR-142-3p in both cell systems (glial cells: TNF, p = 0.031, IL-1β, p = 0.038, LPS, p = 0.011; BV2: TNF, p = 0.0013, IL-1β, p = 0.017, LPS, p = 0.017).
Figure 2.
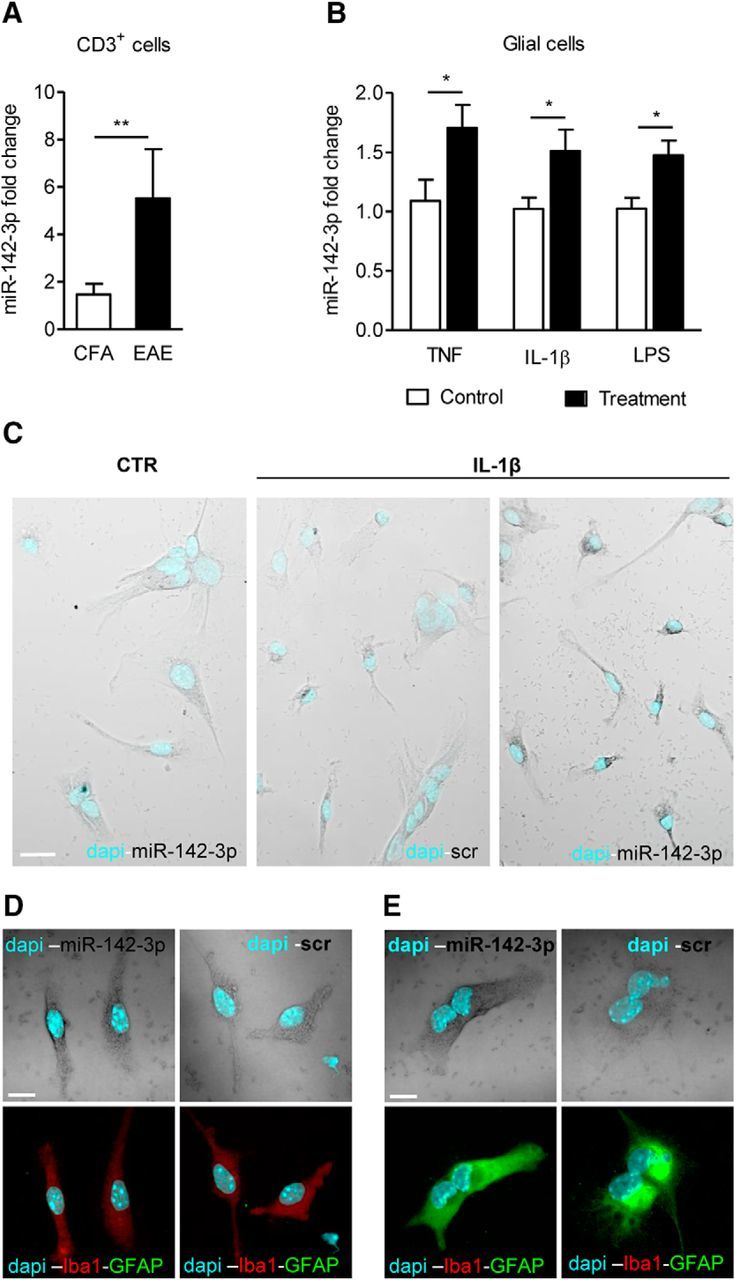
miR-142-3p is overexpressed in immune cells following inflammatory stimulation. A, miR-142-3p quantification by qRT-PCR in the EAE CD3+ lymphocytes (CFA, n = 6; EAE, n = 5). B, qRT-PCR of miR-142-3p in primary cerebellar glial cells (ctr, TNF: n = 9; ctr, IL-1β: n = 6; ctr: n = 8, LPS: n = 6) after 24 h treatment with proinflammatory cytokines or LPS. Data were normalized to U6B by ΔΔCt calculation (mean ± SEM vs controls). *p < 0.05 (unpaired t test). **p < 0.01 (unpaired t test). C–E, ISH of miR-142-3p in primary cerebellar glial cells. C, Low magnification of glial cultures showing higher ISH staining of miR-142-3p (gray) in IL-1β-treated glial cells relative to control condition and scramble (scr) probe hybridization. D, E, Confocal images of ISH with miR-142-3p (gray) and scr probes coupled with immunofluorescence of Iba1 (red) and GFAP (green) in IL-1β-treated glial cells. Cyan represents DAPI counterstaining. Both Iba1-positive microglial cells in D and GFAP-positive astroglial cells in E are positive for miR-142-3p following IL-1β treatment (left panels, respectively). Control scr staining is shown in the relative right panels. Scale bars: C, 20 μm; D, E, 10 μm.
To better characterize miR-142-3p expression in primary cerebellar glial cells, we performed ISH experiments and immunofluorescence on coverslips to distinguish astroglial and microglia cells in the same preparation. First, we observed that IL-1β treatment could induce an upregulation of miR-142-3p compared with control conditions, supporting the q-PCR results (Fig. 2C). Then, by means of immunofluorescence experiments, we demonstrated that both microglia (Fig. 2D) and astroglia (Fig. 2E) cells express miR-142-3p under IL-1β stimulation.
These data indicate that miR-142-3p is responsive to inflammation, in particular to IL-1β and TNF, and that its expression in immune cells (T cells, astroglia, and microglia) can potentially modulate their function with implication for EAE and MS neuropathology.
miR-142-3p is upregulated in the CSF of patients with MS with active brain lesions
To better clarify a potential link between miR-142-3p and neuropathology in MS, we searched for variations of miR-142-3p levels in the CSF of patients with RRMS. Pioneering works showed alteration of miRNA expression profile in CSF of patients with RRMS versus patients with other neurologic diseases, and even versus secondary progressive MS (Haghikia et al., 2012; Bergman et al., 2016). Although the function of such circulating miRNAs remains largely elusive, recent evidence indicates a possible role of miRNAs in cell–cell communication (Meinl and Meister, 2012).
By means of qRT-PCR, we analyzed CSF of 30 patients with MS compared with 12 age- and gender-matched control individuals. As shown in Figure 3A, high variability of miR-142-3p levels in patients with MS impaired the detection of a significant difference between the two groups (p = 0.23; Fig. 3A). Therefore, because we observed a link between inflammation and miR-142-3p expression, we explored miRNA levels in the same patients stratified by the presence or absence of active inflammatory brain lesions measured using Gd-enhanced brain MRI and/or of clinical signs indicative of an acute relapse (active RRMS and nonactive RRMS, respectively). Of note, active RRMS patients had significantly higher levels of miR-142-3p (Kruskal–Wallis test: χ2 = 6.57; p = 0.037) relative to both control (Mann–Whitney, p = 0.038) and nonactive RRMS patients (Mann–Whitney, p = 0.033; Fig. 3B). Because age and disease duration (Table 1) were higher in nonactive RRMS compared with active RRMS patients (age: ANOVA, Ctr, active, nonactive; F = 4.0; p = 0.03; post hoc active, nonactive p < 0.05; disease duration: Mann–Whitney, p = 0.001), we explored their possible influence on miR-142-3p expression by performing a correlation analysis between each parameter and miRNA levels, and no significant correlation emerged (age: ρ = −0.05, p = 0.79; disease duration: ρ = −0.034, p = 0.07; Fig. 3C and Fig. 3D, respectively).
Figure 3.
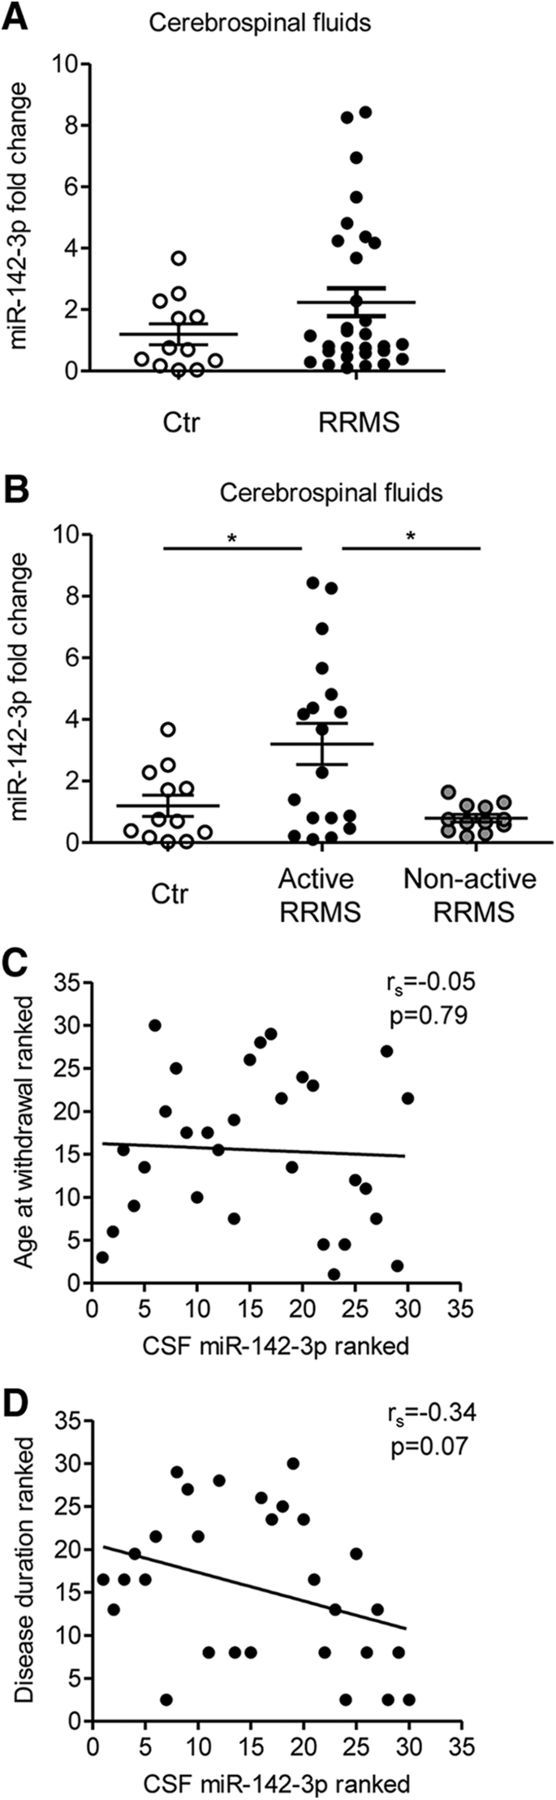
Alteration of miR-142-3p levels in the CSF of MS patients with active brain lesions. A, B, Dot plots of miR-142-3p levels detected by qRT-PCR in CSF from healthy subjects (Ctr) and patients with RRMS (A, Ctr, n = 12; RRMS, n = 30; Mann–Whitney test, p > 0.05), later divided in patients with (active RRMS) and without (nonactive RRMS) active inflammatory brain lesions (B, Ctr, n = 12; active RRMS, n = 18; nonactive RRMS, n = 12; Kruskal–Wallis test followed by Mann–Whitney). *p < 0.05. Values were normalized to spiked-in cel-miR-39 using the ΔCt calculation. Error bars indicate mean ± SEM. C, D, Correlation plot between ranks of the miR-142-3p levels in the CSF and the age at the withdrawal (C) or disease duration (D) of patients with RRMS (p > 0.05, Spearman correlation).
Table 1.
Demographic and clinical characteristics of patients with RRMS and healthy subjectsa
| Variable | Patients with RRMS |
Healthy subjects | |
|---|---|---|---|
| Active | Nonactive | ||
| Gender (female/male) | 15/3 | 6/6 | 9/3 |
| Age at withdrawal (yr) | 32.1 ± 2.4 | 43.2 ± 2.3 | 37.3 ± 3.8 |
| EDSS at withdrawal | 1.8 ± 0.2 | 1.7 ± 0.3 | — |
| Disease duration from onset to 2015 (yr) | 4.8 ± 1.3 | 8.8 ± 1.2 | — |
| CSF oligoclonal banding (yes/no) | 15/3 | 10/2 | — |
aData are mean ± SEM. Active, With clinical and/or neuroradiological signs of inflammatory brain lesions; Nonactive, With no signs of ongoing brain inflammation.
This result demonstrates that high levels of miR-142-3p circulate in the brain of patients with MS with active inflammatory lesions.
miR-142-3p deficiency impairs EAE induction
We previously described that an inflammation-dependent synaptopathy affects several brain areas during the acute phase of EAE (Mandolesi et al., 2015). In particular, the EAE cerebellum is characterized by enhanced glutamatergic transmission at the level of PCs, as observed by patch-clamp recording of spontaneous glutamatergic synaptic currents (sEPSCs). Slower decay phase and half-width of EPSCs accounted for the increased duration of the sEPSC, leading to excitotoxic glutamate influx (Mandolesi et al., 2013).
To study the potential role of miR-142-3p in EAE disease and synaptopathy, we induced MOG35–55-EAE in miR-142 KO mice and investigated the alterations of glutamatergic transmission during the acute phase of the disease (21–28 dpi). In general, miR-142 KO mice do not display overt motor abnormalities, are fertile, and bred normally (Mildner et al., 2013; Chapnik et al., 2014). Following EAE induction, miR-142 KO mice did not show any sign of neurologic impairment (Fig. 4A) compared with WT littermates. The complete attenuation of paralytic symptoms in miR-142 KO mice was associated with no signs of inflammation in the cerebellum (Fig. 4B), as shown by immunostaining of CD3, Iba1, and of IL-1β markers. Furthermore, normal glutamatergic synaptic transmission was recorded by means of patch-clamp technique at PC synapses (Fig. 4C) not only in control miR-142 KO mice but also in those mice immunized with MOG35–55, indistinguishable from control WT mice (one-way ANOVA; n groups = 4; p value summary: decay time = 0.0003, half-width = 0.0052).
Figure 4.

miR-142 KO mice are protected from both EAE motor symptoms and EAE glutamatergic alterations. A, Time course of clinical score in EAE WT littermates (black; WT) and EAE miR-142 KO (gray) mice (at least 8 mice per group). Data are from one representative immunization (n immunization = 2). B, Representative immunostaining of cerebellar sagittal sections from EAE WT, EAE miR-142 KO, and CFA miR-142 KO mice detecting Iba1 (red), CD3 (green), and IL-1β (cyan) as inflammatory markers upregulated in EAE (EAE-WT). EAE miR-142 KO mice do not show any sign of inflammation as in control condition. Gray represents DAPI counterstaining. Scale bar, 100 μm. C, Whole-cell patch-clamp recordings from PCs of sEPSCs in EAE WT and EAE miR-142 KO mice relative to controls. Decay time and half-width are represented in the graphs (CFA WT, n = 7; EAE WT, n = 9; CFA KO, n = 10; EAE KO, n = 9; one-way ANOVA followed by Tukey's HSD). **p < 0.01 versus CFA. ***p < 0.001 versus CFA. #p < 0.05 versus EAE WT. ##p < 0.01 versus EAE WT. Top, Examples of electrophysiological traces (sEPSCs) recorded from PCs in the different experimental conditions.
Preventive and local inhibition of miR-142-3p in the CNS of EAE mice ameliorates cerebellar glutamatergic transmission
The remarkable prevention of the EAE symptoms in miR-142 KO mice suggests that the absence of miR-142-3p might influence the immune system (Mildner et al., 2013; Kramer et al., 2015). To clarify miR-142-3p's role in inflammation-induced neuronal dysfunction, a selective downregulation of the miRNA in the CNS was performed. One group of EAE mice was treated with a LNA-inhibitor of miR-142-3p (anti-miR-142-3p) delivered intracerebroventricularly by means of osmotic minipump implantation. Similarly, a control group of mice received a LNA-scramble control (scr). EAE motor symptoms were evaluated daily in both experimental groups and no significant differences were observed (p > 0.05, Mann–Whitney test day by day; Fig. 5A). After 4 weeks of continuous drug infusion in the CNS, during the acute phase of the disease, the mice were killed to confirm miR-142-3p knockdown by qRT-PCR (scr = 1.020 ± 0.129; anti-miR-142-3p = 0.59 ± 0.066; n = 3, t test p = 0.043, figure not shown), to perform electrophysiological recordings and immunofluorescence experiments. Of note, in EAE mice receiving intracerebroventricular anti-miR-142-3p treatment, the parameters relative to sEPSC duration of PCs were significantly reduced compared with EAE scr mice with the same score (score ≥ 2; decay time, p = 0.009; half-width, p = 0.001), resembling those of CFA mice (Fig. 5B, dotted lines). Furthermore, immunostaining for CD3+ lymphocytes, showing the presence of infiltrating lymphocytes in the cerebellar cortex, as well as the IL-1β and Iba1 expression, clearly indicated the presence of inflammatory reaction in LNA-anti-miR-142-3p treated mice, as observed in control EAE LNA-scr mice (Fig. 5C).
Figure 5.

Preventive and local inhibition of miR-142-3p in the CNS ameliorates glutamatergic synaptic alterations in EAE cerebellum. A, Clinical course of EAE in mice receiving continuous intracerebroventricular infusion of anti-miR-142-3p (gray) compared with mice receiving scramble (black). B, Whole-cell patch-clamp recordings from PCs of EAE mice (21–28 dpi) treated intracerebroventricularly with anti-miR-142-3p or scramble (score ≥ 2). Histograms represent glutamatergic sEPSC kinetic properties (decay time and half-width) of the two experimental groups after 28 d anti-miR-142-3p intracerebroventricular treatment to inhibit miR-142-3p or scramble administration (EAE scr, n = 20; EAE anti-miR-142-3p, n = 26). **p < 0.01 (unpaired Student's t test). Dotted lines indicate the mean values obtained in CFA-untreated mice. The electrophysiological traces on the right are examples of sEPSC mean peak obtained by group analysis in the different experimental conditions. C, Representative immunostaining of cerebellar sagittal sections from EAE WT mice treated with miR-142-3p inhibitor (anti-miR-142-3p) or scramble control (scr), detecting infiltrating CD3+-T cells (green), Iba1 (red), and IL-1β (cyan) as inflammatory markers upregulated in EAE. After 28 d-anti-miR-142-3p intracerebroventricular treatment, the local cerebellar inflammation was similar to control EAE conditions (EAE scr). Gray represents DAPI counterstaining. Scale bar, 50 μm.
Thus, miR-142-3p expression in EAE cerebellum strongly correlates with EAE synaptopathy, and its inhibition is sufficient to prevent EAE-induced glutamatergic abnormalities, even in the presence of inflammation.
Therapeutic and systemic inhibition of miR-142-3p in EAE mice ameliorates cerebellar glutamatergic transmission
The observation that inhibition of miR-142-3p was effective in preventing synaptic alterations, even in the presence of an inflammatory reaction, prompted us to assess whether an anti-miR-142-3p treatment, given for therapeutic purpose, could ameliorate the EAE phenotype. To this aim, we performed a different set of experiments in which we systemically delivered LNA-anti-miR-142-3p in EAE mice by means of caudal intravenous injection. Control experiments with LNA-scramble administration were performed as well. The treatments with LNA-anti-miR and LNA-scramble started at the onset of the disease and were repeated every 4 d. Mice were scored daily until the peak of the disease (21–28 dpi) and were killed to study the electrophysiological and inflammatory status of the cerebellum. As shown in Figure 6A, the disease severity was indistinguishable between the two experimental groups (p > 0.05, Mann–Whitney test day by day). Conversely, both sEPSC decay time and half-width recorded from PCs were significantly reduced in EAE LNA-anti-mi142-3-p compared with EAE LNA-scramble mice (score ≥ 2; decay time, p = 0.019; half-width, p = 0.044) with values similar to those of normal mice (Fig. 6B). In parallel, we performed immunostaining for CD3+, Iba1, and IL-1β showing a strong inflammatory reaction in both EAE anti-miR-142-3p and EAE-scramble cerebella (Fig. 6C).
Figure 6.

Therapeutic and systemic inhibition of miR-142-3p ameliorates glutamatergic synaptic alterations in EAE cerebellum. A, Clinical course of EAE mice receiving intravenous injection, repeated every 4 d, of anti-miR-142-3p (gray) and scramble (black). B, Whole-cell patch-clamp recordings from PCs of EAE mice (21–28 dpi) treated intravenously with anti-miR-142-3p or scramble (score ≥ 2). Histograms represent the sEPSC kinetic properties (decay time and half-width) of PCs in each experimental group. There is a recovery effect of the anti-miR-142-3p intravenous treatment (EAE scr, n = 11; EAE anti-miR-142-3p, n = 14). *p < 0.05 (unpaired Student's t test). Dotted lines indicate the mean values obtained in CFA-untreated mice. Bottom, Electrophysiological traces represent examples of sEPSC mean peak obtained by group analysis in the different experimental conditions. C, Representative immunostaining of cerebellar sagittal sections from EAE WT mice treated with intravenous injection of anti-miR-142-3p or scramble control (scr), detecting infiltrating CD3+-T cells (green), Iba1 (red), and IL-1β (cyan) as inflammatory markers upregulated in EAE. The local cerebellar inflammation was similar between control EAE conditions (EAE scr) and EAE-treated mice (EAE_anti-miR-142-3p). Gray represents DAPI counterstaining. Scale bar, 50 μm.
These results show that anti-miR-142-3p therapeutic treatment in EAE mice is effective in protecting glutamatergic synaptic alterations, suggesting that miR-142-3p is a downstream molecular mediator of inflammation-dependent synaptic alterations.
The glial glutamate transporter GLAST is a functional target of miR-142-3p
To characterize the molecular link between miR-142-3p overexpression and cerebellar glutamatergic alterations, we explored mRNAs potentially targeted by miR-142-3p using different computational miRNA target prediction algorithms and DAVID 6.7 for mRNA functional annotation (Fig. 7A). We identified Slc1a3 mRNA, coding for the glutamate transporter GLAST, as a predicted target specifically expressed in the cerebellum. Furthermore, the putative binding site for miR-142-3p on Slc1a3 mRNA is highly conserved during evolution (Fig. 7B). Interestingly, GLAST is a glial glutamate transporter selectively expressed by cerebellar Bergmann glia, which we found to be downregulated in EAE cerebellum and responsible for sEPSC enhancement at PC synapses (Mandolesi et al., 2013). Notably, Slc1a3 mRNA expression was unchanged in EAE relative to CFA cerebella (p = 0.699; Fig. 7C), supporting its post-transcriptional regulation in EAE.
Figure 7.
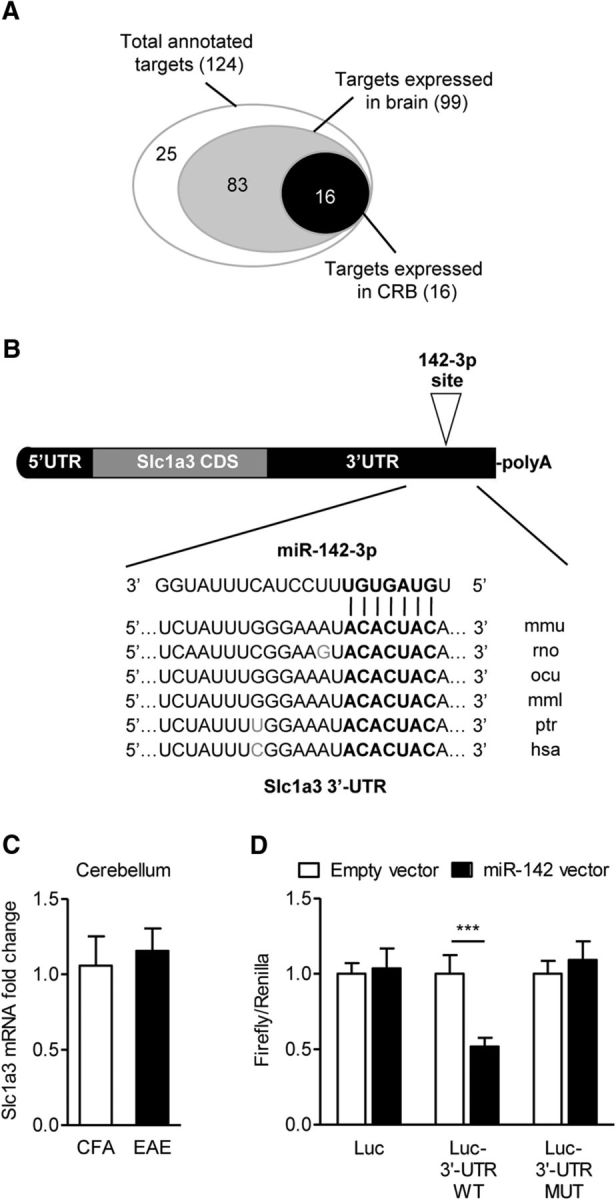
miR-142-3p regulates the Slc1a3 mRNA coding for GLAST. A, Venn diagram of the mRNAs identified as candidate targets of miR-142-3p by at least 2 out of 3 prediction algorithms (microT version 3.0, TargetScan 5.2, and PicTar) and functionally annotated using DAVID 6.7. Slc1a3 is among the potential targets specifically expressed in the cerebellum. B, Alignment of the potential binding site for miR-142-3p in the 3′-UTR of Slc1a3 mRNA from different species (mmu, mouse; rno, rat; ocu, rabbit; mml, rhesus; ptr, chimpanzee; hsa, human), as predicted by TargetScan version 6.2 and DIANA micro-T version 3.0 algorithms. Bold indicates miR-142-3p “seed” region. Remarkable mRNA functional elements are indicated. C, Quantification of the Slc1a3 mRNA coding for the glial glutamate transporter GLAST in EAE cerebellum. β-actin was used as endogenous control. All reactions were analyzed by using the ΔΔCt calculation. Values are mean ± SEM versus CFA mice (CFA, n = 4; EAE, n = 5; p = 0.699, unpaired Student's t test). Data were pooled from two independent immunizations. D, Histograms show luciferase assay results validating Slc1a3 mRNA as direct target of miR-142-3p. The dual-luciferase control plasmid (Luc), the reporter construct containing full-length Slc1a3 3′-UTR (Luc- 3′-UTR WT), or the 3′-UTR bearing mutated (ACU→UAC) binding site for miR-142-3p (Luc-3′-UTR MUT) were cotransfected with miR-142 coding plasmid (pU1-miR-142/CMV-GFP, reported in figure as pU1-miR-142 for simplicity) in HEK293T cells, and the Firefly luciferase activity was measured 48 h after (normalized to Renilla luciferase). The empty vector was used as negative control. Data are mean ± SD and are normalized to empty vector (n = 6). ***p < 0.001 (unpaired t test).
Therefore, we performed luciferase reporter assays to validate Slc1a3 mRNA as a miR-142-3p target. As shown in Figure 7D, the expression of the reporter gene bearing the WT Slc1a3 3′-UTR (Luc-3′-UTR WT) was inhibited of ∼50% by cotransfected miR-142 (p = 6 × 10⁻⁶). Moreover, the mutation of the Slc1a3 3′-UTR within the predicted miR-142-3p binding site (ACU→UAC) abolished completely luciferase responsiveness to miR-142 (Luc-3′-UTR MUT, p = 0.17).
These results provide evidence that the Slc1a3 mRNA coding for GLAST is a direct target of miR-142-3p, with strong implication for EAE synaptopathy.
Link between miR-142-3p and IL-1β-mediated downregulation of GLAST in EAE cerebellum
We previously demonstrated that in EAE mice the enhanced glutamatergic transmission caused by GLAST downregulation was mediated by IL-1β (Mandolesi et al., 2013). In particular, we showed that brief incubation (10 min) of IL-1β on normal cerebellar slices not only resulted in GLAST reduction, but also replicated glutamatergic alterations typical of EAE. Therefore, to define whether miR-142-3p could be a potential effector of IL-1β signaling, we performed similar ex vivo experiments and quantified miR-142-3p levels by qRT-PCR. As shown in Figure 8A, a significant upregulation of miR-142-3p was induced in normal cerebellar slices following 10 min incubation with IL-1β compared with control conditions (p = 0.033).
Figure 8.

miR-142-3p is one of the effectors of the IL-1β-mediated synaptopathy in the cerebellum. A, Mature miR-142-3p quantification by qRT-PCR in cerebellar slices from healthy mice incubated with IL-1β (normalized to U6B using the ΔΔCt calculation). Values are mean ± SEM versus slices incubated only in ACSF (n = 15; IL-1β, n = 14). *p < 0.05 (unpaired Student's t test). B, Whole-cell patch-clamp recordings from PCs of WT and miR-142 KO slices incubated with IL-1β. Histograms represent decay time (left) and half-width (right) of PC sEPSC in WT and miR-142 KO slices upon 10 min-IL-1β incubation (miR-142 KO, n = 10; WT, n = 6). *p < 0.05 versus predrug value (paired Student's t test). In miR-142 KO slices, IL-1β does not reproduces the synaptic alterations observed in WT slices. Dotted lines indicate predrug sEPSC values. Right, Representative sEPSC mean peaks of the two experimental conditions. C, D, Representative WB images and quantification of GLAST protein levels (normalized to β-actin) in cerebellar slices from WT (C, ACSF, n = 3; IL-1β, n = 4). *p < 0.05 (unpaired Student's t test) or miR-142 KO mice (D, ACSF, n = 5; IL-1β, n = 7; p > 0.05, unpaired Student's t test) after 10 min IL-1β incubation. E, GLAST protein levels are unchanged in the cerebellum of miR-142 KO mice (n = 7) compared with WT mice (n = 7). *p < 0.05 (unpaired Student's t test). F, Whole-cell patch-clamp recordings from PCs of WT and miR-142 KO slices incubated with EAE-CD3+ lymphocytes isolated from the spleens of EAE mice. Histograms represent decay time (left) and half-width (right) of sEPSCs recorded in WT (n = 13) and miR-142 KO (n = 23) slices in the presence of CD3+ lymphocytes. *p < 0.05 (one-way ANOVA test). **p < 0.01 (one-way ANOVA test). EAE T cells fail to affect sEPSCs in miR-142 KO slices. Dotted lines indicate control mean values of sEPSC obtained from WT and miR-142 KO slices.
To directly prove the existence of an IL-1β-miR-142-3p-GLAST regulatory axis, we performed both electrophysiological recordings and WB analyses on cerebellar slices derived from miR-142 KO mice. As shown in Figure 8B, 10 min incubation with IL-1β did not enhance the duration of the sEPSC in miR-142 KO slices (KO vs predrug value: decay time, p = 0.073; half-width, p = 0.498) in comparison with WT slices (WT vs predrug value: decay time, p = 0.020; half-width, p = 0.037). In similar experimental conditions, WB analysis showed significant GLAST downregulation mediated by IL-1β in WT slices (Fig. 8C; p = 0.020) but not in miR-142 KO slices (Fig. 8D; p = 0.148). Basal level of GLAST in miR-142 KO mice and WT littermates were similar between the two groups, indicating that miR-142-3p regulates GLAST under inflammatory conditions (Fig. 8E).
Together, these experiments highlight a fast regulatory axis involving IL-1β-miR-142-3p-GLAST, which is directly linked to the enhanced glutamatergic transmission typical of EAE pathophysiology.
Incubation of EAE CD3+ lymphocytes on miR-142 KO slices does not reproduce the EAE synaptic defects
Our previous investigations suggested that EAE-infiltrating T cells can induce alterations of glutamatergic transmission in EAE cerebellum. Indeed, CD3+ lymphocytes isolated from the spleens of EAE (EAE-CD3+) mice and incubated for 1 h on cerebellar slices of control animals promoted a relevant enhancement of the sEPSC duration, in a way reminiscent of the defects seen in EAE condition (Mandolesi et al., 2013). Because we observed that miR-142-3p is highly expressed in this specific immune cells and these cells have the potential of releasing vesicles containing miRNA in the local milieu of the CNS for cell–cell communication (Mittelbrunn and Sánchez-Madrid, 2012; Gutiérrez-Vázquez et al., 2013), we performed electrophysiological experiments to address a potential role of T-cell-derived miR-142-3p in glutamatergic alterations. To this aim, EAE-CD3+ cells were incubated not only on cerebellar slices derived from WT mice but also on slices derived from miR-142 KO mice, to exclude the previously demonstrated contribute of miR-142-3p derived from glial cells. As shown in Figure 8F, sEPSC kinetic properties recorded from KO mice treated for 1 h with EAE-CD3+ cells were indistinguishable from those recorded in control conditions (one-way ANOVA; n groups = 3; p value decay time and half-width both > 0.05), whereas they were statistically different from EAE-CD3+ recorded in the WT group (one-way ANOVA; n groups = 3; p value summary: decay time < 0.05, half-width < 0.01 compared with KO; p value summary: decay time and half-width < 0.01 compared with control).
These data and our previous observations indicate that, in this experimental condition and likely in EAE condition, a prominent contribution to synaptic alterations derives from IL-1β released by CD3+ cells (Mandolesi et al., 2013) and from the IL-1β-miR-142-3p-GLAST regulatory axis at glial level.
miR-142-3p is involved in MS synaptopathy and MS disease progression
To explore whether the high content of miR-142-3p, circulating in the CSF of patients with MS, has the potential of perturbing synaptic transmission, we used a chimeric ex vivo model of MS (Rossi et al., 2012a). We performed electrophysiological experiments in which cerebellar slices from healthy mice were incubated for 1 h with a pool of CSFs derived from active RRMS patients and containing high levels of miR-142-3p (as previously shown). We found that this treatment was sufficient to induce a significant increase of sEPSC duration compared with control condition (decay time, p = 0.045; half-width, p = 0.035; Fig. 9A). To determine whether this physiological effect was miR-142-3p-specific, similar experiments were performed by preincubating the same pool of active RRMS CSFs with the LNA anti-miR-142-3p inhibitor for 1 h. As shown in Figure 7A, the anti-miR-142-3p treatment prevented the enhancement of glutamatergic transmission caused by the CSF of active RRMS patients (decay time, p = 0.045; half-width, p = 0.014).
Figure 9.
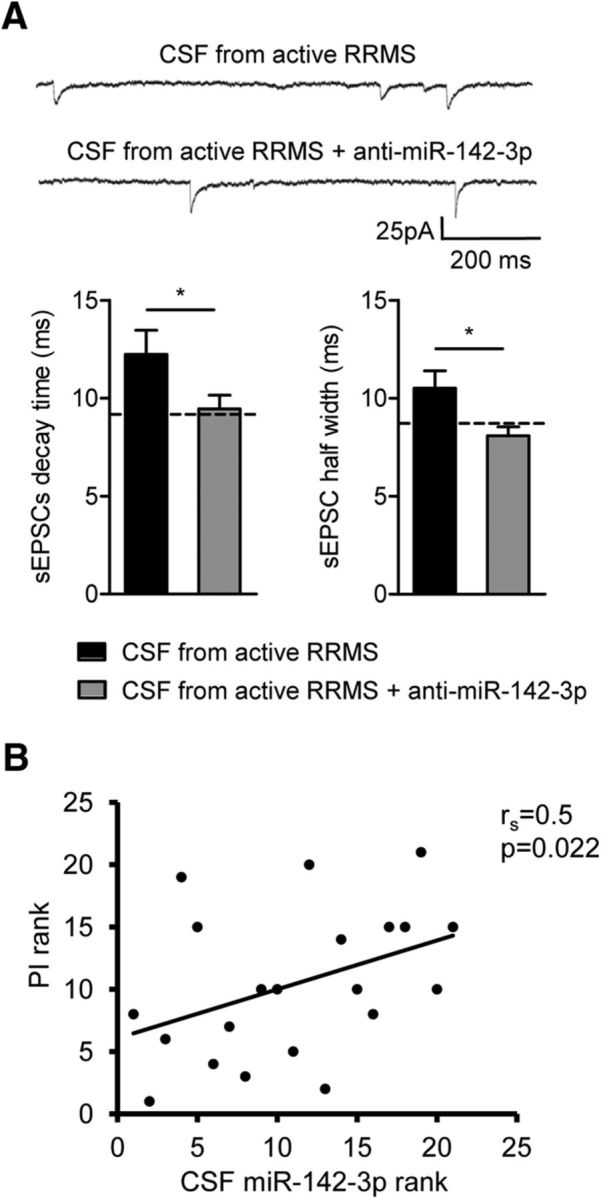
miR-142-3p is potentially involved in MS synaptopathy and in MS disease severity. A, Electrophysiological recordings conducted in MS chimeric ex vivo model. Histograms represent decay time and half-width of sEPSCs after 1 h incubation of murine cerebellar slices with a pool of CSFs taken from patients with active lesions (active RRMS) and high level of miR-142-3p in the absence or in the presence of miR-142-3p inhibitor (anti-miR-142-3p) (CSF from active RRMS in both experimental groups, n = 17). *p < 0.05 (unpaired Student's t test). Top, Examples of electrophysiological traces (sEPSCs) recorded from PCs in the different experimental conditions. These results suggest that miR-142-3p is an indicator of MS-related synaptopathy. B, Correlation plot between ranks of miR-142-3p levels in the CSF and the Progression Index (PI) of the disease in patients with RRMS (n = 21, p < 0.05 Spearman correlation). miR-142-3p is a potential negative prognostic factor in patients with RRMS.
These data strongly suggest that in patients with MS the high content of miR-142-3p circulating in the CSF affects synaptic excitability, with potentially detrimental implications after prolonged time. Consistently with this conclusion, we measured in a subgroup of 21 patients with RRMS, who returned to scheduled follow-up visits for two to five years after CSF withdrawal, the Progression Index, a reliable parameter of disease severity. miR-142-3p levels significantly correlated with Progression Index (ρ = 0.5; p = 0.022; Fig. 9B).
Our results suggest that detection of high levels of miR-142-3p in the CSF at the time of diagnosis appears to be an indicator of MS-related synaptopathy and a potential negative prognostic factor in patients with RRMS.
Discussion
Our results, based on experimental and clinical studies, demonstrate the key involvement of miR-142-3p in EAE and MS pathophysiology. We showed that miR-142-3p expression was elevated not only in EAE brain, but also in the CSF of patients with MS during active inflammation. By means of different in vivo and in vitro strategies, we highlighted a dual role for miR-142-3p in both immune and neuronal function, in particular as a molecular link between inflammation and neuronal dysfunction in both EAE and MS disease. Mechanistically, we have proven that, by targeting GLAST, a crucial glial glutamate transporter involved in glutamate homeostasis, miR-142-3p promotes IL-1β-dependent glutamatergic synaptic dysfunction in EAE. The further novelty of this study was that similar synaptic effects were obtained in a MS chimeric ex vivo model, a meld between mouse and human experiments. Finally, we found that miR-142-3p is potentially a negative prognostic factor in patients with RRMS.
Data from the literature report miR-142-3p in the list of those miRNAs of the immune system (Merkerova et al., 2008; Huang et al., 2009; Keller et al., 2009; Mildner et al., 2013; Kramer et al., 2015) likely involved in MS/EAE pathogenesis and potentially useful as a diagnostic marker for MS (Keller et al., 2009; Ma et al., 2014; Gandhi, 2015). Interestingly, miR-142-3p is highly expressed in blood and WM lesions of patients with MS and of EAE mice (Junker et al., 2009; Keller et al., 2009; Waschbisch et al., 2011; Angerstein et al., 2012; Lescher et al., 2012; Ma et al., 2014). Its functional role is still unknown, but it has been reported that glatiramer acetate, an immunomodulatory drug approved for the treatment of MS patients, normalizes deregulated miR-142-3p expression in blood of patients with RRMS (Waschbisch et al., 2011). Here, we showed for the first time an upregulation of miR-142-3p not only in the EAE cerebellum but also in the MS CSF compartment. Of note, CSF reflects the local milieu of the CNS best, providing a more robust indication of MS-related disease activity than other biological fluids. We propose that miR-142-3p has a role both at the beginning of the autoreactive inflammatory response and during the acute inflammatory reaction in EAE disease and likely in MS. This dual role derives from possible sources of miR-142-3p, such as astroglia, microglia cells, and lymphocytes. Consistently, we observed that peripheral CD3+ cells isolated from EAE mice express high levels of miR-142-3p and that mice deficient of miR-142 were resistant to EAE induction. It is likely that, in these animals, the triggering of EAE disease fails because CD4+-T-cell priming function is impaired (Mildner et al., 2013) or the development and homeostasis of lymphocytes are compromised (Kramer et al., 2015). However, the results of in vivo treatments with an inhibitor of miR-142-3p suggest that, to ameliorate clinical disability in EAE mice, a complete miR-142-3p inhibition might be necessary. This aspect requires further experiments to better clarify the potential beneficial value of miRNA inhibition in MS disease.
On the other hand, the in vivo treatments revealed an miR-142-3p role in synaptic pathology, which deserves as attention as demyelinating processes in triggering neurodegenerative events in MS (Mandolesi et al., 2015). Here, we observed that, even in the presence of an inflammatory reaction, a partial inhibition of miR-142-3p was able to induce a substantial amelioration of glutamate transmission in the EAE cerebellum. Of note, this effect occurred either following a preventive and local treatment in the CNS or after a therapeutic and systemic administration. These results strongly suggest a downstream effect of miR-142-3p on inflammatory synaptopathy. We propose that, during an active inflammation in MS/EAE, CD3+ lymphocytes cross the brain barrier and trigger an inflammatory reaction, by releasing inflammatory cytokines, such as Il-1β, which in turn induce an upregulation of miR-142-3p. In addition to CD3+ lymphocytes, other possible sources of miR-142-3p in the inflamed brain are astroglia and microglia cells. Of note, all these cell types have the potentiality of triggering synaptic abnormality in EAE brain and likely in MS (Centonze et al., 2000; Mandolesi et al., 2013). We indeed previously demonstrated that in EAE cerebellum an enhancement of glutamate transmission was caused by a reduced expression of GLAST specifically in Bergman glia, resulting in a defect of astroglia in uptaking glutamate from the synaptic cleft (Mandolesi et al., 2013). Here, we demonstrated not only that GLAST is a target of miR-142-3p, but we identified also a fast regulatory IL-1β/miR-142-3p/GLAST axis, which leads to enhancement of the sEPSCs in minutes. Of note, IL-1β synaptic effect, both in terms of glutamatergic dysfunction and GLAST regulation, was absent in miR-142 KO slices. In the CNS, local protein synthesis and miRNA maturation, namely, the processing from pre-miRNA to mature miRNA, can occur rapidly and locally in response to specific stimuli, such as synaptic activity (Siegel et al., 2011; Bicker et al., 2013; Holt and Schuman, 2013). Here, we suggest a new mechanism of a local inflammation-dependent miRNA regulation that needs further investigation.
By looking at different and long-lasting mechanisms, which potentially lead to enhancement of glutamatergic transmission in both EAE and MS disease, we explored the possibility of a cell–cell communication between the immune and brain systems mediated by miR-142-3p. Consistent with this hypothesis, it is increasingly emerging that cells may communicate with each other via secreted miRNAs that appear to be extremely stable because they are packaged into secreted vesicles and/or incorporated into RNA-induced silencing complexes (Mittelbrunn and Sánchez-Madrid, 2012; Gutiérrez-Vázquez et al., 2013). Of note, microvesicles in the CSF have been recently involved in EAE/MS disease (Verderio et al., 2012) and can regulate synaptic transmission either by inducing sphingolipid metabolism in neurons or possibly by storing soluble factors (Antonucci et al., 2012). Therefore, it might be possible that acute inflammation induces also an upregulation of circulating miR-142-3p through microvesicle release from activated glia, macrophages, or lymphocytes, which contributes at inducing synaptic dysfunction. We first explored this hypothesis by performing electrophysiological experiments with EAE WT CD3+ lymphocytes incubated on miR-142 KO cerebellar slices (to exclude the contribution of miR-142-3p produced by glial cells), and we observed a failure of synaptic alterations. These results suggest that miR-142-3p released from EAE CD3+ cells does not contribute to inducing a synaptopathy, at least in this experimental condition, further supporting a local role for miR-142-3p in astroglial cells. Conversely, we provide evidence that miR-142-3p circulating in the CSF of patients with MS could indeed reproduce inflammatory synaptic dysfunction of the EAE brain. By means of this chimeric MS ex vivo strategy, we provided not only a robust indication of MS-related disease activity, namely, a potential ongoing synaptopathy, but we also demonstrated an miR-142-3p-specific role using an LNA-anti-miRNA-inhibitory strategy. Consistently, we also found that high miR-142-3p levels in the CSF of MS patients predicted MS disease progression, known to be highly associated with gray matter damage in this disease. In this respect, glutamate excitotoxicity (Stover et al., 1997; Sarchielli et al., 2003; Srinivasan et al., 2005; Baranzini et al., 2010) and altered expression of glutamate transporters (Ohgoh, 2002; Mitosek-Szewczyk et al., 2008; Olechowski et al., 2010; Mandolesi et al., 2013) highly contribute to neuronal and oligodendroglia pathology in MS (Mandolesi et al., 2015). However, a larger MS cohort studies are certainly needed to further confirm these results as to whether miR-142-3p levels in the CSF of MS patients could be useful as a potential diagnostic marker of MS synaptopathy.
In conclusion, the role of miR-142-3p in the detrimental regulation of the synaptic response to inflammation and in MS disease progression opens new avenues in our understanding of MS pathophysiology, with potentially relevant implications for therapeutic strategies based on an anti-miRNA approach (Li and Rana, 2014).
Footnotes
This work was supported by the Italian Ministry of Health (Progetto Giovani Ricercatori) GR-2011-02347036 to G.M. and GR-2011-02351422 to A.M., and European Research Council ERC-2013, AdG 340172-MUNCODD, and AriSLA full Grant 2014 ARCI to I.B. We thank Vladimiro Batocchi, Massimo Tolu, and Plaisant Allevamenti srl for helpful technical assistance.
The authors declare no competing financial interests.
References
- Ahlbrecht J, Martino F, Pul R, Skripuletz T, Sühs KW, Schauerte C, Yildiz Ö, Trebst C, Tasto L, Thum S, Pfanne A, Roesler R, Lauda F, Hecker M, Zettl UK, Tumani H, Thum T, Stangel M. Deregulation of microRNA-181c in cerebrospinal fluid of patients with clinically isolated syndrome is associated with early conversion to relapsing-remitting multiple sclerosis. Mult Scler. 2016;22:1202–1214. doi: 10.1177/1352458515613641. [DOI] [PubMed] [Google Scholar]
- Angerstein C, Hecker M, Paap BK, Koczan D, Thamilarasan M, Thiesen HJ, Zettl UK. Integration of MicroRNA databases to study MicroRNAs associated with multiple sclerosis. Mol Neurobiol. 2012;45:520–535. doi: 10.1007/s12035-012-8270-0. [DOI] [PubMed] [Google Scholar]
- Antonucci F, Turola E, Riganti L, Caleo M, Gabrielli M, Perrotta C, Novellino L, Clementi E, Giussani P, Viani P, Matteoli M, Verderio C. Microvesicles released from microglia stimulate synaptic activity via enhanced sphingolipid metabolism. EMBO J. 2012;31:1231–1240. doi: 10.1038/emboj.2011.489. [DOI] [PMC free article] [PubMed] [Google Scholar]
- Azevedo CJ, Kornak J, Chu P, Sampat M, Okuda DT, Cree BA, Nelson SJ, Hauser SL, Pelletier D. In vivo evidence of glutamate toxicity in multiple sclerosis. Ann Neurol. 2014;76:269–278. doi: 10.1002/ana.24202. [DOI] [PMC free article] [PubMed] [Google Scholar]
- Baranzini SE, Srinivasan R, Khankhanian P, Okuda DT, Nelson SJ, Matthews PM, Hauser SL, Oksenberg JR, Pelletier D. Genetic variation influences glutamate concentrations in brains of patients with multiple sclerosis. Brain. 2010;133:2603–2611. doi: 10.1093/brain/awq192. [DOI] [PMC free article] [PubMed] [Google Scholar]
- Bartel DP. MicroRNAs: target recognition and regulatory functions. Cell. 2009;136:215–233. doi: 10.1016/j.cell.2009.01.002. [DOI] [PMC free article] [PubMed] [Google Scholar]
- Bergman P, Piket E, Khademi M, James T, Brundin L, Olsson T, Piehl F, Jagodic M. Circulating miR-150 in CSF is a novel candidate biomarker for multiple sclerosis. Neurol Neuroimmunol Neuroinflamm. 2016;3:e219. doi: 10.1212/NXI.0000000000000219. [DOI] [PMC free article] [PubMed] [Google Scholar]
- Bhat R, Axtell R, Mitra A, Miranda M, Lock C, Tsien RW, Steinman L. Inhibitory role for GABA in autoimmune inflammation. Proc Natl Acad Sci U S A. 2010;107:2580–2585. doi: 10.1073/pnas.0915139107. [DOI] [PMC free article] [PubMed] [Google Scholar]
- Bicker S, Khudayberdiev S, Weiß K, Zocher K, Baumeister S, Schratt G. The DEAH-box helicase DHX36 mediates dendritic localization of the neuronal precursor-microRNA-134. Genes Dev. 2013;27:991–996. doi: 10.1101/gad.211243.112. [DOI] [PMC free article] [PubMed] [Google Scholar]
- Burgos KL, Javaherian A, Bomprezzi R, Ghaffari L, Rhodes S, Courtright A, Tembe W, Kim S, Metpally R, Van Keuren-Jensen K. Identification of extracellular miRNA in human cerebrospinal fluid by next-generation sequencing. RNA. 2013;19:712–722. doi: 10.1261/rna.036863.112. [DOI] [PMC free article] [PubMed] [Google Scholar]
- Ceman S, Saugstad J. MicroRNAs: meta-controllers of gene expression in synaptic activity emerge as genetic and diagnostic markers of human disease. Pharmacol Ther. 2011;130:26–37. doi: 10.1016/j.pharmthera.2011.01.004. [DOI] [PMC free article] [PubMed] [Google Scholar]
- Centonze D, Muzio L, Rossi S, Cavasinni F, De Chiara V, Bergami A, Musella A, D'Amelio M, Cavallucci V, Martorana A, Bergamaschi A, Cencioni MT, Diamantini A, Butti E, Comi G, Bernardi G, Cecconi F, Battistini L, Furlan R, Martino G. Inflammation triggers synaptic alteration and degeneration in experimental autoimmune encephalomyelitis. J Neurosci. 2009;29:3442–3452. doi: 10.1523/JNEUROSCI.5804-08.2009. [DOI] [PMC free article] [PubMed] [Google Scholar]
- Chapnik E, Rivkin N, Mildner A, Beck G, Pasvolsky R, Metzl-Raz E, Birger Y, Amir G, Tirosh I, Porat Z, Israel L, Lellouche E, Michaeli S, Lellouche JP, Izraeli S, Jung S, Hornstein E. miR-142 orchestrates a network of actin cytoskeleton regulators during megakaryopoiesis. Elife. 2014;2014:1–22. doi: 10.7554/eLife.01964. [DOI] [PMC free article] [PubMed] [Google Scholar]
- Chard D, Miller D. Is multiple sclerosis a generalized disease of the central nervous system? An MRI perspective. Curr Opin Neurol. 2009;22:214–218. doi: 10.1097/WCO.0b013e32832b4c62. [DOI] [PubMed] [Google Scholar]
- Ciccarelli O, Barkhof F, Bodini B, De Stefano N, Golay X, Nicolay K, Pelletier D, Pouwels PJ, Smith SA, Wheeler-Kingshott CA, Stankoff B, Yousry T, Miller DH. Pathogenesis of multiple sclerosis: insights from molecular and metabolic imaging. Lancet Neurol. 2014;13:807–822. doi: 10.1016/S1474-4422(14)70101-2. [DOI] [PubMed] [Google Scholar]
- Clements RJ, McDonough J, Freeman EJ. Distribution of parvalbumin and calretinin immunoreactive interneurons in motor cortex from multiple sclerosis post-mortem tissue. Exp Brain Res. 2008;187:459–465. doi: 10.1007/s00221-008-1317-9. [DOI] [PubMed] [Google Scholar]
- Compston A, Coles A. Multiple sclerosis. Lancet. 2008;372:1502–1517. doi: 10.1016/S0140-6736(08)61620-7. [DOI] [PubMed] [Google Scholar]
- Denti MA, Rosa A, Sthandier O, De Angelis FG, Bozzoni I. A new vector, based on the polII promoter of the U1 snRNA gene, for the expression of siRNAs in mammalian cells. Mol Ther. 2004;10:191–199. doi: 10.1016/j.ymthe.2004.04.008. [DOI] [PubMed] [Google Scholar]
- Dutta R, Chang A, Doud MK, Kidd GJ, Ribaudo MV, Young EA, Fox RJ, Staugaitis SM, Trapp BD. Demyelination causes synaptic alterations in hippocampi from multiple sclerosis patients. Ann Neurol. 2011;69:445–454. doi: 10.1002/ana.22337. [DOI] [PMC free article] [PubMed] [Google Scholar]
- Dutta R, Chomyk AM, Chang A, Ribaudo MV, Deckard SA, Doud MK, Edberg DD, Bai B, Li M, Baranzini SE, Fox RJ, Staugaitis SM, Macklin WB, Trapp BD. Hippocampal demyelination and memory dysfunction are associated with increased levels of the neuronal microRNA miR-124 and reduced AMPA receptors. Ann Neurol. 2013;73:637–645. doi: 10.1002/ana.23860. [DOI] [PMC free article] [PubMed] [Google Scholar]
- Freischmidt A, Müller K, Ludolph AC, Weishaupt JH. Systemic dysregulation of TDP-43 binding microRNAs in amyotrophic lateral sclerosis. Acta Neuropathol Commun. 2013;1:42. doi: 10.1186/2051-5960-1-42. [DOI] [PMC free article] [PubMed] [Google Scholar]
- Freischmidt A, Müller K, Zondler L, Weydt P, Volk AE, Božič AL, Walter M, Bonin M, Mayer B, von Arnim CA, Otto M, Dieterich C, Holzmann K, Andersen PM, Ludolph AC, Danzer KM, Weishaupt JH. Serum microRNAs in patients with genetic amyotrophic lateral sclerosis and pre-manifest mutation carriers. Brain. 2014;137:2938–2950. doi: 10.1093/brain/awu249. [DOI] [PubMed] [Google Scholar]
- Gandhi R. miRNA in multiple sclerosis: search for novel biomarkers. Mult Scler J. 2015;21:1095–1103. doi: 10.1177/1352458515578771. [DOI] [PubMed] [Google Scholar]
- Geurts JJ, Calabrese M, Fisher E, Rudick RA. Measurement and clinical effect of grey matter pathology in multiple sclerosis. Lancet Neurol. 2012;11:1082–1092. doi: 10.1016/S1474-4422(12)70230-2. [DOI] [PubMed] [Google Scholar]
- Gutiérrez-Vázquez C, Villarroya-Beltri C, Mittelbrunn M. Transfer of extracellular vesicles during immune cell–cell interactions. 2013;251:125–142. doi: 10.1111/imr.12013. [DOI] [PMC free article] [PubMed] [Google Scholar]
- Haghikia A, Haghikia A, Hellwig K, Baraniskin A, Holzmann A, Décard BF, Thum T, Gold R. Regulated microRNAs in the CSF of patients with multiple sclerosis: a case-control study. Neurology. 2012;79:2166–2170. doi: 10.1212/WNL.0b013e3182759621. [DOI] [PubMed] [Google Scholar]
- Holt CE, Schuman EM. The central dogma decentralized: new perspectives on RNA function and local translation in neurons. Neuron. 2013;80:648–657. doi: 10.1016/j.neuron.2013.10.036. [DOI] [PMC free article] [PubMed] [Google Scholar]
- Huang B, Zhao J, Lei Z, Shen S, Li D, Shen GX, Zhang GM, Feng ZH. miR-142-3p restricts cAMP production in CD4+CD25− T cells and CD4+CD25+ TREG cells by targeting AC9 mRNA. EMBO Rep. 2009;10:180–185. doi: 10.1038/embor.2008.224. [DOI] [PMC free article] [PubMed] [Google Scholar]
- Junker A, Krumbholz M, Eisele S, Mohan H, Augstein F, Bittner R, Lassmann H, Wekerle H, Hohlfeld R, Meinl E. MicroRNA profiling of multiple sclerosis lesions identifies modulators of the regulatory protein CD47. Brain. 2009;132:3342–3352. doi: 10.1093/brain/awp300. [DOI] [PubMed] [Google Scholar]
- Junker A, Hohlfeld R, Meinl E. The emerging role of microRNAs in multiple sclerosis. Nat Rev Neurol. 2011;7:56–59. doi: 10.1038/nrneurol.2010.179. [DOI] [PubMed] [Google Scholar]
- Keller A, Leidinger P, Lange J, Borries A, Schroers H, Scheffler M, Lenhof HP, Ruprecht K, Meese E. Multiple sclerosis: microRNA expression profiles accurately differentiate patients with relapsing-remitting disease from healthy controls. PLoS One. 2009;4:e7440. doi: 10.1371/journal.pone.0007440. [DOI] [PMC free article] [PubMed] [Google Scholar]
- Kostic M, Zivkovic N, Stojanovic I. Multiple sclerosis and glutamate excitotoxicity. Rev Neurosci. 2013;24:71–88. doi: 10.1515/revneuro-2012-0062. [DOI] [PubMed] [Google Scholar]
- Kramer NJ, Wang WL, Reyes EY, Kumar B, Chen CC, Ramakrishna C, Cantin EM, Vonderfecht SL, Taganov KD, Chau N, Boldin MP. Altered lymphopoiesis and immunodeficiency in miR-142 null mice. Blood. 2015;125:3720–3730. doi: 10.1182/blood-2014-10-603951. [DOI] [PubMed] [Google Scholar]
- Lescher J, Paap F, Schultz V, Redenbach L, Scheidt U, Rosewich H, Nessler S, Fuchs E, Gärtner J, Brück W, Junker A. MicroRNA regulation in experimental autoimmune encephalomyelitis in mice and marmosets resembles regulation in human multiple sclerosis lesions. J Neuroimmunol. 2012;246:27–33. doi: 10.1016/j.jneuroim.2012.02.012. [DOI] [PubMed] [Google Scholar]
- Li Z, Rana TM. Therapeutic targeting of microRNAs: current status and future challenges. Nat Rev Drug Discov. 2014;13:622–638. doi: 10.1038/nrd4359. [DOI] [PubMed] [Google Scholar]
- Ma X, Zhou J, Zhong Y, Jiang L, Mu P, Li Y, Singh N, Nagarkatti M, Nagarkatti P. Expression, regulation and function of microRNAs in multiple sclerosis. Int J Med Sci. 2014;11:810–818. doi: 10.7150/ijms.8647. [DOI] [PMC free article] [PubMed] [Google Scholar]
- Mandolesi G, Grasselli G, Musella A, Gentile A, Musumeci G, Sepman H, Haji N, Fresegna D, Bernardi G, Centonze D. GABAergic signaling and connectivity on Purkinje cells are impaired in experimental autoimmune encephalomyelitis. Neurobiol Dis. 2012;46:414–424. doi: 10.1016/j.nbd.2012.02.005. [DOI] [PubMed] [Google Scholar]
- Mandolesi G, Musella A, Gentile A, Grasselli G, Haji N, Sepman H, Fresegna D, Bullitta S, De Vito F, Musumeci G, Di Sanza C, Strata P, Centonze D. Interleukin-1β alters glutamate transmission at Purkinje cell synapses in a mouse model of multiple sclerosis. J Neurosci. 2013;33:12105–12121. doi: 10.1523/JNEUROSCI.5369-12.2013. [DOI] [PMC free article] [PubMed] [Google Scholar]
- Mandolesi G, Gentile A, Musella A, Fresegna D, De Vito F, Bullitta S, Sepman H, Marfia GA, Centonze D. Synaptopathy connects inflammation and neurodegeneration in multiple sclerosis. Nat Rev Neurol. 2015;11:711–724. doi: 10.1038/nrneurol.2015.222. [DOI] [PubMed] [Google Scholar]
- Mannironi C, Camon J, De Vito F, Biundo A, De Stefano ME, Persiconi I, Bozzoni I, Fragapane P, Mele A, Presutti C. Acute stress alters amygdala microRNA miR-135a and miR-124 expression: inferences for corticosteroid dependent stress response. PLoS One. 2013;8:e73385. doi: 10.1371/journal.pone.0073385. [DOI] [PMC free article] [PubMed] [Google Scholar]
- Meinl E, Meister G. MicroRNAs in the CSF: macro-advance in MS? Neurology. 2012;79:2162–2163. doi: 10.1212/WNL.0b013e31827597d1. [DOI] [PubMed] [Google Scholar]
- Merkerova M, Belickova M, Bruchova H. Differential expression of microRNAs in hematopoietic cell lineages. Eur J Haematol. 2008;81:304–310. doi: 10.1111/j.1600-0609.2008.01111.x. [DOI] [PubMed] [Google Scholar]
- Mildner A, Chapnik E, Manor O, Yona S, Kim KW, Aychek T, Varol D, Beck G, Itzhaki ZB, Feldmesser E, Amit I, Hornstein E, Jung S. Mononuclear phagocyte miRNome analysis identifies miR-142 as critical regulator of murine dendritic cell homeostasis. Blood. 2013;121:1016–1027. doi: 10.1182/blood-2012-07-445999. [DOI] [PubMed] [Google Scholar]
- Mitosek-Szewczyk K, Sulkowski G, Stelmasiak Z, Struzyńska L. Expression of glutamate transporters GLT-1 and GLAST in different regions of rat brain during the course of experimental autoimmune encephalomyelitis. Neuroscience. 2008;155:45–52. doi: 10.1016/j.neuroscience.2008.05.025. [DOI] [PubMed] [Google Scholar]
- Mittelbrunn M, Sánchez-Madrid F. Intercellular communication: diverse structures for exchange of genetic information. Nat Rev Mol Cell Biol. 2012;13:328–335. doi: 10.1038/nrm3335. [DOI] [PMC free article] [PubMed] [Google Scholar]
- Mori F, Nisticò R, Mandolesi G, Piccinin S, Mango D, Kusayanagi H, Berretta N, Bergami A, Gentile A, Musella A, Nicoletti CG, Nicoletti F, Buttari F, Mercuri NB, Martino G, Furlan R, Centonze D. Interleukin-1β promotes long-term potentiation in patients with multiple sclerosis. Neuromolecular Med. 2014;16:38–51. doi: 10.1007/s12017-013-8249-7. [DOI] [PubMed] [Google Scholar]
- Ode OJ, Moore CS, Kennedy TE, Antel JP, Bar-Or A, Dhaunchak AS. MicroRNA dysregulation in multiple sclerosis. Front Genet. 2013;3:311. doi: 10.3389/fgene.2012.00311. [DOI] [PMC free article] [PubMed] [Google Scholar]
- Ohgoh M, Hanada T, Smith T, Hashimoto T, Ueno M, Yamanishi Y, Watanabe M, Nishizawa Y. Altered expression of glutamate transporters in experimental autoimmune encephalomyelitis. J Neuroimmunol. 2002;125:170–178. doi: 10.1016/S0165-5728(02)00029-2. [DOI] [PubMed] [Google Scholar]
- Olechowski CJ, Parmar A, Miller B, Stephan J, Tenorio G, Tran K, Leighton J, Kerr BJ. A diminished response to formalin stimulation reveals a role for the glutamate transporters in the altered pain sensitivity of mice with experimental autoimmune encephalomyelitis (EAE) Pain. 2010;149:565–572. doi: 10.1016/j.pain.2010.03.037. [DOI] [PubMed] [Google Scholar]
- Polman CH, Reingold SC, Banwell B, Clanet M, Cohen JA, Filippi M, Fujihara K, Havrdova E, Hutchinson M, Kappos L, Lublin FD, Montalban X, O'Connor P, Sandberg-Wollheim M, Thompson AJ, Waubant E, Weinshenker B, Wolinsky JS. Diagnostic criteria for multiple sclerosis: 2010 Revisions to the McDonald criteria. Ann Neurol. 2011;69:292–302. doi: 10.1002/ana.22366. [DOI] [PMC free article] [PubMed] [Google Scholar]
- Rossi S, Muzio L, De Chiara V, Grasselli G, Musella A, Musumeci G, Mandolesi G, De Ceglia R, Maida S, Biffi E, Pedrocchi A, Menegon A, Bernardi G, Furlan R, Martino G, Centonze D. Impaired striatal GABA transmission in experimental autoimmune encephalomyelitis. Brain Behav Immun. 2011;25:947–956. doi: 10.1016/j.bbi.2010.10.004. [DOI] [PubMed] [Google Scholar]
- Rossi S, Furlan R, De Chiara V, Motta C, Studer V, Mori F, Musella A, Bergami A, Muzio L, Bernardi G, Battistini L, Martino G, Centonze D. Interleukin-1β causes synaptic hyperexcitability in multiple sclerosis. Ann Neurol. 2012a;71:76–83. doi: 10.1002/ana.22512. [DOI] [PubMed] [Google Scholar]
- Rossi S, Studer V, Motta C, De Chiara V, Barbieri F, Bernardi G, Centonze D. Inflammation inhibits GABA transmission in multiple sclerosis. Mult Scler J. 2012b;18:1633–1635. doi: 10.1177/1352458512440207. [DOI] [PubMed] [Google Scholar]
- Sarchielli P, Greco L, Floridi A, Floridi A, Gallai V. Excitatory amino acids and multiple sclerosis: evidence from cerebrospinal fluid. Arch Neurol. 2003;60:1082–1088. doi: 10.1001/archneur.60.8.1082. [DOI] [PubMed] [Google Scholar]
- Siegel G, Saba R, Schratt G. microRNAs in neurons: manifold regulatory roles at the synapse. Curr Opin Genet Dev. 2011;21:491–497. doi: 10.1016/j.gde.2011.04.008. [DOI] [PubMed] [Google Scholar]
- Siffrin V, Vogt J, Radbruch H, Nitsch R, Zipp F. Multiple sclerosis-candidate mechanisms underlying CNS atrophy. Trends Neurosci. 2010;33:202–210. doi: 10.1016/j.tins.2010.01.002. [DOI] [PubMed] [Google Scholar]
- Sohn W, Kim J, Kang SH, Yang SR, Cho JY, Cho HC, Shim SG, Paik YH. Serum exosomal microRNAs as novel biomarkers for hepatocellular carcinoma. Exp Mol Med. 2015;47:e184. doi: 10.1038/emm.2015.68. [DOI] [PMC free article] [PubMed] [Google Scholar]
- Srinivasan R, Sailasuta N, Hurd R, Nelson S, Pelletier D. Evidence of elevated glutamate in multiple sclerosis using magnetic resonance spectroscopy at 3 T. Brain. 2005;128:1016–1025. doi: 10.1093/brain/awh467. [DOI] [PubMed] [Google Scholar]
- Steinman L. Inflammatory cytokines at the summits of pathological signal cascades in brain diseases. Sci Signal. 2013;6:pe3. doi: 10.1126/scisignal.2003898. [DOI] [PubMed] [Google Scholar]
- Stenvang J, Petri A, Lindow M, Obad S, Kauppinen S. Inhibition of microRNA function by antimiR oligonucleotides. Silence. 2012;3:1. doi: 10.1186/1758-907X-3-1. [DOI] [PMC free article] [PubMed] [Google Scholar]
- Stover JF, Pleines UE, Morganti-Kossmann MC, Kossmann T, Lowitzsch K, Kempski OS. Neurotransmitters in cerebrospinal fluid reflect pathological activity. Eur J Clin Invest. 1997;27:1038–1043. doi: 10.1046/j.1365-2362.1997.2250774.x. [DOI] [PubMed] [Google Scholar]
- Thamilarasan M, Koczan D, Hecker M, Paap B, Zettl UK. MicroRNAs in multiple sclerosis and experimental autoimmune encephalomyelitis. Autoimmun Rev. 2012;11:174–179. doi: 10.1016/j.autrev.2011.05.009. [DOI] [PubMed] [Google Scholar]
- Verderio CMuzio L, Turola E, Bergami A, Novellino L, Ruffini F, Riganti L, Corradini I, Francolini M, Garzetti L, Maiorino C, Servida F, Vercelli A, Rocca M, Dalla Libera D, Martinelli V, Comi G, Martino G, Matteoli M, Furlan R. Myeloid microvesicles are a marker and therapeutic target for neuroinflammation. Ann Neurol. 2012;72:610–624. doi: 10.1002/ana.23627. [DOI] [PubMed] [Google Scholar]
- Waschbisch A, Atiya M, Linker RA, Potapov S, Schwab S, Derfuss T. Glatiramer acetate treatment normalizes deregulated microRNA expression in relapsing remitting multiple sclerosis. PLoS One. 2011;6:1–5. doi: 10.1371/journal.pone.0024604. [DOI] [PMC free article] [PubMed] [Google Scholar]
- Wegner C, Esiri MM, Chance SA, Palace J, Matthews PM. Neocortical neuronal, synaptic, and glial loss in multiple sclerosis. Neurology. 2006;67:960–967. doi: 10.1212/01.wnl.0000237551.26858.39. [DOI] [PubMed] [Google Scholar]