

Abstract
Neurotransmitter release depends on voltage-gated Na+ channels (Navs) to propagate an action potential (AP) successfully from the axon hillock to a synaptic terminal. Unmyelinated sections of axon are very diverse structures encompassing branch points and numerous presynaptic terminals with undefined molecular partners of Na+ channels. Using optical recordings of Ca2+ and membrane voltage, we demonstrate here that Na+ channel β2 subunits (Navβ2s) are required to prevent AP propagation failures across the axonal arborization of cultured rat hippocampal neurons (mixed male and female). When Navβ2 expression was reduced, we identified two specific phenotypes: (1) membrane excitability and AP-evoked Ca2+ entry were impaired at synapses and (2) AP propagation was severely compromised with >40% of axonal branches no longer responding to AP-stimulation. We went on to show that a great deal of electrical signaling heterogeneity exists in AP waveforms across the axonal arborization independent of axon morphology. Therefore, Navβ2 is a critical regulator of axonal excitability and synaptic function in unmyelinated axons.
SIGNIFICANCE STATEMENT Voltage-gated Ca2+ channels are fulcrums of neurotransmission that convert electrical inputs into chemical outputs in the form of vesicle fusion at synaptic terminals. However, the role of the electrical signal, the presynaptic action potential (AP), in modulating synaptic transmission is less clear. What is the fidelity of a propagating AP waveform in the axon and what molecules shape it throughout the axonal arborization? Our work identifies several new features of AP propagation in unmyelinated axons: (1) branches of a single axonal arborization have variable AP waveforms independent of morphology, (2) Na+ channel β2 subunits modulate AP-evoked Ca2+-influx, and (3) β2 subunits maintain successful AP propagation across the axonal arbor. These findings are relevant to understanding the flow of excitation in the brain.
Keywords: action potential, axon, beta2 subunit, sodium channel, synapse, unmyelinated
Introduction
The cycle of synaptic transmission is set in motion by an action potential (AP) invading the presynaptic terminal (Lisman et al., 2007). Although individual synapses along an axon can have substantially different responses in vesicle release probability and Ca2+ influx (Rosenmund et al., 1993; Koester and Sakmann, 2000; Ariel et al., 2012; Ermolyuk et al., 2012), the AP is often ignored as a source of this variability because of its perception as a uniform “all-or-none” signal. In essence, the AP waveform is a command signal that forces closed voltage-gated Ca2+ channels (Cavs) through a series of conformational transitions to their open state, a process that is steeply dependent on membrane voltage (Vm) (Li et al., 2007). At the same time, vesicle fusion is also a supralinear process that is steeply dependent (by a third-fourth order power-law) on Ca2+ entry at the synapse (Dodge and Rahamimoff, 1967; Augustine et al., 1985). Therefore, the AP shape can exert enormous impact on neurotransmission (Siegelbaum et al., 1982; Sabatini and Regehr, 1997; Borst and Sakmann, 1999; Bischofberger et al., 2002; Rama et al., 2015).
Much of what we know about AP shape in mammalian neurons has come from whole-cell recordings, with few recordings from axons or synaptic terminals due to their fine structure (Bean, 2007). Recent optical measurements of the axonal AP demonstrated localized voltage-gated K+ channel (Kv) activity between presynaptic terminals of cerebellar stellate cells (Rowan et al., 2014; Rowan et al., 2016). In addition, subcellular heterogeneities in axonal voltage-gated Na+ channel (Nav) enrichment between the axon and synapse has been demonstrated in inhibitory basket cells (Hu and Jonas, 2014), the calyx of Held (Leão et al., 2005), and Purkinje cells (Kawaguchi and Sakaba, 2015). Together, these results suggest that AP shape and membrane excitability may in some cases be controlled locally within discrete sections of the axon and/or synaptic terminals. However, the mechanism(s) that defines local excitability and ion channel function has yet to be determined for unmyelinated axons.
In terms of successful AP propagation, Navs are the critical drivers for active conduction. In the brain, Navs are often found as complexes between the pore-forming α-subunit and transmembrane β-subunits (Hartshorne et al., 1982; Isom et al., 1994; Yu et al., 2003; Namadurai et al., 2015). Na+ channel β2 subunits (Navβ2s) have been shown to regulate membrane trafficking of the pore-forming α subunit (Navα), with acutely isolated somata from the hippocampus of Navβ2-null mice displaying a ∼50% reduction in Na+ current density (Isom et al., 1995; Chen et al., 2002). In addition, the integral of compound APs recorded from optic nerved bundles was also reduced, demonstrating a role for Navβ2 to modulate Nav density in the myelinated axon (Chen et al., 2002). Interestingly, NaVβ2-null mice display a resistance to neurodegeneration in an experimental model of multiple sclerosis, suggesting an important role for Navβ2 in demyelinated axons (O'Malley et al., 2009). As a result of these data, we hypothesized that Navβ2 may play a critical role in modulating the AP within normal unmyelinated sections of axon that form en passant synaptic terminals in many regions of the brain. We explore this hypothesis using a combination of genetically encoded Ca2+ and membrane voltage (Vm) indicators within single axonal arborizations in dissociated hippocampal neurons. First, we found that normal axons have a large degree of heterogeneity in the waveform throughout the axonal aborization that is independent of axon morphology. Second, we demonstrate that depletion of Navβ2 subunits impairs AP-evoked presynaptic Ca2+ influx. Third, we report that the Navβ2 subunit plays a critical role in maintaining AP propagation across axonal ramifications of excitatory hippocampal neurons. Together, our results point to a fundamental role for Navβ2 for controlling AP waveform fidelity in unmyelinated branches of axonal arborizations and an important role for branch points in axonal signaling beyond controlling the timing of synaptic transmission.
Materials and Methods
Cell culture.
Hippocampal CA1–CA3 regions were dissected with dentate gyrus removed from postnatal day 1 Sprague Dawley rats of either sex (mixed litter), dissociated (bovine pancreas trypsin; 5 min at room temperature), and plated on polyornithine-coated coverslips inside a 6-mm-diameter cloning cylinder as described previously (Hoppa et al., 2012a). Calcium-phosphate-mediated transfection was performed on 5-d-old cultured neurons with the plasmids described below. All measurements, unless otherwise noted, are from mature 14- to 24-d-old neurons. Experiments with Sprague Dawley rats were approved by Dartmouth College's Institutional Animal Care and Use Committee. INS-1 cell lines (823/13, passage 47–50) were obtained from Dr. Justin Taraska (National Institutes of Health). INS-1 cells were cultured and transfected as described previously (Hoppa et al., 2012b).
Plasmids.
SypGCaMP and α2δ-1 were obtained as described previously (Hoppa et al., 2012a) and QuasAr was acquired from Addgene (Plasmid 51692: FCK-QuasAr2-mO2). For knock-down of endogenous Navβ2 or Navβ4, prevalidated shRNA plasmids were purchased from Origene against the following mRNA target sequences: GCTATACCGTGAACCACAAGCAGTTCTCT and TACTTCAGGTGGTCCTACAATAACAGCGA, respectively. To confirm shRNA-mediated knock-down data, we inserted single-guide RNA (sgRNA) targeting Navβ2 (CACCGCCACTCTTAGTGTCCTCAAC) into pU6-(BbsI)CBh-Cas9-T2A-mCherry plasmid purchased from Addgene (plasmid 64324). For expression of human Navβ2 (NM_004588.3, plasmid RC207778) to perform rescue experiments, we inserted both human Navβ2 fused to T2A peptide synthesized using GeneArt Gene Synthesis (Invitrogen) and SypGCaMP into pFCK plasmid, inducing independent expression of two different proteins in neurons. To measure Ca2+ influx and Vm in the same cell, we designed a DarkQuasAr-T2A-SypGCaMP construct. We inserted DarkQuasAr, which has a mutation in the mOrange sequence not to show any fluorescence (Y327A) before T2A-SypGCaMP, which is under the human Synapsin 1 promoter. We validated that DarkQuasAr and SypGCaMP were coexpressed in the same cells through many repetitive experiments.
Antibodies.
Rabbit polyclonal anti-Navβ2 antibody was kindly provided by Dr. Nobuyuki Nukina (Miyazaki et al., 2014). Mouse monoclonal antibodies were used against Nav1.2 and GFP (Neuromab), pan-sodium channel and α-Tubulin (Sigma-Aldrich), and PSD-95 (Thermo Fisher Scientific). Rabbit polyclonal Nav1.6 and chicken polyclonal GFP-tag antibody were purchased from Millipore and Invitrogen, respectively. Alexa Fluor 488-, 546-, and 647-conjugated goat anti-rabbit, anti-mouse, and anti-chicken IgG and horseradish peroxidase-conjugated anti-mouse and anti-rabbit IgG were from Invitrogen.
Live-cell imaging and optical setup.
All experiments were performed at 34°C using a custom-built objective heater. Coverslips were mounted in a rapid-switching, laminar-flow perfusion and stimulation chamber on the stage of a custom-built laser microscope. The total volume of the chamber was ∼75 μl and was perfused at a rate of 400 μl/min. During imaging, cells were perfused continuously in a standard saline solution containing the following (in mm): 119 NaCl, 2.5 KCl, 2 CaCl2, 2 MgCl2, 25 HEPES, and 30 glucose plus 10 μm 6-cyano-7-nitroquinoxaline-2,3-dione (Sigma-Aldrich) and 50 μm D,L-2-amino-5-phosphonovaleric acid (Sigma-Aldrich). For high K+ solution experiments, cells were perfused in a modified solution with equimolar substitution to create a 90 mm KCl concentration. Tetrodotoxin (TTX) was made at a stock concentration of 3 mm and used at different diluted concentrations (Alomone Laboratories).
For measuring Ca2+ influx, specimens of SypGCaMP-transfected neurons were illuminated by a 488 nm laser 6–8 mW (Coherent OBIS laser) with ZET488/10x and ZT488rdc dichroic (Chroma) through a Zeiss EC Plan-Neofluar 40 × 1.3 numerical aperture (NA) objective. SypGCaMP florescent emission was collected through an ET525/50m filter (Chroma) and captured with an IXON Ultra 897 EMCCD (Andor). SypGCaMP fluorescence was collected with an exposure time of 9.83 ms and images were acquired at 100 Hz.
For the measurement of APs, specimens of QuasAr-transfected neurons were illuminated by a 637 nm laser 50–92 mW (depending on imaging soma vs axon, respectively; Coherent OBIS laser) with ET620/60 excitation filters and a 660 long-pass dichroic with an ET700/75 emission filter all purchased from Chroma. Light was collected through a Zeiss EC Plan-Neofluar 40 × 1.3 NA objective using a cropped sensor mode (10 MHz readout, 500 ns pixel shift speed) to achieve 2 kHz frame rate imaging (exposure time of 485 μs) using an intermediate image plane mask (Optomask; Cairn Research) to prevent light exposure of nonrelevant pixels as described previously (Hoppa et al., 2014). The camera was cooled using an EXOS liquid cooling system (Koolance). For simultaneous measurements of somatic voltage under patch-clamp conditions, experiments were performed as described previously (Kralj et al., 2011) except using 2 kHz acquisition.
For measuring axon and bouton diameter, experiments were performed on a Zeiss LSM 880 with Airyscan at 34°C. SypGCaMP imaging was performed on a 40 × 1.3 NA objective by confocal imaging for detecting where branch point failure happened by TTX treatment. SypGCaMP fluorescence images were acquired at 5 Hz. Subsequently, mOrange signal from QuasAr was taken on a 100 × 1.46 NA objective by Airyscan imaging to measure axon and bouton diameter. Airyscan images were zoomed at 1.8–2.3× and z sections were taken at 0.18 μm intervals. Image analysis of axon and bouton diameter was performed blinded and independently (see below).
Stimulus control.
APs were evoked by passing 1 ms current pulses, yielding fields of ∼12 Vcm−2 (unless otherwise noted) through the chamber via platinum/iridium electrodes. Unless otherwise noted, trial averages of AP waveforms were derived from 100 stimuli delivered at ∼8 Hz. For averaging across many trials in QuasAr recordings, the stimulus was locked to defined frame number intervals using a custom-built board named “Neurosync” powered by an Arduino Duo chip manufactured by an engineering firm (Sensorstar).
Immunofluorescence.
To measure the Navβ2 shRNA and sgRNA efficiency, neurons were visualized at 14–17 d in vitro (DIV). Cells were fixed with 4% paraformaldehyde and 4% sucrose in PBS and permeabilized with 10% Triton X-100 and 10% goat serum in PBS for 30 min, which helped to visualize Nav localization at the axon initial segment (Akin et al., 2015). Cells were then incubated with the appropriate primary antibodies and visualized using Alexa Fluor-conjugated secondary antibodies in the 5% goat serum in PBS. Images were obtained using a custom-made fluorescence microscope equipped with 40× oil-immersion objectives.
Western blotting assay.
Hippocampal neurons at DIV 7 and DIV 14 and INS-1 cell lines were washed with cold PBS twice and extracted for 1 h at 4°C in radioimmunoprecipitation assay (RIPA) buffer containing 50 mm Tris, pH 8.0, 150 mm NaCl, 1% Nonidet P-40 (NP-40), 0.5% sodium deoxycholate, and 0.1% SDS supplemented with protease inhibitors (Sigma-Aldrich). The extracts were then clarified by centrifugation for 10 min at 13000 rcf and the protein concentrations in the supernatants were determined using bicinchoninic acid assays (Thermo Fisher Scientific). The resultant extracts were separated by SDS-PAGE and transferred onto PVDF membranes. The membranes were then blocked with 5% skim milk in buffer containing 10 mm Tris-HCl, pH 7.5, 100 mm NaCl, and 0.1% Tween 20. Once blocked, the membranes were probed with primary antibodies followed by horseradish peroxidase-conjugated antibody (Invitrogen) and the blots were detected using enhanced chemiluminescence reagent (Thermo Fisher Scientific) on a Bio-Rad Chemidoc MP and accompanying software was used for quantification of imaged bands.
Experimental design and statistical analysis.
Before measurement of QuasAr based on a priori knowledge of the signal-to-noise ratio, we determined that, to identify a change of 20% in signal across genetic deletion conditions would require n = 8 dishes. This value was calculated using a power analysis (α = 0.05, β = 0.80) for a K-sample means one-way ANOVA. For all experimental conditions, hippocampi from both genders of rat pups were mixed before digestion and culture. A minimum of three separate cultures were used for experimentation. The comparison of means for two independent distributions was performed with the two-sample t test given that the data were normally distributed. In many cases, where more than two groups were compared, a one-way ANOVA followed by Tukey's post hoc comparison was calculated to determine statistical significance using OriginPro version 9.1. The use of these tests is specified in the Results and figure legends for clarity. The analysis of axon morphology was performed blinded (as detailed in the “Image and data analysis” section below).
Image and data analysis.
Images were analyzed in ImageJ using custom-written plugins (http://rsb.info.nih.gov/ij/plugins/time-series.html). Averaged data are presented as means ± SEM (n = number of neurons) and all experiments were performed on more than three independent cultures from different litters. ΔF/F values of the Ca2+ influx were calculated after background subtraction. Measurements of background were measured using a rectangular 30 × 30-pixel ROI. Using the equation and the optimized fit parameters, we converted any SypGCaMP signal to a linearized MagGreen (Invitrogen) equivalent proportional to the actual Ca2+. These linearized values were then used to estimate the effect of Navβ2 expression on single AP Ca2+ responses (Ariel et al., 2012; Hoppa et al., 2012a). For measuring TTX susceptibility of synaptic boutons, we calculated ΔF/F of each bouton and determined its susceptibility if the ΔF/F after TTX treatment was <10% of the initial value. To measure AP propagation at branch points, we counted electrically stimulated responsive boutons compared with nonresponsive boutons. First, we marked all synaptic boutons that showed increased Ca2+ influx level by perfusion of high K+ solution. Next, we counted synaptic boutons, which were responsive to electrical stimulation. For counting synaptic bouton densities, we drew a box surrounding each branch and determined the “responsive boutons” that had increased fluorescence values compared with the backgrounds.
For quantifying the QuasAr signal, stimulation with 300 nm TTX was used to isolate the field stimulation from AP signal and was subtracted from our AP recordings at the soma and bouton. Generally, stimulation was made using 6 Vcm−2 to minimize the stimulus signal. ΔF/F values of the AP were calculated after background subtraction (generally a 4 × 10-pixel ROI). Finally, AP waveforms were corrected for the temporal resolution of QuasAr by deconvolution using an FFT-based algorithm in Origin Pro 8 with a normalized 500 μs exponential response function. Automated peak and full-width at half maximum (FWHM) analyses were performed using Origin Pro 8's peak-fitting algorithm.
For measuring axon diameter from the images taken by Airyscan, we used Fiji for image processing and analysis on raw data. A maximum-intensity projection was applied to the images. To measure axon diameters around the branch points, a reference image was produced by thresholding and binarizing the raw image (Fiji). To define the regions, a 4 μm line was drawn from the branch point to each axon branch and the area was measured automatically along the axon and occasionally boutons by analyze particle method in Fiji (see Fig. 4D). Data analysis for axon or bouton diameter was performed blinded to the conditions of the experiments. The average of axon diameter of each branch was calculated by division of the area by a 4 μm line length. To acquire axon and bouton profiles, analysis was done by threshold images and axon shaft and boutons were selected along the regions. The line for measuring axon and bouton diameters was drawn perpendicularly along axon shafts.
Figure 4.

Axon branch point morphology is independent of AP propagation failure. A, Representative Airyscan image of axons from a hippocampal neuron. Scale bar, 2 μm. B, Representative ΔF image obtained from SypGCaMP for a 20 AP stimulus with control (green) and 6 nm TTX (red) with merged images below. Inset image is an expanded and inverted Airyscan image of mOrange signal from QuasAr to show axon morphology shown in black and white for clarity. Scale bar, 10 μm. C, Ratio of ΔF/F from 20 AP stimulus (TTX/Control) for the axon branches labeled in (B; top left). D, Left, Method to measure axon diameter strategy. Area was measured from thresholded region in the rectangle (blue) in a 4 μm length section of the axon (yellow line) to obtain an average diameter. Scale bar, 2 μm. Right, Average of axon diameter around axon branch point from B. E, Average axon diameter from neurons showing AP propagation failure and success at branch points (n = 9 cells) and control neurons (n = 10 cells). F, Top, Representative SypGCaMP ΔF image from stimulation with a 20AP train of APs (20 Hz). Bottom, Representative Airyscan image of axon (QuasAr mOrange signal). Red line indicates diameter of axon shaft and yellow line indicates bouton diameter. Scale bar, 5 μm. G, Distribution of axon diameters (top) and bouton diameters (bottom) collected from 22 cells.
Results
Heterogeneous AP waveforms between axonal branches
Recent measurements of APs in excitatory hippocampal neurons found a lower amplitude at presynaptic terminals compared with the soma (Hoppa et al., 2014), which likely indicates a lower density of Navs in the axon and/or presynaptic terminals of hippocampal neurons compared with Kvs. We were therefore curious to determine whether this type of ion channel composition would lead to a loss of uniformity in the waveform of propagating APs. The fine structure of axons and presynaptic terminals emanating from hippocampal neurons is too small to use whole-cell patch clamp consistently to measure local ion currents or membrane potential directly across an arborization. Therefore, we chose to measure axonal AP propagation directly using a noninvasive genetically encoded Vm indicator, QuasAr (Hochbaum et al., 2014). QuasAr is an improved variant of the voltage sensor archaerhodopsin with extremely fast kinetics (∼100 μs) and displays large linear responses to changes in membrane potential. Comparing it with electrophysiological recordings at the soma show that it can track membrane potential accurately and distort or filter measurements of AP shape minimally (Fig. 1A). QuasAr's improved brightness and excellent membrane trafficking (Fig. 1B) allow quantitative measurements of subcellular APs with a large signal-to-noise ratio that require less trial averaging to resolve the axonal AP waveform at high-time resolution (2 kHz; Fig. 1C). On average, axonal AP measurements displayed robust responses in fluorescence to field stimulation for single trials (signal-to-noise ratio of 4.6 ± 0.4), allowing detailed measurements of averaged AP waveforms (signal-to-noise ratio of 40.1 ± 5.6 for 100 trials). We examined the normal level of biophysical fidelity for the shape of an AP within a given branch (intrabranch) and between branches (interbranch) of normal hippocampal neurons (Fig. 1D). Therefore, we measured QuasAr waveforms within discrete sections of axons to compare AP waveform shape (Fig. 1E,F). Overall AP amplitude within a 10 μm section of axon displayed a coefficient of variation (CV) in amplitude of 7.1 ± 1.4 for intrabranch, whereas the interbranch CV was 19.3 ± 7.3 (Fig. 1G). A difference was also observed for the FWHM between branches with a CV of 5.6 ± 1.7 intrabranch and 11.1 ± 0.7 interbranch (Fig. 1H). Different membrane insertion of the QuasAr indicator cannot be ruled out as a source of variability in AP amplitude between branches. However, variable membrane insertion of our indicator would not explain the variability in interbranch FWHMs. No branches failed to respond to stimulation when measuring from three different axonal branches of an arborization and no noticeable bleaching was observed in our measurements. These results indicate significant heterogeneity of the AP waveform between branches of the unmyelinated axon. The changes in interbranch amplitude could be related to heterogeneous Nav activity across the unmyelinated axon branches.
Figure 1.
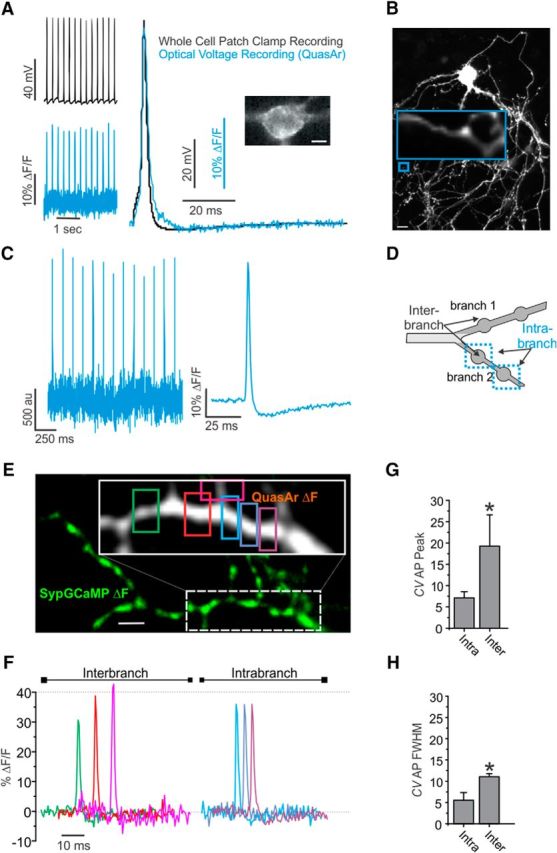
Heterogeneity of AP waveform across branches of the axonal arborization. A, Left, Simultaneous electrical (black) and optical (blue) recording of APs in a rat hippocampal neuron expressing QuasAr stimulated with 100 pA current injections for 10 ms at 8 Hz. Optical acquisition frame rate 2 kHz. Right, Average response from 40 trials peak aligned to electrophysiological APs. Inset shows basal QuasAr fluorescence. Scale bar, 5 μm. B, Montage of several fields (mOrange fluorescence) from a dissociated hippocampal neuron expressing QuasAr-mOrange. Inset image shows the axon branches expressing QuasAr's inherent fluorescence in far red. Scale bar, 20 μm. C, Left, QuasAr fluorescence intensity of the branches shown in B stimulated with single stimuli recorded at 2 kHz. Right, Average (100 trial) AP recorded from the branches shown in B (n = 9). D, Schematic model of axon branches describing intrabranch and interbranch boutons. E, ΔF image of SypGCaMP (green) with inset showing ΔF DarkQuasAr fluorescence in white from stimulation with 1 AP. Scale bar, 5 μm. F, AP waveforms from associated axon shown in E with colors of ROIs matched with waveforms. G, Coefficient of variation of AP peak between intrabranch and interbranch for three recorded regions of the axonal arborization (n = 8). H, CV of AP FWHM between intrabranch and interbranch for the same cells in G. Error bars indicate mean ± SEM. *p = 0.041, Student's t test.
Heterogeneous Nav activity between axonal branches
QuasAr requires high temporal sampling rates that necessitate small sampling windows (∼12 × 32 μm), so we required a slower indicator to measure large sections of the axonal arborization at lower sampling rates. Therefore, we turned to measurements of Ca2+ as a proxy for AP arrival across the axonal arborization (Cox et al., 2000) using the Ca2+ indicator GCaMP6F (>20 ms response kinetics) (Chen et al., 2013) fused to synaptophysin (SypGCaMP) for synapse specificity (Li et al., 2011) to give a robust indication of AP arrival at synaptic terminals (Fig. 2A). To determine relative Nav activity across the axonal arborization, we challenged control neurons by perfusing low concentrations (1–30 nm) of TTX and stimulating neurons expressing SypGCaMP with a brief train of APs. TTX is a broad inhibitor of Nav channels. Surprisingly, we did not detect uniform TTX sensitivity across a single axonal arborization. Instead, we observed a significant heterogeneity in TTX sensitivity for a single neuron, in which individual branches of the axon stopped responding to stimulation at different concentrations of TTX and “failed” to propagate (Fig. 2B, red and yellow arrows). We defined branch failures in these measurements as a decrease in ΔF/F of SypGCaMP after TTX treatment that was <10% of pre-TTX fluorescence (3-fold above the SD of baseline fluorescence). Individual branches started to demonstrate AP propagation failure even with very low (∼1 nm) levels of TTX, consistent with comparatively high TTX sensitivity in excitatory axons, as described previously (Prakriya and Mennerick, 2000). Nevertheless, some branches still retained AP-evoked Ca2+ responses at 30 nm TTX despite elaborating from a single cell (Fig. 2C). This unexpected heterogeneous response to TTX was not due to impaired health of the hippocampal neuron over the course of the experiment because all Ca2+ responses returned to initial levels after TTX washout (Fig. 2C,D). Although unlikely due to our small perfusion volumes (<150 μl) used in live-cell imaging, we tested whether these heterogenous responses to TTX could be due to local variability in TTX concentration resulting from perfusion. Therefore, we used a static bath application of TTX and repeated the measurements across multiple trials. The failed response of certain branches to AP stimulation was consistent across trials, with the same branches failing to respond to subsequent rounds of stimulation for >30 min (Fig. 2E). The large variability in TTX susceptibility across branches of a single axonal arborization suggests a significant local heterogeneity in Nav activity or a molecular repertoire of ion channels and associated subunits between branches of the unmyelinated axon.
Figure 2.
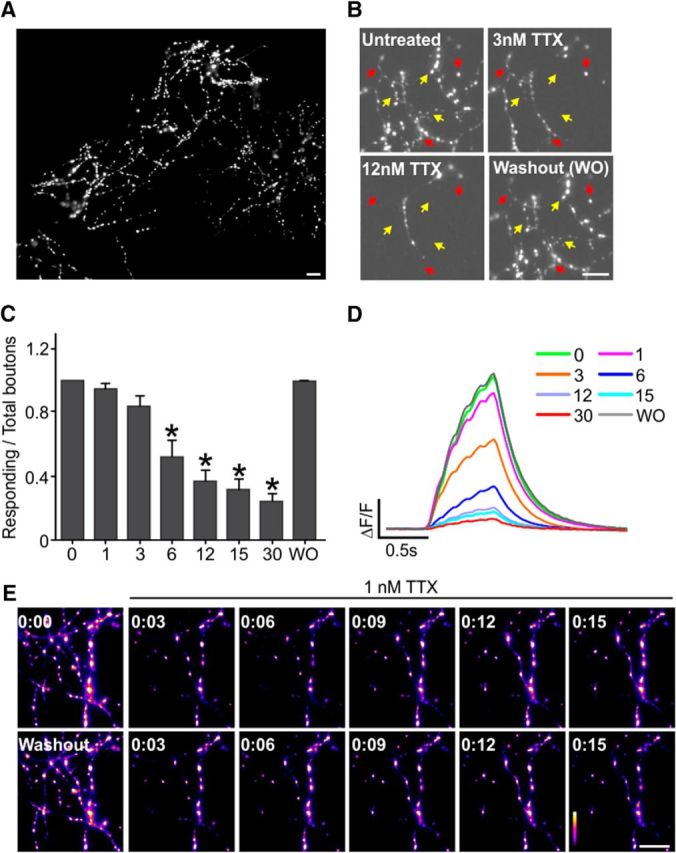
Heterogeneity of TTX sensitivity across branches of the axonal arborization. A, Montage of ΔF images obtained for trains of 20 AP at 20 Hz stimulation from one axon in a dissociated hippocampal neuron expressing SypGCaMP. Scale bar, 20 μm. B, Representative ΔF image obtained for a 20 AP stimulus with different concentrations of TTX from a SypGCaMP transfected neuron's axonal field. Yellow arrows indicate branches which were sensitive to 3 nm TTX treatment and red arrows indicate branches that were sensitive to 12 nm TTX treatment. Scale bar, 20 μm. C, Ratio of responsive boutons to 20 AP stimulus with different concentrations of TTX and washout (WO) to that of 20 AP stimulus without TTX (n = 9). Error bars indicate mean ± SEM. *p < 0.05, ANOVA with Tukey's post hoc comparisons. D, Average trace of measured SypGCaMP response to 20 AP stimulus under control condition and with TTX and washout (WO). E, ΔF SypGCaMP images of an axonal field stimulated with a train of 10 AP at 50 Hz stimulation at various time points before and in the presence of 1 nm TTX. TTX incubation induced selective AP propagation failure in the same branches across each trial (time points for TTX application in top right corner of image). Toxin was washed out and reapplied for the second row; note the repeated loss of selective branches of synapses from the axonal field. Scale bar, 20 μm.
Branch points demarcate variability in AP propagation
Interestingly, when mature (DIV 14–23) neurons were challenged with TTX, the loss of AP-evoked Ca2+ was not selective for individual boutons, but was for contiguous boutons along select axonal branches. To confirm the location of failures more clearly, we also measured SypGCaMP signals in less complicated axonal arborizations from DIV 12–13 neurons, in which we could often trace the origin of failures to what appeared to be bifurcations (Fig. 3A). Recent studies have found local changes of the AP in other small-diameter axons, indicating a more active contribution of local voltage-gated ion channels to electrical signaling (Kawaguchi and Sakaba, 2015; Rowan et al., 2016). Therefore, we measured synaptic Ca2+ responses at a branch level in relation to TTX propagation failures (Fig. 3B). To accomplish this task, we measured SypGCaMP responses in branches of an axonal arbor by stimulating with 10 AP trains before and after TTX application at various concentrations until we could identify >30% of synapses failing (Fig. 3C). To determine the physiological significance of branch responses to TTX in relation to synaptic Ca2+ influx, we measured synaptic Ca2+ level for 1 AP stimulation in branches of axons that responded to AP stimulation in the presence of TTX (TTX-Success) and those that did not (TTX-Failure) (Fig. 3D). We found that TTX-Success branches of the axon had a significantly higher (19%) increases in Ca2+ influx (0.82 ± 0.05 ΔF/F) compared with TTX-Failure branches (0.68 ± 0.05 ΔF/F) (Fig. 3E). These results indicate a potentially significant role of branches of an arborization to tune presynaptic output that is molecular or geometrical in nature.
Figure 3.

Nav activity levels influence synaptic Ca2+ influx at the level of branches within the axon. A, ΔF SypGCaMP ± 6 nm TTX stimulated with a train of 20 APs at 20 Hz. TTX induced AP propagation failure that occurred at a branch point of the axon (*). Scale bar, 20 μm. B, Schematic model of axonal Navs influencing the magnitude of presynaptic Ca2+ influx. Branches will respond successfully to AP stimulation when challenged with TTX (TTX-Success) or fail to respond (TTX-Failure). C, ΔF images obtained for the trains of 10 AP at 50 Hz stimulation in untreated and 6 nm TTX conditions. Blue- and pink-colored boutons indicate successful and failed responses to 6 nm TTX, respectively. Scale bar, 20 μm. D, Presynaptic Ca2+ influx induced by a single AP stimulus (arrow) from post hoc identified TTX-Success and TTX-Failure branches. E, Averaged linearized single AP ΔF/F increases in TTX resistant branches in untreated neurons (n = 15). *p = 0.0028; paired t test. Error bars indicate mean ± SEM.
Axon geometry does not alter AP propagation fidelity
As APs actively propagate through unmyelinated sections of the axon, they encounter several geometric irregularities such as en passant boutons and branch points. These changes in diameter and membrane surface along the axon may alter the AP waveform (Lüscher and Shiner, 1990). We assessed this possibility experimentally by measuring axon morphology optically beyond the diffraction limit at 125 nm resolution using an Airyscan (Zeiss) detector to measure axon geometry taking advantage of QuasAr's excellent membrane trafficking with a representative image shown in Figure 4A. We combined this sensitive spatial resolution with SypGCaMP responses with or without TTX to induce branch point failures and measured differences in morphology related to AP propagation success. Measuring in both indicators separately was possible due to the orthogonal emission spectra of the mOrange2-labeled QuasAr and GFP-based GCaMP (Fig. 4B). We assessed SypGCaMP responses from a train of 20 APs delivered at 20 Hz before and after TTX application (Fig. 4B). Failures were identified by an average drop of >90% in Ca2+ influx before TTX application across all adjacent boutons of an axonal branch. An example of SypGCaMP measurements is shown in Figure 4C of the intersection of three axon collaterals at one branch point from the axon shown in Figure 4B. We then measured the average diameter (axon + boutons) of branches under TTX application that had a successful (TTX-Success) or failed (TTX-Failure) AP-induced Ca2+ response. Figure 4D shows the diameter measurements corresponding to branches, “a–c” from Figure 4B. Overall, we did not find any significant difference between the average axonal diameter of branches that failed or were successful (TTX-Success; 602 ± 49 nm, TTX-Failure; 656 ± 65 nm, p > 0.1; Fig. 4E). As a control, we also compared the axon diameters of branches that did not display any failure when challenged with low (<9 nm) TTX, which were also nearly identical to impaired branches in morphology (631 ± 49 nm, p > 0.1; Fig. 4E). To verify how well our preparation of QuasAr-transfected cells represented hippocampal neurons with Airyscan resolution, we measured the axon and boutons diameters across the arborization (Fig. 4F) with synaptic identity confirmed by SypGCaMP responses. We found that our cells had an average axon diameter of (392.28 ± 5.58 nm, 428 axon segments, n = 22 cells; Fig. 4G, top) and bouton diameter of (964.01 ± 19.56 nm, 265 boutons, n = 22 cells; Fig. 4G, bottom), which are in excellent agreement with previous measurements of axons (∼200 nm) from neuropil of the hippocampus using electron microscopy (Mishchenko et al., 2010) taking diffraction of light into account. Although axon diameter was not related to the success/failures of AP propagation, we also assessed how bouton density alters propagation success because boutons often have much higher changes in geometric ratio than axon branch points. To assess this possibility, we measured synaptic bouton density along sections of the axon using SypGCaMP as a marker comparing collaterals of successful verses failed propagation when challenged with TTX. Again, we did not find any differences between branches based on the density of en passant synapses that were predictive of propagation failures (n = 8 cells, p = 0.910; data not shown). Together, these results suggest that geometry and impedance mismatches alone are not predictive of propagation failures at branch points, suggesting that diversified and local molecular repertoires within the axon dominate this process.
Navβ2 modulates AP-evoked calcium entry at presynaptic terminals
Given Navβ2's previously implicated role for controlling Na+ currents in myelinated axons, we decided that Navβ2 would be a good candidate with which to modulate axonal Na+ in unmyelinated axons and AP-evoked Ca2+ at synapses. We confirmed the presence of Navβ2 in our cultures, as well as the Navα1.2 and Navα1.6, the expression of which increased markedly during maturation (Fig. 5A,D). We made use of shRNA-targeted knock-down to deplete endogenous levels of Navβ2 cotransfected with SypGCaMP. Genetic knock-down resulted in an ∼70% depletion of endogenous levels of Navβ2 (p < 0.05; Fig. 5B,E). To confirm specificity of knock-down by Western blot and to quantify knock-down efficiency, we used rat-derived INS-1 cells due to their ease of transfection, which showed 94% depletion of endogenous levels of Navβ2 when correcting for transfection efficiency (p < 0.05; Fig. 5C,F). Next, to determine the role of Navβ2s in modulating axonal Na+ and AP-evoked Ca2+ at synapses, we made use of shRNA-targeted knock-down in conjunction with measurements of Ca2+ influx using SypGCaMP. We compared Ca2+ influx in the two conditions by stimulating with a train of 20 APs at 20 Hz while imaging at 100 Hz (Fig. 6A). This rapid optical sampling allowed us to extract a measurement of Ca2+ influx in response to individual APs during the train of stimulations (Fig. 6B). We converted this nonlinear response of the Ca2+ indicator based on the reported Hill coefficient for GCaMP6F fluorescent responses to various Ca2+ concentrations (Chen et al., 2013). Peak Ca2+ influx during the train was not reduced (Fig. 6C). However, when stimulated with a single AP, the response from Navβ2 shRNA-transfected neurons was reduced by half (47.5 ± 4.0%; p < 0.05) compared with control neurons (Fig. 6D). Single AP stimulations were more strongly impaired by Navβ2 deficiency compared with trains. We attribute this observation to the slow off-rates of the GCaMP reporter, which can complicate Ca2+ influx measurements during AP trains. We were curious whether this reduction in AP-evoked Ca2+ influx was for a select population of measured synapses within a single axonal arborization or if they were universally reduced. Therefore, we also measured single AP Ca2+ responses for individual synapses and found a shift in peak responses more consistent with an overall reduction with Navβ2 shRNA (Fig. 6E). These results suggest that Navβ2 plays an important role in controlling axonal Nav activity levels and its loss impairs AP-evoked Ca2+ influx. We speculated that Navβ2 shRNA-transfected cells may have a lower density of functional Navs within the axon either due to altered voltage sensitivity or membrane insertion. Therefore, axonal TTX sensitivity should be increased in Navβ2 shRNA-transfected neurons. We compared Ca2+ influx as a proxy for AP propagation across the arborization of control, Navβ2 shRNA-transfected neurons, and neurons overexpressing a human variant of Navβ2 (hNavβ2 OE), respectively (Fig. 6F). We observed a significant shift in TTX sensitivity for Navβ2 shRNA-transfected neurons with much higher failure rates to lower concentrations of TTX between 1 and 12 nm TTX application (p < 0.05; Fig. 6G). No observable shift was seen in TTX resistance for hNavβ2 OE neurons, indicating potential endogenous saturation levels of the subunit. The combined results of impaired AP-evoked Ca2+ influx and increased TTX sensitivity suggest that Navβ2 deficiency impairs Nav activity directly within the unmyelinated axon or there is a significant shift in the balance of Nav and Kv channels.
Figure 5.

Sodium channel subunit expression during axon maturation and knock-down of Navβ2. A, Representative Western blot of Navβ2, Navα1.2, Navα1.6, and PSD-95 with matching bands of α-tubulin (paired to sample shown above) to control for total protein loaded from cultured rat hippocampal neurons from DIV 7 and 14 to represent nascent axons and mature axons. B, Immunofluorescence staining for SypGCaMP (anti-GFP antibody), Navs (pan-Nav antibody), and Navβ2 in primary cultured hippocampal neurons cotransfected with SypGCaMP and Navβ2 shRNA. Boxes indicate axon initial segment, yellow lines indicate transfected neurons and blue lines indicate nontransfected neurons. Scale bar, 20 μm. C, Representative Western blot of Navβ2, α-tubulin, and GFP from rat INS-1 cells to confirm the specificity of the shRNA of Navβ2. GFP was cotransfected for visualization of transfection efficiency (50.75%; n = 400 cells). D, Quantification of Navβ2 expression in cultured rat hippocampal neurons. Navβ2 expression increases during axon maturation in primary cultured hippocampal neurons from DIV 7 to DIV 14. n = 5 individual cultures from a combination of several pups of mixed genders; *p = 0.018 with DIV 7 group, Student's t test. E, Quantification of relative expression of Navβ2 in soma of Navβ2 shRNA-transfected neurons compared with control neurons (n = 25 for control, n = 8 for Navβ2 shRNA-transfected neurons). *p = 0.0095, Student's t test. F, Quantification of Navβ2 expression in rat INS-1 cells. Quantification of bands displays a 53 ± 4% expression for shRNA exposed cells. Based on a 50.75% transfection efficiency, this predicts a 94% knock-down efficiency (n = 3 individual cultures and transfections). *p = 0.0014, Student's t test.
Figure 6.

Presynaptic Ca2+ entry controlled by Navβ2s. A, Average SypGCaMP signals in response to trains of 20 AP at 20 Hz of electrical stimulation. B, Inset of Figure 2A. Each arrow (top) indicates successive individual AP stimuli. C, Average peak amplitude of Ca2+ transients evoked by trains (20 AP at 20 Hz) of electrical stimulation (Control, n = 22; Navβ2 shRNA, n = 24; p = 0.059). Each individual trial is the average of 25–35 boutons from a single cell. D, Linearized average Ca2+ transients evoked by single AP stimulation (Control, n = 22; Navβ2 shRNA, n = 24; *p = 4.17 * 10-9). E, Histogram of individual synaptic responses (SypGCaMP) from single AP stimulation from each condition. Peak Ca2+ influx level normalized to the first Ca2+ influx level (Control, n = 22 cells and 763 boutons; Navβ2 shRNA, n = 12 cells and 318 boutons). All values for Ca2+ have been linearized (n = 24). F, ΔF images obtained for trains of 20 AP at 20 Hz stimulation with different concentrations of TTX from a SypGCaMP-transfected neurons' axonal field (Control, n = 13; Navβ2 shRNA, n = 15; hNavβ2OE, n = 14). G, Ratio of responsive boutons to 20 AP ± various concentrations of TTX compared with responsive boutons before application of TTX. WO, Washout. All fluorescence is shown at the same scale across images. Error bars indicate mean ± SEM; *p < 0.05, ANOVA with Tukey's post hoc comparisons.
Navβ2 modulates the axonal AP waveform
To assess the relationship between Navβ2 and the sculpting of the AP waveform within the unmyelinated axon, we made subcellular measurements using QuasAr. We first measured AP initiation by recording from the soma under control and Navβ2 shRNA conditions (Fig. 7A). We found that the somatic APs generated immediately after initiation of the AP at the axon initial segment were similar in amplitude (p = 0.54) between control (30.2 ± 3.7%) and Navβ2 shRNA-transfected neurons (33.5 ± 2.2%; Fig. 7B). This was also true of the overall AP shape with hyperpolarization and decay; we compared their FWHM between conditions, which were also similar (p = 0.93) between control (1.26 ± 0.05 ms) and Navβ2 shRNA-transfected neurons (1.27 ± 0.12 ms; Fig. 7C). These results indicate that Navβ2 does not play an essential role in AP initiation despite some enrichment within the axon initial segment (Fig. 7A), which matches previous data ascribing a more defined functional role for Navβ1 at the axon initial segment and soma of excitatory neurons (Wimmer et al., 2010). However, recordings of the axonal AP (Fig. 7D) showed that Navβ2 shRNA-transfected cells displayed a significantly (p = 0.037) reduced AP amplitude (31.9 ± 1.8% ΔF/F) compared with control cells (37.4 ± 2.6% ΔF/F; Fig. 7E). There was not a significant difference between the FWHM of these recordings (p = 0.26) in control (1.4 ± 0.1 ms) and Navβ2 shRNA-transfected neurons (1.6 ± 0.1 ms; Fig. 7F). Strikingly, Navβ2 shRNA-transfected neurons displayed a loss of successful AP potential propagation fidelity in control conditions using optical measurements of membrane potential across the arborization, with a representative cell and recording shown in Figure 7G. We were able to measure the axonal AP in Navβ2 shRNA-transfected neurons successfully in at least three spatially distinct branches (10 μm section) of the axonal arborization for each cell. All control cells responded with a defined AP spike, whereas <15% of Navβ2 shRNA cells had AP responses across all measured branches of the axon (Fig. 7H). Importantly, all axonal recordings were made from cells in both conditions in which successful AP generation could be observed at the soma indicating robust electrical excitability. To ensure that our field-stimulus protocol initiates AP generation at the axon initial segment, we used a very low input stimulus (6 Vcm−2; see Materials and Methods). When we made distinct subcellular measurements of AP arrival at the soma compared with the distal axon, we found a reliable delay of AP peaks of ∼1.2 ± 0.4 ms depending on the measurement location within the arborization (using 2 kHz sampling; Fig. 7I). Considering that these neurons have an estimated conduction velocity of ∼0.25 ms−1 (Andersen et al., 2000), this measurement seems consistent with estimations of delay, although a calculation of exact distance is missing because the circuitous route and prolific complexity of axon networks in cultured neurons renders exact estimations of distance and branching order impossible. If AP initiation were induced locally within the axon, then recorded delay would not be measured. As a whole, these results describe a particularly critical role for Navβ2 in the distal axon to enable successful propagation of the AP waveform.
Figure 7.
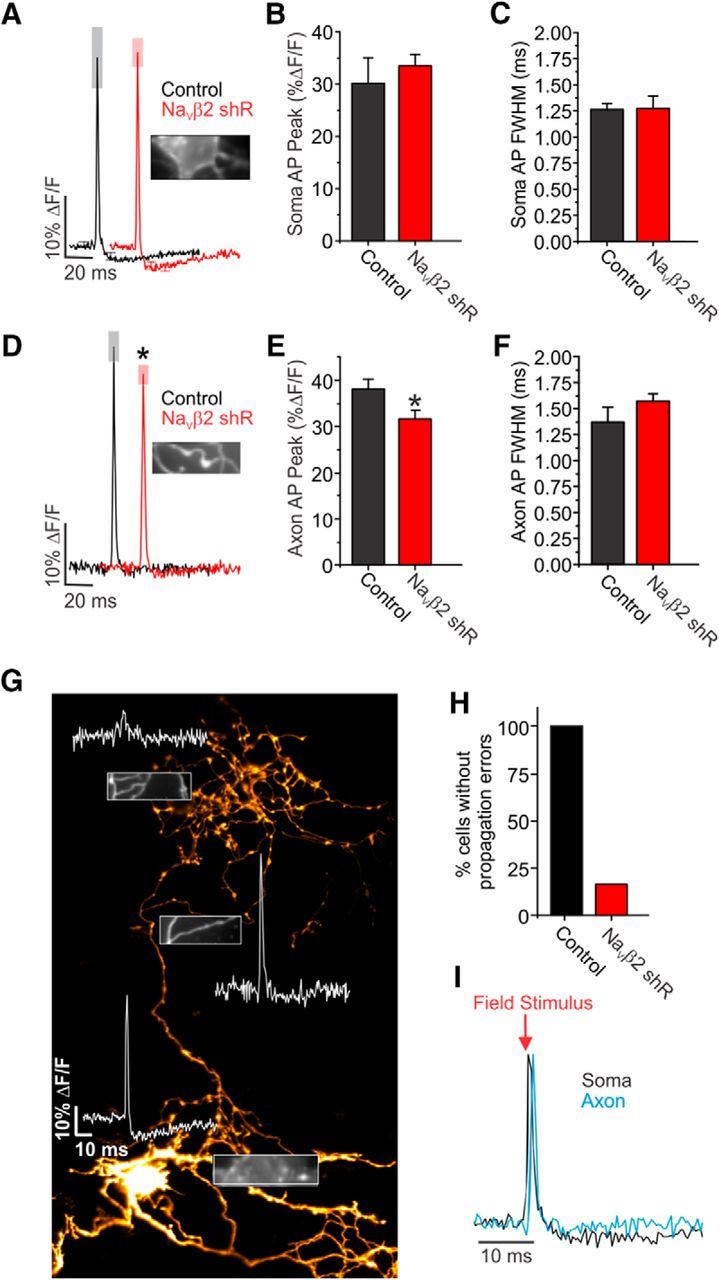
Optical measurements of AP waveforms in Navβ2 deficient neurons. A, Average AP recorded from soma in hippocampal neuron expressing QuasAr in control (black) or Navβ2 shRNA (red)-transfected neurons. Representative image of QuasAr ΔF from soma shown in inset. B, C, Average amplitudes (B) and FWHM (C) of somatic AP waveforms as shown in A (Control, n = 8; Navβ2 shRNA, n = 8). D, Average QuasAr measurements across control and Navβ2 shRNA-transfected axons. Representative image of axon/bouton QuasAr ΔF shown in inset. E, F, Average amplitudes (E) and FWHM (F) of axonal AP waveforms as shown in D. Representative image of QuasAr ΔF from axon with en passant synapses shown in inset (Control, n = 8; Navβ2 shRNA, n = 8). G, Montage of several fields (mOrange fluorescence) from a dissociated hippocampal neuron expressing QuasAr-mOrange with Navβ2 shRNA. Inset images showing the soma (bottom) and branches (middle, top) of inherent QuasAr fluorescence. Representative AP recorded from the regions shown in each inset. Scale bar, 20 μm. H, Cells displaying successful AP propagation across three branch points and soma (Control, n = 8; Navβ2 shRNA, n = 8). I, Example recording of AP from a single cell at the soma (black) and axon (blue); note the delay of the AP recorded from the axon compared with the soma, as would be expected from orthodromic propagation from the initial segment of the axon.
Navβ2 maintains AP propagation fidelity
To examine the propagation success of AP invasion across the arborization in greater detail for Navβ2-deficient neurons, we sought a robust method to reveal the nonresponding branches that our QuasAr measurements identified across the axonal arborization. We elicited Ca2+ influx using two stimulation protocols: the first was AP-evoked from field stimulation and the other was caused by a uniform membrane depolarization stimulated by a brief (5 s) perfusion of high K+ (90 mm) to open presynaptic Cav (Fig. 8A). We found that all genetic conditions responded nearly identically to high K+ stimulation with a nonsaturating ∼650% ΔF/F in all boutons ruling out a defect in synaptic Cav trafficking (Fig. 8B). Comparing these two stimulation conditions allowed us to determine any responsive boutons that failed to display evoked-Ca2+ influx during electrical stimulation. This assay allowed us to identify AP propagation failures robustly. It has been reported previously that excitatory pyramidal neurons have nearly perfect reliability to transmit single APs and trains of stimulation using injected Ca2+ dyes to measure AP arrival (Cox et al., 2000). We confirmed these previous findings are also true in our cultured neurons, in which we observed that AP propagation was nearly perfect in control cells when comparing electrical and high K+ stimulation (99.6 ± 0.3%). Interestingly, we found that Navβ2 shRNA-transfected neurons showed prolific branch failures within the arborization for AP propagation, with only 62.0 ± 3.5% of boutons responding to electrical stimulation (Fig. 8C). We explored how unique this phenotype was for the Navβ2 by also subjecting cells to Navβ4 depletion using a commercially validated shRNA directed against this related subunit because it was found recently to play a role in the axons of striatal neurons (Miyazaki et al., 2014). Navβ4 shRNA-transfected neurons did not elicit any branch point failures, suggesting that AP propagation at branch points is controlled selectively by Navβ2s in these excitatory hippocampal neurons (Fig. 8C). Knock-down of Navβ4 did cause a modest but significant decrease for single AP-evoked Ca2+ influx (28.5 ± 8.3% reduction, p < 0.05, n = 11 cells; data not shown), although the exact degree of knock-down could not be quantified. Furthermore, the reduction of Navβ2 leads to significantly impaired AP activation of presynaptic terminals within specific branches of the axon. This was determined by all boutons within a branch remaining silent in terms of AP-evoked Ca2+ entry independent of AP generation at the axon initial segment.
Figure 8.

AP propagation failure at axon branches in Navβ2 deficient neurons. A, Representative ΔF images obtained from SypGCaMP showing the increase in fluorescence during trains of 20 AP at 20 Hz stimulation or high K+ stimulation. White arrows indicate boutons responding to high-K+ stimulation but not electrical stimulation. Scale bars, 20 μm. B, Average of high-K+-driven bouton Ca2+ influx to measure functional Cavs densities in boutons. C, Ratio of responsive boutons to 20 AP to that of high-K+ stimulation. For all experiments shown (Control, n = 12; Navβ2 shRNA, n = 19; Navβ4 shRNA, n = 9; hNavβ2OE, n = 9). Error bars indicate mean ± SEM. *p < 0.05, ANOVA with Tukey's post hoc comparisons.
Branch point failures are not the result of low AP amplitudes
The decreased amplitude of the AP in Navβ2 shRNA-transfected neurons was reminiscent of the low-amplitude synaptic AP measured in cells overexpressing α2δ Ca2+ channel subunits, as described previously (Hoppa et al., 2014). We speculated that perhaps the decreased amplitude of the overall axonal AP in Navβ2 absent neurons could lead to branch point failures of AP-evoked Ca2+ entry independent of Nav subunits within branch points of the axon. Although the overexpression of α2δ-1 Ca2+ channel subunits did lead to a reduction in AP-initiated Ca2+ influx (Fig. 9A,B), as described previously (Hoppa et al., 2014), we could not observe any significant AP propagation defects from a simple lowering of AP amplitude. The ratio of boutons responding to electrical stimulation compared with high K+ stimulation was 93.0 ± 2.1% (p > 0.1) using our SypGCaMP assay (Fig. 9C,D). We attribute this small but insignificant dip in responding boutons to some trouble with signal detection because “failures” were not connected within the branch and were simply a result of overall lower responses. These results indicate a unique role for the Navβ2 within specific regions of the axon for preventing AP propagation failures across all branch points of the axonal arborization that is independent of AP amplitude at presynaptic terminals.
Figure 9.

α2δ-1 overexpression induces lower AP amplitude but does not impair AP propagation. A, Average SypGCaMP signals in response to trains of 20 AP at 20 Hz electrical stimulation for all three conditions (control, Navβ2 shRNA, and α2δ-1 OE neurons). B, Linearized average Ca2+ transients evoked by single AP stimulation. C, Representative ΔF images obtained from SypGCaMP during a 20 AP train stimulation at 20 Hz or high K+ stimulation. Scale bars, 20 μm. D, Ratio of responsive boutons to 20 AP to that of high K+ stimulation for all four conditions (control, Navβ2 shRNA, and α2δ-1 OE neurons; n = 12 for control, n = 20 for Navβ2 shRNA and n = 18 for α2δ-1OE). *p < 0.05, ANOVA with Turkey's post hoc comparisons. (Control and Navβ2 shRNA were displayed previously in Fig. 5 but are displayed again here for clarity.)
Navβ2 is essential to maintaining AP propagation fidelity
Our results suggested that Navβ2 provides subcellular tuning of the AP waveform across various branches of the unmyelinated axon to maintain AP propagation and ensure synaptic responses to AP firing. To avoid off target knock-down phenotypes, we wanted to rescue expression using an exogenous human Navβ2 (hNavβ2). To ensure both efficient reduction of endogenous Navβ2 and rescue with an exogenous hNavβ2, we created two polycistronic expression vectors including a cytosolic mCherry marker to ensure sufficient expression of sgRNA and Cas9 and expression of exogenous hNavβ2 by linking it with SypGCaMP on each of the two bicistronic T2A expression vectors (Fig. 10A), as described previously for efficient polycistronic expression (Kim et al., 2011). This CRISPR InDel approach mimicked the shRNA phenotypes for impaired AP-driven synaptic function as measured by SypGCaMP (Fig. 10B). The impaired AP-driven Ca2+ entry in neurons with Navβ2 sgRNA for trains of stimulation (sgRNA alone; 70.5 ± 4.6% of rescue, p < 0.05) and for single AP stimulation (sgRNA alone; 52.5 ± 5.8% of rescue, p < 0.05) was fully restored for both stimulations when rescued with hNavβ2 (Fig. 10C,D). Next, we tested overall AP-propagation efficiency by comparing the ratio of boutons that responded to 20 AP trains with those that responded to high-K+ stimulation. We found that exogenous hNavβ2 expression restored AP-driven Ca2+ entry in 98.9 ± 0.8% of boutons compared with those elicited by high K+, whereas sgRNA knock-down alone found a significant 30% decrease in the ratio of boutons responding to AP stimulation (70.2 ± 3.2%; Fig. 10E,F). Again, these results for electrically induced Ca2+ entry were independent of the response to high-K+ stimulation (p = 0.245; Fig. 10G). These results are consistent with Navβ2 as a specific and powerful regulator of AP propagation across branch points in arborized unmyelinated axons.
Figure 10.

Human Navβ2 rescues single AP-driven Ca2+ influx deficits associated with Navβ2 reduction. A, Schematic describing the human Navβ2 construct linked to SypGCaMP via a T2A peptide (top). Schematic describing the construct that uses the hU6 promoter to drive Navβ2 sgRNA expression and the CBh promoter to drive Cas9 and mCherry expression (bottom). B, Average SypGCaMP signals in response to the trains of 20 AP at 20 Hz stimulation. This trace is the average of 27 boutons from a single cell. C, Average of AP peak amplitudes of Ca2+ transients evoked by the trains of 20 AP at 20 Hz stimulation (rescue, n = 16; Navβ2 sgRNA, n = 20). *p = 0.00064, Student's t test. D, Average of linearized Ca2+ transients evoked by single AP electrical stimulation. *p = 6.8 * 10−6, Student's t test. E, Representative images (SypGCaMP) of 20 AP-driven or high K+-induced presynaptic Ca2+ influx from boutons. Arrows indicate boutons responding to high K+ stimulation, but not electrical stimulation. Scale bars, 20 μm. F, Average 20 AP stimulus-driven bouton Ca2+ influx (rescue, n = 17; Navβ2 sgRNA, n = 24). Shown is the ratio of responsive boutons to 20 AP to that of K+ solution. *p = 0.0074, Student's t test. G, Average of high-K+-driven bouton Ca2+ influx to measure functional Cavs densities in boutons. Error bars indicate mean ± SEM. p = 0.25, Student's t test.
Discussion
In this study, we used a combination of sensitive, genetically encoded Ca2+ and voltage indicators to examine the presynaptic AP in unmyelinated axons that form en passant boutons. We used cultured hippocampal neurons as a proxy for en passant synaptic terminals such as those commonly found in the cortex and hippocampus in vivo. We report larger than expected levels of heterogeneity in the shape of axonal AP waveform between individual branches of a single axonal arborization as measured by the optical voltage indicator QuasAr (Fig. 1), as well as the TTX sensitivity of AP-evoked Ca2+ entry (Fig. 2). Detailed optical analysis of axonal geometry revealed that axon diameter does not seem to be a critical factor in the electrical diversity of branch responses (Fig. 4). Over the course of the experiments, we uncovered a critical role of Navβ2 to modulate AP-evoked Ca2+ influx (Fig. 6), as well as maintenance of AP propagation (Fig. 8). The role of Navβ2 to ensure proper AP-evoked Ca2+ entry across an axonal arborization was independent of somatic AP generation (Fig. 7). Overall, these findings contribute to a growing importance in the computational complexity within unmyelinated segments of a single axon (Debanne et al., 2011) and molecular repertoires that control the local balances of Nav and Kv to sculpt local membrane excitability. This view is opposed to a role for the axon of simply relaying a digital all-or-none signal from the hillock to all synapses; modeling the mammalian axon with cable theory alone supports a “nanophysiology” in neuronal subcompartments (Holcman and Yuste, 2015). Although our findings were made in cultured primary neurons due to their high optical accessibility, we believe that their reliability as a well studied model for presynaptic function will translate into understanding the presynaptic AP modulation in vivo. A collection of molecules have been identified to stabilize and enrich Nav activity to modulate AP signaling at axon initial segments and nodes of Ranvier, but, to our knowledge, this is one of the first unique molecular partners of Nav providing subcellular modulation of APs in unmyelinated axons.
Subcellular physiology of Navβ2 in neurons
Navs are composed of a large (260 kDa) pore-forming α subunits encoded by nine genes and small (36 kDa) β subunits encoded by four genes, Scn1b–Scn4b (Isom et al., 1992; Isom et al., 1995; Catterall et al., 2005). When purified from the brain, Navαs are found in complex with multiple Navβs (Brackenbury and Isom, 2011). Coexpression of Navαs with various Navβs display significant changes in Nav current density, voltage-dependent gating, and inactivation kinetics in heterologous cells (Isom et al., 1994). Navβ2-null mice have a reduced Na+ current density measured from acutely dissociated neurons and optic nerve axons bundles; however, the conduction velocity and localization of channels within the node of Ranvier appears normal as measured from optic nerve bundles (Chen et al., 2002). These optic nerve fibers have been shown previously to be have resilient conductance even with minimal Nav concentrations in the neonatal state, so the role of Navβ2 may be less relevant in these mature small axon caliper neurons for successful saltatory conductance (Waxman et al., 1989). However, NaVβ2-null mice do have unique protective axonal phenotypes, including a resistance to allodynia from axon ligation (Lopez-Santiago et al., 2006), as well as neurodegeneration in an experimental model of multiple sclerosis, a disease of demyelination (O'Malley et al., 2009). It is thought that enhanced Na+ currents within the axon increase membrane excitability and underlie both of these maladies. Slight modulation Na+ current component of the waveform during active propagation within unmyelinated axons and associated en passant synapses would potentially have a much greater impact on neural function, as modeled previously (Engel and Jonas, 2005). Our data demonstrate a decreased amplitude of axonal AP and reduced Ca2+ influx at synapses with acute knock-down of Navβ2 (Figs. 6, 7) that would support a model in which the loss of Navβ2 would protect against enhancing Na+ currents in unmyelinated sections of axon. Moreover, a functional role for the subunits in normally unmyelinated sections of axon was identified clearly (Figs. 7, 8). Our data cannot rule out a possible role for Navβ2 in targeting or interacting with other ion channels such as Kvs. Previous studies revealed that Navβ1 interacts with Kv1, Kv4, and Kv7 to enhance their activity during membrane depolarization (Marionneau et al., 2012; Nguyen et al., 2012). We do not think that Navβ2 follows this interaction model because the loss of Navβ2 caused the opposite response on our axonal APs, where they lost amplitude rather than gained. Furthermore, we also think the opposite role is unlikely because enhanced Kv activity to decrease AP amplitude would also likely lead to a thinner AP FWHM, which we did not observe (Fig. 7). Based on this evidence of shorter and wider APs, we think that Navβ2 follows a more classic interaction with the Navα for surface trafficking and modulation of gating, which, due to the fine structure of the axon, is hard to parse experimentally. We can also not comment on whether axons contain heterogeneities in Nav1.6 and Nav1.2 α-subunit levels because both channels are expressed in these cells with nearly identical sensitivities to TTX (Rosker et al., 2007). It is interesting to speculate that various combinations of Navα and Navβ have defined subcellular targets, not only within the axon, but also between myelinated and unmyelinated sections given their divergent roles in the nervous system. Both Navβ1 and Navβ4 have been found to enrich at the axon initial segment with potentially antagonistic roles in modulating excitability (Aman et al., 2009). Thus far, branch points have not been considered a subcellular signaling domain in the axons relevant to AP shape, but data from us and others (Rowan et al., 2016) point to further investigation of axon collateral heterogeneity in electrical signaling.
Implications of heterogeneous axonal Nav activity for excitatory transmission
AP propagation is generally quite reliable in terms of AP invasion throughout the axon (Cox et al., 2000; Apostolides et al., 2016). Detailed measurements of CA1 axons in slices using loose-seal recordings indicated reliable transmission of APs overall, but a heterogeneity between branches for transmission, especially at high-frequency stimulation (Raastad and Shepherd, 2003). Our results agree with a reliable transmission, but we speculate that this transmitted waveform is not uniform in its shape, which could be due in part to varied levels of Nav activity between branches of the axon based on optical measurement of the AP waveform (Fig. 1) and experimental evidence using TTX pharmacology (Fig. 2). What determines higher Nav activity within the unmyelinated axon? We were unable to image endogenous Navα isoforms or Navβ2 in such small-diameter axons due to the background of Nav in adjacent dendrites and potentially cocultured astrocytes. By geometry, the two biggest impedance barriers within the axon are the synaptic boutons and the axon branch points. Our physiological data did not find a correlation with the synaptic bouton densities or geometry within given branches that failed to propagate APs (Fig. 4); therefore, we believe the enrichment of Nav activity to be perisynaptic. Furthermore, our observance of failed propagation was usually traced to the start of a branching event (Fig. 3), indicating a specific role for the branch point to modulate AP propagation. We attribute this observed heterogeneity to molecular repertoires of channels and binding partners rather than morphology. Ultimately, small CNS neurons with bifurcating axons such as those in the hippocampal CA1 invade brain regions with different release properties despite identical cellular origins of the axon (Ali et al., 1998). These cells may use the AP as a flexible signal in which overall transmission is reliable, but the information it conveys to activate synaptic transmission varies at the level of branches or even synapses. Therefore, local axonal membrane excitability is not a red or green light for propagation, but a powerful subcellular lever controlling the spread of excitation in the brain. That being said, we do not believe AP shape to be the only lever controlling the variability of vesicle release probability. It is influenced by several factors, including vesicle pool dynamics, fusion machinery, as well as the properties of Cavs (Rizzoli and Betz, 2005; Catterall and Few, 2008; Südhof and Rothman, 2009; Körber and Kuner, 2016). The use of new tools to make detailed measurements of the AP in various preparations will improve our understanding of electrogenic properties of the axon to influence synaptic transmission going forward. Recent evidence using electron microscopy has shown that presynaptic Cav density alone does not adequately explain heterogeneity in Ca2+ influx within axonal branches innervating various sections of the hippocampus, indicating a potentially critical role for the presynaptic AP waveform (Éltes et al., 2017). Given the critical role of en passant synapses and unmyelinated sections of axon in vivo within areas such as Schaffer collaterals in the hippocampus, these findings and further lines of inquiry could prove useful for specific molecular modulation of subcircuits in the brain.
Footnotes
This work was supported by the Brain Research Foundation (Grant BRFSF_2015-05) and the American Cancer Society (Grant IRG-82-003-33). We thank Hoppa Laboratory members S.A. Alpizar and R.J. O'Toole for helpful contributions; Timothy Ryan (Weill Cornell Medical College) and Allan Gulledge (Dartmouth Geisel School of Medicine) for useful discussions; Linlin Fan and Adam Cohen (Harvard University) for assistance in obtaining electrophysiological recordings; Justin Taraska for contributing INS-1 cells for Western blotting experiments; and Nobuyuki Nukina (Doshisha University) for sharing Navβ antibodies.
The authors declare no competing financial interests.
References
- Akin EJ, Solé L, Dib-Hajj SD, Waxman SG, Tamkun MM (2015) Preferential targeting of Nav1.6 voltage-gated Na+ channels to the axon initial segment during development. PLoS One 10:e0124397. 10.1371/journal.pone.0124397 [DOI] [PMC free article] [PubMed] [Google Scholar]
- Ali AB, Deuchars J, Pawelzik H, Thomson AM (1998) CA1 pyramidal to basket and bistratified cell EPSPs: dual intracellular recordings in rat hippocampal slices. J Physiol 507:201–217. 10.1111/j.1469-7793.1998.201bu.x [DOI] [PMC free article] [PubMed] [Google Scholar]
- Aman TK, Grieco-Calub TM, Chen C, Rusconi R, Slat EA, Isom LL, Raman IM (2009) Regulation of persistent Na current by interactions between beta subunits of voltage-gated Na channels. J Neurosci 29:2027–2042. 10.1523/JNEUROSCI.4531-08.2009 [DOI] [PMC free article] [PubMed] [Google Scholar]
- Andersen P, Soleng AF, Raastad M (2000) The hippocampal lamella hypothesis revisited. Brain Res 886:165–171. 10.1016/S0006-8993(00)02991-7 [DOI] [PubMed] [Google Scholar]
- Apostolides PF, Milstein AD, Grienberger C, Bittner KC, Magee JC (2016) Axonal filtering allows reliable output during dendritic plateau-driven complex spiking in CA1 neurons. Neuron 89:770–783. 10.1016/j.neuron.2015.12.040 [DOI] [PubMed] [Google Scholar]
- Ariel P, Hoppa MB, Ryan TA (2012) Intrinsic variability in Pv, RRP size, Ca(2+) channel repertoire, and presynaptic potentiation in individual synaptic boutons. Front Synaptic Neurosci 4:9. 10.3389/fnsyn.2012.00009 [DOI] [PMC free article] [PubMed] [Google Scholar]
- Augustine GJ, Charlton MP, Smith SJ (1985) Calcium entry and transmitter release at voltage-clamped nerve terminals of squid. J Physiol 367:163–181. 10.1113/jphysiol.1985.sp015819 [DOI] [PMC free article] [PubMed] [Google Scholar]
- Bean BP. (2007) The action potential in mammalian central neurons. Nat Rev Neurosci 8:451–465. 10.1038/nrn2148 [DOI] [PubMed] [Google Scholar]
- Bischofberger J, Geiger JR, Jonas P (2002) Timing and efficacy of Ca2+ channel activation in hippocampal mossy fiber boutons. J Neurosci 22:10593–10602. [DOI] [PMC free article] [PubMed] [Google Scholar]
- Borst JG, Sakmann B (1999) Effect of changes in action potential shape on calcium currents and transmitter release in a calyx-type synapse of the rat auditory brainstem. Philos Trans R Soc Lond B Biol Sci 354:347–355. 10.1098/rstb.1999.0386 [DOI] [PMC free article] [PubMed] [Google Scholar]
- Brackenbury WJ, Isom LL (2011) Na channel beta subunits: overachievers of the ion channel family. Front Pharmacol 2:53. 10.3389/fphar.2011.00053 [DOI] [PMC free article] [PubMed] [Google Scholar]
- Catterall WA, Few AP (2008) Calcium channel regulation and presynaptic plasticity. Neuron 59:882–901. 10.1016/j.neuron.2008.09.005 [DOI] [PubMed] [Google Scholar]
- Catterall WA, Goldin AL, Waxman SG (2005) International Union of Pharmacology. XLVII. Nomenclature and structure–function relationships of voltage-gated sodium channels. Pharmacol Rev 57:397–409. 10.1124/pr.57.4.4 [DOI] [PubMed] [Google Scholar]
- Chen C, Bharucha V, Chen Y, Westenbroek RE, Brown A, Malhotra JD, Jones D, Avery C, Gillespie PJ 3rd, Kazen-Gillespie KA, Kazarinova-Noyes K, Shrager P, Saunders TL, Macdonald RL, Ransom BR, Scheuer T, Catterall WA, Isom LL (2002) Reduced sodium channel density, altered voltage dependence of inactivation, and increased susceptibility to seizures in mice lacking sodium channel beta 2-subunits. Proc Natl Acad Sci U S A 99:17072–17077. 10.1073/pnas.212638099 [DOI] [PMC free article] [PubMed] [Google Scholar]
- Chen TW, Wardill TJ, Sun Y, Pulver SR, Renninger SL, Baohan A, Schreiter ER, Kerr RA, Orger MB, Jayaraman V, Looger LL, Svoboda K, Kim DS (2013) Ultrasensitive fluorescent proteins for imaging neuronal activity. Nature 499:295–300. 10.1038/nature12354 [DOI] [PMC free article] [PubMed] [Google Scholar]
- Cox CL, Denk W, Tank DW, Svoboda K (2000) Action potentials reliably invade axonal arbors of rat neocortical neurons. Proc Natl Acad Sci U S A 97:9724–9728. 10.1073/pnas.170278697 [DOI] [PMC free article] [PubMed] [Google Scholar]
- Debanne D, Campanac E, Bialowas A, Carlier E, Alcaraz G (2011) Axon physiology. Physiol Rev 91:555–602. 10.1152/physrev.00048.2009 [DOI] [PubMed] [Google Scholar]
- Dodge FA Jr, Rahamimoff R (1967) Co-operative action a calcium ions in transmitter release at the neuromuscular junction. J Physiol 193:419–432. 10.1113/jphysiol.1967.sp008367 [DOI] [PMC free article] [PubMed] [Google Scholar]
- Éltes T, Kirizs T, Nusser Z, Holderith N (2017) Target Cell Type-Dependent Differences in Ca2+ Channel Function Underlie Distinct Release Probabilities at Hippocampal Glutamatergic Terminals. J Neurosci 37:1910–1924. 10.1523/JNEUROSCI.2024-16.2017 [DOI] [PMC free article] [PubMed] [Google Scholar]
- Engel D, Jonas P (2005) Presynaptic action potential amplification by voltage-gated Na+ channels in hippocampal mossy fiber boutons. Neuron 45:405–417. 10.1016/j.neuron.2004.12.048 [DOI] [PubMed] [Google Scholar]
- Ermolyuk YS, Alder FG, Henneberger C, Rusakov DA, Kullmann DM, Volynski KE (2012) Independent regulation of basal neurotransmitter release efficacy by variable Ca(2)+ influx and bouton size at small central synapses. PLoS Biol 10:e1001396. 10.1371/journal.pbio.1001396 [DOI] [PMC free article] [PubMed] [Google Scholar]
- Hartshorne RP, Messner DJ, Coppersmith JC, Catterall WA (1982) The saxitoxin receptor of the sodium channel from rat brain. Evidence for two nonidentical beta subunits. J Biol Chem 257:13888–13891. [PubMed] [Google Scholar]
- Hochbaum DR, et al. (2014) All-optical electrophysiology in mammalian neurons using engineered microbial rhodopsins. Nat Methods 11:825–833. 10.1038/nmeth.3000 [DOI] [PMC free article] [PubMed] [Google Scholar]
- Holcman D, Yuste R (2015) The new nanophysiology: regulation of ionic flow in neuronal subcompartments. Nat Rev Neurosci 16:685–692. 10.1038/nrn4022 [DOI] [PubMed] [Google Scholar]
- Hoppa MB, Lana B, Margas W, Dolphin AC, Ryan TA (2012a) alpha2delta expression sets presynaptic calcium channel abundance and release probability. Nature 486:122–125. 10.1038/nature11033 [DOI] [PMC free article] [PubMed] [Google Scholar]
- Hoppa MB, Jones E, Karanauskaite J, Ramracheya R, Braun M, Collins SC, Zhang Q, Clark A, Eliasson L, Genoud C, Macdonald PE, Monteith AG, Barg S, Galvanovskis J, Rorsman P (2012b) Multivesicular exocytosis in rat pancreatic beta cells. Diabetologia 55:1001–1012. 10.1007/s00125-011-2400-5 [DOI] [PMC free article] [PubMed] [Google Scholar]
- Hoppa MB, Gouzer G, Armbruster M, Ryan TA (2014) Control and plasticity of the presynaptic action potential waveform at small CNS nerve terminals. Neuron 84:778–789. 10.1016/j.neuron.2014.09.038 [DOI] [PMC free article] [PubMed] [Google Scholar]
- Hu H, Jonas P (2014) A supercritical density of Na(+) channels ensures fast signaling in GABAergic interneuron axons. Nat Neurosci 17:686–693. 10.1038/nn.3678 [DOI] [PMC free article] [PubMed] [Google Scholar]
- Isom LL, De Jongh KS, Patton DE, Reber BF, Offord J, Charbonneau H, Walsh K, Goldin AL, Catterall WA (1992) Primary structure and functional expression of the beta 1 subunit of the rat brain sodium channel. Science 256:839–842. 10.1126/science.1375395 [DOI] [PubMed] [Google Scholar]
- Isom LL, De Jongh KS, Catterall WA (1994) Auxiliary subunits of voltage-gated ion channels. Neuron 12:1183–1194. 10.1016/0896-6273(94)90436-7 [DOI] [PubMed] [Google Scholar]
- Isom LL, Ragsdale DS, De Jongh KS, Westenbroek RE, Reber BF, Scheuer T, Catterall WA (1995) Structure and function of the beta 2 subunit of brain sodium channels, a transmembrane glycoprotein with a CAM motif. Cell 83:433–442. 10.1016/0092-8674(95)90121-3 [DOI] [PubMed] [Google Scholar]
- Kawaguchi SY, Sakaba T (2015) Control of inhibitory synaptic outputs by low excitability of axon terminals revealed by direct recording. Neuron 85:1273–1288. 10.1016/j.neuron.2015.02.013 [DOI] [PubMed] [Google Scholar]
- Kim JH, Lee SR, Li LH, Park HJ, Park JH, Lee KY, Kim MK, Shin BA, Choi SY (2011) High cleavage efficiency of a 2A peptide derived from porcine teschovirus-1 in human cell lines, zebrafish and mice. PLoS One 6:e18556. 10.1371/journal.pone.0018556 [DOI] [PMC free article] [PubMed] [Google Scholar]
- Koester HJ, Sakmann B (2000) Calcium dynamics associated with action potentials in single nerve terminals of pyramidal cells in layer 2/3 of the young rat neocortex. J Physiol 529:625–646. 10.1111/j.1469-7793.2000.00625.x [DOI] [PMC free article] [PubMed] [Google Scholar]
- Körber C, Kuner T (2016) Molecular Machines Regulating the Release Probability of Synaptic Vesicles at the Active Zone. Front Synaptic Neurosci 8:5. 10.3389/fnsyn.2016.00005 [DOI] [PMC free article] [PubMed] [Google Scholar]
- Kralj JM, Douglass AD, Hochbaum DR, Maclaurin D, Cohen AE (2011) Optical recording of action potentials in mammalian neurons using a microbial rhodopsin. Nat Methods 9:90–95. 10.1038/nmeth.1782 [DOI] [PMC free article] [PubMed] [Google Scholar]
- Leão RM, Kushmerick C, Pinaud R, Renden R, Li GL, Taschenberger H, Spirou G, Levinson SR, von Gersdorff H (2005) Presynaptic Na+ channels: locus, development, and recovery from inactivation at a high-fidelity synapse. J Neurosci 25:3724–3738. 10.1523/JNEUROSCI.3983-04.2005 [DOI] [PMC free article] [PubMed] [Google Scholar]
- Li H, Foss SM, Dobryy YL, Park CK, Hires SA, Shaner NC, Tsien RY, Osborne LC, Voglmaier SM (2011) Concurrent imaging of synaptic vesicle recycling and calcium dynamics. Front Mol Neurosci 4:34. 10.3389/fnmol.2011.00034 [DOI] [PMC free article] [PubMed] [Google Scholar]
- Li L, Bischofberger J, Jonas P (2007) Differential gating and recruitment of P/Q-, N-, and R-type Ca2+ channels in hippocampal mossy fiber boutons. J Neurosci 27:13420–13429. 10.1523/JNEUROSCI.1709-07.2007 [DOI] [PMC free article] [PubMed] [Google Scholar]
- Lisman JE, Raghavachari S, Tsien RW (2007) The sequence of events that underlie quantal transmission at central glutamatergic synapses. Nat Rev Neurosci 8:597–609. 10.1038/nrn2191 [DOI] [PubMed] [Google Scholar]
- Lopez-Santiago LF, Pertin M, Morisod X, Chen C, Hong S, Wiley J, Decosterd I, Isom LL (2006) Sodium channel beta2 subunits regulate tetrodotoxin-sensitive sodium channels in small dorsal root ganglion neurons and modulate the response to pain. J Neurosci 26:7984–7994. 10.1523/JNEUROSCI.2211-06.2006 [DOI] [PMC free article] [PubMed] [Google Scholar]
- Lüscher HR, Shiner JS (1990) Simulation of action potential propagation in complex terminal arborizations. Biophys J 58:1389–1399. 10.1016/S0006-3495(90)82485-1 [DOI] [PMC free article] [PubMed] [Google Scholar]
- Marionneau C, Carrasquillo Y, Norris AJ, Townsend RR, Isom LL, Link AJ, Nerbonne JM (2012) The sodium channel accessory subunit Navbeta1 regulates neuronal excitability through modulation of repolarizing voltage-gated K(+) channels. J Neurosci 32:5716–5727. 10.1523/JNEUROSCI.6450-11.2012 [DOI] [PMC free article] [PubMed] [Google Scholar]
- Mishchenko Y, Hu T, Spacek J, Mendenhall J, Harris KM, Chklovskii DB (2010) Ultrastructural analysis of hippocampal neuropil from the connectomics perspective. Neuron 67:1009–1020. 10.1016/j.neuron.2010.08.014 [DOI] [PMC free article] [PubMed] [Google Scholar]
- Miyazaki H, et al. (2014) Singular localization of sodium channel beta4 subunit in unmyelinated fibres and its role in the striatum. Nat Commun 5:5525. 10.1038/ncomms6525 [DOI] [PubMed] [Google Scholar]
- Namadurai S, Yereddi NR, Cusdin FS, Huang CL, Chirgadze DY, Jackson AP (2015) A new look at sodium channel beta subunits. Open Biol 5:140192. 10.1098/rsob.140192 [DOI] [PMC free article] [PubMed] [Google Scholar]
- Nguyen HM, Miyazaki H, Hoshi N, Smith BJ, Nukina N, Goldin AL, Chandy KG (2012) Modulation of voltage-gated K+ channels by the sodium channel beta1 subunit. Proc Natl Acad Sci U S A 109:18577–18582. 10.1073/pnas.1209142109 [DOI] [PMC free article] [PubMed] [Google Scholar]
- O'Malley HA, Shreiner AB, Chen GH, Huffnagle GB, Isom LL (2009) Loss of Na+ channel beta2 subunits is neuroprotective in a mouse model of multiple sclerosis. Mol Cell Neurosci 40:143–155. 10.1016/j.mcn.2008.10.001 [DOI] [PMC free article] [PubMed] [Google Scholar]
- Prakriya M, Mennerick S (2000) Selective depression of low-release probability excitatory synapses by sodium channel blockers. Neuron 26:671–682. 10.1016/S0896-6273(00)81203-9 [DOI] [PubMed] [Google Scholar]
- Raastad M, Shepherd GM (2003) Single-axon action potentials in the rat hippocampal cortex. J Physiol 548:745–752. 10.1113/jphysiol.2002.032706 [DOI] [PMC free article] [PubMed] [Google Scholar]
- Rama S, Zbili M, Bialowas A, Fronzaroli-Molinieres L, Ankri N, Carlier E, Marra V, Debanne D (2015) Presynaptic hyperpolarization induces a fast analogue modulation of spike-evoked transmission mediated by axonal sodium channels. Nat Commun 6:10163. 10.1038/ncomms10163 [DOI] [PMC free article] [PubMed] [Google Scholar]
- Rizzoli SO, Betz WJ (2005) Synaptic vesicle pools. Nat Rev Neurosci 6:57–69. 10.1038/nrn1583 [DOI] [PubMed] [Google Scholar]
- Rosenmund C, Clements JD, Westbrook GL (1993) Nonuniform probability of glutamate release at a hippocampal synapse. Science 262:754–757. 10.1126/science.7901909 [DOI] [PubMed] [Google Scholar]
- Rosker C, Lohberger B, Hofer D, Steinecker B, Quasthoff S, Schreibmayer W (2007) The TTX metabolite 4,9-anhydro-TTX is a highly specific blocker of the Na(v1.6) voltage-dependent sodium channel. Am J Physiol Cell Physiol 293:C783–789. 10.1152/ajpcell.00070.2007 [DOI] [PubMed] [Google Scholar]
- Rowan MJ, Tranquil E, Christie JM (2014) Distinct Kv channel subtypes contribute to differences in spike signaling properties in the axon initial segment and presynaptic boutons of cerebellar interneurons. J Neurosci 34:6611–6623. 10.1523/JNEUROSCI.4208-13.2014 [DOI] [PMC free article] [PubMed] [Google Scholar]
- Rowan MJ, DelCanto G, Yu JJ, Kamasawa N, Christie JM (2016) Synapse-Level Determination of Action Potential Duration by K(+) Channel Clustering in Axons. Neuron 91:370–383. 10.1016/j.neuron.2016.05.035 [DOI] [PMC free article] [PubMed] [Google Scholar]
- Sabatini BL, Regehr WG (1997) Control of neurotransmitter release by presynaptic waveform at the granule cell to Purkinje cell synapse. J Neurosci 17:3425–3435. [DOI] [PMC free article] [PubMed] [Google Scholar]
- Siegelbaum SA, Camardo JS, Kandel ER (1982) Serotonin and cyclic AMP close single K+ channels in Aplysia sensory neurones. Nature 299:413–417. 10.1038/299413a0 [DOI] [PubMed] [Google Scholar]
- Südhof TC, Rothman JE (2009) Membrane fusion: grappling with SNARE and SM proteins. Science 323:474–477. 10.1126/science.1161748 [DOI] [PMC free article] [PubMed] [Google Scholar]
- Waxman SG, Black JA, Kocsis JD, Ritchie JM (1989) Low density of sodium channels supports action potential conduction in axons of neonatal rat optic nerve. Proc Natl Acad Sci U S A 86:1406–1410. 10.1073/pnas.86.4.1406 [DOI] [PMC free article] [PubMed] [Google Scholar]
- Wimmer VC, Reid CA, Mitchell S, Richards KL, Scaf BB, Leaw BT, Hill EL, Royeck M, Horstmann MT, Cromer BA, Davies PJ, Xu R, Lerche H, Berkovic SF, Beck H, Petrou S (2010) Axon initial segment dysfunction in a mouse model of genetic epilepsy with febrile seizures plus. J Clin Invest 120:2661–2671. 10.1172/JCI42219 [DOI] [PMC free article] [PubMed] [Google Scholar]
- Yu FH, Westenbroek RE, Silos-Santiago I, McCormick KA, Lawson D, Ge P, Ferriera H, Lilly J, DiStefano PS, Catterall WA, Scheuer T, Curtis R (2003) Sodium channel beta4, a new disulfide-linked auxiliary subunit with similarity to beta2. J Neurosci 23:7577–7585. [DOI] [PMC free article] [PubMed] [Google Scholar]