Abstract
Research into the neural correlates of individual differences in imagery vividness point to an important role of the early visual cortex. However, there is also great fluctuation of vividness within individuals, such that only looking at differences between people necessarily obscures the picture. In this study, we show that variation in moment-to-moment experienced vividness of visual imagery, within human subjects, depends on the activity of a large network of brain areas, including frontal, parietal, and visual areas. Furthermore, using a novel multivariate analysis technique, we show that the neural overlap between imagery and perception in the entire visual system correlates with experienced imagery vividness. This shows that the neural basis of imagery vividness is much more complicated than studies of individual differences seemed to suggest.
SIGNIFICANCE STATEMENT Visual imagery is the ability to visualize objects that are not in our direct line of sight: something that is important for memory, spatial reasoning, and many other tasks. It is known that the better people are at visual imagery, the better they can perform these tasks. However, the neural correlates of moment-to-moment variation in visual imagery remain unclear. In this study, we show that the more the neural response during imagery is similar to the neural response during perception, the more vivid or perception-like the imagery experience is.
Keywords: mental imagery, multivariate analyses, neural overlap, perception, working memory
Introduction
Visual imagery allows us to think and reason about objects that are absent in the visual field by creating a mental image of them. This ability plays an important role in several cognitive processes, such as working memory, mental rotation, reasoning about future events, and many more (Kosslyn et al., 2001). The vividness of visual imagery seems to be a key factor in these cognitive abilities, with more vivid imagery being linked to better performance on tasks requiring imagery (Keogh and Pearson, 2011, 2014; Albers et al. 2013).
There are great individual differences in how vividly people can generate a mental image (Cui et al., 2007; Lee et al., 2012; Bergmann et al., 2016). However, within individuals there is also variation in imagery vividness: in some instances, imagery is much more vivid than in other instances (Pearson et al., 2008). To date, the neural mechanisms underlying this moment-to-moment variation in experienced imagery vividness have remained unclear.
Previous work has shown that people who have more vivid visual imagery, as measured by the Vividness of Visual Imagery Questionnaire (VVIQ) (Marks, 1973), show higher activity in early visual cortex during imagery (Cui et al., 2007). Furthermore, individual differences in imagery precision and strength, as measured by the effect on subsequent binocular rivalry, are related to the size of V1, whereas individual differences in subjective imagery vividness correlate with prefrontal cortex volume but not with visual cortex anatomy (Bergmann et al., 2016). Studies using multivariate analysis techniques have shown that there is overlap in stimulus representations between imagery and perception across the whole visual hierarchy, with more overlap in higher visual areas (Reddy et al., 2010; Lee et al., 2012). However, only the overlap between perception and imagery in the primary visual cortex correlates with VVIQ scores and with imagery ability as measured by task performance (Lee et al., 2012; Albers et al., 2013).
It remains unclear which of these neural correlates are important in determining moment-to-moment vividness of visual imagery and whether V1, especially the neural overlap with perception in V1, also relates to the variation of vividness within participants. In the current study, we investigated this question by having participants perform a retro-cue imagery task in the MRI scanner and rate their experienced vividness in every trial. First, we explored where in the brain activity correlates with vividness. Second, we investigated the overlap of category representations of perceived and imagined stimuli and in which areas this overlap is modulated by imagery vividness.
Materials and Methods
Participants.
Twenty-nine healthy adult volunteers with normal or corrected to normal vision gave written informed consent and participated in the experiment. Three participants were excluded: two because of insufficient data caused by scanner problems and one because of not finishing the task. Twenty-six participants (mean ± SD age = 24.31 ± 3.05 years; 18 female) were included in the reported analyses. The study was approved by the local ethics committee (CMO Arnhem-Nijmegen).
Experimental paradigm.
Before scanning we asked participants to fill in the VVIQ. This 16-item scale is summarized in a vividness score between 1 and 4 for each participant, where a score of 1 indicates high and 4 indicates low vividness.
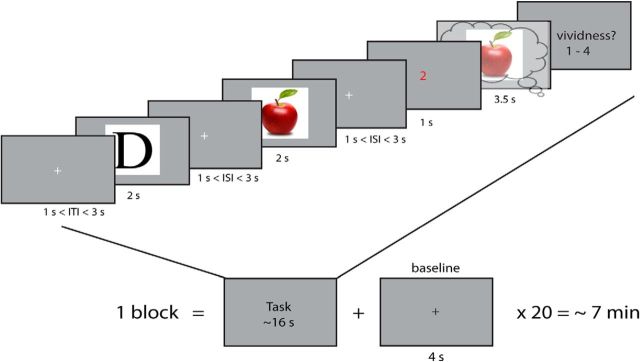
The experimental paradigm is depicted in Figure 1. We adapted a retro-cue working memory paradigm (Harrison and Tong, 2009). In each trial, participants were shown two objects successively, followed by a cue indicating which of the two they subsequently should imagine. During imagery, a frame was presented within which subjects were asked to imagine the cued stimulus as vividly as possible. After this, they indicated their experienced vividness on a scale from 1 to 4, where 1 was low vividness and 4 was high vividness. Previous research has shown that such a subjective imagery rating shows high test-retest reliability and correlates with objective measures of imagery vividness (Pearson et al., 2011; Bergmann et al., 2016).
Figure 1.
Experimental paradigm. Participants were shown two objects for 2 s each with a random interstimulus interval (ISI) of between 1 and 3 s during which a fixation cross was shown. Next, another fixation cross was shown for 1–3 s after which a red cue was presented indicating which of the two objects the participant had to imagine. Subsequently, a frame was shown for 3.5 s on which the participant had to imagine the cued stimulus. After this, they had to rate their experienced imagery vividness on a scale from 1 (not vivid at all) to 4 (very vivid).
There were 20 of these trials per block. Each stimulus was perceived 60 times and imagined 30 times over the course of the whole experiment, resulting in nine blocks in total and a total scanner time of approximately 1.5 hours per participant.
Stimuli.
Six images obtained from the World Wide Web were used as stimuli: 2 faces (Barack Obama and Emma Watson), 2 letters ('D' and 'I'), and 2 kinds of fruit (banana and apple). These three categories were chosen because they had, respectively, high, medium, and low Kolmogorov complexity, which is a measure that describes the complexity of an image in terms of its shortest possible description and can be approximated by its normalized compressed file size. It has been shown that the neural response in visual cortex is influenced by the Kolmogorov complexity of the stimulus (Güclu and van Gerven, 2015). Furthermore, the within-category exemplars were chosen to be maximally different, such as to allow potential within-class differentiation. For the letters, this was quantified as the pair of images with the least pixel overlap.
fMRI acquisition.
Each block was recorded in a separate fMRI run, leading to 9 runs in total. In between runs, the participant had a break and indicated by means of a button press when they were ready for the experiment to continue. fMRI data were recorded on a Siemens 3T Prisma scanner with a Multiband 4 sequence (TR, 1.5 s; voxel size, 2 × 2 × 2 mm; TE, 39.6 ms) and a 32 channel head coil. For all participants, the field of view was tilted −25° from the transverse plane, using the Siemens AutoAlign Head software, resulting in the same tilt relative to the individual participant's head position. T1-weighted structural images (MPRAGE; voxel size, 1 × 1 × 1 mm; TR, 2.3 s) were also acquired for each participant.
fMRI data preprocessing.
Data were preprocessed using SPM8 (RRID: SCR_007037). Functional imaging data were motion corrected and coregistered to the T1 structural scan. No spatial or temporal smoothing was performed. A high-pass filter of 128 s was used to remove slow signal drift.
Univariate GLM analysis.
Before the multivariate analyses, we first ran a standard GLM in SPM8 in which we modeled the different regressors separately for each fMRI run. We modeled, per category, the perception events, imagery events, and the parametric modulation of the imagery response by vividness each in a separate regressor. The intertrial intervals were modeled as a baseline regressor during which there was no imagery. The visual cues, the presentation of the vividness instruction screen and the button presses, were included in separate nuisance regressors, along with subject movement in six additional regressors. This analysis gave us the β weight of each regressor for each voxel separately. Significance testing for univariate contrasts was done on the normalized smoothed t maps using FSL's cluster-based permutation technique (FSL, RRID: SCR_002823). To illustrate the parametric influence of vividness, a separate GLM was run in which the imagery response per vividness level was modeled in a separate regressor, collapsed over stimulus categories, and concatenated over runs.
Searchlight-based cross-validated MANOVA.
Numerous studies have shown that information about complex cognitive processes, such as visual imagery, is often more clearly present in patterns of neural responses than in the mean response amplitude pooled over voxels (Kok et al., 2012; Tong et al., 2012; Albers et al., 2013; Bosch et al., 2014). Therefore, in this study, we focused on effects in the multivariate patterns of voxel responses.
We used the multivariate searchlight-based analysis technique developed by Allefeld and Haynes (2014). This analysis takes the parameter estimates of the GLM regressors per run as input and computes the multivariate “pattern distinctness” of any given contrast per searchlight. We chose a searchlight with a radius of 4 mm, leading to 33 voxels per sphere, in line with the findings of Kriegeskorte et al. (2006), who showed that this size is optimal for most brain regions.
The pattern distinctness D of the two conditions in any contrast is defined as the magnitude of the between-condition covariance compared with the within-condition covariance (Allefeld and Haynes, 2014). When there are only two conditions, which is the case in all our contrasts, D has a clear relationship to the Mahalanobis distance. Let
 |
denote the Mahalanobis distance, where μ1 and μ2 are p × 1 vectors representing the means of the two conditions and Σ is a p × p matrix representing the data covariance, where p is the number of voxels per searchlight. The distinctness is related to the Mahalanobis distance as follows:
 |
where n1 and n2 are the number of data points per condition.
As defined here, D is a squared distance measure and therefore cannot take on values smaller than zero. If D is close to zero or zero, estimation errors mostly increase the estimate. This problem is solved by implementing a leave-one-run-out cross-validation. This leads to the final, unbiased estimator of pattern distinctness as follows:
 |
where m is the number of runs, p a correction for the searchlight size and fE the residual degrees of freedom per run.
Parametric modulation by vividness analysis.
We first wanted to investigate where in the brain the neural response was modulated by trial-by-trial differences in experienced imagery vividness. To this end, we used the above-mentioned technique with the contrast of the imagery × vividness parametric regressor per category versus the implicit baseline (i.e., the main effect of the parametric regressor). This analysis reveals for each category in which areas the pattern of voxel responses is modulated by the experienced vividness.
Representational overlap imagery and perception analysis.
Second, we were interested in revealing the similarity in neural category representations between perception and imagery and subsequently investigating where this was modulated by vividness. Previous studies used cross-decoding for this purpose (Reddy et al., 2010; Lee et al., 2012; Albers et al., 2013). The rationale behind this technique is that, if stimulus representations are similar across two conditions (e.g., imagery and perception), you can use a classifier trained to decode the stimulus in one condition to decode the stimulus in the other condition. The accuracy of this cross-decoding is then interpreted as a measure of similarity or stability in representations over the two conditions. However, this is a rather indirect approach and depends highly on the exact classifier used.
Within the cross-validated MANOVA (cvMANOVA) framework (see above) representational overlap can be calculated much more directly. Overlap between two conditions can be seen as the complement of an interaction. An interaction tries to show that the representations or difference between conditions of one factor change under the conditions of another factor. When investigating overlap, we try to show that the representations remain stable under the levels of another factor. In the context of cvMANOVA, the pattern stability of one factor over the levels of another factor is defined as the main effect of that factor minus the interaction effect with the other factor. In the current analysis, the pattern stability of category over the levels of modality (perception vs imagery) is defined as follows:
 |
where D̂(C) is the main effect of category over all levels of modality (perception and imagery trials together) and D̂(M × C) is the interaction between category and modality. D̂(C\M) then reveals in which voxels the effect of category remained stable during imagery compared with perception.
Modulation of overlap by vividness analysis.
To investigate where the overlap between perception and imagery was influenced by the experienced imagery vividness, we had to identify those voxels that (1) represent the stimulus category during both perception and imagery and (2) are modulated by vividness. This effect is found in the stability in category effect between the perception response and the imagery × vividness response. This stability is calculated in a similar way as the stability of the category effect between the perception and imagery response as described above, but now instead of using the imagery regressor we used the imagery × vividness regressor.
Pooled permutation testing group statistics.
Stelzer et al. (2013) argued that the application of standard second-level statistics, including t tests, to MVPA measures is in many cases invalid due to violations of assumptions. Instead, they suggest permutation testing to generate the empirical null-distribution, thereby circumventing the need to rely on assumptions about this distribution. We followed their approach and performed permutation tests.
Single-subject permutations were generated by a sign-permutation procedure adapted for cross-validation as described by Allefeld and Haynes (2014). Because of computational limits, we generated 25 single-subject permutations per contrast. The permuted maps were subsequently normalized to MNI space. Second-level permutations were generated by randomly drawing (with replacement) 1 of the 25 permutation maps per subject and then averaging this selection to a group permutation (Stelzer et al., 2013). For each voxel position, the empirical null-distribution was generated using 10,000 group permutation maps. p values were calculated per voxel as the right-tailed area of the histogram of permutated distinctness from the mean over subjects. Cluster correction was performed, ensuring that voxels were only identified as significant if they belonged to a cluster of at least 50 significant voxels. We corrected for multiple comparisons using FDR correction with a q value cutoff of 0.01.
Because the vividness regressor was not estimable in every run due to lack of variation in some runs, there were fewer runs available to estimate these contrasts. Therefore, these significance maps are based on 10 instead of 25 single subject permutations, but still 10,000 group-level permutations. Furthermore, two participants were removed from this analysis because they did not have enough variation in their responses to even produce 10 permutations. For this analysis, the q value cutoff was set to 0.05.
Results
Behavioral results
Before the experiment, participants filled out the VVIQ, which is a self-report measure of people's ability to vividly imagine scenes and objects (Marks, 1973; Cui et al., 2007). During the experiment, participants imagined previously seen, cued images and rated their vividness after each trial. First, we investigated whether the reported averaged vividness ratings and VVIQ scores were related. There was a significant negative correlation between the VVIQ and the averaged vividness ratings over trials (r = −0.45, p = 0.02). Because the polarity of the two scales is reversed, this indicates that subjects with a higher imagery vividness as measured by the VVIQ also experienced on average more vivid imagery during the experiment.
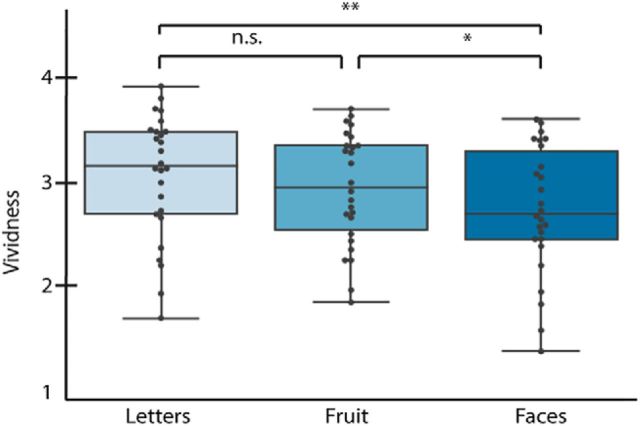
Next, we explored whether experienced imagery vividness was influenced by stimulus category. We performed t tests between the vividness scores of the different stimulus categories. As shown in Figure 2, there was a significant difference in vividness between letters (3.12 ± 0.59) and faces (2.80 ± 0.61; p = 0.006, t(25) = 3.01) and between faces and fruit (2.99 ± 0.53; p = 0.012, t(25) = 2.71). There was a nonsignificant difference between fruit and letters (p = 0.076, t(25) = 1.85). Because the categories were of different complexity levels, this shows that vividness was modulated by stimulus complexity, such that imagery of simple stimuli was experienced as more vivid than imagery of more complex stimuli. This means that any effect of vividness on the neural responses aggregated over categories may be influenced by the effect of stimulus category. Therefore, we performed subsequent vividness analyses separately for each stimulus category.
Figure 2.
Average trial-by-trial vividness ratings for the different stimulus categories. For each box: the central mark indicates the median, the edges of the box indicate the 25th and 75th percentiles, and the whisker indicates the minimum and maximum values. Each dot indicates the average for one participant. *p < 0.05. **p < 0.01.
Univariate fMRI results
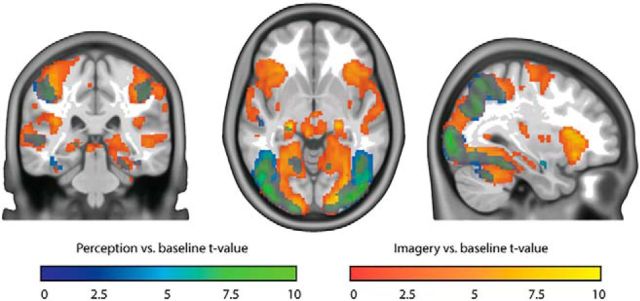
To investigate which brain areas were activated by the different phases in the imagery task, we contrasted activity during perception and imagery versus baseline. Both perception and imagery activated large parts of the visual cortex (Fig. 3). Here activity is pooled over all imagery and perception trials so these results are not informative about overlap in stimulus representations.
Figure 3.
Perception and imagery versus baseline. Blue-green represents t values for perception versus baseline. Red-yellow represents t values for imagery versus baseline. Shown t values were significant on the group level, FDR corrected for multiple comparisons.
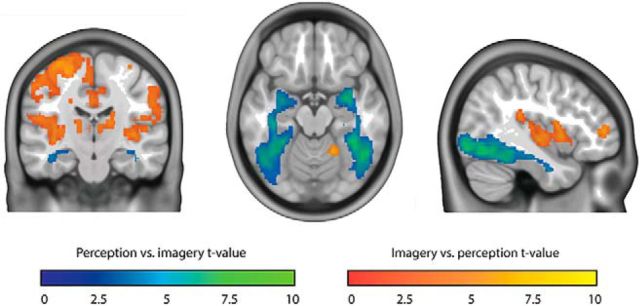
To directly compare activity between perception and imagery, we contrasted the two conditions (Fig. 4). Even though both conditions activated visual cortex with respect to baseline, we observed stronger activity during perception than imagery throughout the whole ventral visual stream. In contrast, imagery led to stronger activity in more anterior areas, including insula, left dorsal lateral prefrontal cortex, and medial frontal cortex.
Figure 4.
Perception versus imagery. Blue-green represents t values for perception versus imagery. Red-yellow represents t values for imagery versus perception. Shown t values were significant on the group level, FDR corrected for multiple comparisons.
Parametric modulation by vividness
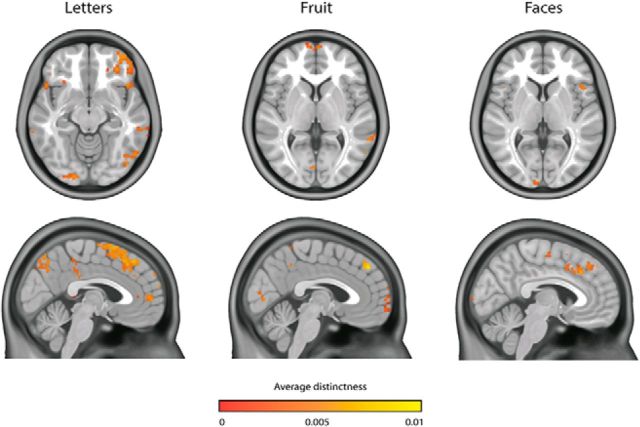
We first investigated where in the brain activity was modulated by experienced imagery vividness. To this end, we used the cvMANOVA analysis technique developed by Allefeld and Haynes (2014) (see Materials and Methods). This analysis investigates per searchlight whether the pattern of voxel responses is influenced by the experienced imagery vividness. In all three categories, there were significant clusters in early visual cortex, precuneus, medial frontal cortex, and right parietal cortex (Fig. 5). This means that, in these regions, patterns of voxel responses were modulated by the experienced imagery vividness.
Figure 5.
Parametric modulation by experienced imagery vividness per category. Shown distinctness values were significant at the group level.
Overlap between perception and imagery and modulation by vividness
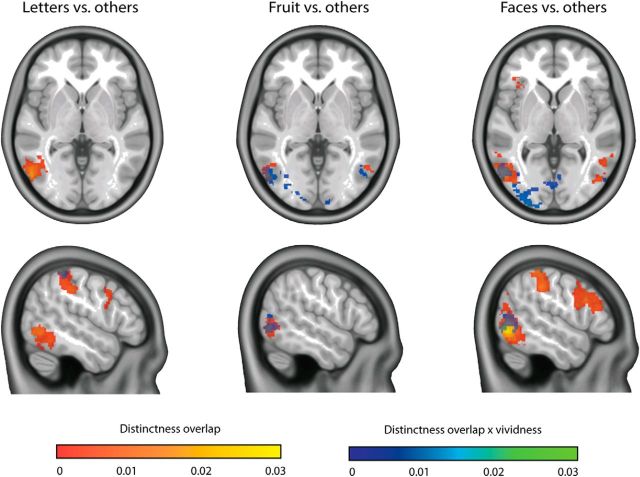
Subsequently, we investigated the overlap in category representations between imagery and perception and where in the brain this overlap was influenced by experienced vividness. Within the cvMANOVA framework, overlap is defined as that part of the category effect that was similar for imagery and perception (see Materials and Methods). In all categories, there was large overlap between imagery and perception in the lateral occipital complex. For both the letter and face category, there was also high overlap in parietal and premotor areas (Fig. 6, red-yellow). Vividness modulated the overlap in all categories in the superior parietal cortex, in the fruit and face category in the entire visual cortex, and in the letter category in right inferior temporal cortex and left intraparietal sulcus (Fig. 6, blue-green).
Figure 6.
Overlap in category representations between perception and imagery. Red-yellow represents that the overlap is shown that is not modulated by vividness. Blue-green represents the modulation by vividness. Shown distinctness values were significant on the group level.
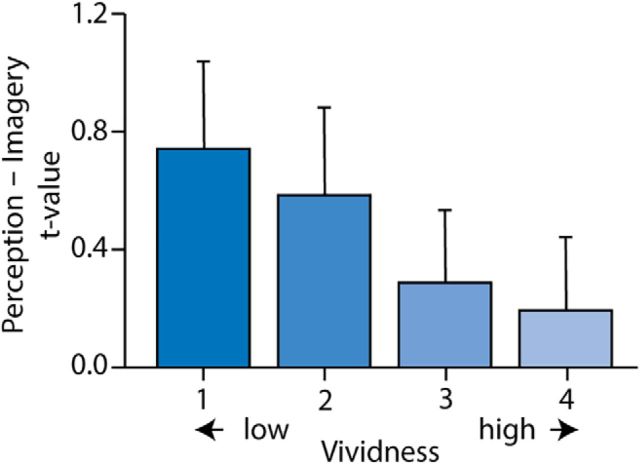
To illustrate this finding more clearly, we ran a new GLM in which we modeled the imagery response for each vividness level separately. In Figure 7, we plotted the difference between the main effect of perception and the main effect of imagery in early visual cortex, for each vividness level. More vivid imagery was associated with a smaller difference between perception and imagery.
Figure 7.
Difference between main effect of perception and main effect of imagery, separately for the four vividness levels. The results are shown for a voxel in the early visual cortex that showed the highest overlap between the main effect of perception and the main effect of the most vivid imagery, as quantified by a conjunction analysis. MNI coordinates: 34, −96, 4.
Discussion
In the present study, we investigated (1) in which brain areas activity was modulated by variation in experienced vividness and (2) where the overlap between perception and imagery was influenced by vividness. There was an effect of vividness on activation in the precuneus, right parietal cortex, medial frontal cortex, and parts of early visual cortex in all categories. We found overlap in category representations between imagery and perception in lateral occipital complex in all categories, and in inferior parietal and premotor cortex in the letter and face category. Furthermore, we found an effect of vividness on the overlap over the whole visual cortex for both the fruit and face categories, and in the superior parietal cortex for all categories. For letters, also the overlap in left intraparietal sulcus and right inferior temporal cortex was modulated by vividness.
Previous work has shown that individual differences in visual imagery vividness correlate with activation of early visual cortex during imagery (Cui et al., 2007). Here, we show that this is also the case for trial-by-trial variation of imagery vividness. Furthermore, previous studies showed a correlation between imagery ability and overlap of neural representations with perception in early visual cortex (Lee et al., 2012; Albers et al., 2013). In contrast, we found that within-participant fluctuations in vividness are related to the amount of overlap in the entire visual cortex as well as the parietal cortex. A possible explanation for this discrepancy is that previous studies defined the overlap across stimulus categories and looked at general imagery ability. In contrast, our current approach allowed us to define overlap within each stimulus category and relate it directly to the experienced vividness of those stimuli. This technique is much more sensitive and can reveal more fine-grained effects. The results indicate that the overlap of the neural representation in the entire visual system is important for participants' subjective experience.
We did not find a clear modulation of the overlap in the visual cortex in the letter category. In this category, the overlap in intraparietal sulcus and inferior temporal cortex was modulated instead. An explanation for this is that vividness of letters means something different from vividness of other stimuli. Letters were the least complex and so had the least visual details: a key factor in determining vividness (Marks, 1973). This could therefore mean that other factors, such as semantic association or auditory imagery, determined vividness in the letter category.
In addition to effects in the visual cortex, we found that, in all categories the activity, but not the overlap, was modulated by vividness in precuneus, medial frontal, and right parietal cortex. Previous studies have also reported activation in these areas during visual imagery (Ishai et al., 2000; Ganis et al., 2004; Mechelli et al., 2004; de Borst et al., 2012). It has been suggested that the precuneus is important for selecting relevant details during imagery (Ganis et al., 2004). This is in line with our current findings because the amount of detail experienced during imagery plays an important role in judging experienced vividness. Furthermore, medial frontal activity has been associated with imagery performance (de Borst et al., 2012), which in turn has been linked to experienced imagery vividness (Keogh and Pearson, 2014). It has been suggested that the medial frontal cortex is important for the retrieval and integration of information during both working memory and imagery via connections to parietal and visual areas (Onton et al., 2005; de Borst et al., 2012). Finally, right parietal cortex has been associated with attention, visual inspection, and percept stabilization, all factors that could influence the experienced vividness (Trojano et al., 2000; de Borst et al., 2012; Zaretskaya et al., 2010).
Our findings crucially depend on the fluctuations in imagery vividness and associated overlap and activity over time. This begs the question what the origin of these fluctuations is. Fluctuations may be driven by variation in cortical excitability or large-scale reconfigurations of resting-state networks. For example, spontaneous changes within the default mode network and frontoparietal networks correlate with switches between an internal versus an external focus (Smallwood et al., 2012; Van Calster et al., 2016). Furthermore, resting state oscillations within visual and motor cortices are related to changes in cortical excitability, which have an effect on behavior (Fox et al., 2007; Romei et al., 2008). These spontaneous fluctuations could underlie the observed variability in experienced vividness within participants. More research is necessary to investigate this idea.
In addition to the neural correlates of imagery vividness, this study also provides novel insights with regard to the overlap in neural representations of imagined and perceived stimuli. We reveal a large overlap between perception and imagery in visual cortex. This is consistent with previous work showing that working memory, perception, and visual imagery have common representations in visual areas (Reddy et al., 2010; Lee et al., 2012; Albers et al., 2013; Bosch et al., 2014). However, our study is the first to look at overlap between neural representations of imagery and perception beyond the visual cortex. Unexpectedly, we also found strong overlap in category representations for the letter and face category in inferior parietal and premotor cortex. Previous studies have already reported representations in parietal cortex of stimuli held in working memory (Christophel et al., 2015; Lee and Kuhl, 2016). It may be the case that different cognitive functions rely on the same representations in both visual and parietal cortex.
Furthermore, premotor cortex activity during visual imagery has been associated with the spatial transformation of a mental object (Sack et al., 2008; Oshio et al., 2010). However, we now show that stimulus representations in premotor cortex are shared between perception and imagery during a task that does not involve spatial transformations. This overlap also cannot be explained by motor preparation of the vividness response because during perception participants did not yet know which stimulus they had to imagine. One possible explanation for the overlap in the letter category is the fact that letters have a sensorimotor representation, such that the perception of letters activates areas in premotor cortex involved in writing (Longcamp et al., 2003). Our results would imply that imagery of letters also activates premotor areas. However, this explanation is less likely to hold for faces. Because the overlap is more anterior for faces, this could also indicate the involvement of inferior frontal gyrus, a region that is known to be involved in the imagery of faces (Ishai et al., 2002).
The fact that we did not find overlap in more anterior areas for the fruit category can be explained by the fact that the neural representation of the fruit category was less distinctive than that of the other categories. We calculated overlap as that part of the main category effect that was not different between perception and imagery. The main effect of the fruit category (how distinctive it was from the other categories) was much smaller than the main effect of the other categories, especially in more anterior brain areas. Therefore, the overlap in these areas was necessarily also smaller. This suggests that the fact that we did not find overlap in these areas is more likely due to low sensitivity than to true absence of overlap in these areas.
Because of the nature of our experimental task, it could be the case that our overlap findings are mainly driven by the imagery trials in which the second stimulus was cued. This could point to spillover of the BOLD response from the perception part of the trial, which would pose a problem for the general overlap results. To investigate this, we performed the overlap analysis separately for first and second cue trials (Harrison and Tong, 2009). The peak activations for the first cue dataset were centered around lateral occipital complex, parietal, and premotor regions, which matches the main results. Furthermore, no salient differences were observed when comparing the results for the first and second cue. This shows that the effects cannot be explained by spillover effects of bottom-up perceptual processing. The modulation of overlap by vividness cannot be caused by spillover effects because these two are completely unrelated in our setup.
In conclusion, we showed that a network of areas, including both early and late visual areas, precuneus, right parietal cortex, and medial frontal cortex, is associated with the experienced vividness of visual imagery. The more anterior areas seem to be important for imagery-specific processes, whereas visual areas represent the visual features of the experience. This is apparent from the relation between experienced vividness and overlap with perception in these areas. Furthermore, our results show that the overlap in neural representations between imagery and perception, regardless of vividness, extends beyond the visual cortex to include also parietal and premotor/frontal areas.
Footnotes
This work was supported by The Netherlands Organization for Scientific Research VIDI Grant 639.072.513.
The authors declare no competing financial interests.
References
- Albers AM, Kok P, Toni I, Dijkerman HC, de Lange FP (2013) Shared representations for working memory and mental imagery in early visual cortex. Curr Biol 23:1427–1431. 10.1016/j.cub.2013.05.065 [DOI] [PubMed] [Google Scholar]
- Allefeld C, Haynes JD (2014) Searchlight-based multi-voxel pattern analysis of fMRI by cross-validated MANOVA. Neuroimage 89:345–357. 10.1016/j.neuroimage.2013.11.043 [DOI] [PubMed] [Google Scholar]
- Bergmann J, Genç E, Kohler A, Singer W, Pearson J (2016) Smaller primary visual cortex is associated with stronger, but less precise mental imagery. Cereb Cortex 26:3838–3850. 10.1093/cercor/bhv186 [DOI] [PubMed] [Google Scholar]
- Bosch SE, Jehee JF, Fernández G, Doeller CF (2014) Reinstatement of associative memories in early visual cortex is signalled by the hippocampus. J Neurosci 35:7493–7500. 10.1523/JNEUROSCI.0805-14.2014 [DOI] [PMC free article] [PubMed] [Google Scholar]
- Christophel TB, Cichy RM, Hebart MN, Haynes JD (2015) Parietal and early visual cortices encode working memory content across mental transformations. Neuroimage 106:198–206. 10.1016/j.neuroimage.2014.11.018 [DOI] [PubMed] [Google Scholar]
- Cui X, Jeter CB, Yang D, Montague PR, Eagleman DM (2007) Vividness of mental imagery: individual variability can be measured objectively. Vision Res 47:474–478. 10.1016/j.visres.2006.11.013 [DOI] [PMC free article] [PubMed] [Google Scholar]
- de Borst AW, Sack AT, Jansma BM, Esposito F, de Martino F, Valente G, Roebroeck A, di Salle F, Goebel R, Formisano E (2012) Integration of “what” and “where” in frontal cortex during visual imagery of scenes. Neuroimage 60:47–58. 10.1016/j.neuroimage.2011.12.005 [DOI] [PubMed] [Google Scholar]
- Fox MD, Raiche ME (2007) Spontaneous fluctuations in brain activity observed with functional magnetic resonance imaging. Nat Rev Neurosci 8:700–711. 10.1038/nrn2201 [DOI] [PubMed] [Google Scholar]
- Ganis G, Thompson WL, Kosslyn SM (2004) Brain areas underlying visual mental imagery and visual perception: an fMRI study. Brain Res Cogn Brain Res 20:226–241. 10.1016/j.cogbrainres.2004.02.012 [DOI] [PubMed] [Google Scholar]
- Güçlü U, van Gerven MA (2015) Deep neural networks reveal a gradient in the complexity of neural representations across the ventral stream. J Neurosci 35:10005–10014. 10.1523/JNEUROSCI.5023-14.2015 [DOI] [PMC free article] [PubMed] [Google Scholar]
- Harrison SA, Tong F (2009) Decoding reveals the contents of visual working memory in early visual areas. Nature 458:632–635. 10.1038/nature07832 [DOI] [PMC free article] [PubMed] [Google Scholar]
- Ishai A, Ungerleider LG, Haxby JV (2000) Distributed neural systems for the generation of visual images parts of the visual system mediate imagery for different types of visual information. Neuron 28:979–990. 10.1016/S0896-6273(00)00168-9 [DOI] [PubMed] [Google Scholar]
- Ishai A, Haxby JV, Ungerleider LG (2002) Visual imagery of famous faces: effects of memory and attention revealed by fMRI. Neuroimage 17:1729–1741. 10.1006/nimg.2002.1330 [DOI] [PubMed] [Google Scholar]
- Keogh R, Pearson J (2011) Mental imagery and visual working memory. PLoS One 6:e29221. 10.1371/journal.pone.0029221 [DOI] [PMC free article] [PubMed] [Google Scholar]
- Keogh R, Pearson J (2014) The sensory strength of voluntary visual imagery predicts visual working memory capacity. J Vis 14:pii7. 10.1167/14.12.7 [DOI] [PubMed] [Google Scholar]
- Kok P, Jehee JF, de Lange FP (2012) Less is more: expectation sharpens representations in the primary visual cortex. Neuron 75:265–270. 10.1016/j.neuron.2012.04.034 [DOI] [PubMed] [Google Scholar]
- Kosslyn SM, Ganis G, Thompson WL (2001) Neural foundations of imagery. Nat Rev Neurosci 2:635–642. 10.1038/35090055 [DOI] [PubMed] [Google Scholar]
- Kriegeskorte N, Goebel R, Bandetteini P (2006) Information-based functional brain mapping. Proc Natl Acad Sci U S A 103:3863–3868. 10.1073/pnas.0600244103 [DOI] [PMC free article] [PubMed] [Google Scholar]
- Lee H, Kuhl BA (2016) Reconstructing perceived and retrieved faces from activity patterns in lateral parietal cortex. J Neurosci 36:6069–6082. 10.1523/JNEUROSCI.4286-15.2016 [DOI] [PMC free article] [PubMed] [Google Scholar]
- Lee SH, Kravitz DJ, Baker CI (2012) Disentangling visual imagery and perception of real-world objects. Neuroimage 59:4064–4073. 10.1016/j.neuroimage.2011.10.055 [DOI] [PMC free article] [PubMed] [Google Scholar]
- Longcamp M, Anton JL, Roth M, Velay JL (2003) Visual presentation of single letters activates a premotor area involved in writing. Neuroimage 19:1492–1500. 10.1016/S1053-8119(03)00088-0 [DOI] [PubMed] [Google Scholar]
- Marks DF. (1973) Visual imagery differences in the recall of pictures. Br J Psychol 64:17–24. 10.1111/j.2044-8295.1973.tb01322.x [DOI] [PubMed] [Google Scholar]
- Mechelli A, Price CJ, Friston KJ, Ishai A (2004) Where bottom-up meets top-down: neuronal interactions during perception and imagery. Cereb Cortex 14:1256–1265. 10.1093/cercor/bhh087 [DOI] [PubMed] [Google Scholar]
- Onton J, Delorme A, Makeig S (2005) Frontal midline EEG dynamics during working memory. Neuroimage 27:341–356. 10.1016/j.neuroimage.2005.04.014 [DOI] [PubMed] [Google Scholar]
- Oshio R, Tanaka S, Sadato N, Sokabe M, Hanakawa T, Honda M (2010) Differential effect of double-pulse TMS applied to dorsal premotor cortex and precuneus during internal operation of visuospatial information. Neuroimage 49:1108–1115. 10.1016/j.neuroimage.2009.07.034 [DOI] [PubMed] [Google Scholar]
- Pearson J, Clifford CW, Tong F (2008) The functional impact of mental imagery on conscious perception. Curr Biol 18:982–986. 10.1016/j.cub.2008.05.048 [DOI] [PMC free article] [PubMed] [Google Scholar]
- Pearson J, Rademaker RL, Tong F (2011) Evaluating the mind's eye: the metacognition of visual imagery. Psychol Sci 22:1535–1542. 10.1177/0956797611417134 [DOI] [PubMed] [Google Scholar]
- Reddy L, Tsuchiya N, Serre T (2010) Reading the mind's eye: decoding category information during mental imagery. Neuroimage 50:818–825. 10.1016/j.neuroimage.2009.11.084 [DOI] [PMC free article] [PubMed] [Google Scholar]
- Romei V, Brodbeck V, Michel C, Amedi A, Pascual-Leone A, Thut G (2008) Spontaneous fluctuations in posterior a-band EEG activity reflect variability in excitability of human visual areas. Cereb Cortex 18:2010–2018. 10.1093/cercor/bhm229 [DOI] [PMC free article] [PubMed] [Google Scholar]
- Sack AT, Jacobs C, De Martino F, Staeren N, Goebel R, Formisano E (2008) Dynamic premotor-to-parietal interactions during spatial imagery. J Neurosci 28:8417–8429. 10.1523/JNEUROSCI.2656-08.2008 [DOI] [PMC free article] [PubMed] [Google Scholar]
- Smallwood J, Brown K, Baird B, Schooler JW (2012) Cooperation between the default mode network and the frontal-parietal network in the production of an internal train of thought. J Brain Res 1428:60–70. 10.1016/j.brainres.2011.03.072 [DOI] [PubMed] [Google Scholar]
- Stelzer J, Chen Y, Turner R (2013) Statistical inference and multiple testing correction in classification-based multi-voxel pattern analysis (MVPA): random permutations and cluster size control. Neuroimage 65:69–82. 10.1016/j.neuroimage.2012.09.063 [DOI] [PubMed] [Google Scholar]
- Tong F, Harrison SA, Dewey JA, Kamitani Y (2012) Relationship between BOLD amplitude and pattern classification of orientation-selective activity in the human visual cortex. Neuroimage 63:1212–1222. 10.1016/j.neuroimage.2012.08.005 [DOI] [PMC free article] [PubMed] [Google Scholar]
- Trojano L, Grossi D, Linden DE, Formisano E, Hacker H, Zanella FE, Goebel R, Di Salle F (2000) Matching two imagined clocks: the functional anatomy of spatial analysis in the absence of visual stimulation. Cereb Cortex 10:473–481. 10.1093/cercor/10.5.473 [DOI] [PubMed] [Google Scholar]
- Van Calster L, D'Argembeau A, Salmon E, Peters F, Majerus S (2016) Fluctuations of attentional networks and default mode network during the resting state reflect variations in cognitive states: evidence from a novel resting-state experience sampling method. J Cogn Neurosci 29:85–113. 10.1162/jocn_a_01025 [DOI] [PubMed] [Google Scholar]
- Zaretskaya N, Thielscher A, Logothetis NK, Bartels A (2010) Disrupting parietal function prolongs dominance durations in binocular rivalry. Curr Biol 20:2106–2111. 10.1016/j.cub.2010.10.046 [DOI] [PubMed] [Google Scholar]


