

Abstract
Glucocorticoid has been widely accepted to induce Alzheimer's disease, but the nongenomic effect of glucocorticoid on amyloid β (Aβ) generation has yet to be studied. Here, we investigated the effect of the nongenomic pathway induced by glucocorticoid on amyloid precursor protein processing enzymes as well as Aβ production using male ICR mice and human neuroblastoma SK-N-MC cells. Mice groups exposed to restraint stress or intracerebroventricular injection of Aβ showed impaired cognition, decreased intracellular glucocorticoid receptor (GR) level, but elevated level of membrane GR (mGR). In this respect, we identified the mGR-dependent pathway evoked by glucocorticoid using impermeable cortisol conjugated to BSA (cortisol-BSA) on SK-N-MC cells. Cortisol-BSA augmented the expression of β-site amyloid precursor protein cleaving enzyme 1 (BACE1), the level of C-terminal fragment β of amyloid precursor protein (C99) and Aβ production, which were maintained even after blocking intracellular GR. We also found that cortisol-BSA enhanced the interaction between mGR and Gαs, which colocalized in the lipid raft. The subsequently activated CREB by cortisol-BSA bound to the CRE site of the BACE1 promoter increasing its expression, which was downregulated by inhibiting CBP. Consistently, blocking CBP attenuated cognitive impairment and Aβ production induced by corticosterone treatment or intracerebroventricular injection of Aβ more efficiently than inhibiting intracellular GR in mice. In conclusion, glucocorticoid couples mGR with Gαs and triggers cAMP-PKA-CREB axis dependent on the lipid raft to stimulate BACE1 upregulation and Aβ generation.
SIGNIFICANCE STATEMENT Patients with Alzheimer's disease (AD) have been growing sharply and stress is considered as the major environment factor of AD. Glucocorticoid is the primarily responsive factor to stress and is widely known to induce AD. However, most AD patients usually have impaired genomic pathway of glucocorticoid due to intracellular glucocorticoid receptor deficiency. In this respect, the genomic mechanism of glucocorticoid faces difficulties in explaining the consistent amyloid β (Aβ) production. Therefore, it is necessary to investigate the novel pathway of glucocorticoid on Aβ generation to find a more selective therapeutic approach to AD patients. In this study, we revealed the importance of nongenomic pathway induced by glucocorticoid where membrane glucocorticoid receptor plays an important role in Aβ formation.
Keywords: Alzheimer's disease, amyloid beta, glucocorticoid, lipid raft, nongenomic action, stress
Introduction
Stress is an important, emerging environmental factor of Alzheimer's disease (AD) that contemporary people tend to be vulnerable to rapid lifestyle changes. Studies have shown that primary stress-responsive steroid hormone, glucocorticoid, is a major etiology of AD contributing to the accumulation of amyloid β (Aβ) and the exacerbation of tau pathology in both animal models/AD patients (Jeong et al., 2006; Kang et al., 2007; Catania et al., 2009) and cell lines (Green et al., 2006), most of which have been explained through the genomic pathway. However, the theory of intracellular glucocorticoid receptor (GR)-dependent pathway in the amyloidosis has difficulties in explaining the constant Aβ secretion in AD patients or in chronic stress-exposed animal models because they generally have GR insufficiency, which evokes dysregulation of hypothalamic-pituitary-adrenal axis and the hypercortisolemia (de Kloet et al., 2005; Catania et al., 2009; Notarianni, 2013). In addition, there is even a claim that intracellular GR may not be essential in regulating responses to chronic stress due to its deficiency (Furay et al., 2008). In this regard, the molecular mechanisms of glucocorticoid on amyloidosis in AD are not fully understood. Therefore, further investigations are necessary to assess the novel mechanisms of glucocorticoid on AD pathology.
In addition to the genomic pathway, glucocorticoid can also mediate acute physiological effect without the genomic pathway (Croxtall et al., 2002; Tasker et al., 2006; Stahn and Buttgereit, 2008). These so-called nongenomic effects are mainly mediated through glucocorticoid binding to putative membrane GR (mGR) (Orchinik et al., 1991), which subsequently activates kinase cascades in various tissues (Park et al., 2001; Groeneweg et al., 2011; Pérez et al., 2013). In particular, the importance of investigating the nongenomic pathway in neuronal cells has increased based on the fact that cells need to rapidly respond to pathophysiological changes (Chen and Qiu, 2001; Xiao et al., 2010; Chen et al., 2012). Although many studies on nongenomic signaling have shown the activation of various kinases, the exact identification and localization of mGR are still poorly understood. However, current evidence suggests that mGR is closely associated with the lipid raft, a specialized signaling platform of membrane structure that can transfer information by recruiting or combining signaling molecules (Insel et al., 2005; Samarasinghe et al., 2011). Because the lipid raft has important roles in creating signaling platforms involved in numerous neuronal functions as well, alterations in the lipid raft result in many diseases, especially for neuropathological progression, such as AD or Parkinson's disease (Cordy et al., 2006; Martín et al., 2010; Marin et al., 2013). This raises the question whether the nongenomic pathway induced by glucocorticoid takes place in the lipid raft, leading to kinase activation and subsequent amyloid precursor protein (APP) processing. Consequently, identifying how glucocorticoid modulates the interaction between mGR and the lipid raft is crucial in understanding the molecular links between stress and AD, which will be meaningful for new therapeutic approaches in AD patients.
In this study, we used male ICR mice to evaluate how glucocorticoid regulates APP processing, cognition, and GR distribution under an AD-like pathology or chronic stress exposure. Mice exposed to intracerebroventricular injection of Aβ can show enough clinical signs of AD-like pathology in a short period; thus, suggested mice are the proper animal model to explore how stress mediates amyloidosis under an AD-like condition without the aging process or invasive surgical procedures (Lecanu and Papadopoulos, 2013; Cho et al., 2014). Mice with long-term glucocorticoid treatment were also used to confirm the newly revealed amyloidogenic pathway of this study. In addition, human neuroblastoma SK-N-MC cells were used to investigate the mechanism of Aβ production by glucocorticoid because neuroblastoma is a well-stabilized cell line and has been widely used as neuronal disease model, especially to investigate AD pathogenesis (Green et al., 1996; Yan et al., 1999; Park et al., 2015). Overall, our study investigated the nongenomic effects of glucocorticoid on Aβ generation and the underlying mechanism with both suggested in vitro and in vivo models.
Materials and Methods
Materials.
Cells from the human neuroblastoma cell line SK-N-MC were obtained by Korean Cell Line Bank (Seoul, South Korea, RRID: CVCL_1398). FBS and serum replacement (SR) were purchased from Hyclone and Invitrogen, respectively. The antibodies of p-CREB (Ser 133, RRID: AB_2085894), CREB (RRID: AB_2086021), p-Tau [Ser 396 (RRID: AB_1129987), Thr212 (RRID: AB_2139838)], presenilin1 (RRID: AB_10846194), PKA catalytic form (RRID: AB_654173), Gαs (RRID: AB_631538), Gαq (RRID: AB_631536), caveolin-1 (RRID: AB_2072042), flotillin-1 (RRID: AB_2106563), lamin A/C (RRID: AB_648154), pan-cadherin (RRID: AB_2077665), β-tubulin (RRID: AB_635009), and β-actin (RRID: AB_626632) were acquired from Santa Cruz Biotechnology. The antibodies of BACE1 (RRID: AB_302817), GRα (RRID: AB_303926, used for Western blot, immunoprecipitation, immunocytochemistry, and function-blocking antibody), and Aβ (RRID: AB_303141) were purchased from Abcam. HRP-conjugated goat antirabbit IgG was obtained from Jackson ImmunoResearch Laboratories (RRID: AB_2307391). Cortisol-BSA was purchased from Cusabio. The antibodies of C99 and GR (RRID: AB_2155930, used for immunocytochemistry) were purchased from EMD Millipore. The antibodies of phospho-pan PKC (RRID: AB_2168219) and pan PKC were purchased from Cell Signaling Technology. EGTA, BAPTA-AM, ionomycin, BSA, cortisol, RU 486, C646, MβCD, cholera toxin B (CTB), and SQ 22536 were purchased from Sigma. The 14–22 amide was obtained from Calbiochem (Merck Millipore).
Cell culture.
The SK-N-MC cells were cultured in high glucose DMEM (Invitrogen). Cells were grown in 10% FBS with a 1% antibiotic-antimycotic mixture containing penicillin, streptomycin, and fungizone. Cells were cultured in 35-, 60-, or 100-mm-diameter culture dishes, or in 6- or 12-well plates in an incubator kept at 37°C with 5% CO2. Cells were incubated for 72 h and then washed with PBS. Subsequently, the medium was replaced with serum-free DMEM containing 1% SR and 1% antibiotic-antimycotic solution for 24 h. Cells then were transferred to the SR-supplemented medium before experiments.
Preparation of Aβ.
The β-amyloid [1–42] (human) peptide was purchased from Invitrogen. Peptide was dissolved at a concentration of 1 mg/ml in 100% 1,1,1,3,3,3-hexafluoro-2-propanol (Sigma) and then incubated at room temperature for 1 h with occasional vortexing. After sonication for 10 min in a water bath sonicator, it was freeze-dried for 3 h. When the film is formed, it was diluted with 100% DMSO and resuspended. To oligomerize Aβ, it was diluted with PBS to make 100 μm Aβ solution and incubated for 24 h at 4°C.
Animal preparation, intracerebroventricular injection of Aβ, and restraint stress.
Male ICR mice (RRID: IMSR_TAC:icr), 7 weeks of age, were used, in compliance and approval with the Institutional Animal Care and Use Committee of Seoul National University (SNU-160920-11). The ICR mouse, which mimics natural, generically heterogeneous populations, has been widely used in a number of fields, including basic research as it is a general-purpose stock, easy to handle, and fairly docile (Chia et al., 2005). Animals were housed 4 or 5 per cage under standard environmental conditions (22°C relative humidity 70%; 12 h light/dark cycle; ad libitum access to food and drinking solution). Male ICR mice were allocated to one of two main treatment groups: vehicle and Aβ. ICR mice were anesthetized by intraperitoneal injection of a mixture of xylazine and zoletil. Sterile PBS drops were applied to both eyes of mice, and the warm mat was placed to maintain body temperature. The mice were positioned in sternal recumbency position, which means that the abdominal part of the animals is lying on the bottom. This position allows the animals to easily breathe during the anesthesia as it is their natural posture. The forehead was shaved to minimize the contamination. The forehead of the mice was sprayed with 70% ethanol and rubbed with dry cotton swabs. The same area was wiped with 2% chlorhexidine solution. The scrubbings were repeated three times with alcohol and chlorohexidine. The bregma was found by lightly rubbing the point until the suture was felt through the skin (∼1–3 mm rostral to a line drawn through the anterior base of the ears). After locating the bregma, the Hamilton syringe equipped with a 26 S gauge needle was injected into the location point of lateral ventricle (−1.0 ± 0.06 mm posterior to bregma, 1.8 ± 0.1 mm lateral to the sagittal suture, and 2.4 mm in depth). The protocol of intracerebroventricular injection was modified from previous reports (Stepanichev et al., 2003; Kim et al., 2016). The syringe was kept perpendicular to the plane of injection point. The syringe was held steadily, and 10 μl of Aβ solution or vehicle was injected slowly over 10 s without pausing. The syringe was removed without tilting, and the mice were maintained with their sternal recumbency for helping them easily breathe. The mice were not left until they regained consciousness and postoperatively monitored twice a day. Five days after intracerebroventricular injection, each mouse from stress-receiving mouse groups was placed in a ventilated 50 ml conical Falcon tube for 30 min per day for 1 week. Mice were not physically squeezed or did not experience pain. Nonrestrained mice remained in their home cages in the experimental room. The animals were killed 24 h after the last restraint stress. But the exception occurred when the animals were evaluated for the effect of Aβ on total GR expression (see Fig. 1B). These mice were killed 5 d after the injection when the animal showed memory deficits.
Figure 1.

The different GR distribution and subsequent physiological change due to chronic stress or exposure of intracerebroventricular injection of Aβ. A, The hippocampus of mice exposed to vehicle, restraint stress, or corticosterone (10 mg/kg) was collected and then lysed. Aβ, p-Tau (Ser 396), p-Tau (Thr 212), and β-actin were detected by Western blot. Data are mean ± SE of three independent experiments. **p < 0.01 versus vehicle. B, GRα or β-actin was detected in the hippocampus of mice exposed to vehicle, restraint stress, corticosterone (10 mg/kg), or intracerebroventricular injection of Aβ. Data are mean ± SE of four independent experiments. **p < 0.01 versus vehicle. C, Mice were exposed to intracerebroventricular injection of either vehicle or Aβ, and then presented with/without restraint stress for 7 d. Mice were allowed to explore an identical pair of objects, and after 4 h, they were presented with the familiar object and a new object. Mice groups exposed to intracerebroventricular injection of Aβ with/without restraint stress or vehicle with restraint stress exhibited impaired NOR. Data are mean ± SE of five independent experiments. **p < 0.01 versus the NOR test results of mice before the treatment. D, The hippocampus of mouse groups was collected and then fractionized. Cytosolic and membrane protein was loaded to be detected with the GRα antibody. Cytosolic and membrane protein levels were normalized by β-tubulin and pan-cadherin, respectively. Data are mean ± SE of four independent experiments. **p < 0.01 versus vehicle mice group. #p < 0.05 versus mice group exposed to intracerebroventricular injection of Aβ. ##p < 0.01 versus mice group exposed to intracerebroventricular injection of Aβ. E, Blood was collected from abdominal aorta of mouse groups, and plasma corticosterone level was measured using ELISA. Data are mean ± SE of four independent experiments. **p < 0.01 versus vehicle mice group. #p < 0.05 versus mice with intracerebroventricular injection of Aβ.
Drug treatment in animal models.
Corticosterone (10 mg/kg) was dissolved in the solution containing 50% propylene glycol and 50% PBS. C646 (8.9 mg/kg) was dissolved in DMSO and RU 486 (5 mg/kg) was dissolved in ethanol following the previous report (Baruch et al., 2015). Vehicle-treated mice were similarly injected with the solution containing propylene glycol, ethanol, and DMSO. Corticosterone, C646, RU 486, or vehicle was injected intraperitoneally daily for 1 week. The animals were killed 24 h after exposure to last drug treatment.
Novel object recognition (NOR).
The NOR test is based on the innate tendency of rodents to differently explore novel objects over familiar objects (Arqué et al., 2008). The NOR test was held to all mouse groups before and after treatment following the modified Nature Protocol (Bevins and Besheer, 2006; Leger et al., 2013). The mice were placed in the empty rectangular open field (a black acryl box measuring 45 × 30 × 50 cm) and allowed to explore the open field for 5 min, which is known as the short habituation period. One day after the habituation, the mice were presented with two similar objects during the first session, called the familiarization session. The familiarization session was always performed during the morning (from 9:00 A.M.). The mice were allowed to explore each object until 20 s exploration of both objects or the 10 min (the maximum session time) period was over during the familiarization session. We chose to score object exploration whenever the mouse sniffed the object or touched the object while looking at it. Climbing onto the object (unless the mouse sniffs the object it has climbed on) or chewing the object was not qualified as exploration, according to the previous reported methodology (Bevins and Besheer, 2006; Leger et al., 2013). If mice did not reach the criterion, such as not exploring the objects at all (spending time for grooming or freezing), showing lack of curiosity for the objects, and performing poor memory during the NOR test before treatment, they were excluded from the experiments. After 4 h intersession interval, the test session was held where the open field contained the original object and the novel object. The position of the novel object (left or right) has been randomized between each mouse and each group tested. The time spent for exploring the novel object for 20 s was measured. Memory was operationally defined by the discrimination index (DI) for the novel object during test session. DI represents the following: [(novel object exploration time − familiar object exploration time)/total exploration time]. The novel and familiar object exploration time means the total time spent exploring the novel and familiar object for reaching 20 s, respectively. Therefore, if the DI value is <0, the mouse remains the normal recognition memory. If DI is >0, however, the mouse undergoes impaired memory function.
Immunohistochemistry (IHC).
The mice underwent deep anesthesia and were perfused transcardially with calcium-free Tyrode's solution followed by a fixative containing 4% PFA (Sigma) in 0.1 m phosphate buffer, pH 7.4. The brain was removed immediately after perfusion, then postfixed for 2 h and subsequently placed in 30% sucrose in PBS, pH 7.4, for 48 h at 4°C. Serial transverse sections (30 μm) were cut using a cryostat (Leica Biosystems). The brain tissues containing hippocampus were preblocked with 5% normal goat serum (Sigma) containing 0.3% Triton X-100 (Sigma) in PBS at room temperature for 1 h. Samples were washed and incubated with primary antibody for Aβ (1:100 dilution in PBS) overnight at 4°C. After washing three times with PBS, tissue slides were incubated with AlexaFluor-488 secondary antibody and propidium iodide (PI, Invitrogen) for 2 h at room temperature. Immunostained samples were visualized by using FluoView 300 confocal microscope (Olympus). The fluorescent intensity analysis was undertaken using ImageJ software (RRID: SCR_003070).
Measurement of plasma corticosterone.
The blood was collected before attaining the brain samples for IHC and Western blot analysis. After the mice underwent anesthesia and perfusion process as described, a midline incision was made through the skin, musculature, and peritoneum using scalpel blade from xiphoid to pubis. The intestines were gently moved on the left side of the operator. The abdominal aorta was identified locating the renal artery. The 22-gauge needle was inserted cranially to collect blood from the abdominal aorta (Donovan and Brown, 2006). More volume of blood sample can be attained from the abdominal aorta than the usual collection part of the vessel. Approximately 1 ml of blood was obtained from each mouse. Blood samples were centrifuged for 5 min at 4°C to obtain plasma. Plasma corticosterone was determined using a corticosterone ELISA kit purchased from Enzo Life Science. Following the manufacturer's instructions, optical density (OD) was measured. The value of OD405 nm with correction OD570 nm is inversely proportional to the concentration of corticosterone. After the assay, the values were calculated into the concentration of corticosterone, following the standard curve.
Measurement of cortisol in culture medium.
The SK-N-MC cells were maintained in serum-free DMEM for 24 h before the experiment and treated for 6 h with BSA, cortisol, and cortisol-BSA. The culture medium was collected, and the standard curve reagent was diluted in the same culture medium used for cells. The cortisol ELISA kit was purchased from Enzo Life Science, and the procedures were undertaken following the manufacturer's instructions. The value of OD405 nm with correction OD570 nm is inversely proportional to the concentration of cortisol. After the assay, the values were quantified into the concentration of cortisol, according to the standard curve.
Measurement of Aβ in culture medium.
The culture medium of SK-N-MC cells containing cortisol-BSA for 48 h with each inhibitor (RU 486, spironolactone, GR antibody, MβCD, 14–22 amide, C646) was collected. Aβ (1–42) level in culture medium was determined using a human Aβ (1–42) ELISA kit from Wako Pure Chemical Industries. Following the manufacturer's instructions, the value of OD450 nm was measured. After the procedure, the values were quantified into Aβ concentration, according to the standard curve.
RT-PCR and real-time PCR.
The SK-N-MC cells were maintained in serum-free DMEM for 24 h before the experiment and treated for 12 h with cortisol-BSA. After refreshing the culture media with PBS, the total RNA was extracted from the cells using MiniBEST Universal RNA Extraction Kit (TaKaRa). Reverse transcription was performed using 1 μg of RNA with a Maxime RT-PCR PreMix Kit (Intron Biotechnology) to produce cDNA. A total of 2 μl of the RT products was then amplified using Quanti NOVA SYBR Green PCR Kits (QIAGEN). Real-time quantification of RNA targets was performed in a Rotor-Gene 6000 real-time thermal cycling system (Corbett Research). The primer sequences of the bace1 gene are as follows: forward primer, 5′-GGAGTACAAAGACAGGGAATAG-3′; and reverse primer, 5′-GAATAAAGGGTGGTTCAGATAGA-3′. The reaction mixture (20 μl) contained 200 ng of total RNA, 0.5 mm of each primer, and appropriate amounts of enzymes and fluorescent dyes as recommended by the manufacturer. The real-time PCR was performed as follows: 15 min at 95°C for DNA polymerase activation; 15 s at 95°C for denaturing; and 40 cycles of 15 s at 94°C, 30 s at 54°C, and 30 s at 72°C. Data were collected during the extension step, and analysis was performed using the software provided. Following real-time PCR, melting curve analysis was performed to verify the specificity and identity of the PCR products. Normalization of gene expression levels was performed by using the β-actin gene as a control.
Western blot analysis.
After post-treatment, harvested cells were washed twice with cold PBS before incubation in RIPA buffer (Thermo Fisher) containing a proteinase and phosphatase cocktail (Thermo Fisher) for 30 min on ice. The lysates were then cleared by centrifugation (10,000 × g at 4°C for 30 min), and the supernatant was collected. The bicinchoninic acid assay kit (Bio-Rad) was used to determine protein concentration. Equal amounts of sample proteins (10 μg) were prepared for 8%–15% SDS-PAGE and then transferred to a PVDF membrane. Protein-containing membranes were washed with Tris-buffered saline containing 0.1% Tween 20 (TBST) solution (10 mm Tris-HCl, pH 7.6, 150 mm NaCl, and 0.1% Tween 20). Subsequently, the membranes were blocked with 5% BSA or 5% skim milk (Invitrogen) in TBST solution for 30 min. Blocked membranes were washed with TBST for three times every 10 min and incubated with primary antibody (1:1000 dilution) overnight at 4°C. The membranes were then washed and incubated with the HRP-conjugated secondary antibody (1:10,000 dilution) at room temperature for 2 h. The Western blotting bands were visualized by using chemiluminescence solution (Bio-Rad). Densitometry analysis for quantification was performed by using ImageJ software. Protein phosphorylation and expression were normalized by β-actin, β-tubulin, pan-cadherin, or lamin A/C.
Small interfering RNA (siRNA) transfection.
Cells were grown until 70% of the surface of the plate. Before cortisol-BSA treatment, siRNAs specific for caveolin-1 were obtained from Bioneer, and creb, or nontargeting (NT) were obtained from Dharmacon. The siRNA was transfected to cells for 24 h with Turbofect transfection reagent (Thermo Fisher) according to the manufacturer's instructions. The concentration of each transfected siRNA was 25 nm. The NT siRNA was used as the negative control. All siRNA sequences used in this study are described as follows: caveolin-1 siRNA sense sequence, 5′-CUCAACAUUGUACUUCCUU-3′; and antisense sequence, 5′-AAGGAAGUACAAUGUUGAG-3′; creb siRNA sense sequence, 5′-GAGAGAGGUCCGUCUAAUG-3′; and antisense sequence, 5′-UAGUACAGCUGCCCAAUGG-3′.
Immunocytochemistry.
Cells placed on a confocal dish (Thermo Fisher) were fixed with 4% PFA for 10 min, followed by permeabilization with 0.1% Triton X-100 in PBS followed by three times washing with PBS. Cells were incubated with 5% normal goat serum in PBS to decrease nonspecific binding of proteins, and then incubated with 1:100 dilution of primary antibody for overnight in 4°C. Next, the cells were washed and incubated for 2 h at room temperature with AlexaFluor secondary antibody, FITC-conjugated CTB, or PI in PBS (1:100 dilution). Images were obtained by using a FluoView 300 confocal microscope. The fluorescent intensity analysis was undertaken using ImageJ software. The colocalization of proteins was analyzed using Pearson's correlation coefficient using Fiji software (SCR_002285) following the manufacturer's instructions. After loading the image into the software, we split the channels into two color images. The region of interest was chosen using the provided tool. The small portion of black (zero pixel value) was ignored during the analysis, which was mentioned in the instructions. The Coloc2 plugin from the menu was launched, and the images were set as channel 1 (red) or channel 2 (green). The analyzed results of region of interest were shown when we pressed the “Okay” button. The values of Pearson's correlation coefficient were obtained from three images of each treatment group, and further analyses (ANOVA and Bonferroni–Dunn test) were done to confirm whether changes were statistically significant.
Measurement of calcium influx.
The changes in [Ca2+]i were measured using Fluo 3-AM dissolved in DMSO. The cells in confocal dishes were washed once with PBS and then incubated in PBS containing 2 μm Fluo 3-AM with 5% CO2 at 37°C for 40 min. After washed once with the PBS, the cells were scanned at 1 s intervals after cortisol-BSA treatment using Olympus FluoView 300 confocal microscope with 400× objective at excitation and emission wavelengths of 488 nm and 515 nm, respectively. To verify the assay, ionomycin was applied to the cells as a positive control. All of the analyses of [Ca2+]i were processed at a single-cell level and were expressed as the relative fluorescence intensity.
Coimmunoprecipitation.
Interaction of membrane GRα with G-protein or lipid raft proteins and complex formation of Gαs with lipid raft proteins in SK-N-MC cells were analyzed by immunoprecipitation and Western blot. The agarose bead conjugated with GRα- or Gαs-specific antibodies was immobilized by using a commercial coimmunoprecipitation kit (Thermo Fisher) according to the supplier's instructions. The total lysates of cells (300 μg) were incubated with 10 μg of primary antibody for overnight at 4°C. Agarose beads were spun down by centrifugation at 1000 × g for 1 min and then collected. The beads were washed, and the antibody-bound protein was acquired by incubation in the elution buffer. The proteins were boiled in provided sample buffer for 5 min. The same amount of protein was loaded in 10% SDS-PAGE for electrophoresis and transferred to a PVDF membrane. Samples were analyzed by Western blotting.
cAMP assay.
SK-N-MC cells were grown and incubated in 60 mm dishes and cultured as described above. The cells were preincubated with SQ 22536 or MβCD for 30 min or 2 h, respectively, to prevent cAMP production. The cells were then stimulated for 10 min with cortisol-BSA. Before assay, cells were washed three times with cold PBS and subsequently lysed in cell lysis buffer provided in the kit. The amount of cAMP was measured using the cAMP parameter assay kit (R&D Systems), and the procedure was performed following the manufacturer's instructions. As this assay is based on competitive binding technique, the value of OD450 nm with correction OD540 nm is inversely proportional to the concentration of cAMP as described previously (Fu et al., 2015).
Chromatin immunoprecipitation (ChIP).
ChIP assay was performed by using an EZ-ChIP Chromatin Immunoprecipitation Kit (EMD Millipore) according to the manufacturer's instructions. Samples containing protein-chromatin complexes were incubated with ChIP grade antibody for phospho-CREB (Ser 133, EMD Millipore), the IgG, and the RNA polymerase (RNAPol) overnight at 4°C. Normal IgG and RNAPol were used as negative and positive controls, respectively. Immunoprecipitated complexes were eluted with elution buffer (1% SDS, 50 mm Tris-HCl, pH 7.5, and 10 mm EDTA). Eluates were incubated with 5 m NaCl for 4 h at 65°C and then incubated with RNase A for 30 min at 4°C. The samples were then incubated with 0.5 m EDTA, 1 m Tris-HCl, and proteinase K for 2 h at 4°C. Sample DNA was extracted by supplied column and amplified by PCR using a designed primer. The sequences of bace1 primer are as follows: forward primer, 5′-GCATACAGTGGGTGCTCCTT-3′; and reverse primer, 5′-GGATCGCTGGGAAGTGTAGT-3′. One percent of the sample chromatin extract was used as an input.
Experimental design and statistical analysis.
A total of 90 7-week-old male ICR mice were used for the in vivo study. The 5 mice were used for each group throughout the study. In Figure 1, 5 mice from each group were used for NOR test first, and then the animals were killed for plasma collection and Western blot. Five mice of each group (see Fig. 7A,D,F) were tested for NOR and then killed for Western blotting. The replicates for Western blot of hippocampus were 3 or 4. In Figure 7C, the three brain slices for IHC of each mouse were also collected. The 3 mice were randomly chosen from each of four groups (vehicle, corticosterone, corticosterone with C646, C646). Results are expressed as mean ± SE. The number of replicates was 3–6 throughout all the experiments. The sample size is justified for several reasons. The tests retain appropriate statistical power with small n size of samples if very low p values are observed. The previous report also insists that triplicates of experiments will be more transparent to just plot the independent data points rather than the large size of n, including interfering results (Vaux, 2012). Furthermore, the authors have done several kinds of experiments to demonstrate the amyloidogenic effect by cortisol-BSA. Thus, rather than increasing the replicates, we have performed various experiments to try to obtain the reliability. All experiments were analyzed by ANOVA (SCR_002427), and some experiments that needed to compare with three groups were examined by comparing the treatment means with the control using a Bonferroni–Dunn test. A result with a p value <0.05 was considered statistically significant.
Figure 7.
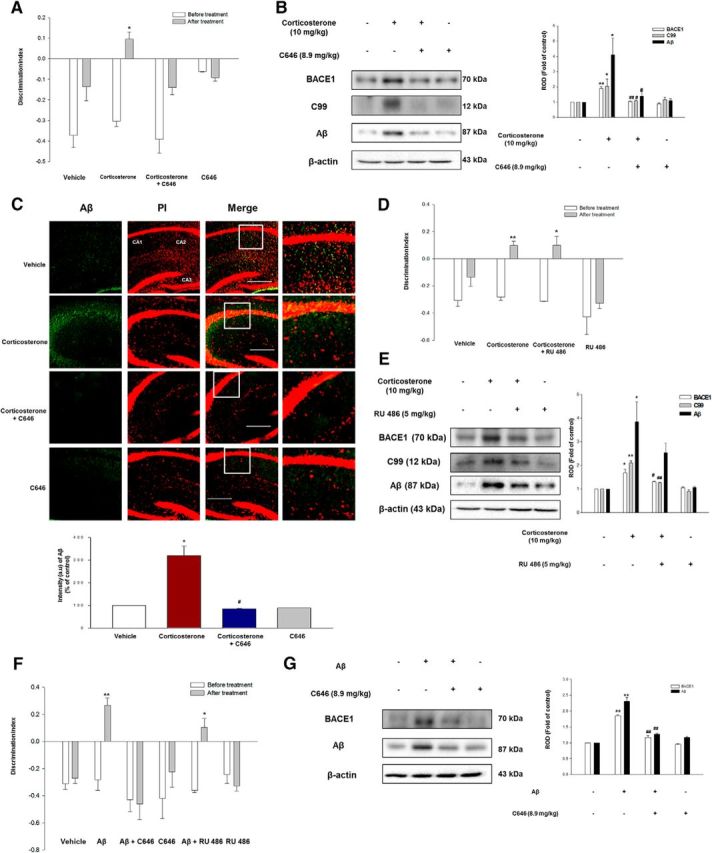
Disease attenuation by interfering CREB activity in animal models upon chronic stress or intracerebroventricular injection of Aβ. A, Vehicle or C646 (8.9 mg/kg) injected mice were presented with/without corticosterone (10 mg/kg) for 7 d. Corticosterone alone mouse groups only exhibited impaired NOR. Data are mean ± SE of five independent experiments. *p < 0.05 versus the NOR test results of mice before the treatment. B, The hippocampus of mice exposed to vehicle, corticosterone (10 mg/kg), corticosterone with C646 treatment (8.9 mg/kg), and C646 was collected, and then BACE1, C99, or Aβ was detected in total lysates. Data are mean ± SE of three independent experiments. *p < 0.05 versus vehicle. **p < 0.01 versus vehicle. #p < 0.05 versus corticosterone treatment group. ##p < 0.01 versus corticosterone treatment group. C, Slide samples for IHC were immunostained with Aβ-specific antibody (green) and PI (red). Scale bars, 100 μm (magnification ×200). Each result is representative of three independent experiments. *p < 0.05 versus vehicle. #p < 0.05 versus corticosterone treatment group. D, Vehicle or RU 486 (5 mg/kg) injected mice were presented with/without corticosterone (10 mg/kg) for 7 d. Corticosterone with RU 486 mouse groups exhibited impaired NOR. Data are mean ± SE of five independent experiments. *p < 0.05 versus the NOR test results of mice before the treatment. **p < 0.01 versus the NOR test results of mice before the treatment. E, The hippocampus of mice administered with vehicle, corticosterone (10 mg/kg), corticosterone with RU 486 treatment (5 mg/kg), and RU 486 was collected, and then BACE1, C99, or Aβ was detected in total lysates. Data are mean ± SE of three independent experiments. *p < 0.05 versus vehicle. **p < 0.01 versus vehicle. #p < 0.05 versus corticosterone treatment group. ##p < 0.01 versus corticosterone treatment group. F, The mice exposed to intracerebroventricular injection of vehicle or Aβ were presented C646 or RU 486 for 7 d. Data are mean ± SE of five independent experiments. *p < 0.05 versus the NOR test results of mice before the treatment. **p < 0.01 versus the NOR test results of mice before the treatment. G, The hippocampus of mice exposed to vehicle or Aβ treated with C646 was collected, and then BACE1 or Aβ was detected in total lysates. Data are mean ± SE of three independent experiments. **p < 0.01 versus vehicle. ##p < 0.01 versus Aβ treatment group.
Results
The nongenomic effect induced by glucocorticoid is associated with amyloidosis independent of the genomic pathway
We determined the role of restraint stress or corticosterone, which is the major glucocorticoid of rodents, on Aβ level and tau phosphorylation in the hippocampus of male ICR mice. The hippocampus of the mice with restraint stress for 30 min during 7 d or corticosterone treatment (10 mg/kg) via IP for 7 d showed increased Aβ generation (Bonferroni–Dunn test, restraint stress/corticosterone; p = 0.0001/p = 0.00527 vs vehicle, respectively; n = 3) but no significant change in the phosphorylation of tau (Fig. 1A). We also evaluated the GRα level, which is the major isoform of GR, in the hippocampus of the mice under restraint stress, corticosterone treatment, or intracerebroventricular administration of Aβ. We confirmed that total GRα level was decreased in all groups (Bonferroni–Dunn test, restraint stress/corticosterone/intracerebroventricular injection of Aβ; p = 0.000064/p = 0.000276/p = 0.0046 vs vehicle, respectively; n = 4) compared with the vehicle groups (Fig. 1B). To evaluate the cognition and GRα distribution in mice under chronic stress state or AD-like pathology, we divided ICR mice into four groups. The mouse groups were separated into vehicle, vehicle with restraint stress, intracerebroventricular injection of Aβ, and intracerebroventricular injection of Aβ with restraint stress. Five days after intracerebroventricular injection with vehicle or Aβ, the mice were restrained for 30 min per day for 1 week. After the treatment, unlike the vehicle group, intracerebroventricular injection of Aβ (Bonferroni–Dunn test, p = 0.00572 vs the DI value of the before treatment; n = 5), intracerebroventricular injection of Aβ with restraint stress (Bonferroni–Dunn test, p = 0.00145 vs DI value of the before treatment; n = 5), and restraint stress only group (Bonferroni–Dunn test, p = 0.00014 vs DI value of the before treatment; n = 5) exhibited significantly impaired NOR performance evident by the DI, which was >0 (Fig. 1C). To evaluate the GRα distribution, fractionation of the hippocampus was done. The GRα isoform is mainly known to function as mGR possibly undergoing a few modifications from cytosolic GR or specific slicing of GR transcripts (Vernocchi et al., 2013). Thus, we used the same antibody for GRα to detect mGR. The decrease in cytosolic GRα was observed (Bonferroni–Dunn test, p = 0.00003/p = 0.01799/p = 0.000071 in intracerebroventricular injection of Aβ vs vehicle/intracerebroventricular injection of Aβ with restraint stress vs intracerebroventricular injection of Aβ/restraint stress vs vehicle, respectively; n = 4), whereas mGR was increased in mice receiving intracerebroventricular injection of Aβ (Bonferroni–Dunn test, p = 0.000018 vs vehicle; n = 4), intracerebroventricular injection of Aβ with restraint stress (Bonferroni–Dunn test, p = 0.000044 vs intracerebroventricular injection of Aβ; n = 4), and restraint stress (Bonferroni–Dunn test, p = 0.000021 vs vehicle; n = 4) compared with the vehicle group (Fig. 1D). In addition, elevated plasma corticosterone levels were observed in all groups (Bonferroni–Dunn test, intracerebroventricular injection of Aβ vs vehicle/intracerebroventricular injection of Aβ with restraint stress vs intracerebroventricular injection of Aβ/restraint stress vs vehicle; p = 0.00871/p = 0.0371/p = 0.00493, respectively; n = 4 for each group), except the vehicle group (Fig. 1E, n = 4 for vehicle group). Mouse groups exposed to intracerebroventricular injection of Aβ with/without restraint stress or restraint stress also presented decreased body weight and thymic involution, all of which are typical characteristics of a chronic stress state (data not shown). Hence, it is likely that glucocorticoid impairs memory function and induces Aβ generation probably through the mGR-dependent mechanism under AD-like pathology.
Based on those experiments, we evaluated the nongenomic effects of cortisol, which is the major form of glucocorticoid in human. Cortisol-BSA is a cell-impermeable and useful tool for studying membrane-associated effects only. Our results also demonstrated that cortisol-BSA did not enter into the cells, whereas cortisol diffused into the intracellular part (data not shown). SK-N-MC cells were exposed to control (BSA) or various concentrations (0–1 μm) of cortisol-BSA for 24 h. Cortisol-BSA promoted the BACE1 expression and increased the level of C99 in a concentration-dependent manner (Bonferroni–Dunn test, BACE1/C99 of 1 μm cortisol-BSA treatment; p = 0.00056/p = 0.001561 vs control, respectively; n = 3), although there was no significant change in presenilin1 expression or in the phosphorylation of tau (Fig. 2A). C99 is the C-terminal fragment of 99 amino acids from APP cleaved by BACE1, which is a rate-limiting step. As the increase in C99 protein can evoke Aβ production, which can cause neuronal cell death and dementia, C99 appears to play a key role in the pathogenesis of AD (Nunan et al., 2001). Therefore, we surveyed the C99 level throughout the all experiments to show the effect of BACE1 on APP cleavage. The most dramatic increase in BACE1 expression (1.8-fold) and in the level of C99 (1.7-fold) was observed with the 1 μm cortisol-BSA treatment after 24 h incubation (Bonferroni–Dunn test, BACE1/C99; p = 0.00188/p = 0.00591 vs control, respectively; n = 3) despite no difference in the expression of presenilin1 and in the level of phosphorylated tau (Fig. 2B). To determine whether the presence of transcription factors precedes protein expression and induces BACE1 translation, we performed real-time PCR. Extracted mRNA of SK-N-MC cells were reverse-transcribed and amplified by PCR with primers of bace1 and β-actin. Cortisol-BSA increased the BACE1 mRNA level by ∼3.8-fold (Bonferroni–Dunn test, p = 0.00693; n = 3) compared with the control group. The final product of APP processing, Aβ generation, was stimulated with the cortisol-BSA treatment for 48 h shown by ELISA of conditioned media in SK-N-MC cells (Fig. 2C; Bonferroni–Dunn test, **p = 0.000002 vs control; n = 3). The cortisol treatment also showed elevated BACE1 expression and C99 levels probably through the genomic pathway, which has a similar tendency as the nongenomic action (data not shown). In the body, cortisol usually binds to the carrier proteins and is decided to enter the cell detaching from the carrier or exert the nongenomic effect binding to the mGR. In this process, the previous report demonstrated that the carrier protein-bound form of cortisol can regulate their fate to induce the genomic effect or nongenomic effect (Bellamy et al., 1962; Rao et al., 1976). Therefore, the body is affected by both genomic and nongenomic action by glucocorticoid, but how much the each of them takes charge of glucocorticoid effect should be carefully inspected. The nongenomic effects of glucocorticoid were emphasized due to the physiological change in GR distribution under AD condition in the present study. We further confirmed the cortisol-BSA effect on amyloidosis with the intracellular GR blocker RU 486 (1 μm). The results showed that RU 486 efficiently blocked the BACE1 expression (Bonferroni–Dunn test, **p = 0.006 vs control, ##p = 0.0051 vs cortisol; n = 3) or the level of C99 (Bonferroni–Dunn test, **p = 0.0051 vs control, ##p = 0.0017 vs cortisol; n = 3) in the cortisol group (Fig. 2D) but failed to abolish the increased BACE1 expression (Bonferroni–Dunn test, **p = 0.0021 vs control; n = 3) and C99 levels (Bonferroni–Dunn test, **p = 0.00065 vs control; n = 6) induced by cortisol-BSA (Fig. 2E). Similarly, RU 486 also failed to decrease Aβ generation induced by cortisol-BSA (Fig. 2F, Bonferroni–Dunn test, **p = 0.00294 vs control; n = 3). Even though the role of RU 486 in blocking mGR signaling is controversial, as Karst et al. (2010) suggested that the inhibitory effect of RU 486 on mGR function, some reports have suggested that RU 486 has no effect on membrane signaling, which is the major characteristic of the nongenomic pathway (Chen and Qiu, 2001; Urbach et al., 2006). This phenomenon can be explained due to the properties of mGR. One report insists that mGR can be divided into two types of receptors. The classical mGR is modified from the cytosolic GR, and it shares similar characteristics of GR. However, the nonclassical mGR is known as an acidic glycoprotein first identified in neuronal plasma membrane showing GPCR characteristics. This mGR has different pharmacological features from those of classical mGR (Mitre-Aguilar et al., 2015) as it only responds to the cortisol or corticosterone, not dexamethasone or mineralocorticoid. Thus, we made a hypothesis that amyloidosis induced by cortisol-BSA is mediated mostly through nonclassical mGR, which may be insensitive to RU 486, even though we cannot completely exclude the possibility of effect on mGR by RU 486. Based upon our results, we confirmed that RU 486 only blocked the amyloidosis induced by cortisol; therefore, we used it to differentiate the nongenomic pathway from the genomic pathway. The glucocorticoid action is also widely known to be mediated by mineralocorticoid receptor when glucocorticoid exists in low concentration. But with high concentration of glucocorticoid or stress exposure, glucocorticoid action is dominantly exerted by GR (de Kloet, 2014). To demonstrate that mineralocorticoid receptor did not participate in amyloidosis induced by glucocorticoid, which was an already reported phenomenon (Green et al., 2006), detection of BACE1 or C99 level in Western blotting of the cells treated with cortisol-BSA for 24 h and Aβ level by ELISA of the culture medium with cortisol-BSA treatment for 48 h were performed. The mineralocorticoid receptor antagonist (spironolactone) failed to block amyloidogenic pathway induced by cortisol-BSA (data not shown).
Figure 2.

The nongenomic effects of glucocorticoid on amyloidosis in human neuroblastoma SK-N-MC cells. A, Cortisol-BSA (0–1 μm) was treated for 24 h in SK-N-MC cells, and BACE1, C99, presenilin 1, p-Tau (Ser 396), p-Tau (Thr 212), or β-actin was detected by Western blot. Data are mean ± SE of three independent experiments. *p < 0.05 versus control (BSA). **p < 0.01 versus control (BSA). B, Total cell lysates of cells with time responses in 1 μm cortisol-BSA were subjected to Western blot. BACE1, C99, presenilin1, p-Tau (Ser 396), p-Tau (Thr 212), and β-actin were detected. *p < 0.05 versus control (BSA). **p < 0.01 versus control (BSA). C, Secreted Aβ in the medium from SK-N-MC cells treated with cortisol-BSA (1 μm) for 48 h was detected by ELISA kit. Data are mean ± SE of three independent experiments. **p < 0.01 versus control. D, SK-N-MC cells were incubated with RU 486 (1 μm) for 30 min before cortisol (1 μm) treatment for 24 h. BACE1, C99, and β-actin levels were analyzed by Western blotting. Data are mean ± SE of three independent experiments. **p < 0.01 versus control. ##p < 0.01 versus cortisol alone. E, SK-N-MC cells were incubated with RU 486 (1 μm) for 30 min before cortisol-BSA treatment (1 μm) for 24 h. BACE1, C99, and β-actin levels were analyzed by Western blotting. Data are mean ± SE of six independent experiments. **p < 0.01 versus control. F, The cells were incubated with RU 486 (1 μm) for 30 min before cortisol-BSA treatment (1 μm) for 48 h, and the secreted Aβ in conditioned medium was detected using ELISA kit. Data are mean ± SE of three independent experiments. **p < 0.01 versus control.
Cortisol-BSA increases the interaction between mGR and G-protein to induce lipid raft-mediated Aβ production
To further explore the mechanisms of cortisol-BSA on the membrane signaling cascade, the total lysates of SK-N-MC cells were coimmunoprecipitated with the GRα antibody based on the facts that many studies have reported that putative GR may be a GPCR (Tasker et al., 2006; Di and Tasker, 2008). Moreover, many researchers reported that mGR is coupled with Gαq, but some of mGR binds to Gαs (ffrench-Mullen, 1995; Di et al., 2003; Qi et al., 2005). Cortisol-BSA treatment enhanced the interaction between Gαs and GRα at 15 min (Bonferroni–Dunn test, p = 0.00000205 vs control; n = 4), implicating that mGR was activated. However, GRα did not couple with the Gαq isoform (Fig. 3A). Consistent with this result, cortisol-BSA did not alter the calcium ion influx or PKC phosphorylation level (data not shown). Translocation of GRα and Gαs from the cytosol (Bonferroni–Dunn test, GRα/Gαs; p = 0.0063/p = 0.00058 vs control, respectively; n = 3) to the membrane (Bonferroni–Dunn test, GRα/Gαs; p = 0.00102/p = 0.019 vs control, respectively; n = 3) was increased in the cortisol-BSA treatment shown by Western blotting (Fig. 3B). The immunostaining results also showed that cortisol-BSA moved both GRα and Gαs toward the membrane (Bonferroni–Dunn test, GRα, **p = 0.000013 vs control; Gαs, **p = 0.00231 vs control; n = 3) compared with the control (Fig. 3C,D). Furthermore, cortisol-BSA augmented the colocalization of GRα and Gαs (Bonferroni–Dunn test, **p = 0.000196 vs control; n = 3), which was visualized by immunostaining (Fig. 3E). To further evaluate the function of mGR in amyloidogenesis, we used the GR function-blocking antibody. Function-blocking antibody does not have a reaction when it binds with an antigen but prevents other ligands. In this regard, this antibody has various clinical and experimental uses regarding the fact that it can be used as good blocking agent for membrane receptor (Agrawal et al., 2012). Thus, the GR function-blocking antibody is different from the RU 486, as it only blocks the mGR action due to its high molecular weight. GR function-blocking antibody also binds to mGR and induces degradation by internalization, resulting in the blockade of cortisol-BSA function on the mGR-dependent signaling pathway (Gametchu et al., 1993; Liposits and Bohn, 1993). Therefore, BACE1 expression (Bonferroni–Dunn test, **p = 0.0011 vs control, ##p = 0.002 vs cortisol-BSA; n = 4), C99 levels (Bonferroni–Dunn test, **p = 0.00248 vs control, ##p = 0.0035 vs cortisol-BSA; n = 4), and Aβ generation (Bonferroni–Dunn test, **p = 0.0000347 vs control, ##p = 0.00313 vs cortisol-BSA; n = 3) induced by cortisol-BSA were downregulated in the GR function-blocking antibody (100 μg/ml) pretreated cells (Fig. 3F,G).
Figure 3.
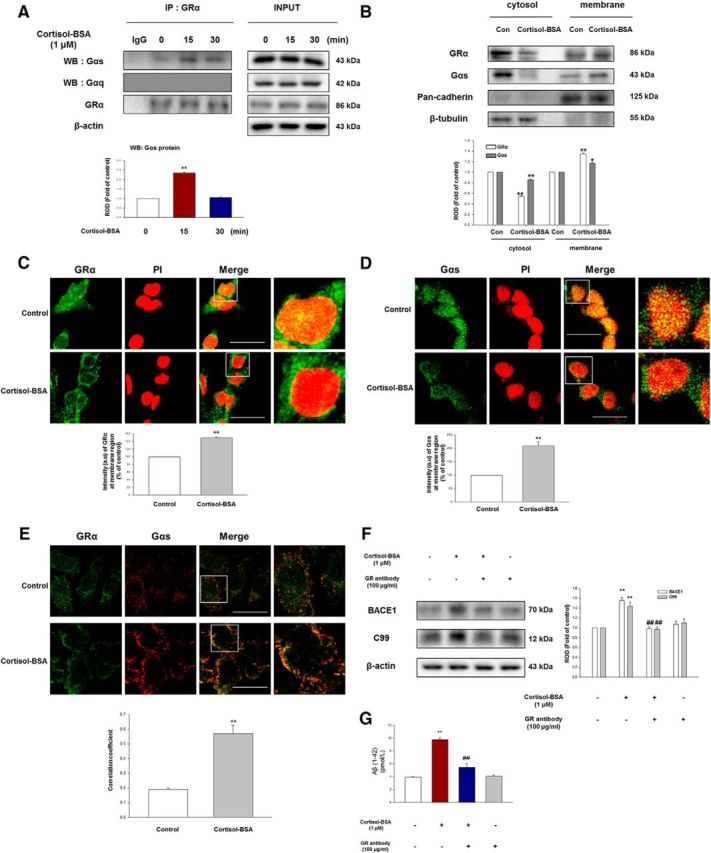
Membrane GRα coupling with Gαs regulates Aβ production in SK-N-MC cells. A, The cells were incubated with cortisol-BSA (1 μm) for 15 min or 30 min and then harvested. Left, GRα was immunoprecipitated with an anti-GRα, anti-Gαs, and anti-Gαq antibodies. Right, Expression of GRα, Gαs, Gαq, and β-actin in total cell lysates. Data are mean ± SE of four independent experiments. **p < 0.01 versus control. B, The cells were incubated with cortisol-BSA (1 μm) for 15 min and then fractionized. Cytosolic and membrane protein expressions were normalized by β-tubulin and pan-cadherin, respectively, in Western blotting results. White panels represent GRα. Gray panels represent Gαs. Data are mean ± SE of three independent experiments. *p < 0.05 versus control. **p < 0.01 versus control. C, Membrane translocation of GRα (green, Abcam product) was determined by confocal microscopy using immunofluorescence staining. The cells were treated with cortisol-BSA (1 μm) for 15 min. PI was used for nuclear counterstaining (red). Scale bars, 40 μm (magnification ×600). Each result is representative of three independent experiments. Data are mean ± SE of three independent experiments. **p < 0.01 versus control. D, Membrane translocation of Gαs (green) was determined by confocal microscopy using immunofluorescence staining. The cells were treated with cortisol-BSA (1 μm) for 15 min. PI was used for nuclear counterstaining (red). Scale bars, 40 μm (magnification ×600). Each result is representative of three independent experiments. Data are mean ± SE of three independent experiments. **p < 0.01 versus control. E, The increased colocalization between GRα (green, EMD Millipore product) and Gαs (red) was determined by confocal microscopy in cells with cortisol-BSA treatment for 15 min. Scale bars, 100 μm (magnification ×400). Each result is representative of three independent experiments. Data are mean ± SE of three independent experiments. **p < 0.01 versus control. F, The cells were preincubated with GR function-blocking antibody (GR antibody, 100 μg/ml) for 1 h and then treated with cortisol-BSA (1 μm) for 24 h. Expression of BACE1 and C99 was shown via Western blotting. Data are mean ± SE of four independent experiments. **p < 0.01 versus control. ##p < 0.01 versus cortisol-BSA alone. G, The cells were incubated with GR function-blocking antibody (GR antibody, 100 μg/ml) for 1 h before cortisol-BSA treatment (1 μm) for 48 h, and the secreted Aβ in conditioned medium was detected using ELISA kit. Data are mean ± SE of three independent experiments. **p < 0.01 versus control. ##p < 0.01 versus cortisol-BSA alone.
The lipid raft has been implicated in mGR signaling, but the underlying mechanism still needs to be elucidated. The results of sucrose gradient centrifugation exhibited that the lipid raft markers (caveolin-1, flotillin-1) and GRα were found in fraction 5; however, Gαs was in the bottom density of the nontreated cells. Cortisol-BSA-treated cells showed that location of the lipid raft markers Gαs and GRα was mainly localized in fractions 4 and 5 (Fig. 4A), meaning that the lipid raft mediated the association between mGR and Gαs with cortisol-BSA. The cholesterol-rich membrane lipid rafts can be visualized by confocal microscopy with CTB. CTB has high affinity for lipid raft component, such as glycosylphosphatidylinositol-linked proteins and adaptor protein, but not for nonlipid raft membrane proteins. CTB makes the distinct patches at the lipid raft part of the plasma membrane, which are easily visualized by fluorescence microscopy (Galbiati et al., 2001). GRα showed a slight increase in colocalization, whereas Gαs was dramatically costained with CTB in the treated cells (Bonferroni–Dunn test, GRα stained with CTB, **p = 0.0000497 vs control; Gαs stained with CTB, **p = 0.0000004 vs control; n = 5) compared with the control (Fig. 4B). We further quantified the results by coimmunoprecipitation of GRα and Gαs. Cortisol-BSA induced GRα binding with caveolin-1 (Bonferroni–Dunn test, p = 0.000003763 vs control; n = 4) or flotillin-1 (Bonferroni–Dunn test, p = 0.00015 vs control; n = 4) by ∼2-fold. Likewise, we found that cortisol-BSA dramatically induced the integration of Gαs with caveolin-1 (Bonferroni–Dunn test, p = 0.000003 vs control; n = 4) or flotillin-1 (Bonferroni–Dunn test, p = 0.0000083 vs control; n = 4) by ∼3-fold (Fig. 4C). Cortisol-BSA also increased the costaining between mGR and the lipid raft markers (Bonferroni–Dunn test, GRα stained with caveolin-1, **p = 0.0000332 vs control; GRα stained with flotillin-1, *p = 0.00052 vs control; n = 5) seen in the immunofluorescence results (Fig. 4D). The interaction between mGR and Gαs induced by cortisol-BSA was abolished (Bonferroni–Dunn test, **p = 0.00002 vs control, ##p = 0.00035 vs cortisol-BSA; n = 5) in the lipid raft disruptor, MβCD (2 mm), pretreated cells (Fig. 4E). Furthermore, caveolin-1 knockdown (Fig. 4F) and MβCD (2 mm) treatment (Fig. 4G) resulted in a decreased BACE1 expression (Bonferroni–Dunn test, caveolin-1 knockdown/MβCD; p = 0.039/p = 0.00615 vs cortisol-BSA, respectively; n = 3) and level of C99 (Bonferroni–Dunn test, caveolin-1 knockdown/MβCD; p = 0.0284/p = 0.0217 vs cortisol-BSA, respectively; n = 3). MβCD (2 mm) pretreatment also downregulated the Aβ generation (Bonferroni–Dunn test, **p = 0.0070162 vs control, #p = 0.01566 vs cortisol-BSA; n = 3) by cortisol-BSA (Fig. 4H). To confirm that coupling of mGR with Gαs is related to the lipid raft via nongenomic pathway, we have shown that the cytosolic GR blocker RU 486 failed to decrease interaction of mGR with Gαs, caveolin-1, and flotillin-1 via immunoprecipitation (data not shown). Upon cortisol-BSA treatment, the lipid raft plays an important role in promoting the cooperation between mGR with Gαs to evoke the subsequent amyloidosis.
Figure 4.
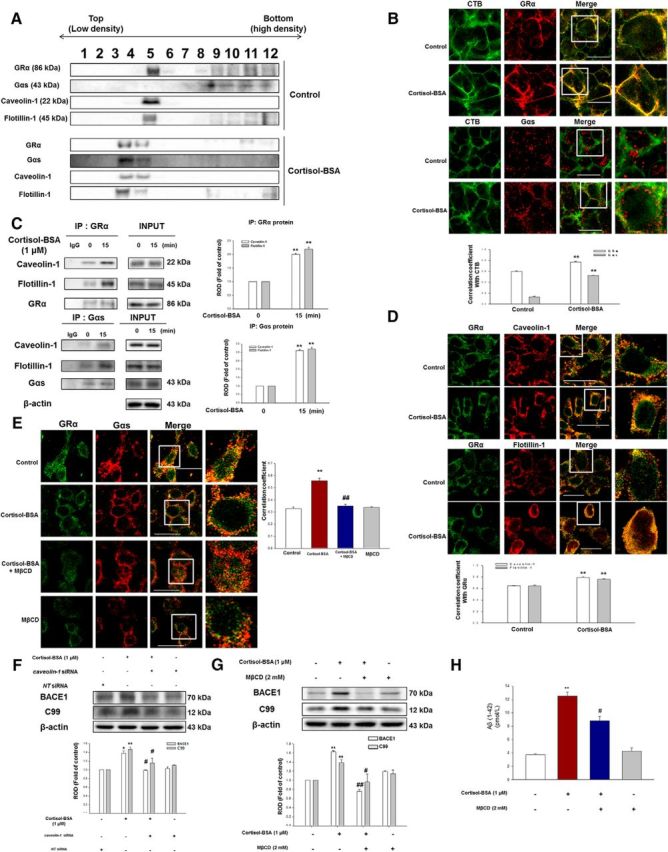
Role of lipid raft in GRα-Gαs coupling and subsequent amyloidosis. A, SK-N-MC cells were exposed to cortisol-BSA (1 μm) for 15 min. Sucrose gradient-fractionized samples were blotted with GRα, Gαs, caveolin-1, and flotillin-1 antibodies. Each result is representative of four independent experiments. B, The increased costaining of CTB (green) with GRα (red, Abcam product) or Gαs (red) was visualized by confocal microscopy using immunofluorescence staining. Scale bars, 20 μm (magnification ×600). Each result is representative of five independent experiments. Data are mean ± SE of five independent experiments. **p < 0.01 versus control. C, The cells were incubated with cortisol-BSA (1 μm) for 15 min and then harvested. Top, Left, GRα was coimmunoprecipitated with an anti-caveolin-1, anti-flotillin-1, and anti-GRα. Bottom, Left, Gαs was coimmunoprecipitated with an anti-caveolin-1, anti-flotillin-1, and anti-Gαs. Right, Expression of GRα, Gαs, caveolin-1, flotillin-1, and β-actin in total cell lysates was determined. Data are mean ± SE of four independent experiments. **p < 0.01 versus control. D, The increased colocalization of GRα (green, Abcam product) with caveolin-1 or flotillin-1 (red) was visualized by confocal microscopy using immunofluorescence staining. Scale bars: Top, 100 μm, two panels (magnification ×400); Bottom, 200 μm, two panels (magnification ×300). Each result is representative of five independent experiments. Data are mean ± SE of five independent experiments. **p < 0.01 versus control. E, The increased GRα-Gαs interaction was diminished with MβCD (2 mm) incubation for 2 h before cortisol-BSA (1 μm). Colocalization between GRα (green, EMD Millipore product) and Gαs (red) was determined by confocal microscopy in cortisol-BSA treatment for 15 min. Scale bars, 200 μm (magnification ×400). Each result is representative of five independent experiments. Data are mean ± SE of five independent experiments. **p < 0.01 versus control. ##p < 0.01 versus cortisol-BSA alone. F, Knockdown of caveolin-1 was done using siRNA transfection for 24 h, and then cells were treated with cortisol-BSA during 24 h. The total lysates were detected using BACE1 or C99 antibody by Western blotting. Data are mean ± SE of three independent experiments. *p < 0.05 versus control. **p < 0.01 versus control. #p < 0.05 versus cortisol-BSA alone. G, SK-N-MC cells were exposed to MβCD (2 mm) for 2 h before cortisol-BSA treatment (1 μm) for 24 h, and detected with anti-BACE1, anti-C99, and anti-β-actin by Western blot. Data are mean ± SE of three independent experiments. **p < 0.01 versus control. #p < 0.05 versus cortisol-BSA alone. ##p < 0.01 versus cortisol-BSA alone. H, SK-N-MC cells were incubated with MβCD (2 mm) for 2 h before cortisol-BSA treatment (1 μm) for 48 h, and the secreted Aβ in conditioned medium was detected using ELISA kit. Data are mean ± SE of three independent experiments. **p < 0.01 versus control. #p < 0.05 versus cortisol-BSA alone.
Effects of glucocorticoid on the cAMP-PKA-CREB axis, which upregulates BACE1 expression and Aβ secretion inducing memory deficits
Given the possibility that the effects of cortisol-BSA on Aβ generation were mediated through increased mGR-Gαs interaction, we evaluated the cAMP level using a cAMP measurement kit. The decrease in OD indicates that cAMP levels are increased. Cortisol-BSA increased the cAMP level, which was abolished by the adenylyl cyclase inhibitor SQ 22536 (1 μm, Bonferroni–Dunn test, ##p = 0.000172 vs cortisol-BSA; n = 4) or MβCD (2 mm, Bonferroni–Dunn test, ##p = 0.000047 vs cortisol-BSA; n = 4) pretreatment (Fig. 5A,B). Cortisol-BSA induced nuclear translocation of PKA catalytic form showing maximum increase (∼1.6-fold, Bonferroni–Dunn test, p = 0.018 vs control; n = 3) during 30 min (Fig. 5C). However, SQ 22536 (1 μm) diminished the PKA level in the nucleus confirmed by immunofluorescence staining (Fig. 5D; Bonferroni–Dunn test, **p = 0.0000318 vs control, ##p = 0.000041 vs cortisol-BSA; n = 4) or Western blotting (Fig. 5E; Bonferroni–Dunn test, **p = 0.0008 vs control, #p = 0.046 vs cortisol-BSA; n = 3). The maximum increase in CREB phosphorylation at nuclear part was seen in 60 min (Bonferroni–Dunn test, p = 0.0000012 vs control; n = 3) after cortisol-BSA treatment (Fig. 5F). Phosphorylated CREB was blocked by specific PKA inhibitor, 14–22 amide (Fig. 5G; Bonferroni–Dunn test, *p = 0.035 vs control, #p = 0.034 vs cortisol-BSA; n = 3). The 14–22 amide pretreatment (1 μm) also abolished the amyloidogenic effect (Bonferroni–Dunn test, BACE1; *p = 0.047 vs control, #p = 0.042 vs cortisol-BSA/C99; **p = 0.0051 vs control, #p = 0.0499 vs cortisol-BSA/Aβ; **p = 0.000787 vs control, #p = 0.010233 vs cortisol-BSA; n = 3) of cortisol-BSA (Fig. 5H,I). Given the results that the lipid raft regulated the cortisol-BSA-induced membrane signaling, MβCD (2 mm) or caveolin-1 siRNA treatment downregulated the phosphorylation of CREB (data not shown).
Figure 5.
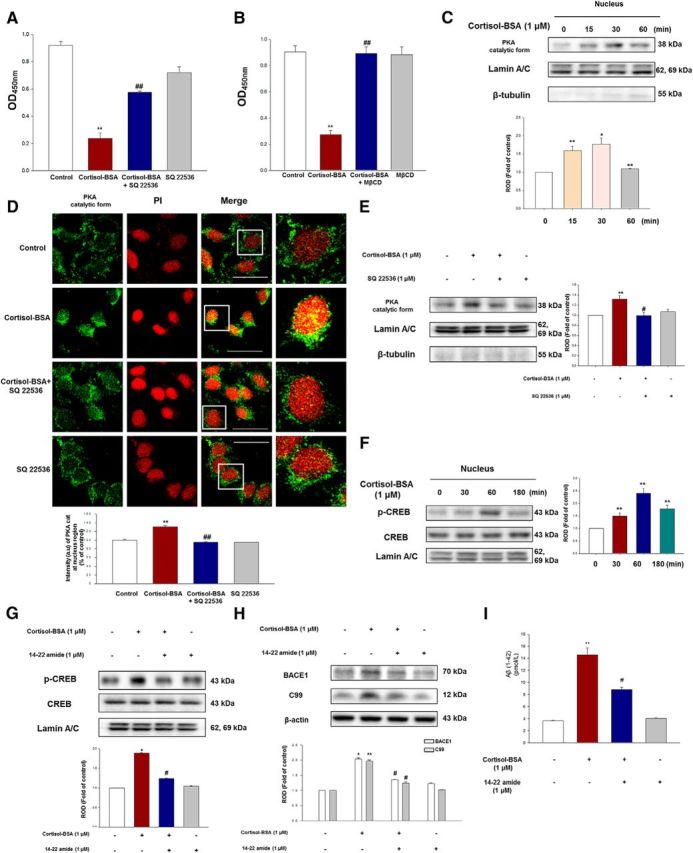
Effects of cortisol-BSA on cAMP-PKA-CREB pathway, which mediates amyloidosis. A, The cells were incubated with or without SQ 22536 (1 μm) for 30 min before cortisol-BSA treatment (1 μm) for 10 min. The intracellular cAMP levels were measured at an absorbance of 450 nm filtered at an absorbance of 540 nm using a microplate reader. Data are mean ± SE of four independent experiments. **p < 0.01 versus control. ##p < 0.01 versus cortisol-BSA alone. B, SK-N-MC cells were exposed to MβCD (2 mm) for 2 h before cortisol-BSA incubation (1 μm) for 10 min. The intracellular cAMP levels were measured at an absorbance of 450 nm filtered by absorbance of 540 nm using a microplate reader. Data are mean ± SE of four independent experiments. **p < 0.01 versus control. ##p < 0.01 versus cortisol-BSA alone. C, Nuclear translocation of PKA catalytic form in cells treated with cortisol-BSA (1 μm) was detected in a time-dependent manner (0–60 min) using nuclear fraction and Western blotting. The lamin A/C was used as a nucleus control. Data are mean ± SE of three independent experiments. *p < 0.05 versus control. **p < 0.01 versus control. D, Nuclear translocation of PKA catalytic form in cells exposed to cortisol-BSA (1 μm) for 30 min with or without SQ 22536 (1 μm) was monitored by confocal microscopy. The PKA (green) and PI (red) were under immunofluorescence staining. Scale bars, 200 μm (magnification ×400). Each result is representative of four independent experiments. Data are mean ± SE of four independent experiments. **p < 0.01 versus control. ##p < 0.01 versus cortisol-BSA alone. E, Nuclear translocation of PKA catalytic form in cells exposed to cortisol-BSA (1 μm) after SQ 22536 pretreatment for 30 min was determined by nuclear fraction and Western blotting. The lamin A/C was used as a nucleus control. Data are mean ± SE of three independent experiments. **p < 0.01 versus control. #p < 0.05 versus cortisol-BSA alone. F, Nuclear translocation of phosphorylated CREB in cells treated with cortisol-BSA (1 μm) was detected in a time-dependent manner (0–180 min) using nuclear fraction and Western blot. Data are mean ± SE of three independent experiments, and each condition was determined by densitometry relative to total-CREB and to the loading control lamin A/C. **p < 0.01 versus control. G, SK-N-MC cells were pretreated with/without 14–22 amide (1 μm) for 30 min and then exposed to cortisol-BSA (1 μm) for 1 h before harvesting. The cells were fractionized and detected with p-CREB, the CREB, and the lamin A/C antibody. Data are mean ± SE of three independent experiments, and each condition was determined by densitometry relative to total-CREB and to the loading control lamin A/C. *p < 0.05 versus control. #p < 0.05 versus cortisol-BSA alone. H, Cells were pretreated with/without 14–22 amide (1 μm) for 30 min before exposure of cortisol-BSA (1 μm) for 24 h. BACE1, C99, and β-actin were detected by Western blotting. Data are mean ± SE of three independent experiments. *p < 0.05 versus control. **p < 0.01 versus control. #p < 0.05 versus cortisol-BSA alone. I, SK-N-MC cells were incubated with 14–22 amide (1 μm) for 30 min before cortisol-BSA exposure (1 μm) for 48 h, and the secreted Aβ in conditioned medium was detected using ELISA kit. Data are mean ± SE of three independent experiments. **p < 0.01 versus control. #p < 0.05 versus cortisol-BSA alone.
The effect of RU 486 (1 μm) failed to decrease the phosphorylation of CREB (Fig. 6A). However, the GR function-blocking antibody pretreatment (100 μg/ml) decreased the phosphorylation of CREB (Bonferroni–Dunn test, ##p = 0.0089 vs cortisol-BSA; n = 3) induced by cortisol-BSA (Fig. 6B). Given that phosphorylated CREB and CBP interact to mediate transcription, we confirmed the colocalization between p-CREB and CBP (Bonferroni–Dunn test, **p = 0.00000085 vs control; n = 5) with immunofluorescence staining (Fig. 6C). The CBP inhibitor C646 (20 μm) and creb siRNA were used to examine whether CREB has an important role in amyloidosis. The results show that the BACE1 expression and C99 level were downregulated both by C646 (Fig. 6D; Bonferroni–Dunn test, BACE1; *p = 0.045 vs control, #p = 0.0481 vs cortisol-BSA and C99; **p = 0.00096 vs control, ##p = 0.0016 vs cortisol-BSA. n = 3), and creb knockout (Fig. 6E; Bonferroni–Dunn test, BACE1; *p = 0.041 vs control, and C99; **p = 0.0071 vs control, #p = 0.045 vs cortisol-BSA; n = 3). C646 treatment also decreased the Aβ generation by cortisol-BSA (Fig. 6F; Bonferroni–Dunn test, **p = 0.00004 vs control, ##p = 0.0022 vs cortisol-BSA; n = 3). In this regard, we concluded that the interaction between p-CREB and promoter region of bace1 gene would increase by cortisol-BSA treatment. Therefore, we used ChIP assay, which identifies the specific DNA sequences associated with the protein of interest and allows crosslinking of the protein-DNA complex able to be examined by PCR with gene-specific primers (Weinmann and Farnham, 2002; Wang et al., 2004). By using the ChIP assay, we confirmed that cortisol-BSA induced phosphorylated CREB to bind to the BACE1 promoter (Fig. 6G).
Figure 6.
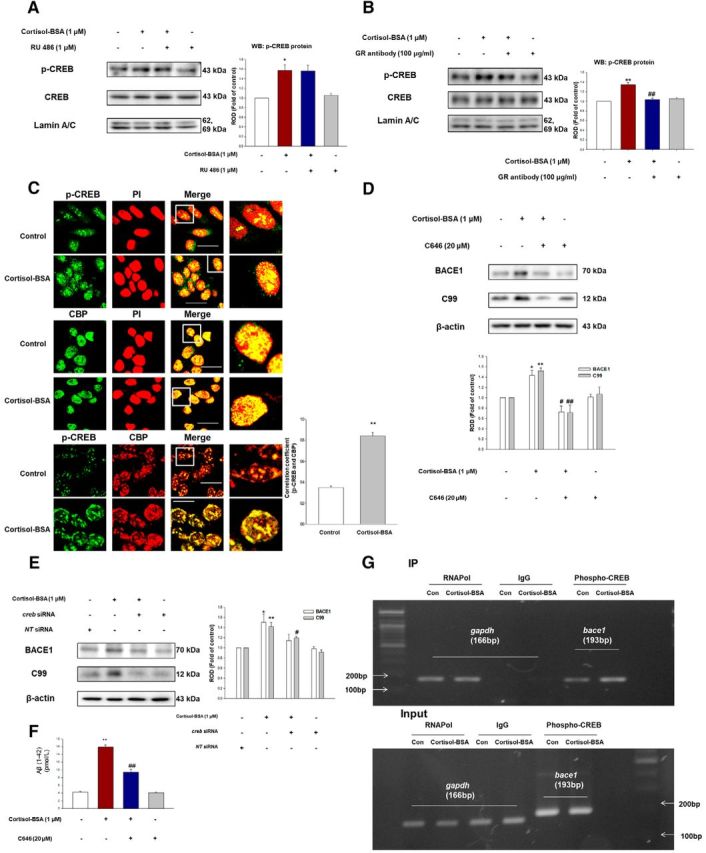
Phosphorylated CREB activates the amyloidosis binding to BACE1 promoter-dependent on mGR signaling. A, Cells were pretreated with/without RU 486 (1 μm) for 30 min before exposure of cortisol-BSA (1 μm) for 1 h. Phosphorylated CREB, the CREB, and the lamin A/C were detected by nuclear fraction and Western blotting. Data are mean ± SE of four independent experiments, and p-CREB was determined by densitometry relative to total-CREB and to the loading control lamin A/C (right). *p < 0.05 versus control. B, Cells were preincubated with GR function-blocking antibody (GR antibody, 100 μg/ml) for 1 h and then treated with cortisol-BSA (1 μm) for 1 h. The level of p-CREB, the CREB, and the lamin A/C was shown via nuclear fraction and Western blotting. Data are mean ± SE of three independent experiments, and p-CREB was determined by densitometry relative to total-CREB and to the loading control lamin A/C (right). **p < 0.01 versus control. ##p < 0.01 versus cortisol-BSA alone. C, Nuclear translocation of p-CREB or colocalization between CBP and CREB in cells exposed to cortisol-BSA (1 μm) for 1 h was monitored by confocal microscopy. The p-CREB (green, left top) and PI (red, right top) were under immunofluorescence staining. CBP (green, left middle) and PI (red, right middle) were visualized to localize CBP protein. The p-CREB (green, left bottom) and CBP (red, right bottom) were also visualized to observe the colocalization. Scale bars, 100 μm (magnification ×400). Each result is representative of five independent experiments. Correlation coefficient analysis between CBP and p-CREB was done. Data are mean ± SE of five independent experiments. **p < 0.01 versus control. D, C646 (20 μm) was pretreated for 30 min before cortisol-BSA treatment. Expression of BACE1, C99, and β-actin was detected by Western blotting. Data are mean ± SE of three independent experiments. *p < 0.05 versus control. **p < 0.01 versus control. #p < 0.05 versus cortisol-BSA alone. ##p < 0.01 versus cortisol-BSA alone. E, Knockdown of creb was done using siRNA transfection for 24 h, and then cells were treated with cortisol-BSA during 24 h. The total lysates were detected using BACE1 and C99 antibody by Western blotting. Data are mean ± SE of three independent experiments. *p < 0.05 versus control. **p < 0.01 versus control. #p < 0.05 versus cortisol-BSA alone. F, SK-N-MC cells were incubated with C646 (20 μm) for 30 min before cortisol-BSA exposure (1 μm) for 48 h, and the secreted Aβ in conditioned medium was detected using ELISA kit. Data are mean ± SE of three independent experiments. **p < 0.01 versus control. ##p < 0.01 versus cortisol-BSA alone. G, The cells were incubated with cortisol-BSA for 3 h. DNA was immunoprecipitated with RNAPol, IgG, and p-CREB antibody. The immunoprecipitation and input samples were amplified with primers of gapdh and bace1 gene promoters.
Given the in vitro results, we therefore treated 7-week-old male ICR mice with C646, which blocks the induction of amyloidosis by nongenomic effect of glucocorticoid through decreasing CBP-CREB interaction and examined the recovery of memory function or the repressing effect on Aβ production. The mice were treated with either vehicle with C646 or corticosterone with C646 intraperitoneally over the course of 1 week. Memory deficits in mice by corticosterone alone (Bonferroni–Dunn test, p = 0.0339 vs DI value of mice before treatment; n = 5) were not observed in the corticosterone with C646 treatment groups (Fig. 7A). The elevation of BACE1, C99, and Aβ level induced by corticosterone was also significantly diminished with the C646 treatment (Fig. 7B; Bonferroni–Dunn test, BACE1/C99/Aβ; p = 0.0021/p = 0.048/p = 0.044 vs corticosterone, respectively; n = 3). In IHC results, C646 efficiently abolished Aβ generated by corticosterone in hippocampus (Fig. 7C; Bonferroni–Dunn test, *p = 0.0246 vs control, #p = 0.0198 vs corticosterone; n = 3). Interestingly, memory deficits (Bonferroni–Dunn test, corticosterone/corticosterone with RU 486; p = 0.0008/p = 0.0169 vs DI value of mice before treatment, respectively; n = 5) were seen in the corticosterone with RU 486 treatment (Fig. 7D); however, BACE1 expression, C99 levels, and Aβ generation were decreased compared with the corticosterone treatment alone group (Fig. 7E; Bonferroni–Dunn test, BACE1/C99/Aβ; p = 0.046/p = 0.0011/p = 0.059 vs corticosterone, respectively; n = 3), but the amount of decrease was smaller than that of the mice receiving corticosterone and C646. In mice exposed to intracerebroventricular injection of Aβ, memory impairment was also attenuated with the C646 treatment, unlike mice exposed to intracerebroventricular injection of Aβ with RU 486 treatment (Fig. 7F). The APP processing induced by intracerebroventricular injection of Aβ was also effectively decreased (Bonferroni–Dunn test, BACE1/Aβ; p = 0.00078/p = 0.0015 vs intracerebroventricular injection of Aβ, respectively; n = 3) with the C646 administration (Fig. 7G).
Discussion
This study shows that glucocorticoid has a different novel mechanism of amyloidosis under intracellular GR depletion state, induces Aβ formation through the interaction of mGR and Gαs at lipid raft, and activates the cAMP-PKA-CREB pathway, which has direct actions on BACE1 upregulation in both animal model and SK-N-MC cells. Our data demonstrated that 1 week of restraint stress or corticosterone treatment elevated Aβ generation in the hippocampus but had no effect on tau phosphorylation. Because Aβ accumulation precedes accumulation of tau, relatively longer treatment of corticosterone or stress is considered necessary to affect enough phosphorylation of tau. Interestingly, the amyloidosis in mice exposed to chronic stress or corticosterone was induced despite decreased intracellular GR. Recently, the amyloidogenic mechanism dependent on genomic pathway by glucocorticoid has been investigated rigorously. Acute stress, lasting during a few hours, usually elevates GR level to depress hypothalamic-pituitary-adrenal axis and mediates amyloidosis via the genomic pathway-dependent BACE1 expression (Sambamurti et al., 2004; de Kloet, 2014). In contrast, chronic stress exposure, following at least a 1 week regimen of stress, leads to decreased intracellular GR level, glucocorticoid resistant state, and hypothalamic-pituitary-adrenal dysregulation (Han et al., 2014; Bockmühl et al., 2015). Some reports explained that chronic stress induces DNA methylation of the Nr3C1 promoter region in rat DRGs or inflammatory cytokines, which repress GR expression (Miller et al., 2008; Bockmühl et al., 2015); however, the exact mechanism remains elusive. Our results revealed that Aβ production by stress may regulate GR expression as most AD patients have shown the downregulation of intracellular GR in hippocampus, hypothalamus, and prefrontal cortex, which are the primary target sites of Aβ (Hartmann et al., 1997; Elgh et al., 2006; Escribano et al., 2009; Notarianni, 2013). Thus, overactivation of GR by glucocorticoid leads to Aβ accumulation in early stage, and GR modification induced by Aβ indeed may affect AD progression the most in later stage of AD. Consistent with this phenomenon, our results show that chronic stress or intracerebroventricular injection of Aβ decreased GR levels in the hippocampus. Despite the GR depletion, corticosterone or chronic stress accelerated cognition impairment similarly as previously reported (Catania et al., 2009) for which the detailed mechanism is not elucidated; thus, it is necessary to find a new pathway. Unexpectedly, our results showed dramatically increased mGR in mice exposed to intracerebroventricular injection of Aβ or chronic restraint stress, indicating that Aβ may act as a regulator of GR distribution and mGR-associated amyloidosis. Although we found the importance of nongenomic signaling by glucocorticoid, additional studies on how Aβ mediates preferential actions through mGR on APP processing will be necessary. The results in animal models prompted us to deeply investigate the nongenomic pathway in SK-N-MC cells. Interestingly, cortisol-BSA elevated not tau but Aβ level, which is consistent with the in vivo results, by upregulating BACE1 expression, not affecting γ-secretase (Green et al., 2006). Cortisol treatment also induced BACE1 expression and Aβ formation via genomic pathway, like the nongenomic pathway. However, our in vitro results demonstrated that nongenomic action can solely induce amyloidosis in neuroblastoma cells. Both genomic and nongenomic actions take place in Aβ production, but each of them has different portions of amyloidosis depending on the physiological status of body, such as cytosolic GR insufficiency. Therefore, the results reveal that the different mechanism mediated by mGR could also contribute to amyloidogenesis and compensate for the decreased intracellular GR in AD-like pathology.
Recent studies have concentrated on establishing new therapeutic molecules through an in-depth inspection of novel nongenomic mechanism due to growing evidence of its compatibility with genomic action (Buttgereit et al., 2004). Thus, mGR signaling through second messengers has been rigorously investigated; however, the exact identification of mGR remains elusive, unlike estrogen receptors (Tasker et al., 2006; Rainville et al., 2015). Accumulating evidence suggests that mGR could be a tissue-specific receptor that can evoke various reactions (Hafezi-Moghadam et al., 2002; Pérez et al., 2013). For example, glucocorticoid regulates NMDA receptor in hippocampus of mice (Xiao et al., 2010) or induces gap junction phosphorylation in mouse neuroprogenitor cells (Samarasinghe et al., 2011). Therefore, identifying mGR in SK-N-MC cells and the related amyloidogenic mechanism is an important issue. However, much evidence has demonstrated that most mGRs exhibit GPCR characteristics, with a few exceptions (Orchinik et al., 1992; ffrench-Mullen, 1995). In this regard, our results are in good agreement in that mGR was associated with Gαs, which was demonstrated in hypothalamic neuron (Tasker et al., 2006). Even more interestingly, cortisol-BSA translocated both mGR and Gαs from cytosol to membrane. Translocated mGR can be either modified from cytosolic GRα undergoing conformational changes or nonclassical mGR can be gathered at the membrane upon cortisol-BSA treatment (Mitre-Aguilar et al., 2015). Furthermore, cortisol-BSA induced the movement of mGR and Gαs into lipid raft. Given the current evidence, mGR originally exists in lipid raft or moves to it from nonlipid raft by glucocorticoid, all of which mediate subsequent kinase activation, such as AKT and ERK (Matthews et al., 2008; Samarasinghe et al., 2011). In our results, most mGRs were originally located in the lipid raft, but GR within the nonlipid raft region moved to the lipid raft with cortisol-BSA, attending the nongenomic signaling. We postulate that the lipid raft has an important role in amyloidogenesis through mGR signaling given that alterations of the lipid raft can strongly affect neurodegenerative diseases (Simons and Ehehalt, 2002; Di Paolo and Kim, 2011). The lipid raft is also known to enhance GPCR signaling more efficiently by gathering the signaling molecules into the immobile complex (Chini and Parenti, 2004; Ostrom and Insel, 2004). Our results show that cortisol-BSA had a stimulatory action on the interaction between mGR and Gαs gathered at lipid raft. However, binding between mGR with lipid raft or Gαs by glucocorticoid has not been well studied; thus, more detailed mechanism on how they interact should be elucidated. Together, all the results indicate that lipid raft contributes to interaction between mGR and Gαs acting as a platform for assembling the signaling complex, which evokes the subsequent amyloidosis.
Our results also suggest that cortisol-BSA activates the cAMP-PKA-CREB axis, which subsequently induces BACE1 expression. There have been many reported transcription factors to bind the BACE1 promoter, such as NF-κB, CREB, STAT, and Smad. Our results suggest that rapid activation of CREB by cortisol-BSA accounts for Aβ production. However, the role of CREB is currently under debate. CREB has a positive effect on memory consolidation and neuronal proliferation (Benito and Barco, 2010), although it can also induce BACE1 upregulation due to the existence of the CRE site on the BACE1 promoter (Sambamurti et al., 2004; Cole and Vassar, 2007; Shi et al., 2013) or evoke detrimental effects on memory performance (Benito and Barco, 2010). It was shown that GR recruits the CaMKII-BDNF-CREB pathway to consolidate memory in rat brain after regular training with mild stress (Chen et al., 2012). Our results, however, clearly show that activation of the cAMP-PKA-CREB pathway induced amyloidosis through stimulating BACE1 expression in SK-N-MC cells. Furthermore, blocking the CREB pathway with C646 treatment attenuated the memory deficits and Aβ production in mice exposed to corticosterone. Thus, the role of CREB can vary depending on the level or consistency of the glucocorticoid, acting as an important regulator of memory function. Regarding the difference between blocking CREB and intracellular GR in amyloidogenesis, our results show that C646 attenuated the clinical signs and APP processing in mice given the corticosterone treatment or intracerebroventricular injection of Aβ more efficiently than RU 486 did. These discrepancies could be explained by the differences in acute versus chronic glucocorticoid exposure. With relatively short-term or adaptive stress, glucocorticoid elevates GR expression, which strengthens the synaptic function or increases neuron atrophy through signaling molecules, such as BACE1 expression (de Kloet et al., 2005; Roozendaal et al., 2010). It was also determined that subchronic GR inhibition with RU 486 recovered early episodic memory deficits (Lanté et al., 2015). Thus, we cannot exclude the genomic pathway of glucocorticoid if intracellular GR level remains unchanged with mild elevation of glucocorticoid or Aβ deposition, suggesting that RU 486 may be an appropriate drug for the early stage of AD. However, our results demonstrated that long-term glucocorticoid treatment depressed intracellular GR signaling and may preferentially depend on the nongenomic pathway through CREB activation. Given the unexpected observations in this study, this raises the possibility that regulating CREB could modulate the detrimental effect of glucocorticoid, especially more strongly in AD pathology rather than blocking the genomic pathway with RU 486 upon chronic stress.
Overall, the results of this study show that cortisol-BSA can increase Aβ production by reorganization of lipid raft, which leads to mGR-Gαs coupling and the subsequent phosphorylation of CREB in SK-N-MC cells. Furthermore, we also show that corticosterone can accelerate AD pathology in mouse models despite intracellular GR depletion and be efficiently inhibited by blocking the CREB pathway. Thus, the novel nongenomic signaling pathways of glucocorticoid in the animal model and SK-N-MC cells can provide potential therapeutic targets that enable a more selective, strategic modulation of AD (Fig. 8).
Figure 8.

A hypothetical model for induced BACE1 expression and Aβ production by the nongenomic action of glucocorticoid. Aβ downregulates cytosolic GR but elevates mGR in hippocampus of mice. Cortisol-BSA recruits mGR from the nonlipid raft region and Gαs into the lipid raft. Subsequently, cAMP-PKA-CREB axis is activated. Phosphorylated CREB by cortisol-BSA translocates into nucleus and binds to BACE1 promoter. Increased expression of BACE1 then induces APP cleavage to produce Aβ.
Footnotes
This work was supported by National R&D Program through the National Research Foundation of Korea funded by the Ministry of Science, ICT, and Future Planning NRF-2013M3A9B4076541. The funders had no role in study design, data collection or analysis, the decision to publish, or manuscript preparation.
The authors declare no competing financial interests.
References
- Agrawal SM, Silva C, Wang J, Tong JP, Yong VW (2012) A novel anti-EMMPRIN function-blocking antibody reduces T cell proliferation and neurotoxicity: relevance to multiple sclerosis. J Neuroinflammation 9:64. 10.1186/1742-2094-9-64 [DOI] [PMC free article] [PubMed] [Google Scholar]
- Arqué G, Fotaki V, Fernández D, Martínez de Lagrán M, Arbonés ML, Dierssen M (2008) Impaired spatial learning strategies and novel object recognition in mice haploinsufficient for the dual specificity tyrosine-regulated kinase-1A (Dyrk1A). PLoS One 3:e2575. 10.1371/journal.pone.0002575 [DOI] [PMC free article] [PubMed] [Google Scholar]
- Baruch K, Rosenzweig N, Kertser A, Deczkowska A, Sharif AM, Spinrad A, Tsitsou-Kampeli A, Sarel A, Cahalon L, Schwartz M (2015) Breaking immune tolerance by targeting Foxp3+ regulatory T cells mitigates Alzheimer's disease pathology. Nat Commun 6:7967. 10.1038/ncomms8967 [DOI] [PMC free article] [PubMed] [Google Scholar]
- Bellamy D, Phillips JG, Jones IC, Leonard RA (1962) The uptake of cortisol by rat tissues. Biochem J 85:537–545. 10.1042/bj0850537 [DOI] [PMC free article] [PubMed] [Google Scholar]
- Benito E, Barco A (2010) CREB's control of intrinsic and synaptic plasticity: implications for CREB-dependent memory models. Trends Neurosci 33:230–240. 10.1016/j.tins.2010.02.001 [DOI] [PubMed] [Google Scholar]
- Bevins RA, Besheer J (2006) Object recognition in rats and mice: a one-trial non-matching-to-sample learning task to study ‘recognition memory.’ Nat Protoc 1:1306–1311. 10.1038/nprot.2006.205 [DOI] [PubMed] [Google Scholar]
- Bockmühl Y, Patchev AV, Madejska A, Hoffmann A, Sousa JC, Sousa N, Holsboer F, Almeida OF, Spengler D (2015) Methylation at the CpG island shore region upregulates Nr3c1 promoter activity after early-life stress. Epigenetics 10:247–257. 10.1080/15592294.2015.1017199 [DOI] [PMC free article] [PubMed] [Google Scholar]
- Buttgereit F, Straub RH, Wehling M, Burmester GR (2004) Glucocorticoids in the treatment of rheumatic diseases: an update on the mechanisms of action. Arthritis Rheum 50:3408–3417. 10.1002/art.20583 [DOI] [PubMed] [Google Scholar]
- Catania C, Sotiropoulos I, Silva R, Onofri C, Breen KC, Sousa N, Almeida OF (2009) The amyloidogenic potential and behavioral correlates of stress. Mol Psychiatry 14:95–105. 10.1038/sj.mp.4002101 [DOI] [PubMed] [Google Scholar]
- Chen DY, Bambah-Mukku D, Pollonini G, Alberini CM (2012) Glucocorticoid receptors recruit the CaMKIIα-BDNF-CREB pathways to mediate memory consolidation. Nat Neurosci 15:1707–1714. 10.1038/nn.3266 [DOI] [PMC free article] [PubMed] [Google Scholar]
- Chen YZ, Qiu J (2001) Possible genomic consequence of nongenomic action of glucocorticoids in neural cells. Physiology 16:292–296. [DOI] [PubMed] [Google Scholar]
- Chia R, Achilli F, Festing MF, Fisher EM (2005) The origins and uses of mouse outbred stocks. Nat Genet 37:1181–1186. 10.1038/ng1665 [DOI] [PubMed] [Google Scholar]
- Chini B, Parenti M (2004) G-protein coupled receptors in lipid rafts and caveolae: how, when and why do they go there? J Mol Endocrinol 32:325–338. 10.1677/jme.0.0320325 [DOI] [PubMed] [Google Scholar]
- Cho SM, Kim HV, Lee S, Kim HY, Kim W, Kim TS, Kim DJ, Kim Y (2014) Correlations of amyloid-β concentrations between CSF and plasma in acute Alzheimer mouse model. Sci Rep 4:6777. 10.1038/srep06777 [DOI] [PMC free article] [PubMed] [Google Scholar]
- Cole SL, Vassar R (2007) The Alzheimer's disease beta-secretase enzyme, BACE1. Mol Neurodegener 2:22. 10.1186/1750-1326-2-22 [DOI] [PMC free article] [PubMed] [Google Scholar]
- Cordy JM, Hooper NM, Turner AJ (2006) The involvement of lipid rafts in Alzheimer's disease. Mol Membr Biol 23:111–122. 10.1080/09687860500496417 [DOI] [PubMed] [Google Scholar]
- Croxtall JD, van Hal PT, Choudhury Q, Gilroy DW, Flower RJ (2002) Different glucocorticoids vary in their genomic and non-genomic mechanism of action in A549 cells. Br J Pharmacol 135:511–519. 10.1038/sj.bjp.0704474 [DOI] [PMC free article] [PubMed] [Google Scholar]
- de Kloet ER. (2014) From receptor balance to rational glucocorticoid therapy. Endocrinology 155:2754–2769. 10.1210/en.2014-1048 [DOI] [PubMed] [Google Scholar]
- de Kloet ER, Joëls M, Holsboer F (2005) Stress and the brain: from adaptation to disease. Nat Rev Neurosci 6:463–475. 10.1038/nrn1683 [DOI] [PubMed] [Google Scholar]
- Di S, Tasker JG (2008) Rapid synapse-specific regulation of hypothalamic magnocellular neurons by glucocorticoids. Prog Brain Res 170:379–388. 10.1016/S0079-6123(08)00431-7 [DOI] [PubMed] [Google Scholar]
- Di S, Malcher-Lopes R, Halmos KC, Tasker JG (2003) Nongenomic glucocorticoid inhibition via endocannabinoid release in the hypothalamus: a fast feedback mechanism. J Neurosci 23:4850–4857. [DOI] [PMC free article] [PubMed] [Google Scholar]
- Di Paolo G, Kim TW (2011) Linking lipids to Alzheimer's disease: cholesterol and beyond. Nat Rev Neurosci 12:284–296. 10.1038/nrn3012 [DOI] [PMC free article] [PubMed] [Google Scholar]
- Donovan J, Brown P (2006) Blood collection. Curr Protoc Neurosci Appendix 4, Appendix 4G. 10.1002/0471142301.nsa04gs33 [DOI] [PubMed] [Google Scholar]
- Elgh E, Lindqvist Astot A, Fagerlund M, Eriksson S, Olsson T, Näsman B (2006) Cognitive dysfunction, hippocampal atrophy and glucocorticoid feedback in Alzheimer's disease. Biol Psychiatry 59:155–161. 10.1016/j.biopsych.2005.06.017 [DOI] [PubMed] [Google Scholar]
- Escribano L, Simón AM, Pérez-Mediavilla A, Salazar-Colocho P, Del Río J, Frechilla D (2009) Rosiglitazone reverses memory decline and hippocampal glucocorticoid receptor down-regulation in an Alzheimer's disease mouse model. Biochem Biophys Res Commun 379:406–410. 10.1016/j.bbrc.2008.12.071 [DOI] [PubMed] [Google Scholar]
- ffrench-Mullen J. (1995) Cortisol inhibition of calcium currents in guinea pig hippocampal CA1 neurons via G-protein-coupled activation of protein kinase C. J Neurosci 15:903–911. [DOI] [PMC free article] [PubMed] [Google Scholar]
- Fu SP, Wang W, Liu BR, Yang HM, Ji H, Yang ZQ, Guo B, Liu JX, Wang JF (2015) β-Hydroxybutyric sodium salt inhibition of growth hormone and prolactin secretion via the cAMP/PKA/CREB and AMPK signaling pathways in dairy cow anterior pituitary cells. Int J Mol Sci 16:4265–4280. 10.3390/ijms16024265 [DOI] [PMC free article] [PubMed] [Google Scholar]
- Furay AR, Bruestle AE, Herman JP (2008) The role of the forebrain glucocorticoid receptor in acute and chronic stress. Endocrinology 149:5482–5490. 10.1210/en.2008-0642 [DOI] [PMC free article] [PubMed] [Google Scholar]
- Galbiati F, Razani B, Lisanti MP (2001) Emerging themes in lipid rafts and caveolae. Cell 106:403–411. 10.1016/S0092-8674(01)00472-X [DOI] [PubMed] [Google Scholar]
- Gametchu B, Watson CS, Wu S (1993) Use of receptor antibodies to demonstrate membrane glucocorticoid receptor in cells from human leukemic patients. FASEB J 7:1283–1292. [DOI] [PubMed] [Google Scholar]
- Green KN, Billings LM, Roozendaal B, McGaugh JL, LaFerla FM (2006) Glucocorticoids increase amyloid-β and tau pathology in a mouse model of Alzheimer's disease. J Neurosci 26:9047–9056. 10.1523/JNEUROSCI.2797-06.2006 [DOI] [PMC free article] [PubMed] [Google Scholar]
- Green PS, Gridley KE, Simpkins JW (1996) Estradiol protects against β-amyloid (25–35)-induced toxicity in SK-N-SH human neuroblastoma cells. Neurosci Lett 218:165–168. 10.1016/S0304-3940(96)13148-7 [DOI] [PubMed] [Google Scholar]
- Groeneweg FL, Karst H, de Kloet ER, Joëls M (2011) Rapid non-genomic effects of corticosteroids and their role in the central stress response. J Endocrinol 209:153–167. 10.1530/JOE-10-0472 [DOI] [PubMed] [Google Scholar]
- Hafezi-Moghadam A, Simoncini T, Yang Z, Limbourg FP, Plumier JC, Rebsamen MC, Hsieh CM, Chui DS, Thomas KL, Prorock AJ, Laubach VE, Moskowitz MA, French BA, Ley K, Liao JK (2002) Acute cardiovascular protective effects of corticosteroids are mediated by non-transcriptional activation of endothelial nitric oxide synthase. Nat Med 8:473–479. 10.1038/nm0502-473 [DOI] [PMC free article] [PubMed] [Google Scholar]
- Han F, Ding J, Shi Y (2014) Expression of amygdala mineralocorticoid receptor and glucocorticoid receptor in the single-prolonged stress rats. BMC Neurosci 15:77. 10.1186/1471-2202-15-77 [DOI] [PMC free article] [PubMed] [Google Scholar]
- Hartmann A, Veldhuis JD, Deuschle M, Standhardt H, Heuser I (1997) Twenty-four hour cortisol release profiles in patients with Alzheimer's and Parkinson's disease compared to normal controls: ultradian secretory pulsatility and diurnal variation. Neurobiol Aging 18:285–289. 10.1016/S0197-4580(97)80309-0 [DOI] [PubMed] [Google Scholar]
- Insel PA, Head BP, Ostrom RS, Patel HH, Swaney JS, Tang CM, Roth DM (2005) Caveolae and lipid rafts: G protein-coupled receptor signaling microdomains in cardiac myocytes. Ann N Y Acad Sci 1047:166–172. 10.1196/annals.1341.015 [DOI] [PubMed] [Google Scholar]
- Jeong YH, Park CH, Yoo J, Shin KY, Ahn SM, Kim HS, Lee SH, Emson PC, Suh YH (2006) Chronic stress accelerates learning and memory impairments and increases amyloid deposition in APPV717I-CT100 transgenic mice, an Alzheimer's disease model. FASEB J 20:729–731. 10.1096/fj.05-4265fje [DOI] [PubMed] [Google Scholar]
- Kang JE, Cirrito JR, Dong H, Csernansky JG, Holtzman DM (2007) Acute stress increases interstitial fluid amyloid-β via corticotropin-releasing factor and neuronal activity. Proc Natl Acad Sci U S A 104:10673–10678. 10.1073/pnas.0700148104 [DOI] [PMC free article] [PubMed] [Google Scholar]
- Karst H, Berger S, Erdmann G, Schütz G, Joëls M (2010) Metaplasticity of amygdalar responses to the stress hormone corticosterone. Proc Natl Acad Sci U S A 107:14449–14454. 10.1073/pnas.0914381107 [DOI] [PMC free article] [PubMed] [Google Scholar]
- Kim HY, Lee DK, Chung BR, Kim HV, Kim Y (2016) Intracerebroventricular injection of amyloid-β peptides in normal mice to acutely induce Alzheimer-like cognitive deficits. J Vis Exp 109:e53308. 10.3791/53308 [DOI] [PMC free article] [PubMed] [Google Scholar]
- Lanté F, Chafai M, Raymond EF, Pereira AR, Mouska X, Kootar S, Barik J, Bethus I, Marie H (2015) Subchronic glucocorticoid receptor inhibition rescues early episodic memory and synaptic plasticity deficits in a mouse model of Alzheimer's disease. Neuropsychopharmacology 40:1772–1781. 10.1038/npp.2015.25 [DOI] [PMC free article] [PubMed] [Google Scholar]
- Lecanu L, Papadopoulos V (2013) Modeling Alzheimer's disease with non-transgenic rat models. Alzheimers Res Ther 5:17. 10.1186/alzrt171 [DOI] [PMC free article] [PubMed] [Google Scholar]
- Leger M, Quiedeville A, Bouet V, Haelewyn B, Boulouard M, Schumann-Bard P, Freret T (2013) Object recognition test in mice. Nat Protoc 8:2531–2537. 10.1038/nprot.2013.155 [DOI] [PubMed] [Google Scholar]
- Liposits Z, Bohn MC (1993) Association of glucocorticoid receptor immunoreactivity with cell membrane and transport vesicles in hippocampal and hypothalamic neurons of the rat. J Neurosci Res 35:14–19. 10.1002/jnr.490350103 [DOI] [PubMed] [Google Scholar]
- Marin R, Rojo JA, Fabelo N, Fernandez CE, Diaz M (2013) Lipid raft disarrangement as a result of neuropathological progresses: a novel strategy for early diagnosis? Neuroscience 245:26–39. 10.1016/j.neuroscience.2013.04.025 [DOI] [PubMed] [Google Scholar]
- Martín V, Fabelo N, Santpere G, Puig B, Marín R, Ferrer I, Díaz M (2010) Lipid alterations in lipid rafts from Alzheimer's disease human brain cortex. J Alzheimers Dis 19:489–502. 10.3233/JAD-2010-1242 [DOI] [PubMed] [Google Scholar]
- Matthews L, Berry A, Ohanian V, Ohanian J, Garside H, Ray D (2008) Caveolin mediates rapid glucocorticoid effects and couples glucocorticoid action to the antiproliferative program. Mol Endocrinol 22:1320–1330. 10.1210/me.2007-0154 [DOI] [PMC free article] [PubMed] [Google Scholar]
- Miller GE, Chen E, Sze J, Marin T, Arevalo JM, Doll R, Ma R, Cole SW (2008) A functional genomic fingerprint of chronic stress in humans: blunted glucocorticoid and increased NF-κB signaling. Biol Psychiatry 64:266–272. 10.1016/j.biopsych.2008.03.017 [DOI] [PMC free article] [PubMed] [Google Scholar]
- Mitre-Aguilar IB, Cabrera-Quintero AJ, Zentella-Dehesa A (2015) Genomic and non-genomic effects of glucocorticoids: implications for breast cancer. Int J Clin Exp Pathol 8:1. [PMC free article] [PubMed] [Google Scholar]
- Notarianni E. (2013) Hypercortisolemia and glucocorticoid receptor-signaling insufficiency in Alzheimer's disease initiation and development. Curr Alzheimer Res 10:714–731. 10.2174/15672050113109990137 [DOI] [PubMed] [Google Scholar]
- Nunan J, Shearman MS, Checler F, Cappai R, Evin G, Beyreuther K, Masters CL, Small DH (2001) The C-terminal fragment of the Alzheimer's disease amyloid protein precursor is degraded by a proteasome-dependent mechanism distinct from γ-secretase. Eur J Biochem 268:5329–5336. 10.1046/j.0014-2956.2001.02465.x [DOI] [PubMed] [Google Scholar]
- Orchinik M, Murray TF, Moore FL (1991) A corticosteroid receptor in neuronal membranes. Science 252:1848–1851. 10.1126/science.2063198 [DOI] [PubMed] [Google Scholar]
- Orchinik M, Murray TF, Franklin PH, Moore FL (1992) Guanyl nucleotides modulate binding to steroid receptors in neuronal membranes. Proc Natl Acad Sci U S A 89:3830–3834. 10.1073/pnas.89.9.3830 [DOI] [PMC free article] [PubMed] [Google Scholar]
- Ostrom RS, Insel PA (2004) The evolving role of lipid rafts and caveolae in G protein-coupled receptor signaling: Implications for molecular pharmacology. Br J Pharmacol 143:235–245. 10.1038/sj.bjp.0705930 [DOI] [PMC free article] [PubMed] [Google Scholar]
- Park HJ, Ran Y, Jung JI, Holmes O, Price AR, Smithson L, Ceballos-Diaz C, Han C, Wolfe MS, Daaka Y, Ryabinin AE, Kim SH, Hauger RL, Golde TE, Felsenstein KM (2015) The stress response neuropeptide CRF increases amyloid-β production by regulating γ-secretase activity. EMBO J 34:1674–1686. 10.15252/embj.201488795 [DOI] [PMC free article] [PubMed] [Google Scholar]
- Park S, Taub M, Han H (2001) Regulation of phosphate uptake in primary cultured rabbit renal proximal tubule cells by glucocorticoids: evidence for nongenomic as well as genomic mechanisms 1. Endocrinology 142:710–720. 10.1210/endo.142.2.7934 [DOI] [PubMed] [Google Scholar]
- Pérez MH, Cormack J, Mallinson D, Mutungi G (2013) A membrane glucocorticoid receptor mediates the rapid/non-genomic actions of glucocorticoids in mammalian skeletal muscle fibres. J Physiol 591:5171–5185. 10.1113/jphysiol.2013.256586 [DOI] [PMC free article] [PubMed] [Google Scholar]
- Qi AQ, Qiu J, Xiao L, Chen YZ (2005) Rapid activation of JNK and p38 by glucocorticoids in primary cultured hippocampal cells. J Neurosci Res 80:510–517. 10.1002/jnr.20491 [DOI] [PubMed] [Google Scholar]
- Rainville J, Pollard K, Vasudevan N (2015) Membrane-initiated non-genomic signaling by estrogens in the hypothalamus: cross-talk with glucocorticoids with implications for behavior. Front Endocrinol 6:18. 10.3389/fendo.2015.00018 [DOI] [PMC free article] [PubMed] [Google Scholar]
- Rao GS, Schulze-Hagen K, Rao ML, Breuer H (1976) Kinetics of steroid transport through cell membranes: comparison of the uptake of cortisol by isolated rat liver cells with binding of cortisol to rat liver cytosol. J Steroid Biochem 7:1123–1129. 10.1016/0022-4731(76)90043-1 [DOI] [PubMed] [Google Scholar]
- Roozendaal B, Hernandez A, Cabrera SM, Hagewoud R, Malvaez M, Stefanko DP, Haettig J, Wood MA (2010) Membrane-associated glucocorticoid activity is necessary for modulation of long-term memory via chromatin modification. J Neurosci 30:5037–5046. 10.1523/JNEUROSCI.5717-09.2010 [DOI] [PMC free article] [PubMed] [Google Scholar]
- Samarasinghe RA, Di Maio R, Volonte D, Galbiati F, Lewis M, Romero G, DeFranco DB (2011) Nongenomic glucocorticoid receptor action regulates gap junction intercellular communication and neural progenitor cell proliferation. Proc Natl Acad Sci U S A 108:16657–16662. 10.1073/pnas.1102821108 [DOI] [PMC free article] [PubMed] [Google Scholar]
- Sambamurti K, Kinsey R, Maloney B, Ge YW, Lahiri DK (2004) Gene structure and organization of the human β-secretase (BACE) promoter. FASEB J 18:1034–1036. 10.1096/fj.03-1378fje [DOI] [PubMed] [Google Scholar]
- Shi J, Dong Y, Cui MZ, Xu X (2013) Lysophosphatidic acid induces increased BACE1 expression and Aβ formation. Biochim Biophys Acta 1832:29–38. 10.1016/j.bbadis.2012.09.010 [DOI] [PMC free article] [PubMed] [Google Scholar]
- Simons K, Ehehalt R (2002) Cholesterol, lipid rafts, and disease. J Clin Invest 110:597–603. 10.1172/JCI0216390 [DOI] [PMC free article] [PubMed] [Google Scholar]
- Stahn C, Buttgereit F (2008) Genomic and nongenomic effects of glucocorticoids. Nat Clin Pract Rheumatol 4:525–533. 10.1038/ncprheum0898 [DOI] [PubMed] [Google Scholar]
- Stepanichev MY, Moiseeva YV, Lazareva NA, Onufriev MV, Gulyaeva NV (2003) Single intracerebroventricular administration of amyloid-beta (25–35) peptide induces impairment in short-term rather than long-term memory in rats. Brain Res Bull 61:197–205. 10.1016/S0361-9230(03)00118-7 [DOI] [PubMed] [Google Scholar]
- Tasker JG, Di S, Malcher-Lopes R (2006) Rapid glucocorticoid signaling via membrane-associated receptors. Endocrinology 147:5549–5556. 10.1210/en.2006-0981 [DOI] [PMC free article] [PubMed] [Google Scholar]
- Urbach V, Verriere V, Grumbach Y, Bousquet J, Harvey BJ (2006) Rapid anti-secretory effects of glucocorticoids in human airway epithelium. Steroids 71:323–328. 10.1016/j.steroids.2005.09.014 [DOI] [PubMed] [Google Scholar]
- Vaux DL. (2012) Research methods: know when your numbers are significant. Nature 492:180–181. 10.1038/492180a [DOI] [PubMed] [Google Scholar]
- Vernocchi S, Battello N, Schmitz S, Revets D, Billing AM, Turner JD, Muller CP (2013) Membrane glucocorticoid receptor activation induces proteomic changes aligning with classical glucocorticoid effects. Mol Cell Proteomics 12:1764–1779. 10.1074/mcp.M112.022947 [DOI] [PMC free article] [PubMed] [Google Scholar]
- Wang JC, Derynck MK, Nonaka DF, Khodabakhsh DB, Haqq C, Yamamoto KR (2004) Chromatin immunoprecipitation (ChIP) scanning identifies primary glucocorticoid receptor target genes. Proc Natl Acad Sci U S A 101:15603–15608. 10.1073/pnas.0407008101 [DOI] [PMC free article] [PubMed] [Google Scholar]
- Weinmann AS, Farnham PJ (2002) Identification of unknown target genes of human transcription factors using chromatin immunoprecipitation. Methods 26:37–47. 10.1016/S1046-2023(02)00006-3 [DOI] [PubMed] [Google Scholar]
- Xiao L, Feng C, Chen Y (2010) Glucocorticoid rapidly enhances NMDA-evoked neurotoxicity by attenuating the NR2A-containing NMDA receptor-mediated ERK1/2 activation. Mol Endocrinol 24:497–510. 10.1210/me.2009-0422 [DOI] [PMC free article] [PubMed] [Google Scholar]
- Yan R, Bienkowski MJ, Shuck ME, Miao H, Tory MC, Pauley AM, Brashier JR, Stratman NC, Mathews WR, Buhl AE, Carter DB, Tomasselli AG, Parodi LA, Heinrikson RL, Gurney ME (1999) Membrane-anchored aspartyl protease with Alzheimer's disease β-secretase activity. Nature 402:533–537. 10.1038/990107 [DOI] [PubMed] [Google Scholar]