Abstract
Cephalopods in nature undergo highly dynamic skin coloration changes that allow rapid camouflage and intraspecies communication. The optic lobe is thought to play a key role in controlling the expansion of the chromatophores that generate these diverse body patterns. However, the functional organization of the optic lobe and neural control of the various body patterns by the optic lobe are largely unknown. We applied electrical stimulation within the optic lobe to investigate the neural basis of body patterning in the oval squid, Sepioteuthis lessoniana. Most areas in the optic lobe mediated predominately ipsilateral expansion of chromatophores present on the mantle, but not on the head and arms; furthermore, the expanded areas after electrical stimulation were positively correlated with an increase in stimulating voltage and stimulation depth. These results suggest a unilaterally dominant and vertically converged organization of the optic lobe. Furthermore, analyzing 14 of the elicited body pattern components and their corresponding stimulation sites revealed that the same components can be elicited by stimulating different parts of the optic lobe and that various subsets of these components can be coactivated by stimulating the same area. These findings suggest that many body pattern components may have multiple motor units in the optic lobe and that these are organized in a mosaic manner. The multiplicity associated with the nature of the neural controls of these components in the cephalopod brain thus reflects the versatility of the individual components during the generation of diverse body patterns.
SIGNIFICANCE STATEMENT Neural control of the dynamic body patterning of cephalopods for camouflage and intraspecies communication is a fascinating research topic. Previous studies have shown that the optic lobe is the motor command center for dynamic body patterning. However, little is known about its neural organization and the mechanisms underlying its control of body pattern generation. By electrically stimulating the optic lobe of the oval squids and observing their body pattern changes, surprisingly, we found that there is no somatotopic organization of motor units. Instead, many of these components have multiple motor units within the optic lobe and are organized in a mosaic manner. The present work reveals a novel neural control of dynamic body patterning for communication in cephalopods.
Keywords: chromatophores, dynamic skin coloration, electrical stimulation, motor units, oval squids
Introduction
Cephalopods (octopus, squid, and cuttlefish) are a unique group of animals. Their visual system and brain organization are the most sophisticated among all invertebrates (Nixon and Young, 2003). Their dynamic color changes, which are used for camouflage and intraspecies communication, are an unparalleled feature of the cephalopods (Hanlon and Messenger, 1996). These changes are the result of a special sensorimotor system that is able to change the animal's skin coloration quickly via neural control of numerous chromatophore organs within the dermis. Each chromatophore organ is composed of an elastic sacculus that contains pigment granules and is surrounded by radial muscles (Cloney and Florey, 1968). Expansion and contraction of the chromatophore organ is thus mediated by these radial muscles, which are in turn controlled by motor neurons running directly from the chromatophore lobe in the brain without any synapses (Messenger, 2001).
Neural control of the dynamic body patterning of cephalopods is organized hierarchically via a set of lobes within the brain: the optic lobes, lateral basal lobes, and anterior/posterior chromatophore lobes (Williamson and Chrachri, 2004). At the highest level, the optic lobes select specific motor commands such as body pattern or locomotion, which are largely based on visual input from the eyes. At the intermediate control centers within the lateral basal lobes, there are abundant projections from the optic lobes and large fiber tracts connecting to the downstream lower motor centers, the anterior and posterior chromatophore lobes (Boycott, 1961; Young, 1971; Young, 1974). Finally, each chromatophore organ is innervated by more than one motor neuron from a chromatophore lobe and one motor neuron controls multiple chromatophore organs (Dubas and Boyle, 1985).
The optic lobes are large, complex structures, each taking up one-third of the total brain volume (Young, 1974) and they have a variety of functions. The outer cortex, also called the deep retina (Cajal, 1917), contains visual analyzing systems that process the input from the retina itself (Young, 1971). The central medulla is not only a visual memory store, but also a higher motor center (Boycott, 1961; Young, 1971; Young, 1974). Cell bodies in the medulla are clumped together into characteristic “cell islands” that are surrounded by neuropil and there is no obvious histological differentiation within the medulla (Young, 1962). The visual inputs to the cell islands are feature detectors akin to those seen in the mammalian visual cortex (Breidbach and Kutsch, 1995). In cuttlefish, direct electrical stimulation in the medulla evoked various body patterns unilaterally or bilaterally, but stimulating the lateral basal lobes and chromatophore lobes only elicited a uniform darkening, either ipsilaterally or bilaterally (Boycott, 1961). In addition, electrical stimulation in the medulla also produced various types of locomotive behavior (Chichery and Chanelet, 1976, 1978). These experiments are consistent with the hierarchical connections found in the cephalopod brain and suggest that the medulla of the optic lobe is the motor command center for dynamic body patterning.
Despite our overall understanding of optic lobe structure and function, little is known about its neural organization and the mechanisms underlying its control of body pattern generation. The aim of the present study was to examine the spatial distribution of motor units that control the expression of body pattern components by electrically stimulating various areas in the optic lobe of the oval squids Sepioteuthis lessoniana. Surprisingly, there is no somatotopic organization of motor units in the optic lobe. Instead, it was found that same components can be elicited by stimulating different parts of the optic lobe and subsets of these components are able to be coactivated by stimulating the same area. It is likely that many body pattern components are controlled by multiple motor units and they are organized in the optic lobe in a mosaic manner.
Materials and Methods
Animals.
Young adult oval squids (Sepioteuthis lessoniana, mantle length 4–12 cm) of either sex were collected by a handheld fishing net from the waters off the northeast coast of Taiwan. All animals were maintained in the laboratory using two closed-circulation aquarium systems (700 L each; water temperature, ∼22–24°C). The room was kept on a 12 h/12 h light/dark cycle. Before experimentation started, the squids were anesthetized with magnesium chloride (MgCl2, 100 mm) in cold seawater (15–20°C). Once animals ceased movement and their skins turned pale (Mooney et al., 2010; Gleadall, 2013), they were transferred to a container supplied with circulating oxygenated cold seawater (10–15°C) at a reduced MgCl2 concentration (50 mm) that allowed prolonging sedation during electrical stimulation. To ensure that the squids were mildly anesthetized throughout the experiment, the animal's respiration rate, baseline behavior, and coloration pattern were assessed continuously. This method has been demonstrated to anesthetize the longfin squid (Doryteuthis pealeii) noninvasively for up to 5 h and has no apparent effect on physiological evoked potentials recorded from nerve bundles within the statocyst system (Mooney et al., 2010). For collecting the brain samples for histological analysis, the animals were not allowed to recover from anesthesia and were euthanatized by overdose of MgCl2. All work was performed in accordance with the National Tsing Hua University guidelines and all procedures were approved by the institutional animal care and use committee.
Electrical stimulation.
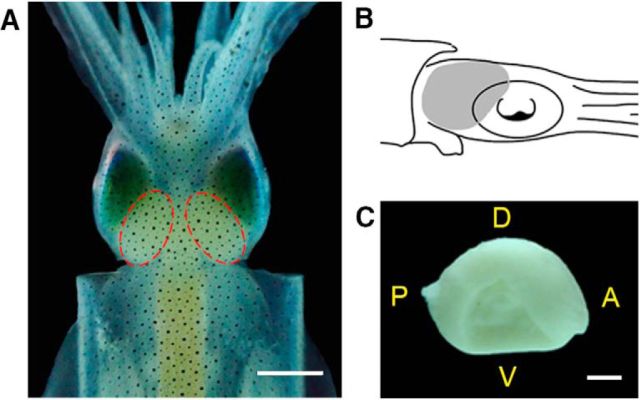
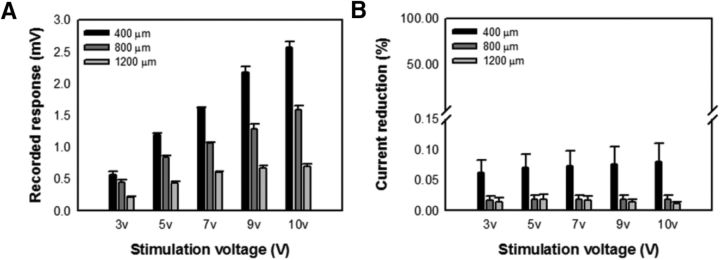
Oval squids are transparent, so we could access the optic lobe very precisely without any surgery (Fig. 1). To stimulate the medulla of the optic lobe efficiently, a bipolar electrode was used to provide electrical stimulation. Either a custom-made electrode with a pair of coated tungsten wires (diameter, 50 μm) in a 27-gauge needle as a cannula or a commercial tungsten concentric electrode (MicroProbes) was used in the present study (impendence 3–4 MΩ). A stereotaxic device (Stoelting) was used to assist in the insertion of the electrode and to map the stimulation sites with greater precision. Similar to the protocol described in Boycott (1961), electrical stimulation was for 10 s using 60 Hz pulses (3 ms) at 3–10 V and was delivered by an isolated pulse stimulator (AM2100; A-M Systems). This 10 s stimulation provided us with sufficient time to study temporal dynamics of chromatophore expansion and interaction of body pattern components. The minimum amount of stimulation voltage needed to elicit a detectable skin response was 3 V (or ∼1 μA) in the present study. To ensure that the electrical stimulation was confined to a small area, the current spreading was examined by measuring voltage drop at various distances from the stimulation site and showed that the electrical stimulation with the bipolar electrode was indeed localized (Fig. 2). These tests also demonstrated that the maximal stimulation voltage of 10 V (∼3 μA) would not spread beyond a few tens of microns, and the likelihood of evoked skin responses was increased by stimulating a restricted area in the optic lobe. Either a LED light or an audio device was used to signal when the electrical stimulation was turned on and off; furthermore, a digital video camera (W100; Sony) was mounted above to record the dynamic changes of body patterns that occurred. After each successful electrical stimulation, the stimulation site was marked by electrocoagulation with 1 mA current for 20 s (Chichery and Chanelet, 1976) and the optic lobe was isolated for histological analysis.
Figure 1.
The optic lobe of the oval squid, S. lessoniana. A, Live specimen. Dashed outlines depict a pair of optic lobes located behind the eyes. B, Schematic diagram showing the position of the optic lobe (gray area) relative to the eye in the lateral view of the oval squid. C, Dissected left optic lobe showing the medial view of the optic lobe, where the site of the optic tract can be seen (dented area). A, Anterior; P, posterior; D, dorsal; V, ventral. Scale bars: A, 1 cm; C, 0.5 cm.
Figure 2.
Electrical stimulation in the medulla of the optic lobe is localized. A, Recorded voltage responses decreased significantly as the distance from the stimulation site increased (400, 800, and 1200 μm) for various stimulation voltages used in the present study. B, Stimulating current was significantly reduced at the site 400 μm away from the stimulation site for various stimulation voltages (400 μm, n = 16; 800 μm, n = 16, 1200 μm, n = 4). Error bars indicate SEM.
Histological analysis.
All isolated optic lobes were fixed with 10% formaldehyde in seawater for 3 d and then transferred to 70% ethanol for further processing. To identify the stimulation site in the medulla, the optic lobe was cryosectioned sequentially in the sagittal plane using a cryostat (Leica). The optic lobe slices (30 μm in thickness) were rinsed in 0.1 m phosphate buffer and mounted in glycerol for image acquisition using a stereomicroscope (Zeiss). These images were then used to map the stimulation sites in the 3D space of the optic lobe along three major axes: the anterior–posterior (A–P) axis, the medial–lateral (M–L) axis, and the depth axis. Note that the relative depth of electrical stimulation was normalized relative to the total depth of the medulla. In this context, due to the anatomical structure of the optic lobe, the total depth of the medulla was determined in two different ways depending upon the location in the optic lobe (Fig. 3).
Figure 3.
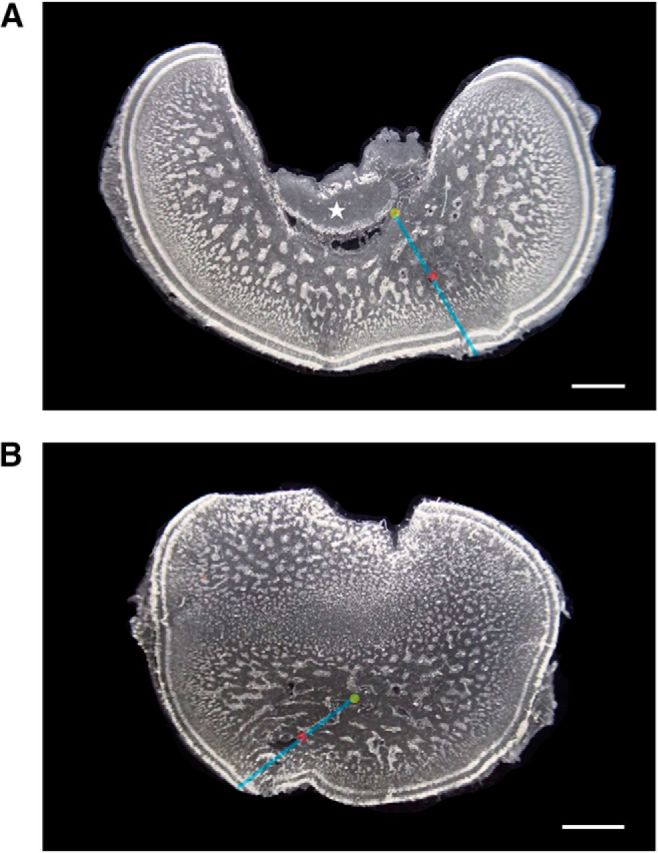
Depth of the electrical stimulation site in the optic lobe. Two parasagittal sections of the optic lobe are shown. A, Optic lobe near the medial side showing the optic tract (asterisk). B, Optic lobe near the lateral side. Both sections show clearly the cortex and medulla of the optic lobe. To calculate the relative depth of the stimulation site (red dot), the center of the medulla (yellow dot) was determined either using the inner border of the optic lobe as in A or using the central mass of the optic lobe as in B. Blue line perpendicular to the cortex of the optic lobe indicates the total depth. Relative depth of the stimulation site is thus defined as travel distance of the electrode from the cortex divided by the total depth. Note that the optic lobe in B apparently has two zones of cell islands and this is a result of concave surface of the optic lobe at the lateral side. Scale bar, 1000 μm.
Image analysis.
In the first set of image analysis, to quantify the body pattern change upon electrical stimulation in the optic lobe, two images from each video recording were acquired. One was the image frame immediately before the stimulus onset and the other was the image frame when the animal showed the maximum response during the 10 s stimulation. The maximum response was determined when the animal showed the largest chromatophore expression during electrical stimulation. To examine the chromatophore expansion in different parts of the body relative to the stimulation site, each image was further divided into six regions: the ipsilateral mantle, head, and arms, as well as the contralateral mantle, head, and arms. The increase in responsive area upon electrical stimulation in each region (i.e., the chromatophore expansion) was quantified by calculating the relative area increase the pixel values of which were above the threshold in the image after stimulation using ImageJ. The thresholds were set as a 10%, 20%, 30%, or 40% increase in pixel intensity relative to the mean intensity in the image before stimulation. In the present study, only the results with a 20% threshold are shown (i.e., pixels with an intensity that changed >20% were summed to give a total area), but the other thresholds showed a similar trend. To evaluate the lateralization of body pattern control by the optic lobe, a lateralization index was calculated by taking the normalized difference in increased responsive areas between ipsilateral and contralateral sides as follows: (ipsilateral − contralateral)/(ipsilateral + contralateral).
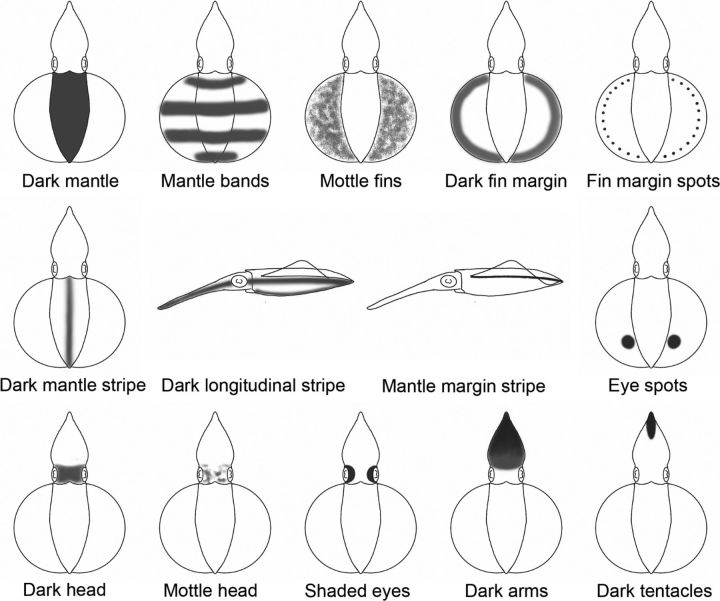
In the second set of image analysis, to further assess the expression of individual body pattern components upon electrical stimulation, we identified 14 distinct chromatic components in S. lessoniana based on numerous fields and laboratory images (Fig. 4). Some of these components are similar to the ones described in Sepioteuthis australis (Jantzen and Havenhand, 2003a, 2003b), but there are a few unique components in S. lessoniana (the ethogram and related data will be published separately). The expression level of these components was graded manually using images after stimulation. The grading scheme followed the one used in quantifying component expression in camouflaged cuttlefish (Mäthger et al., 2006). Each component was assigned one of number of grades: 0 (not expressed), 1 (weakly expressed), 2 (moderately expressed), and 3 (strongly expressed); the levels of expression were graded separately for the ipsilateral and contralateral sides.
Figure 4.
Body pattern components of the oval squid S. lessoniana. A total of 14 distinct body pattern components were observed in the present study and are shown in these drawings. Except for dark longitudinal stripe and mantle margin stripe, which are shown in a lateral view, all the other 12 components are shown in a dorsal view.
Statistical analysis.
All data were analyzed using t tests or using one-way repeated-measures ANOVA (SPSS) with Tukey post hoc analysis for pairwise comparisons.
Results
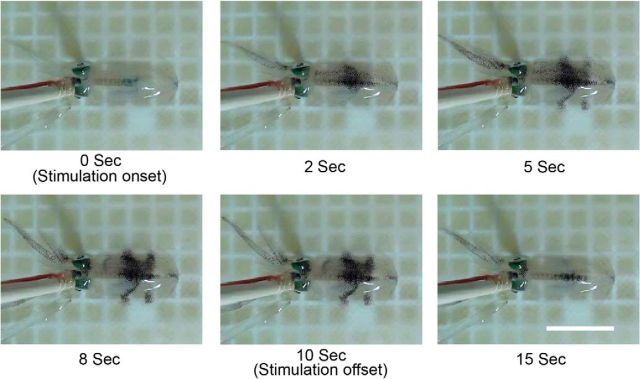
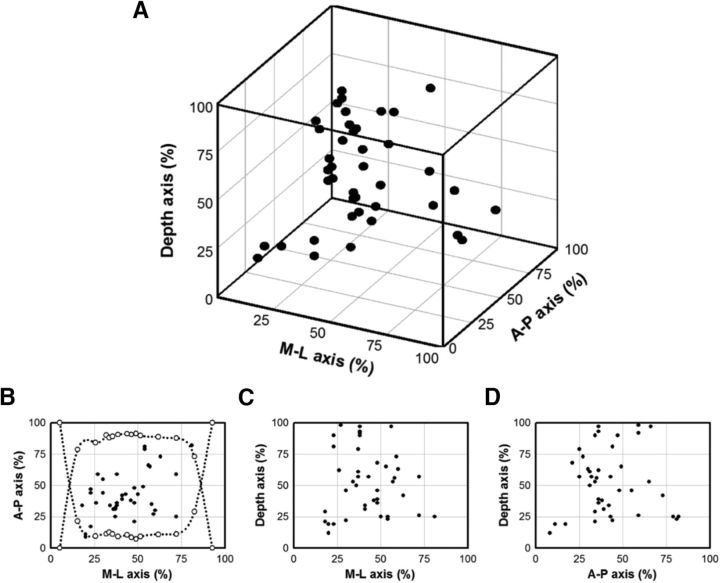
Expansion of chromatophores and expression of body pattern components were observed frequently when electrical stimulation was applied within the medulla of the optic lobe (Fig. 5). The speed of skin coloration change was often swift (i.e., within 1–3 s of electrical stimulation onset in these anesthetized animals) and some body pattern components were elicited faster than others (data not shown). However, not all stimulations with the same protocol elicited a skin coloration change. In >100 attempts at various locations in the optic lobe, only 65 stimulations from different animals had distinct evoked responses. Although the exact reason for these failed trials is not known, it is apparent that the optic lobe became less responsive to electrical stimulation when the normal circulation was reduced during prolonged anesthesia. These successful stimulation sites were distributed randomly in the optic lobe (Fig. 6). The maximal change in evoked responses and expression of individual body pattern components were analyzed along with their corresponded stimulation sites to investigate the neural organization of body pattern control within the optic lobe.
Figure 5.
Subset of body pattern components that are evoked by electrically stimulating the optic lobe of the oval squid. The time series images show the expression of four distinct body pattern components (mantle bands, dark mantle stripe, dark head, and dark arms) after the stimulation onset. Scale bar, 3 cm.
Figure 6.
Stimulation sites in the 3D space of the optic lobe. A, Total of 65 stimulation sites in the present study are shown along three major axes in the optic lobe, including the A–P, M–L, and depth. B–D, Projections of the 3D plot onto 3 2D planes. The dotted outline in B indicates the medulla area of the optic lobe that is accessible to the electrical stimulation. This was estimated by measuring the relative size of the medulla using a series of consecutive histological slices collected from the medial side to the lateral side.
Control of chromatophore expression in the optic lobe is ipsilaterally dominant and organized nonsomatotopically
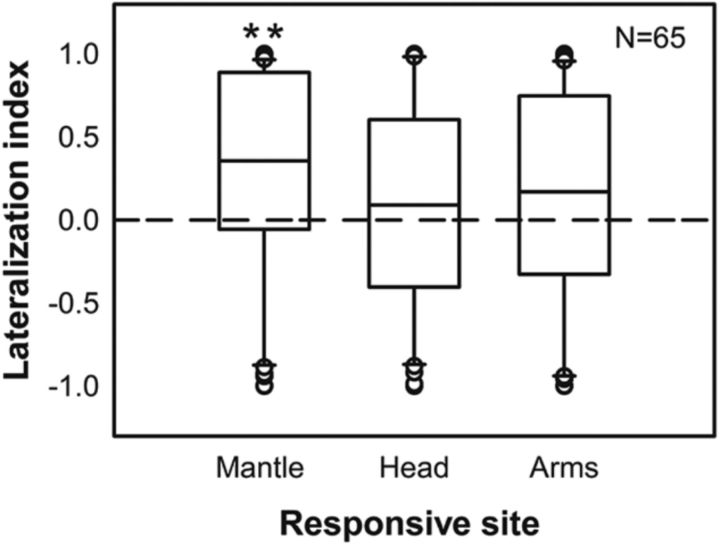
To determine whether chromatophore expression is controlled ipsilaterally or contralaterally in the optic lobe, the increased responsive areas (i.e., chromatophore expansion) upon electrical stimulation in the mantle, head, and arms were quantified and the lateralization indices were calculated. It is apparent that stimulating the optic lobe elicited more ipsilateral expression of chromatophores on the mantle than on the head and arms (Fig. 7). Although the majority of stimulations evoked more ipsilateral expansion of chromatophores on the mantle, there were some instances where there was contralateral and bilateral control. This was more evident when the responsive areas were the head and arms. Nevertheless, considering that the mantle makes up ∼80% of body area, the control of chromatophore expression in the optic lobe remains ipsilaterally dominant.
Figure 7.
Stimulation of the optic lobe elicits more ipsilateral expression of chromatophores on the mantle than on the head and arms. The lateralization index is used to assess the symmetry of chromatophore expression upon electrical stimulation in the optic lobe. Positive indices indicate ipsilateral dominance and negative indices show contralateral dominance. Chromatophore expression on the mantle showed significantly ipsilateral control, whereas chromatophore expression on the head and arms was more variable. **p < 0.01.
To further determine whether control of chromatophore expression is organized somatotopically in the optic lobe, the increases in expression areas on the ipsilateral mantle, head, and arms upon electrical stimulation in anterior, middle, and of the posterior optic lobes were compared. Regardless of the position of the stimulation sites in the optic lobe, chromatophore expression on the mantle showed the largest increases (Fig. 8). This suggests that control of chromatophore expression along the body axis shows no topographic correspondence to the optic lobe and that the mantle appears to undergo significantly more control than the head and arms within the high motor center of the brain.
Figure 8.
Control of chromatophore expression along the body axis has no topographic correspondence in the optic lobe. Stimulation of various optic lobe regions evoked different ipsilateral responses. A, Anterior stimulation (first 1/3 of the optic lobe). B, Middle stimulation (middle 1/3 of the optic lobe). C, Posterior stimulation (last 1/3 of the optic lobe). Regardless the stimulation site, chromatophore expression on the mantle showed the largest increase. Ipsi-mantle, Ipsilateral mantle; Ipsi-head, ipsilateral head; Ipsi-arms, ipsilateral arms. Error bars indicate SEM. *p < 0.05; **p < 0.01.
Chromatophore expansion is determined by activation strength and depth in the optic lobe
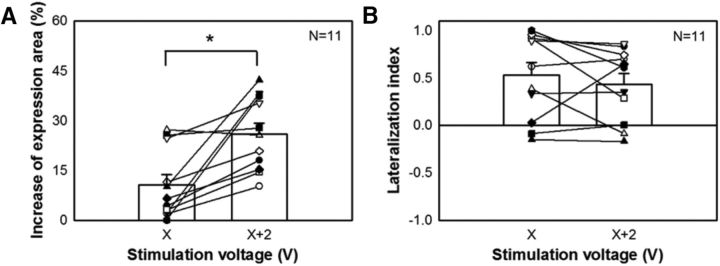
To assess the effect of activation strength on the control of chromatophore expression, increases in ipsilateral expression area upon electrical stimulation were compared between two stimulation strengths (X and X + 2 V) at the same site in the optic lobe. It is clear that when the stimulation voltage was increased by 2 V, the expression area was increased significantly (Fig. 9A). This suggests that a stronger stimulation activates more of the units controlling chromatophore expression in the optic lobe, thus increasing the expressed area. However, increasing the stimulation voltage by 2 V had no significant effect on the bilateral chromatophore expression response (Fig. 9B). This implies that activating more chromatophore expression control units in the optic lobe does not necessary increase the level of crossover in terms of motor commands to the contralateral side.
Figure 9.
Increase in the stimulation voltage enhances ipsilateral chromatophore expression, but not a bilateral response. A, Increase in the stimulation voltage by 2 V (from X to X + 2 V) enlarged the expression area of the chromatophores. B, Increase in the voltage had no significant effect on the bilateral response of chromatophore expression. *p < 0.05.
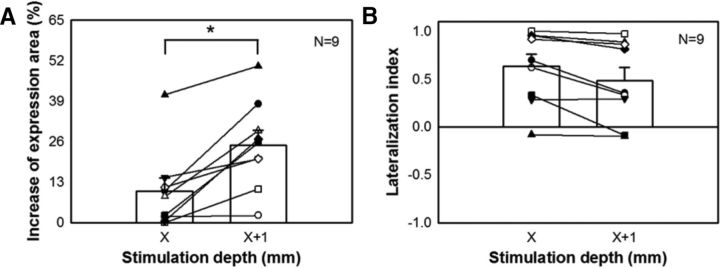
Similarly, to examine the effect of activation depth on the control of chromatophore expression, the increases in ipsilateral expression area upon electrical stimulation were compared between two stimulation depths (X and X + 1 mm) in the optic lobe using the same stimulation strength. It became evident that, when the stimulation depth was increased, the expression area was increased significantly (Fig. 10A). This suggests that deeper stimulation activates more chromatophore expression control units in the optic lobe, thus increasing the expressed area. However, increasing the stimulation depth by 1 mm had no significant effect on the bilateral chromatophore expression response (Fig. 10B). This implies that activating more chromatophore expression control units in the optic lobe does not necessarily increase the crossover of motor commands into the contralateral side.
Figure 10.
Greater depth of stimulation enhances ipsilateral chromatophore expression, but not a bilateral response. A, Greater depth of stimulation by 1 mm (from X to X + 1 mm) enlarges the expression area of the chromatophores. B, Greater depth of stimulation has no significant effect on the bilateral response of chromatophore expression. *p < 0.05.
Motor units of individual body pattern components are multiplexed and interconnected within the optic lobe
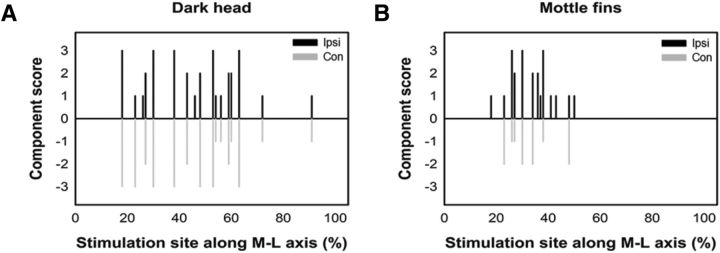
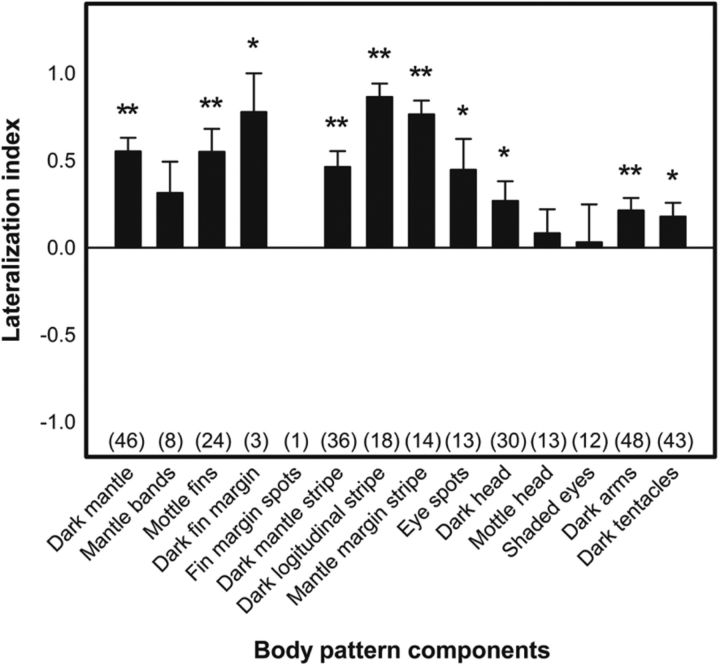
It is known that cephalopod body patterns can be analyzed into their components (Packard and Hochberg, 1977) and these components can be thought of, not only as morphological units within the skin, but also as physiological units within the brain (Packard, 1982). To understand how the optic lobe organizes the motor units of individual body pattern components and ultimately generates an appropriate body patterns for communication, the expression levels of 14 body pattern components from the dorsal and lateral sides of the squid (Fig. 4) upon electrical stimulation were analyzed. Each component expression level on the ipsilateral and contralateral sides was graded separately (ranging from 0 to 3, see Materials and Methods for details). For example, both “dark head” and “mottled fins” can be activated by stimulating the optic lobe at multiple sites along the M–L axis, although the sites that elicit “dark head” are more widespread than those of evoking “mottled fins” and the components were expressed more bilaterally with regard to “dark head” than regarding “mottled fins” (Fig. 11). Comparing the lateralization index of all 14 body pattern components, it is apparent that most mantle-related components have higher lateralization indices, whereas head-/arms-related components tended to have lower indices (Fig. 12). Specifically, 10 body pattern components showed significantly ipsilateral dominance, including seven mantle-related components and three head/arms-related components. The results are consistent with our finding that stimulation of the optic lobe elicited more ipsilateral expression of chromatophores on the mantle than on the head and arms. This also suggests that, within the optic lobe, body pattern components on the mantle are controlled more ipsilaterally, whereas those on the head and arms are controlled more bilaterally.
Figure 11.
Control of the expression of body pattern components is not confined to a specific area of the optic lobe. Each elicited component was scored manually based on the extent of the expression (0 means no expression and 3 means full expression) and the side of the expression (positive means ipsilateral and negative means contralateral). A, Dark head expression was evoked by stimulating widespread locations along the M–L axis in the optic lobe and its activation was more bilaterally dominant. B, Mottled fin expression was elicited by stimulating slightly more restricted areas in the optic lobe and the response was less bilaterally dominant.
Figure 12.
Body pattern components on the mantle are controlled more ipsilaterally within the optic lobe, whereas those on the head and arms are controlled more bilaterally. The lateralization index is used to assess the symmetry of body pattern component expression upon electrical stimulation in the optic lobe. Positive indices indicate ipsilateral dominance, and negative indices show contralateral dominance. Expression of body pattern components on the mantle showed significant ipsilateral control, whereas those on the head and arms showed more bilateral controlled. Numbers in parentheses indicate the sample size. *p < 0.05; **p < 0.01.
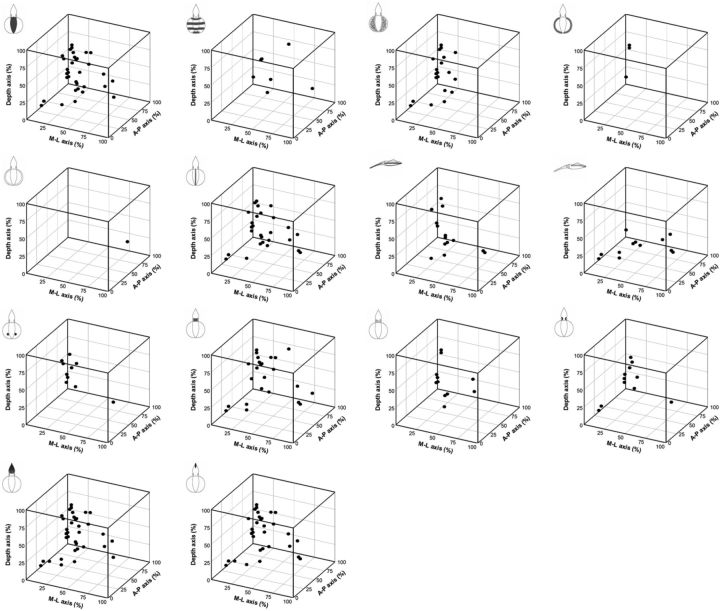
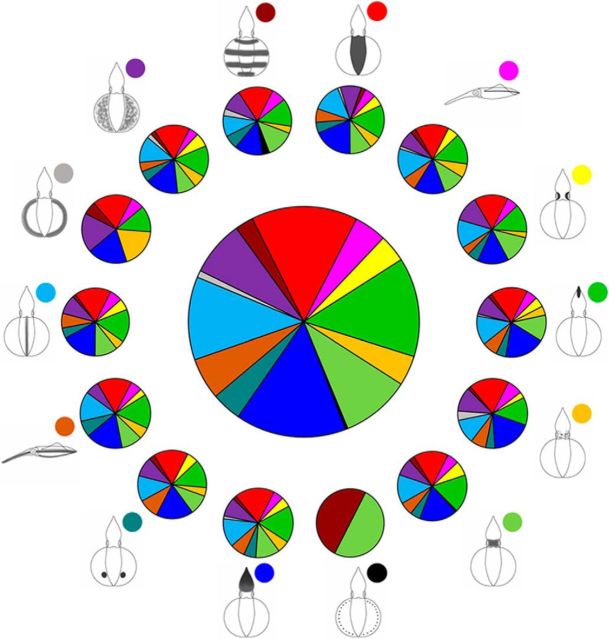
To determine the spatial relationship of motor units that control the expression of individual components within the optic lobe, all stimulation sites responsible for evoking the 14 body pattern components were visualized separately using 3D plots (Fig. 13). The results showed clearly that some components were evoked frequently (e.g., dark mantle), whereas others were encountered much less often (e.g., fin margin spots). Nevertheless, most body pattern components were able to be evoked by stimulating multiple sites in the optic lobe and these sites were widely distributed. These findings suggest that individual components may have multiple motor units and they are organized nonsomatotopically, or perhaps at least diffusely, in the optic lobe. Further analysis revealed that some components are able to be coactivated by stimulating the same area in the optic lobe. To assess the spatial organization of motor units responsible for component activation, a joint probability of coexpression of two components was computed for each of the 14 components (Table 1). For example, when stimulating the same site, if “dark mantle” is evoked, then “dark arms” is also evoked with a 94% probability, but “fin margin spots” is evoked in 0% probability. To visualize this table, the distribution of the evoked probabilities of 14 components and their coexpression probabilities with other components are shown as multiple pie charts (Fig. 14). Each of the surrounding pie charts depicts the distribution of joint probabilities of each component with the other 13 components. It is clear that subsets of the components are able to be coactivated by stimulating the same area with different joint probabilities. This suggests that the motor units of individual components may be clustered in the optic lobe and they may be organized in a mosaic manner.
Figure 13.
Stimulation sites of the 14 body pattern components in the 3D space of the optic lobe. The stimulation sites of each body pattern component in the present study are shown along the three major axes in the optic lobe, including the A–P, M–L, and depth. Some components were evoked often (e.g., dark mantle), but some were encountered much less often (e.g., fin margin spots).
Table 1.
Joint probability of coexpression of two body pattern components
| DM | MB | MF | DFM | FMS | DMS | DLS | |||||||
|---|---|---|---|---|---|---|---|---|---|---|---|---|---|
| DA | 0.94 | DM | 0.63 | DM | 0.96 | DM | 1.00 | MB | 1.00 | DM | 0.89 | DA | 0.89 |
| DT | 0.80 | DH | 0.50 | DA | 0.88 | MF | 1.00 | DH | 1.00 | DA | 0.86 | DM | 0.83 |
| DMS | 0.70 | DA | 0.50 | DT | 0.83 | MH | 1.00 | DM | 0.00 | DT | 0.81 | DT | 0.83 |
| DH | 0.52 | DT | 0.50 | DMS | 0.71 | DA | 1.00 | MF | 0.00 | DH | 0.56 | DMS | 0.72 |
| MF | 0.50 | MF | 0.38 | DH | 0.50 | DT | 0.67 | DFM | 0.00 | MF | 0.47 | DH | 0.50 |
| DLS | 0.33 | DMS | 0.38 | SE | 0.38 | MB | 0.33 | DMS | 0.00 | DLS | 0.36 | ES | 0.39 |
| MH | 0.28 | MMS | 0.25 | MH | 0.33 | MMS | 0.33 | DLS | 0.00 | MMS | 0.31 | MF | 0.33 |
| MMS | 0.26 | ES | 0.25 | ES | 0.29 | FMS | 0.00 | MMS | 0.00 | SE | 0.28 | MMS | 0.28 |
| ES | 0.26 | DFM | 0.13 | DLS | 0.25 | DMS | 0.00 | ES | 0.00 | ES | 0.25 | MH | 0.28 |
| SE | 0.26 | FMS | 0.13 | MMS | 0.25 | DLS | 0.00 | MH | 0.00 | MH | 0.22 | SE | 0.17 |
| MB | 0.11 | MH | 0.13 | MB | 0.13 | ES | 0.00 | SE | 0.00 | MB | 0.08 | MB | 0.00 |
| DFM | 0.07 | SE | 0.00 | DFM | 0.13 | DH | 0.00 | DA | 0.00 | DFM | 0.00 | DFM | 0.00 |
| FMS | 0.00 | DLS | 0.00 | FMS | 0.00 | SE | 0.00 | DT | 0.00 | FMS | 0.00 | FMS | 0.00 |
| MMS | ES | DH | MH | SE | DA | DT | |||||||
|---|---|---|---|---|---|---|---|---|---|---|---|---|---|
| DM | 0.86 | DA | 1.00 | DA | 0.87 | DM | 1.00 | DM | 1.00 | DM | 0.90 | DA | 0.93 |
| DMS | 0.79 | DM | 0.92 | DT | 0.87 | DA | 1.00 | DA | 0.92 | DT | 0.83 | DM | 0.86 |
| DA | 0.79 | DT | 0.77 | DM | 0.80 | DT | 0.69 | DMS | 0.83 | DMS | 0.65 | DMS | 0.67 |
| DT | 0.79 | DMS | 0.69 | DMS | 0.67 | MF | 0.62 | DH | 0.83 | DH | 0.54 | DH | 0.61 |
| DH | 0.57 | MF | 0.54 | MF | 0.40 | DMS | 0.62 | DT | 0.83 | MF | 0.44 | MF | 0.47 |
| MF | 0.43 | DLS | 0.54 | SE | 0.33 | DLS | 0.39 | MF | 0.75 | DLS | 0.33 | DLS | 0.35 |
| DLS | 0.36 | DH | 0.54 | DLS | 0.30 | MMS | 0.39 | MMS | 0.33 | ES | 0.27 | MMS | 0.26 |
| MH | 0.36 | SE | 0.32 | MMS | 0.27 | DFM | 0.23 | ES | 0.33 | MH | 0.27 | ES | 0.23 |
| SE | 0.29 | MH | 0.23 | ES | 0.23 | ES | 0.23 | DLS | 0.25 | MMS | 0.23 | SE | 0.23 |
| MB | 0.14 | MB | 0.15 | MB | 0.13 | SE | 0.15 | MH | 0.17 | SE | 0.23 | MH | 0.21 |
| DFM | 0.07 | DFM | 0.00 | FMS | 0.03 | MB | 0.08 | MB | 0.00 | MB | 0.08 | MB | 0.09 |
| FMS | 0.00 | FMS | 0.00 | DFM | 0.00 | FMS | 0.00 | DFM | 0.00 | DFM | 0.06 | DFM | 0.05 |
| ES | 0.00 | MMS | 0.00 | MH | 0.00 | DH | 0.00 | FMS | 0.00 | FMS | 0.00 | FMS | 0.00 |
DM, Dark mantle; MB, mantle bands; MF, mottled fins; DFM, dark fin margin; FMS, fin margin spots; DMS, dark mantle stripe; DLS, dark longitudinal stripe; MMS, mantle margin stripe; ES, eye spots; DH, dark head; MH, mottled head; SE, shaded eyes; DA, dark arms; DT, dark tentacles.
Figure 14.
Distribution of the evoked probabilities of the 14 body pattern components and their coexpression probabilities with other body pattern components. The central pie chart shows the distribution of evoked probabilities of the 14 body pattern components in the present study. The surrounding pie charts are the distribution of joint probabilities of each body pattern component with other 13 components.
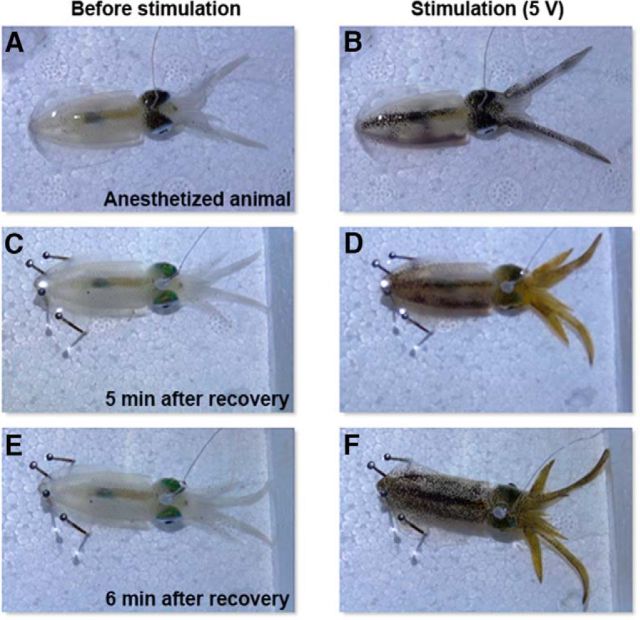
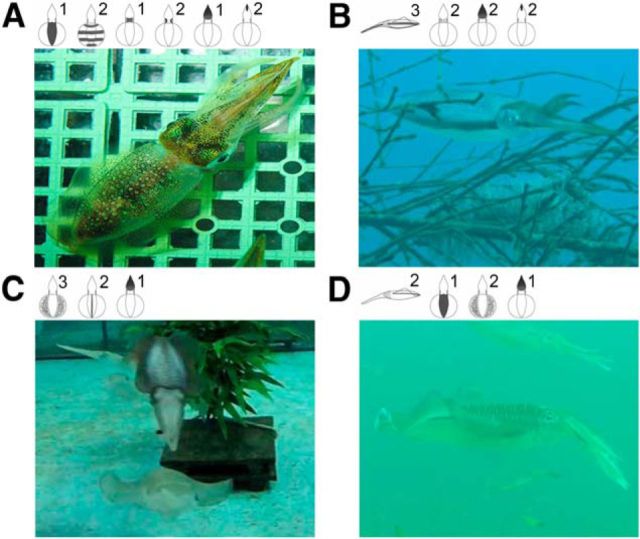
Although stimulating weakly anesthetized animals in the present study was for a practical reason, we have attempted to stimulate the optic lobe of quasi-awake squids (i.e., they had 5–10 min recovery from anesthesia and restored normal ventilation and showed vigorous fin movement) while the electrode was still intact. Although this is not equivalent to fully awake and free-swimming animals, this additional experiment confirms that electrical stimulation of the optic lobe in anesthetized and quasi-awake animals evokes similar body pattern components (Fig. 15, Table 2). Note that, in some cases, a few additional components not seen in the anesthetized squids were elicited in the quasi-awake squids (Table 2) and even the yellow chromatophores could sometimes be evoked during recovery (Fig. 15). This is likely a result of increased spontaneous neural activity and other sensory inputs in the quasi-awake state. Nevertheless, this observation reveals that the strength and speed of skin-patterning response in the quasi-awake animals generally match what is seen in the anesthetized animals. This also suggests that the mosaic organization of body pattern control in the optic lobe derived in the present study largely holds true even with other sensory input and neural activity in awake animals. Finally, to confirm the joint probabilities of each component with the other 13 components in live animals, the coexpression of components on squids was analyzed (Fig. 16). Squids with different behaviors showed distinct body patterns that are composed of different components. Indeed, coactivated components have a higher joint probability of coexpression and this has been clearly revealed in the present study.
Figure 15.
Electrical stimulation of the optic lobe in anesthetized and quasi-awake animals evokes similar body pattern components. A, Anesthetized animal before stimulation. B, Oval squid showed six distinct body pattern components (DM, DMS, DLS, DH, DA, and DT; see below for abbreviations) during electrical stimulation. C, After 5 min recovery from anesthesia, the animal restored normal ventilation. D, This half-awake oval squid showed identical but stronger body pattern components when the same electrical stimulation was applied again. E, After 6 min of recovery from anesthesia, the animal displayed fin movement. F, Quasi-awake oval squid showing additional two body pattern components (MF and ES) when the same electrical stimulation was applied again. DM, Dark mantle; DMS, dark mantle stripe; DLS, dark longitudinal stripe; DH, dark head; DA, dark arms; DT, dark tentacles; MF, mottled fins; ES, eye spots.
Table 2.
Body pattern components evoked by electrically stimulating the optic lobe of anesthetized and quasi-awake oval squids
| Trial | Anesthetized animal | Quasi-awake animal |
|---|---|---|
| 1 | DM, DMS, DH, DA, DT | DM, DMS, DH, DA, DT |
| 2 | DM, DMS, DLS, DH, DA, DT | DM, DMS, DLS, DH, DA, DT |
| 3 | DLS, DH, DA, DT | DLS, DH, DA, DT, DM, DMS |
| 4 | DM, MB, MF, DA, DT | DM, MB, MF, DA, DT |
| 5 | DM, DMS, DH, DA, DT | DM, DMS, DH, DA, DT, MF |
| 6 | DM, MB, DLS, SE, DA, DT | DM, MB, DLS, SE, DA, DT |
| 7 | DM, DMS, DLS, DH, DA, DT | DM, DMS, DLS, DH, DA, DT, MF, ES |
DM, dark mantle; MB, mantle bands; MF, mottled fins; DMS, dark mantle stripe; DLS, dark longitudinal stripe; ES, eye spots; DH, dark head; SE, shaded eyes; DA, dark arms; DT, dark tentacles.
Figure 16.
Coexpression of body pattern components in living oval squid. Various body patterns of oval squids were observed in the wild and in the laboratory. These body patterns are composed of different numbers of components. A, Six body pattern components are shown, but some of them were only weakly expressed. B, Four distinct components are expressed in this oval squid. C, Three components are shown in this male oval squid when attempting to mate with a female. D, Four components are expressed differentially in this squid. The numbers on the top indicate the expression level of individual components.
Discussion
Control of body coloration is ipsilaterally dominant and organized nonsomatotopically in the optic lobe
The optic nerve fibers from each eye are projected to the ipsilateral optic lobe in a regular pattern, being precisely reassorted after passing through a chiasma that maintains a retinotopic organization in the cortex of the optic lobe (Young, 1962, 1974). The optic tracts from each optic lobe are then projected to many areas in the central brain and to the contralateral optic lobes via the commissure. Consistent with a previous study showing that direct electrical stimulation within the optic lobe evoked various body patterns unilaterally or bilaterally in cuttlefish (Boycott, 1961), the present study also found that stimulating the optic lobe of squids on one side elicited selective darkening on both sides to a variety of extents. However, our results also revealed that stimulation of the optic lobe evoked more ipsilateral expression of chromatophores on the mantle than on the head and arms (Fig. 7). Further analysis also indicated that the expression of body pattern components on the mantle showed significantly ipsilateral control, whereas expression of body pattern components on the head and arms showed more bilateral control (Fig. 12). Taking into consideration the fact that the mantle makes up a much larger area than the head and arms in squids, the presence of color changes on the mantle with a significantly degree of ipsilateral control suggests that the motor control of body patterning is largely dependent on visual input from the ipsilateral side. The evidence that the head and arms are more bilaterally controlled may indicate that the commissure for regulating these areas is enhanced or that these areas require symmetric expression for effective visual communication.
Many of the optic tracts leaving the optic lobes maintain a precisely topographical organization in some motor centers (e.g., peduncle lobe) and the contralateral optic lobe via the commissure. However, anatomical studies also have found that the output projection for the control of body coloration from the optic lobe shows complex interweaving and the response pattern is not topographically related to the visual input (Young, 1974). Our findings indicate that the control of chromatophore expression along the body axis shows no topographic correspondence to the optic lobe (Fig. 8) and that most body pattern components are able to be evoked by stimulating multiple sites that are widely distributed across the optic lobe (Fig. 13). This suggests that the motor output of the optic lobe for body pattern control does not correspond to the animal's visual input and there is no somatotopic mapping of motor output across the optic lobe. Instead, chromatophore expression of the skin is controlled across the entire optic lobe. This is also consistent with a previous study showing that discrete and complex components of arm movements have no central topographical organization in the higher motor center, but are rather distributed over wide regions in the octopus (Zullo et al., 2009). Furthermore, tracer injection of chromatophores on the skin and electrical stimulation at the posterior chromatophore lobe in squids has also demonstrated that there is no relationship between the loci in the lower motor center and regions of chromatophore expansion at the periphery (Dubas et al., 1986a; Dubas et al., 1986b). Our findings support the hypothesis that motor control in cephalopods is nonsomatotopically or diffusedly organized in the brain. This is in sharp contrast to vertebrates, in which topological organization and sensory motor mapping underlie much of our understanding about functional organization and development.
Motor units of body pattern components are organized in a mosaic pattern in the optic lobe
The body pattern of cephalopods is a combination of chromatic, textural, postural, and locomotor components and a subset of these components may be combined together at any time to create a given different body pattern (Packard and Sanders, 1969; Packard and Sanders, 1971; Packard and Hochberg, 1977; Hanlon and Messenger, 1996). More importantly, these components can be thought of, not only as morphological units of the body, but also as physiological units within the brain (Packard, 1982). To focus on the neural control of chromatophore expression in the skin, only chromatic components were considered in the present study. Although the body pattern components in S. lessoniana have not been characterized systematically, those in other oval squid species are well documented (Moynihan and Rodaniche, 1982; Jantzen and Havenhand, 2003b). Following these earlier component nomenclatures, we have defined 14 distinct chromatic components in young adult S. lessoniana as part of the present study. If these 14 components represent distinct physiological units in the brain, then our results suggest that each of these components does not reside in a single locus within the optic lobe, but rather each can be evoked by stimulating multiple sites in the medulla (Fig. 13). However, the frequency of each component that can be elicited by electrical stimulation was different (Fig. 14). Among them, dark arms (15.5%), dark mantle (14.9%), dark tentacles (13.9%), and dark head (9.7%) were the most frequently encountered ones. These components, each of which has a different level of expression, represent a uniform body pattern, which is one of the most commonly seen body patterns in the wild. The less frequently evoked components, including fin margin spots and dark fin margin, are rarely seen in young adult squids, but are often observed in sexually mature animals during the reproductive season. These findings suggest that some motor units of components may be added to the optic lobe later in life to expand the repertoire of body patterning.
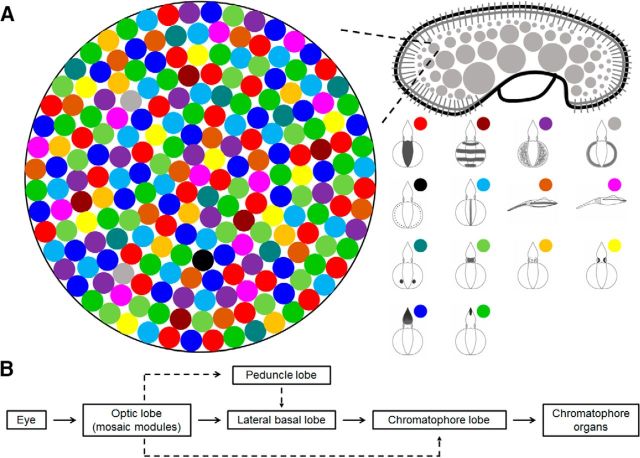
In addition to finding that individual components are able to be elicited by stimulating multiple sites in the medulla of the optic lobe, we also found that a subset of components can often be coactivated by the same stimulation (Fig. 14). The expression level of each evoked component was not the same and the joint probability of coexpression varied among the different components (Table 1). These observations indicate that the motor units of the body pattern components are not only present repeatedly, but are also dispersed throughout the optic lobe. This neural organization may allow squids to generate diverse body patterns by activating a subset of components selectively. To conceptualize this optic lobe control of body patterning, we propose a mosaic organization model in which the motor units of individual components are organized in a mosaic fashion within a motor command module for body pattern generation (Fig. 17A). Each module may contain all of the control units of components, each with a different proportion (as represented by different colored circles in Fig. 17A) and these modules are likely to occur multiple times in the medulla of the optic lobe. Therefore, when stimulating any module in the optic lobe, various different numbers of components can be evoked. In turn, different body patterns can be generated by activating distinct subregions in the module. We speculate that the structural basis of these modules may be the reported cell islands in the medulla (Young, 1974). Based on the histological analysis, all stimulation sites but two were found to be located in the cell islands, not in the neuropils. This supports that the cell islands are likely the proposed motor command modules. The only two neuropil stimulations also generated similar response, which suggests that the neural fibers leaving the cell islands carry similar motor command information. In addition, MRI evidence has demonstrated that the cell islands are continuous structures in the optic lobe (Y.C. Liu, T.H. Liu, C.H. Su, and C.C. Chiao, National Tsing Hua University, Taiwan, unpublished observations) and the area of these islands gradually increases toward the optic tract. This anatomical observation corroborates our results that chromatophore expansion upon electrical stimulation is positively correlated with an increase in stimulating voltage and a greater depth of stimulation (Figs. 9, 10). Moreover, not only are the expression areas expanded, in some cases, we also observed that the number of evoked body pattern components was increased (but never decreased) when the stimulating voltage was increased and when there was a greater depth of stimulation. This further supports the mosaic model of the body pattern control in the optic lobe. However, due to the persistence of our electrical stimulation (10 s), there may be some cumulative effect in the optic lobe or in the downstream projections to lower motor centers, so this mosaic model requires further temporal analysis of body pattern component expression. The distribution of the motor units of these frequently evoked components within the module is somewhat random (Fig. 17A), so they can often be activated by electrical stimulation. However, the motor units of less often encountered components are positioned near the motor units of the components with a higher joint probability of coexpression (e.g., dark fin margin in Fig. 17A), so they can be coactivated together to produce certain body patterns. Future studies with more targeted stimulation will help to verify the exact distribution and interaction of the control units of individual body pattern components in the module.
Figure 17.
Mosaic organization of body pattern control in the optic lobe and the downstream neural processing stages. A, Conceptual diagram based on the findings of the present study illustrating that the control units of individual body pattern components are organized in a mosaic fashion in the motor command module involved in body pattern generation. Each module contains all the control units of body pattern components with different proportions. These modules are spread widely across the medulla of the optic lobe. Therefore, when stimulating any module in the optic lobe, various numbers of different components can be evoked. In turn, different body patterns can be generated by activating distinct subregions in the module. Note the module depicted here represents a continuous structure of cell islands in the medulla. B, Flow chart showing the neural processing stages responsible for body pattern generation. Visual information from eye is integrated by mosaic modules in the optic lobe, then the optic lobe sends motor commands to the downstream lobes such as the peduncle lobe, lateral basal lobe, and chromatophore lobe to control the chromatophore organs.
Although this mosaic organization of neural control units of body patterning in the optic lobe is seemingly redundant, it does provide an efficient way of coordinating expression of the multiple components needed to generate diverse body patterns (a diagram summarizing the visual motor system of body pattern control is shown in Fig. 17B). This is similar to muscle control during locomotion in vertebrates, in which each muscle can be activated by stimulating many widely dispersed sites in the motor center to coordinate whole-limb actions (Ting and McKay, 2007). The concurrent activation of synergies thus simplifies the neural command signals needed for movement while allowing flexibility and adaptability. Finally, the multiplicity and arrangement of these modules in the medulla of the optic lobe may represent a complex extensive repeated organization of the motor commands. The network of lateral and vertical connections among these modules is likely to provide a mechanism allowing sensorimotor integration of dynamic body patterning in cephalopods.
Footnotes
This work was supported by the Ministry of Science and Technology of Taiwan (Grant NSC-102-2628-B-007-001-MY3) and the Air Force Office of Scientific Research Asian Office of Aerospace Research and Development (AFOSR-AOARD Grant FA2386-13-1-4052 to C.-C.C.). We thank Mr. Chun-Yen Lin for discussing and drawing the body pattern components of oval squids for us and two anonymous reviewers for constructive comments that helped to improve this work significantly.
The authors declare no competing financial interests.
References
- Boycott BB. The functional organization of the brain of the cuttlefish Sepia officinalis. Proc Biol Sci. 1961;153:503–534. doi: 10.1098/rspb.1961.0015. [DOI] [Google Scholar]
- Breidbach O, Kutsch W. The nervous system of invertebrates: an evolutionary and comparative approach. Basel: Birkhäuser; 1995. [Google Scholar]
- Cajal SR. Contribución al conocimiento de la retina y centros ópticos de los cefalópodos. Trabajos del Laboratorie de Investigaciones biologicas de la Universidad de Madrid. 1917;15:1–82. [Google Scholar]
- Chichery R, Chanelet J. Motor and behavioral responses obtained by stimulation with chronic electrodes of optic lobe of Sepia officinalis. Brain Res. 1976;105:525–532. doi: 10.1016/0006-8993(76)90598-9. [DOI] [PubMed] [Google Scholar]
- Chichery R, Chanelet J. Motor responses obtained by stimulation of peduncle lobe of Sepia officinalis in chronic experiments. Brain Res. 1978;150:188–193. doi: 10.1016/0006-8993(78)90664-9. [DOI] [PubMed] [Google Scholar]
- Cloney RA, Florey E. Ultrastructure of cephalopod chromatophore organs. Z Zellforsch Mik Ana. 1968;89:250–280. doi: 10.1007/BF00347297. [DOI] [PubMed] [Google Scholar]
- Dubas F, Boyle PR. Chromatophore motor units in Eledone cirrhosa (Cephalopoda, Octopoda) J Exp Biol. 1985;117:415–431. [Google Scholar]
- Dubas F, Leonard RB, Hanlon RT. Chromatophore motoneurons in the brain of the squid, Lolliguncula brevis: an HRP study. Brain Res. 1986a;374:21–29. doi: 10.1016/0006-8993(86)90390-2. [DOI] [PubMed] [Google Scholar]
- Dubas F, Hanlon RT, Ferguson GP, Pinsker HM. Localization and stimulation of chromatophore motoneurons in the brain of the squid, Lolliguncula brevis. J Exp Biol. 1986b;121:1–25. doi: 10.1242/jeb.121.1.1. [DOI] [PubMed] [Google Scholar]
- Gleadall IG. The effects of prospective anaesthetic substances on cephalopods: summary of original data and a brief review of studies over the last two decades. Journal of Experimental Marine Biology and Ecology. 2013;447:23–30. doi: 10.1016/j.jembe.2013.02.008. [DOI] [Google Scholar]
- Hanlon RT, Messenger JB. Cephalopod behaviour. New York: Cambridge University; 1996. [Google Scholar]
- Jantzen TM, Havenhand JN. Reproductive behavior in the squid Sepioteuthis australis from South Australia: interactions on the spawning grounds. Biol Bull. 2003a;204:305–317. doi: 10.2307/1543601. [DOI] [PubMed] [Google Scholar]
- Jantzen TM, Havenhand JN. Reproductive behavior in the squid Sepioteuthis australis from South Australia: ethogram of reproductive body patterns. Biol Bull. 2003b;204:290–304. doi: 10.2307/1543600. [DOI] [PubMed] [Google Scholar]
- Mäthger LM, Barbosa A, Miner S, Hanlon RT. Color blindness and contrast perception in cuttlefish (Sepia officinalis) determined by a visual sensorimotor assay. Vision Res. 2006;46:1746–1753. doi: 10.1016/j.visres.2005.09.035. [DOI] [PubMed] [Google Scholar]
- Messenger JB. Cephalopod chromatophores: neurobiology and natural history. Biol Rev. 2001;76:473–528. doi: 10.1017/s1464793101005772. [DOI] [PubMed] [Google Scholar]
- Mooney TA, Lee WJ, Hanlon RT. Long-duration anesthetization of squid (Doryteuthis pealeii) Marine and Freshwater Behavior and Physiology. 2010;43:297–303. doi: 10.1080/10236244.2010.504334. [DOI] [Google Scholar]
- Moynihan M, Rodaniche AF. The behavior and natural history of the Caribbean Reef Squid Sepioteuthis sepioidea with a consideration of social, signal, and defensive patterns for difficult and dangerous environments. Fortschr Verhaltensforsch. 1982;25:9–150. [Google Scholar]
- Nixon M, Young JZ. The brains and lives of cephalopods. New York: OUP; 2003. [Google Scholar]
- Packard A. Morphogenesis of chromatophore patterns in cephalopods: are morphological and physiological units the same? Malacologia. 1982;23:193–201. [Google Scholar]
- Packard A, Hochberg FG. Skin patterning in octopus and other genera. Symposia of the Zoological Society of London. 1977;38:191–231. [Google Scholar]
- Packard A, Sanders G. What the octopus shows to the world. Endeavour. 1969;28:92–99. [PubMed] [Google Scholar]
- Packard A, Sanders GD. Body patterns of Octopus vulgaris and maturation of response to disturbance. Animal Behaviour. 1971;19:780–790. doi: 10.1016/S0003-3472(71)80181-1. [DOI] [Google Scholar]
- Ting LH, McKay JL. Neuromechanics of muscle synergies for posture and movement. Curr Opin Neurobiol. 2007;17:622–628. doi: 10.1016/j.conb.2008.01.002. [DOI] [PMC free article] [PubMed] [Google Scholar]
- Williamson R, Chrachri A. Cephalopod neural networks. Neurosignals. 2004;13:87–98. doi: 10.1159/000076160. [DOI] [PubMed] [Google Scholar]
- Young JZ. Optic lobes of Octopus vulgaris. Philos Trans R Soc Lond B Biol Sci. 1962;245:19–58. doi: 10.1098/rstb.1962.0005. [DOI] [Google Scholar]
- Young JZ. The anatomy of the nervous system of Octopus vulgaris. Oxford: Clarendon; 1971. [Google Scholar]
- Young JZ. The central nervous system of loligo I. the optic lobe. Philos Trans R Soc Lond B Biol Sci. 1974;267:263–302. doi: 10.1098/rstb.1974.0002. [DOI] [PubMed] [Google Scholar]
- Zullo L, Sumbre G, Agnisola C, Flash T, Hochner B. Nonsomatotopic organization of the higher motor centers in octopus. Curr Biol. 2009;19:1632–1636. doi: 10.1016/j.cub.2009.07.067. [DOI] [PubMed] [Google Scholar]


