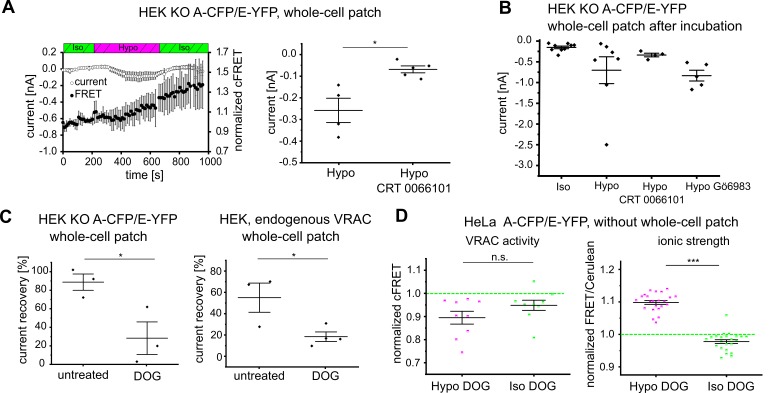
Figure 5. DAG and PKD as determinants of VRAC activity.
(A) Left: simultaneous measurements of whole-cell current at −80 mV (open circles) and normalized cFRET values (solid circles) during buffer exchange experiment with A-CFP/E-YFP-expressing HEK293 KO cells, after 15 min pre-incubation with 5 µM CRT 0066101 in the presence of CRT 0066101. Data represent mean of 5 cells ± s.d. Right: average currents of the last five time points in hypotonicity with (data from left panel) and without (data from Figure 1F) CRT 0066101; data represent individual cells (diamonds) and mean ± s.e.m. (B) Whole-cell currents of HEK293 KO cells expressing A-CFP/E-YFP clamped at −80 mV after pre-incubation with indicated buffers: isotonic buffer (n = 9), hypotonic buffer (n = 7), hypotonic buffer with 5 µM CRT 0066101 (n = 4) or 1 µM Gö6983 (n = 5). Data represent individual cells (diamonds) and mean ± s.e.m. (C) Recovery of whole-cell currents in HEK293 cells expressing A-CFP/E-YFP (left) and wild-type HEK293 (right) at −80 mV to basal levels after switching from extracellular hypotonicity to isotonicity in the absence or presence of the DAG kinase inhibitor dioctanoylglycol (100 µM DOG). In HEK293 KO, n = 3 for untreated (from measurements in Figure 1F) and n = 3 for DOG-treated; in wild-type HEK293, n = 3 for untreated and n = 4 for DOG-treated. Data represent individual cells (diamonds) and mean ± s.e.m. (D) cFRET was measured for HeLa cells expressing either VRACs containing A-CFP/E-YFP (left, n = 7 dishes with 9 cells) or the RD sensor for ionic strength (right, n = 6, 23 cells) consecutively in isotonic buffer, hypotonic buffer supplemented with 100 µM DOG and isotonic buffer with DOG. Average cFRET of the last five time points per condition. Data represent individual cells and mean ± s.e.m. Statistics: *p<0.05; ***p<0.0005; n.s., not significant, Student’s t-test.


