Abstract
Amyloid β (Aβ) oligomers are formed at the early stages of the amyloidogenesis process and exhibit neurotoxicity. Development of oligomer specific therapeutics requires a detailed understanding of oligomerization processes. Amyloid oligomers exist transiently and single-molecule approaches are capable of characterizing such species. In this paper, we describe the application of AFM based force clamp approach for probing of Aβ42 dimers. Aβ42 monomers were tethered to the AFM tip and surface and the dimers are formed during the approaching the tip to the surface. AFM force clamp experiments were performed at different force clamps. They revealed two types of transient states for dissociating Aβ42 dimers. The analysis showed that these states have distinct lifetimes of 188 ± 52 milliseconds (type 1, short lived) and 317 ± 67 milliseconds (type 2, long lived). Type 1 state prevails over type 2 state as the value of the applied force increases. The rupture lengths analysis led to the models of the dimer dissociation pathways that are proposed.
Graphical Abstract
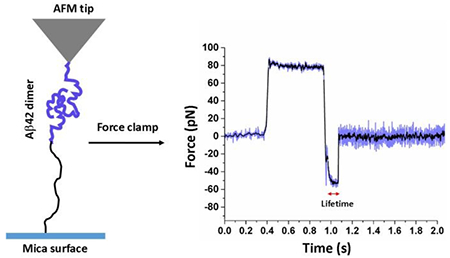
Atomic force microscopy force clamp approach was used for probing Aβ42 dimer that enabled us to measure stability and binding pattern within the dimer.
Introduction
Alzheimer’s disease (AD) is associated with the formation of neurotoxic amyloid aggregates of amyloid β peptides in the extracellular space of AD infected brains.1–3 Amyloid plaques are mainly composed of fibrillar aggregates from amyloid β peptides, mainly Aβ42 and Aβ40.4, 5 The structure of Aβ fibrils is rather well characterized, but our knowledge about soluble oligomers structures is inadequate. The latter is important as accumulated evidence suggests that soluble oligomers, specifically dimers and trimers of Aβ are neurotoxic, rather than amyloid fibrils.6–8 Specifically, it was found that Aβ dimers are toxic and have been considered as building blocks for the toxic higher order aggregates.9, 10 Younkin et al. showed that dimers of Aβ were accumulated in the lipid raft of Tg2576 mouse model in an age dependent manner during the early stages of memory impairment, which strongly suggested that Aβ42 dimers are responsible for AD.11 Selkoe and his coworkers indicated that soluble Aβ dimers extracted from the cerebral cortex of AD patients interrupt the memory of a learned behavior in normal rats.12 Moreover, they also showed that insoluble amyloid plaque cores from the AD brain cortex do not prevent long-term potentiation (LTP) unless they dissociated to Aβ dimers, further suggesting Aβ dimers are synaptotoxic.
Neurotoxicity of the amyloid oligomers depends on a wide variety of factors including molecular structures and stability.13 A significant effort had been made for the characterization of amyloid oligomers, assembly process, and their relation to neurotoxicity.14, 15 Recent studies revealed that single molecule approaches are effective methods for characterization of amyloid oligomers. In this context, we previously have developed several single molecule approaches including AFM force spectroscopy16–18 and a tethered fluorescence based approach19, 20 that enabled us to measure lifetimes of amyloid dimers. In addition, computational modeling such as molecular dynamics (MD) simulations, along with Monte Carlo pulling (MCP) had been used previously for structural studies of amyloid dimers.21, 22
In the current study, we applied AFM force clamp technique to characterize the dissociation process of Aβ42 dimers. AFM tip and mica substrate were functionalized with Aβ42 monomers that form a dimer when the tip approaches to the surface. This probing method allowed us to reveal the dissociation pattern of the dimer. Within the selected range of forces, two states for the Aβ42 dimer dissociation were identified and their lifetimes were measured.
Materials and Methods
N-terminus azide modified Aβ42 [K(N3)-Aβ42] peptide was purchased from GenicBio Limited (Shanghai, China). MAL-PEG-SVA (M.wt 3400 g/mol) and mPEG-SVA (M.wt 2000 g/mol) were purchased from Laysan Bio (Arab, AL), Tris-(2-Carboxyethyl) phosphine-HCl (TCEP-HCl) was purchased from Hampton Research Inc. (CA, USA). NHS-PEG4-DBCO, and Cystamine, HCl were purchased from Sigma-Aldrich, USA. 1-(3-aminopropyl) silatrane (APS) were synthesized as described in ref23. All other commercial solvents were purchased from Sigma-Aldrich (MO, USA). Water used in all the experiments is deionized (DI) water obtained from AquaMAX-ultra (APS water service corporation, USA) water purification system.
(i). Preparation of Aβ42 monomer solution
About 0.5 mg of K(N3)-Aβ42 peptide was dissolved in 100 μL of 1% ammonium hydroxide and sonicated for 5 min to destroy pre-aggregates. The solvent was then evaporated in a vacuum for 6 hours. The peptide was re-dissolved in water:DMSO (10:1 v/v) and concentration was measured using nanodrop UV-visible spectrometer (ND1000 spectrometer, Nanodrop technology, USA) using the molar extinction co-efficient of tyrosine = 1280 M−1 cm−1 at 280 nm. This solution was diluted in appropriate buffer during experiments. We have used a low concentration of the peptide (20 nM for AFM tip and 40 nM for mica surface) for functionalization procedure. At such low concentartion the peptide does not aggregates and remains mainly as a monomer.24
(ii). AFM tip functionalization
AFM tips were functionalize with Aβ42 monomer using our standard protocol25, 26, which leads to reliable and reproducible single-molecule probing experiments. Briefly, AFM tips (MSNL-10, Bruker, CA) were cleaned subsequently with ethanol, water, and UV (λ366 nm) for 45 min. The cleaned tips were then treated with 50 μM APS in water for 30 min, followed by multiple rinses with water. The tips were immersed into 50 μM of NHS-PEG4-DBCO solution, prepared in 10 mM sodium phosphate buffer (pH 7.7) for 1h and rinsed with water. Next, the tips were dipped into 20 nM of K(N3)-Aβ42 solution (prepared in DMSO: 10 mM sodium phosphate buffer (pH 7.4) (v/v 1:10)) for 3h. Finally, tips were rinsed with water and stored at 4°C until needed.
(iii). Surface functionalization
The freshly cleaved mica surfaces were functionalized with amino groups by treating the surfaces with 167 μM APS in water for 30 min, followed by multiple rinses with water. To achieve low concentration of active functionality, the surfaces were treated with 200 μM of PEG mixture (SVA-PEG-MAL (M. wt 3400 g/mol): mPEG-SVA (M. wt 2000 g/mol), molar ratio 1:10) in sodium phosphate buffer (pH 7.7) for 1 h, followed by multiple rinses with water. Next, 100 μM of cystamine pretreated with TCEP in 10 mM sodium phosphate buffer (pH 7.4) was added onto the surfaces, kept for 1h and washed with water. The surfaces were then covered with 100 μM NHS-PEG4-DBCO in sodium phosphate buffer (pH 7.7). Finally, the surfaces were treated with 40 nM K(N3)-Aβ42 solution (prepared in DMSO: 10 mM sodium phosphate buffer (pH 7.4) (v/v 1:10)) for 3h, rinsed with water and stored at 4°C until needed.
(iv). Force-distance (F-D) curves: data acquisition and analysis
Force measurements were performed in JPK Nanowizard 4a Bioscience AFM instrument (JPK, Germany) in 10 mM sodium phosphate buffer (pH 7.4, 150 mM NaCl and 1 mM EDTA) at room temperature. AFM tips were calibrated with the thermal method according to manufacturer manual (measured spring constant in the range 16–25 pN/nm). Prior to force clamp (F-C) experiment, force-distance (F-D) experiments were performed. A functionalized AFM tip was approached to the surface, held for 0.5 s under a trigger force of 80 pN, then retracted at a speed of 500 nm/s. Several thousands of F-D curves were acquired and successful events were fitted with Worm-like chain (WLC) model27 (equation 1) to estimate rupture force and contour length for the unbinding event28.
| (1) |
Where F(x) is the force at the distance of x, kB is the Boltzmann constant, T is the absolute temperature, and Lp and Lc are the persistence length and the contour length, respectively. The force and contour length values were assembled into histograms and fitted with Gaussian function.
(v). Force clamp (F-C) experiments: data acquisition and analysis
Force clamp experiments were performed in the same AFM instrument using advanced ramp setting platform provided by JPK software, with the same tip and substrate as used in the force spectroscopy experiments. The tip was approached to the surface, held at the surface for 0.5 s at 80 pN trigger force, retracted to 15 nm to avoid any unspecific peaks, then force clamping was applied. Initially F-C experiments were performed at 30 pN constant force for 5 s then retracted. A grid matrix of 400 points (20 points × 20 points) was set over the area of 5 μm × 5 μm on the substrates and cycles of all the steps (as described above) were repeated to acquire the statistically relevant results. To test how bond lifetime depends on the applied force, force clamp experiments were performed with the use at range of constant forces 30, 40, 50 and 60 pN. The data were acquired at sample rate of 4 KHz. Several hundreds of F-C data were collected for each force. Lifetimes, heights, and effective forces were calculated from successful clamping events. All data were assembled (Fig. S1) and arranged as ascending order with respect to force. Next, four subsets of force ranges were chosen and corresponding lifetimes and height values were sorted. Each subset was again rearranged and two sub-subsets were made according to the height values 18–25 nm and 26–40 nm. The lifetime data from each sub-subset were plotted in the probability survival plots and fitted with single exponential decay function (Fig. S2).
To estimate the bond lifetime at zero force, the dependences of lifetime vs. clamped forces were plotted and fitted with Bell equation for lifetime29, 30 (equation 2).
| (2) |
In this expression τ0 is intrinsic lifetime, xB is distance to the energy barrier, kB is Boltzmann constant and T is temperature.
Type 1 and type 2 states at each force were identified by the height values. Events with the heights in the range 18–25 nm were assigned to type 1 and the force data with the height values within 26–40 nm were considered as type 2 events.
The segments in monomers defining the dimers stability were identified by values of the contour length (Lc). To obtain the contour length values, we used eq. 1 with kBT = 4.11 pNnm, Lp = 0.38 nm (for PEG) and F= 30 pN. For × values 21 nm and 31 nm, we obtained Lc values of 31 nm and 46 nm, respectively.
Results
Experimental approach
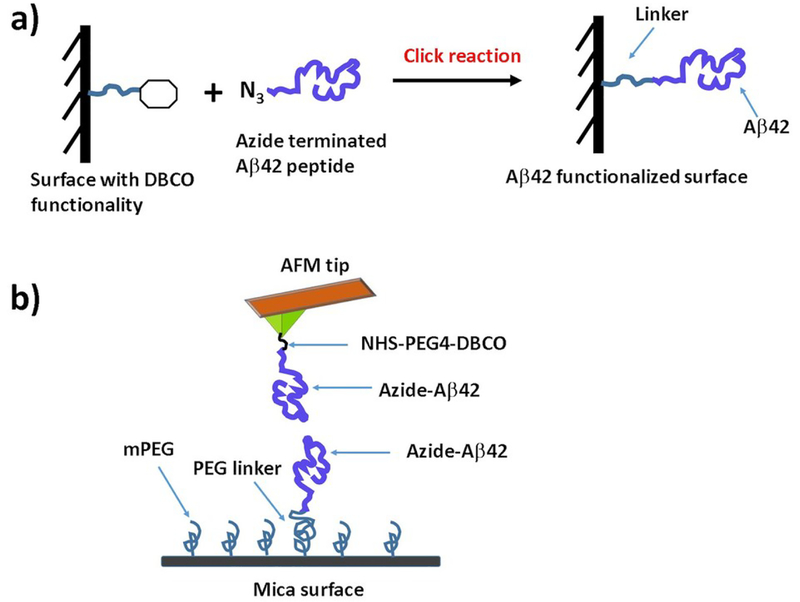
For probing Aβ42 dimers both the AFM tip and mica surface were functionalized with Aβ42 monomers as shown in Fig. 1. The surfaces were modified with DBCO groups via flexible PEG linker and then azide terminated Aβ42 peptide applied on the surface. In our previous papers16, 17, 31 we used a maleimide-thiol reaction for immobilizing amyloid proteins on surfaces. In this work, we used a more specific metal-free click reaction32 for the immobilization chemistry of Aβ42 peptides on the surfaces. This immobilization method has many advantages such as (i) no need for any metal catalyst, which eliminates a potential problem with the effect of metal ions on interactions of Aβ42 monomers33, 34, (ii) the reaction takes place at mild reaction conditions with high yield of the product, (iii) the azide and DBCO groups are relatively small and inert to biological moieties.35
Fig. 1.
(a) Chemical strategy for immobilization of Aβ42 monomers on the surface; (B) Experimental set up for probing Aβ42 dimer by AFM force spectroscopy and force clamp experiments.
Validation of Aβ42 dimers assembly using the AFM force spectroscopy
To ensure assembly of Aβ42 dimers initially the force spectroscopy experiments were performed. The experimental set up is shown in Fig. 1b.17, 36 Several thousands of force-distance (F-D) curves were acquired at 500 nm/s retraction speed and the curves with specific interactions were analyzed. Fig. 2a shows an example of a typical F-D curve, where the retraction curve (red) shows two peaks. The first peak corresponds to the adhesion peak and second peak corresponds to the specific unbinding events for the Aβ42 dimer. Rupture forces of unbinding events were obtained by fitting the F-D curves with WLC model (Eq. 1). The force histogram (Fig. 2b) reveals that the mean force required for dissociation of the Aβ42 dimers is 54 ± 4 pN (mean ± S.E.M). The distribution of the contour length (Lc) values for the unbinding events is shown in Fig. 2c, which indicates that the histogram is asymmetric and contains three peaks. We approximated the data with three Gaussian functions resulting maxima at 29 ± 2 nm, 38 ± 2 nm, and 50 ± 3 nm. Similar type of histogram was obtained in our previous experiments.17, 25 Thus, force spectroscopy results confirmed the assembly of Aβ42 dimers.
Fig. 2.
AFM force spectroscopy for Aβ42 dimer (a) A typical Force-distance approach curve (black) and retract curve (red). Blue line attached with force curve indicates WLC fitting (equation 1) that estimates rupture force (F) and contour length (Lc). (b) Force and (c) contour length histograms fitted with Gaussian function (N = 206), the force value and Lc values shown as mean ± S.E.M.; N is number of data used.
Aβ42 dimers under constant force
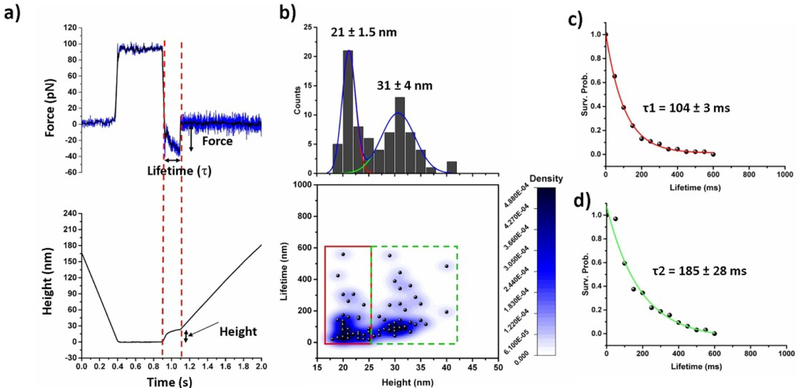
Fig. 3a shows a typical force clamp curve acquired at 30 pN constant force. The top and bottom panels indicate force vs. time and height vs. time trajectory respectively. Several hundreds of such force clamp data were acquired and bond lifetime (τ), effective clamp force, and measured height of unbinding events were determined from force clamp curve as shown in Fig. 3a. The time gap between force clamp start and bond breaking point was considered as bond lifetime. Height of bond rupture event was determind by substracting height value at the end of the dwell region (zero height) from the height value at the end of the bond rupture event.
Fig. 3.
AFM force-clamp experiments; (a) shows both the force vs. time (up) and height vs. time (bellow) profile in force-clamp experiment. The black line in upper panel indicates smoothing of data by FFT method by 5 points. Two dotted red lines indicate force clamp region. Applied force, lifetime of bond and height measurements are determined from raw data as shown above. (b) Aβ42 monomer-monomer interactions under a constant clamping force of 30 pN; 2D Kernel density plot showing correlation of the position (height) and lifetime of Aβ42 dimers, showing two types of populations. Height histograms are shown at the top panel, fitted with two Gausian functions. (c) and (d) Lifetime survival plots for the data indicated by red and green rectangles respectively. The data were fitted with single exponential decay functions. Lifetime value shown here as mean ± fitting error.
Fig. 3b shows 2D Kernel density plot, in which the lifetime values were plotted against the height values. The 2D plot clearly reveals two populations, indicated by red and green rectangles, suggesting the existence of two pathways of dimer dissociation. To calculate mean lifetime of dimer complexes, survival probability graphs were plotted as shown in the insets in Fig. 3c & d. The results indicate that the dimers in the first population have a lifetime of 104 ± 3 ms (type 1) and other types have a lifetime of 185 ± 28 ms (type 2) and they appear in an average height of 21± 1.5 nm and 31 ± 4 nm, respectively. To confirm existance of two populations Kolmogorov-Smirnov (KS) tests have been perfomed for height data in range of 18–25 nm and 26–40 nm. KS test showed that D value equal to 6.66 E−16 which is much smaller than 0.05, which reveals that two populations in height are statistically significant. Similar test has been perfomed for lifetime values in the same height ranges, which results D value of 7.77 E−4 which is less than 0.05. These results suggests that two different pathways are exist in Aβ42 dimerization process.
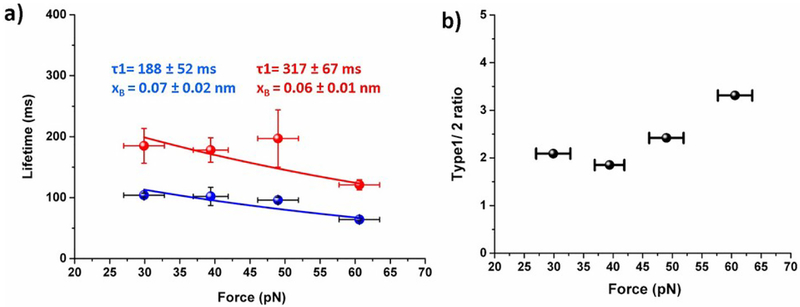
Next, to examine how applied force affects the bond lifetime of Aβ42 dimers, the force-clamp experiments were performed at variable constant forces of 30 pN, 40 pN, 50 pN and 60 pN. Lifetimes, effective forces, and heights were determined from each dataset and plotted similar to Fig. 3. These plots at each force clamp value reveal two sub-populations. The lifetimes for type 1 and type 2 events for each force were obtained by plotting the lifetime values as survival propability graphs and approximated by single exponential decay as shown in Fig. S2. These plots showed that lifetime for type 1 is always larger than type 2 pathway. We also calculated the ratio of type 1 and type 2 complexes along with the applied forces and results are shown in Fig. 4b. The data show that at each force, type 1 dissociation pathway prevails over the type 2 events and this ratio increases as the force increases.
Fig. 4.
Force dependency on dimer lifetime (a) Plot of force vs. lifetime for each type of dimers, the intrinsic life time (τ0) and distance of energy barrier (xB) were estimated by fitting the data with Bell eqation (equation 2). Calculated intrinsic lifetime (τ0) and distance of energy barrier (xB) are shown in figure. Errors indicate fitting error. (b) Occurrence ratio of type1 and 2 upon applied force.
We used the data obtained at different force clamp values to retrieve the characteristic lifetimes of both dissociation pathways in the absence of the applied force. The data are shown in Fig. 4a, which shows that lifetime of dimers gradually deceases with increase in applied force. To estimate intrinsic lifetime of the dimers, the data points for both types of rupture events are approximated by Bell equation (eq. 2), so the characteristic lifetimes (τ0) for each rupture pathways can be obtained by the extrapolation to zero applied force. The calculated τ0 for type 1 event is 188 ± 52 ms and τ0 for type 2 is 317 ± 67 ms. The calculated positions xB of the energy barrier for type 1 and 2 events are 0.07 ± 0.02 nm and 0.06 ± 0.01 nm, respectively.
Discussion
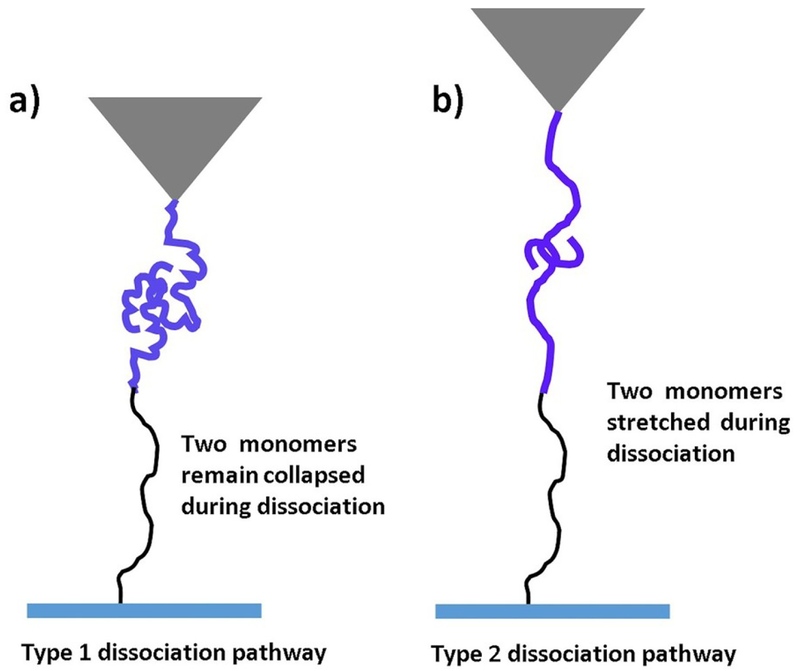
The force-clamp experiments allowed us to identify two transient states for dissociation of the Aβ42 dimer. Although AFM force spectroscopy allowed us to reveal the step-wise pattern of the dissociation process of Aβ42 dimer17, force clamp AFM approach was used to understand the dissociation pathways of Aβ42 dimers under constant force. We found that lifetimes for type 1 and 2 processes differed considerably and type 2 was substantially more stable. In fact, force clamp AFM approach, similar to force spectroscopy, also allows one to map the interacting segments holding the dimers from the dissociation using the contour lengths measurements16, 25, 37. Indeed, according to Fig. 1b the contour lengths of each rupture event include the extension of tethers and the protein segments holding the dimer. Therefore, subtracting the known values of the lengths of the tethers from the total contour length determined from the force curves leads to the lengths of the stretched monomers prior to the dimer rupture. According to Figs. 3b, mean heights for type 1 and 2 events are 21 nm and 31 nm, respectively, and conversion of height values to contour length values yielded Lc for type 1 and type 2 events of 31 nm and 46 nm, respectively. Subtracting the total length of PEG tethers (25 nm) leads to values 6 nm for type 1 event and 21 nm for type 2 event. The contour length value for type 1 pathway suggested that monomers did not extent significantly and remain collaped prior to dissociation. On the other hand, the large value of contour length (21 nm) for type 2 suggest that monomers within the dimer stretched prior to dissociation. Similar type of phenomenon was observed in computational Monte Carlo pulling simulation for Aβ42 dimers.21 The models for the two types of dissociation pathways is schemetically shown in Fig. 5. Fig. 5a illustrates type 1 dissociation pathway, in which the monomers remain in a compact conformation until they fully dissociate with no visible stretching of the N-termini of the monomers. Type 2 pathway occurs via stretching of N-termini segments of monomers within dimers, although C terminus segments remain attached prior to dissociation occur (Fig. 5b). In the force clamp experiments, we selected relatively large forces to avoid the instability of the instrument. These force clamp values due to the dependence of the rupture force on the pulling rate correspond to force values in the right part of the force distribution histogram (Fig. 2b). Therefore a relatively large population of the rupture events is missing in the force clamp measurements leading to the two-peak distribution in Fig. 3b.
Fig. 5.
The scheme showing two different types Aβ42 dimers dissociation. (a) In type 1 pathway two monomers remain collapse prior to dissociation and in (b) type 2 two monomers extend during dissociation.
The comparison of these data with the lifetime measurements suggest that type 1 pathway in which the monomers retain their compact conformation is a short-lived transient state (188 ± 52 ms) compared with type 2 pathway, which has a lifetime of 317 ± 67 ms. We posit that the elevated lifetime of type 2 pathway is explained by the transitions within the dimer in which extended and collapsed conformations of the monomers are swapped.
The existence of different dissociation pathways indicates that the dimer is very dynamic and can undergo large-scale mobility by extending its segments. This assumption is supported by our recent studies of α-synuclein (α-syn) monomers and dimers in which compacted and extended conformations of α-syn were directly visualized with high-speed AFM.38 Note a recent computational modeling study in which the aurhors demonstrate that compact structures of Aβ42 are metastable and less aggregation-prone, whereas an extended conformation of Aβ42 dimers are stable and aggregation prone.39 These finding are in line with our results on studies of Aβ (14–23) peptides in which we demonstrate that the aggregation pathway depends on the monomer conformation.31 Linear Aβ (14–23) decamers rapidly assemble fibrils, but the assembly of two peptides as a hairpin completely blocks the fibrillization pathway, although globular type aggregates are formed.
Our major finding in this study is the identification of two pathways in Aβ42 dimers dissociation, which are significantly differ in their stability (lifetimes). This finding is in line with our previous molecular dynamic study for Aβ42 dimer, where we found several populations of Aβ42 dimeric structures in the free energy landscape.21 In this study we experimentally prove the existence of different states of dimers in solution, although limitation of experimental set up allowed identifying only two distinct pathways. Existence of structural diversities at initial phase of aggregation (in dimers) can lead to the formation of heterogeneous oligomers, some of them could be neurotoxic. Moreover, our results also explain why heterogeneous fibrils are found occasionally in AD effected human brains.40
Supplementary Material
Acknowledgement
We acknowledge our lab members for their valuable suggestions to the article. The work was supported by grants to Y.L.L. from the National Institutes of Health (NIH: GM096039 and GM118006).
Footnotes
Conflicts of interest
The authors declare no competing financial interest.
References
- 1.Chiti F and Dobson CM, Annual review of biochemistry, 2006, 75, 333–366. [DOI] [PubMed] [Google Scholar]
- 2.Mattson MP, Nature, 2004, 430, 631–639. [DOI] [PMC free article] [PubMed] [Google Scholar]
- 3.Hardy JA and Higgins GA, Science, 1992, 256, 184. [DOI] [PubMed] [Google Scholar]
- 4.Roher AE, Lowenson JD, Clarke S, Woods AS, Cotter RJ, Gowing E and Ball MJ, Proceedings of the National Academy of Sciences of the United States of America, 1993, 90, 10836–10840. [DOI] [PMC free article] [PubMed] [Google Scholar]
- 5.Mak K, Yang F, Vinters HV, Frautschy SA and Cole GM, Brain research, 1994, 667, 138–142. [DOI] [PubMed] [Google Scholar]
- 6.Dahlgren KN, Manelli AM, Stine WB Jr., Baker LK, Krafft GA and LaDu MJ, The Journal of biological chemistry, 2002, 277, 32046–32053. [DOI] [PubMed] [Google Scholar]
- 7.Walsh DM, Klyubin I, Fadeeva JV, Cullen WK, Anwyl R, Wolfe MS, Rowan MJ and Selkoe DJ, Nature, 2002, 416, 535–539. [DOI] [PubMed] [Google Scholar]
- 8.Jana MK, Cappai R, Pham CL and Ciccotosto GD, Journal of neurochemistry, 2016, 136, 594–608. [DOI] [PubMed] [Google Scholar]
- 9.O’Nuallain B, Freir DB, Nicoll AJ, Risse E, Ferguson N, Herron CE,Collinge J and Walsh DM, The Journal of neuroscience: the official journal of the Society for Neuroscience, 2010, 30, 14411–14419. [DOI] [PMC free article] [PubMed] [Google Scholar]
- 10.McDonald JM, O’Malley TT, Liu W, Mably AJ, Brinkmalm G, Portelius E, Wittbold WM 3rd, Frosch MP and Walsh DM, Alzheimerx’s & dementia: the journal of the Alzheimer’s Association, 2015, 11, 1286–1305. [DOI] [PMC free article] [PubMed] [Google Scholar]
- 11.Kawarabayashi T, Shoji M, Younkin LH, Wen-Lang L, Dickson DW, Murakami T, Matsubara E, Abe K, Ashe KH and Younkin SG, The Journal of neuroscience: the official journal of the Society for Neuroscience, 2004, 24, 3801–3809. [DOI] [PMC free article] [PubMed] [Google Scholar]
- 12.Shankar GM, Li S, Mehta TH, Garcia-Munoz A, Shepardson NE, Smith I, Brett FM, Farrell MA, Rowan MJ, Lemere CA, Regan CM, Walsh DM, Sabatini BL and Selkoe DJ, Nature medicine, 2008, 14, 837–842. [DOI] [PMC free article] [PubMed] [Google Scholar]
- 13.Breydo L and Uversky VN, FEBS Letters, 2015, 589, 2640–2648. [DOI] [PubMed] [Google Scholar]
- 14.Lee SJC, Nam E, Lee HJ, Savelieff MG and Lim MH, Chemical Society Reviews, 2017, 46, 310–323. [DOI] [PubMed] [Google Scholar]
- 15.Cline EN, Bicca MA, Viola KL and Klein WL, Journal of Alzheimer’s disease: JAD, 2018, 64, S567–s610. [DOI] [PMC free article] [PubMed] [Google Scholar]
- 16.Kim B-H, Palermo NY, Lovas S, Zaikova T, Keana JFW and Lyubchenko YL, Biochemistry, 2011, 50, 5154–5162. [DOI] [PMC free article] [PubMed] [Google Scholar]
- 17.Lv Z, Roychaudhuri R, Condron MM, Teplow DB and Lyubchenko YL, Scientific reports, 2013, 3, 2880. [DOI] [PMC free article] [PubMed] [Google Scholar]
- 18.Maity S and Lyubchenko YL, Jacobs journal of molecular and translational medicine, 2015, 1, 004. [PMC free article] [PubMed] [Google Scholar]
- 19.Lv Z, Krasnoslobodtsev AV, Zhang Y, Ysselstein D, Rochet JC, Blanchard SC and Lyubchenko YL, Biophysical journal, 2015, 108, 2038–2047. [DOI] [PMC free article] [PubMed] [Google Scholar]
- 20.Lv Z, Krasnoslobodtsev AV, Zhang Y, Ysselstein D, Rochet JC, Blanchard SC and Lyubchenko YL, Biopolymers, 2016, 105, 715–724. [DOI] [PMC free article] [PubMed] [Google Scholar]
- 21.Zhang Y, Hashemi M, Lv Z and Lyubchenko YL, Nanoscale, 2016, 8, 18928–18937. [DOI] [PMC free article] [PubMed] [Google Scholar]
- 22.Zhang Y and Yuri L. Lyubchenko, Biophysical journal, 2014, 107, 2903–2910. [DOI] [PMC free article] [PubMed] [Google Scholar]
- 23.Shlyakhtenko LS, Gall AA and Lyubchenko YL, Methods in molecular biology (Clifton, N.J.), 2013, 931, 295–312. [DOI] [PMC free article] [PubMed] [Google Scholar]
- 24.Banerjee S, Hashemi M, Lv Z, Maity S, Rochet JC and Lyubchenko YL, Scientific reports, 2017, 7, 45592. [DOI] [PMC free article] [PubMed] [Google Scholar]
- 25.Kim BH and Lyubchenko YL, Nanomedicine: nanotechnology, biology, and medicine, 2014, 10, 871–878. [DOI] [PMC free article] [PubMed] [Google Scholar]
- 26.Tong Z, Mikheikin A, Krasnoslobodtsev A, Lv Z and Lyubchenko YL, Methods (San Diego, Calif.), 2013, 60, 161–168. [DOI] [PMC free article] [PubMed] [Google Scholar]
- 27.Bouchiat C, Wang MD, Allemand J, Strick T, Block SM and Croquette V, Biophysical journal, 1999, 76, 409–413. [DOI] [PMC free article] [PubMed] [Google Scholar]
- 28.Ganchev DN, Cobb NJ, Surewicz K and Surewicz WK, Biophysical journal, 2008, 95, 2909–2915. [DOI] [PMC free article] [PubMed] [Google Scholar]
- 29.Torre B, Ricci D and Braga PC, Methods in molecular biology (Clifton, N.J.), 2011, 736, 3–18. [DOI] [PubMed] [Google Scholar]
- 30.Bell GI, Science, 1978, 200, 618–627. [DOI] [PubMed] [Google Scholar]
- 31.Maity S, Hashemi M and Lyubchenko YL, Scientific reports, 2017, 7, 2344. [DOI] [PMC free article] [PubMed] [Google Scholar]
- 32.Escorihuela J, Marcelis ATM and Zuilhof H, Advanced Materials Interfaces, 2015, 2, 1500135. [Google Scholar]
- 33.Lee M, Kim JI, Na S and Eom K, Physical Chemistry Chemical Physics, 2018. 20 8951–8961. [DOI] [PubMed] [Google Scholar]
- 34.Ryu J, Girigoswami K, Ha C, Ku SH and Park CB, Biochemistry, 2008, 47, 5328–5335. [DOI] [PubMed] [Google Scholar]
- 35.Best MD, Biochemistry, 2009, 48, 6571–6584. [DOI] [PubMed] [Google Scholar]
- 36.Kim B-H and Lyubchenko YL, Nanomedicine: Nanotechnology, Biology and Medicine, 2014, 10, 871–878. [DOI] [PMC free article] [PubMed] [Google Scholar]
- 37.Lyubchenko YL, Kim BH, Krasnoslobodtsev AV and Yu J, Wiley interdisciplinary reviews. Nanomedicine and nanobiotechnology, 2010, 2, 526–543. [DOI] [PubMed] [Google Scholar]
- 38.Zhang Y, Hashemi M, Lv Z, Williams B, Popov KI, Dokholyan NV and Lyubchenko YL, The Journal of chemical physics, 2018, 148, 123322. [DOI] [PMC free article] [PubMed] [Google Scholar]
- 39.Barz B, Liao Q and Strodel B, Journal of the American Chemical Society, 2018, 140, 319–327. [DOI] [PubMed] [Google Scholar]
- 40.Tycko R, Neuron, 2015, 86, 632–645. [DOI] [PMC free article] [PubMed] [Google Scholar]
Associated Data
This section collects any data citations, data availability statements, or supplementary materials included in this article.


