Summary:
Individuals vary widely in drug responses, which can be dangerous and expensive due to treatment delays and adverse effects. Growing evidence implicates the gut microbiome in this variability, however the molecular mechanisms remain largely unknown. We measured the ability of 76 diverse human gut bacteria to metabolize 271 oral drugs and found that many of these drugs are chemically modified by microbes. We combined high-throughput genetics with mass spectrometry to systematically identify drug-metabolizing microbial gene products. These microbiome-encoded enzymes can directly and significantly impact intestinal and systemic drug metabolism in mice and can explain drug-metabolizing activities of human gut bacteria and communities based on their genomic contents. These causal links between microbiota gene content and metabolic activities connect interpersonal microbiome variability to interpersonal differences in drug metabolism, which has implications for medical therapy and drug development across multiple disease indications.
Following administration, drug molecules typically undergo chemical modification(s) and resulting metabolites can have distinct functional and toxicological properties from their parent drug1. Most drugs are delivered orally and can encounter commensal microbes in the small and large intestine. These microbes collectively encode 150-fold more genes than the human genome, encompassing a rich enzyme repository with drug-metabolizing potential. Indeed, anecdotal examples of interactions between the gut microbiome and drugs or drug metabolites have been reported, with intestinal and systemic pharmacological effects. Such compound modifications by gut microbes can lead either to their activation (e.g., sulfasalazine2), inactivation (e.g., digoxin3), or toxification (e.g., sorivudine/brivudine4,5 and irinotecan6). For a few drugs, microbial biotransformation has been assigned to specific bacterial strains and gene products3,5,7. However, these examples are the exception, as the field has little systematic understanding of the scope, specificity, or microbial/chemical determinants of microbiome-drug interactions8.
We set out to systematically assay microbe-drug interactions by measuring the ability of representative human gut bacteria to metabolize structurally diverse drugs and by identifying drug-metabolizing microbial gene products. We establish that these drug-metabolizing microbial proteins can contribute to in vivo drug metabolism of gnotobiotic mice, and provide evidence that (metagenomic) sequence data can explain the capacity of isolated gut bacteria and complete communities to convert specific drugs. This could provide a means to mechanistically connect microbiome information to interpersonal variation in drug metabolism and toxicity.
Identification of drug-metabolizing bacteria from the human gut microbiome
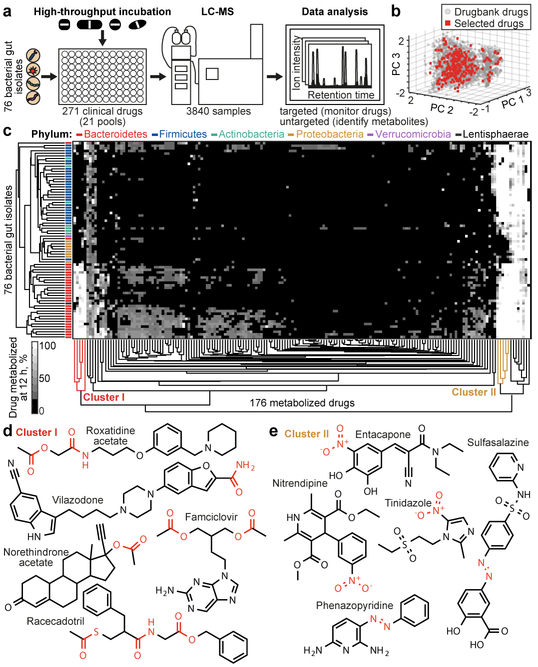
We first assessed the capacity of 76 bacterial species/strains, that represent the major phyla of the human gut microbiome, to chemically modify medical drugs in vitro (Fig. 1a, Supplementary Table 1). We employed a previously established combinatorial pooling strategy9 to assign 271 drugs across 21 pools, so that each drug is represented in quadruplicate but shares a pool with any other drug at most twice (Extended Data Fig. 1a). The 271 drugs were selected to span chemical drug space, resulting in a selection of diverse clinical indications (excluding antibiotics), physicochemical properties, and predicted intestinal concentrations (Fig. 1b, Extended Data Fig. 1b-d, Supplementary Table 2). We incubated each gut species/strain with each drug pool and three vehicle controls under anaerobic conditions and measured drug concentrations before and after a 12-hour incubation by liquid chromatography-coupled mass spectrometry (LC-MS). The analyzed 3840 samples comprise a total of 20,596 bacteria-drug interactions, measured in quadruplicate.
Fig. 1. Drug-metabolizing activities of human gut bacteria.
a, Schematic representation of the assay. b, Chemical diversity of tested compounds compared to 2099 clinical drugs (DrugBank31). c, Heatmap of the 176 drugs metabolized by at least one of the 76 human gut bacterial strains. Strains and drugs are arranged by hierarchical clustering according to metabolic activities. d, e, Examples of drugs that cluster together according to their metabolism. See methods and Supplementary Table 3 for statistics and reproducibility.
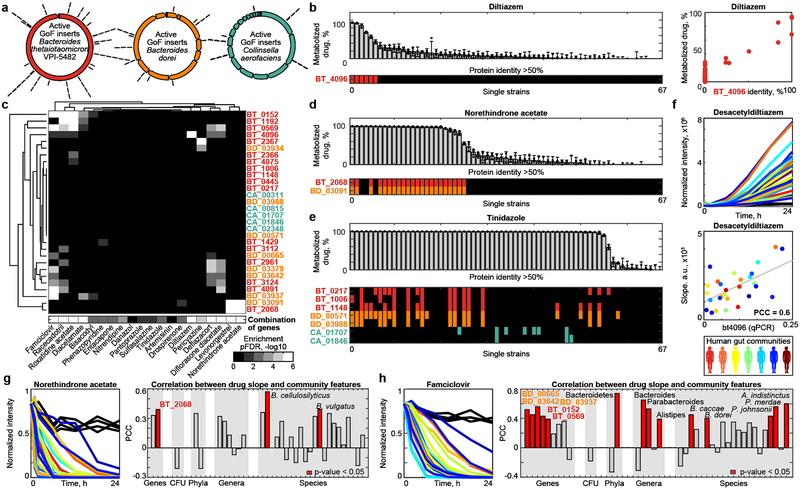
We discovered that the levels of two thirds (176) of the assayed drugs are significantly reduced (>20%, FDR-corrected p-value (pFDR) ≤ 0.05) by at least one bacterial strain and that each strain metabolizes 11–95 different drugs (Extended Data Fig. 1e-g, Supplementary Table 3). Drug levels were largely unchanged in no-bacteria controls buffered to pH 4–7, controlling for acidification of the culture media. By contrast, levels of positive control drugs expected to be metabolized by gut bacteria10, such as sulfasalazine, lovastatin, omeprazole, and risperidone, were significantly decreased over time (>20%, pFDR ≤ 0.05; Extended Data Fig. 2a). Clustering the bacterial isolates according to their drug-metabolizing activities recapitulates their phylogenetic relationships to the strain level and reveals phylum-specific metabolic activities (Fig. 1c, Extended Data Fig. 3a). Clustering the drugs based on this data groups compounds that share structural features, revealed by functional group and maximum common substructures analysis (Fig. 1d-e, Extended Data Fig. 3b, Supplementary Table 4). This suggests possible chemical targets for metabolic modifications by bacteria. For example, drugs specifically metabolized by bacteroidetes (Fig. 1c, cluster I) contain ester or amide groups that could be hydrolyzed, whereas compounds metabolized by most bacteria except proteobacteria (Fig. 1c, cluster II), all contain a nitro or azo-group, prone to reduction in anaerobic metabolism. Indeed, functional group analysis suggests that certain chemical substructures, such as lactones, nitro, azo, and urea groups predispose compounds for microbial metabolism (Extended Data Fig. 2b). Interestingly, chemical groups previously reported to be targeted by microbial metabolism10 (e.g., esters, amides) are also found among drugs that are not metabolized by any of the tested bacteria, suggesting additional structural specificity to microbial drug metabolism.
Identification of bacteria-produced drug metabolites
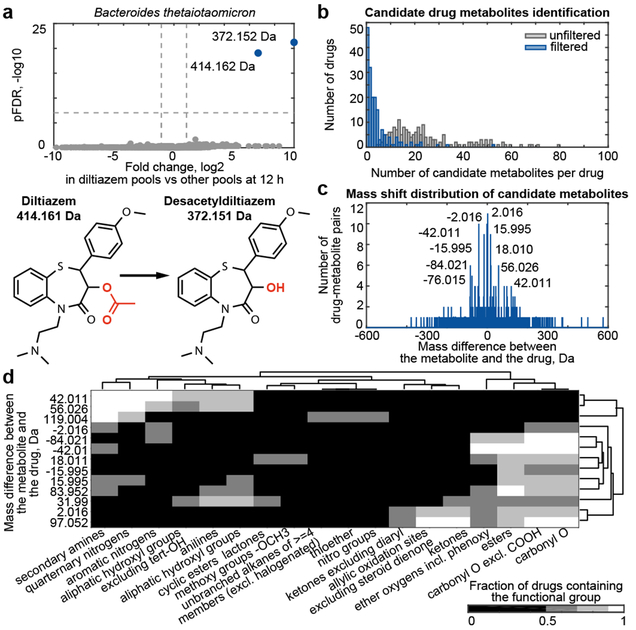
To identify products of bacterial drug metabolism and gain insights into the chemistry of observed biotransformations, we conducted untargeted metabolomics analysis of all samples. For each bacterial isolate, we identified compounds that solely occur in the presence of a specific drug (e.g., Fig. 2a). This resulted in 6531 different drug-compound pairs for all 20,596 tested bacteria-drug interactions (log2 fc ≥ 1, pFDR ≤ 10−6) (grey bars, Fig 2b). To eliminate measurement artifacts, we applied data filtering based on chromatographic retention, mass defects of drugs and their putative metabolites, and ion fragmentation. In addition, we only included compounds which significantly accumulated (log2 fc ≥ 1, pFDR ≤ 0.05) while their associated parent drug decreased upon bacterial incubation. This analysis correctly identifies reported microbe-derived drug metabolites10 (e.g., metabolites of sulfasalazine, paliperidone, and pantoprazole, Supplementary Table 5). We found 868 candidate drug metabolites that are specific to the presence of a given drug; these represent direct products of bacterial drug modifications or bacterial responses that are unique to a specific drug (blue bars, Fig 2b, Supplementary Tables 5-6).
Fig. 2. Bacteria-derived drug metabolites.
a, Representative volcano plot showing compounds detected by untargeted metabolomics associated with a specific drug metabolized by a given bacterial strain (e.g., diltiazem metabolism by B. thetaiotaomicron). The 4 pools containing a given drug are compared to all other pools (x-axis, fold change; y-axis, pFDR). Experimentally determined masses of diltiazem-associated compounds are indicated. Compounds significantly associated with diltiazem pools are shown in blue, others are in gray. b, Number of drug-specific compounds detected before (grey) and after (blue) measurement artifact elimination. c, Mass shifts detected between drugs and their specific metabolites. d, Chemical group enrichment analysis of drugs undergoing the same mass shift upon microbial conversion. Mass differences and chemical groups are arranged by hierarchical clustering according to the fraction of metabolized drugs containing a specific chemical group. See methods and Supplementary Tables 5-6 for statistics and reproducibility.
To gain insights into the chemistry of microbial drug metabolism, we calculated the mass difference between each drug-specific metabolite identified and its associated drug. The resulting differences were not randomly distributed: discrete mass differences appeared multiple times, suggesting conserved metabolic transformations of different drugs (Fig. 2c). The measurements’ high mass accuracy, together with drug structures, suggest chemical modifications that result in both decreased and increased masses: the negative mass differences −2.016, −15.995, and −42.011 suggest oxidation (-H2), reduction (-O), and deacetylation (-C2H2O), respectively, whereas the positive mass differences +2.016, +15.995, +18.010, +42.011, and +56.026 suggest hydrogenation (+H2), oxidation (+O), hydroxylation (+H2O), acetylation (+C2H2O), and propionylation (+C3H4O), respectively (Fig. 2c, Supplementary Tables 5-6). To systematically identify structural targets of microbial metabolism, we performed functional group analysis on sets of drugs sharing a specific mass difference with respect to their metabolite (Fig. 2d, Supplementary Table 4). As expected, all drugs that undergo either deacetylation or hydrogenation contain an acetyl ester or an alkene group (Extended Data Fig. 4a). Intriguingly, most drugs predicted to be acylated contain an aliphatic amine or hydroxyl, suggesting N- and O-acylation (further characterized below).
To assess whether drug metabolism of axenic bacterial cultures can translate to animal models and to complete human gut microbial communities, we focused on dexamethasone, a corticosteroid uniquely metabolized by Clostridium scindens (ATCC 35704) in our screen. This desmolytic (side-chain cleaving) activity produces the androgen-form of the drug (Extended Data Fig. 4b-c)11,12. We administered an oral dose of dexamethasone or vehicle to either germfree (GF) or C. scindens mono-colonized gnotobiotic (GNC. scindens) mice and quantified dexamethasone and its androgen metabolite in different body compartments (7 h after administration, corresponding to two serum drug half-lives, Extended Data Fig. 5a, Supplementary Table 7). Dexamethasone was detected in the cecum of mice from both groups, with a significant reduction in GNC.scindens, and the androgen metabolite accumulated to greater levels in cecum and serum of GNC.scindens mice compared to the GF controls. This demonstrated that the drug reaches the lower intestine, which carries high bacterial density (1.24±0.3*109 CFUs per gram luminal contents; n=4), and that dexamethasone is metabolized in vivo by an intestinal microbe, which affects serum metabolite levels (Extended Data Fig. 5b, Supplementary Table 8). This likely extends to other corticosteroids, as we also found prednisone, prednisolone, cortisone and cortisol to be desmolytically metabolized by C. scindens (ATCC 35704) (Extended Data Fig. 5c). Notably, anaerobic incubation of dexamethasone with fecal cultures from 28 healthy human donors illustrates significant interpersonal variation in drug metabolizing activity, but this capacity neither correlates with bacterial culture density nor with the abundance of C. scindens in a community (Extended Data Fig. 5d-f, Supplementary Table 9). This is consistent with previous reports that C. scindens metabolizes endogenous steroid hormones in a strain-specific manner13 and suggests that other bacterial taxa may also metabolize dexamethasone. Together, these results (and those of others3) emphasize that species identity is often insufficient to explain bacterial drug metabolism, and that identification of gene markers directly associated with enzymatic drug conversion may instead be necessary.
Identification of drug-metabolizing gene products
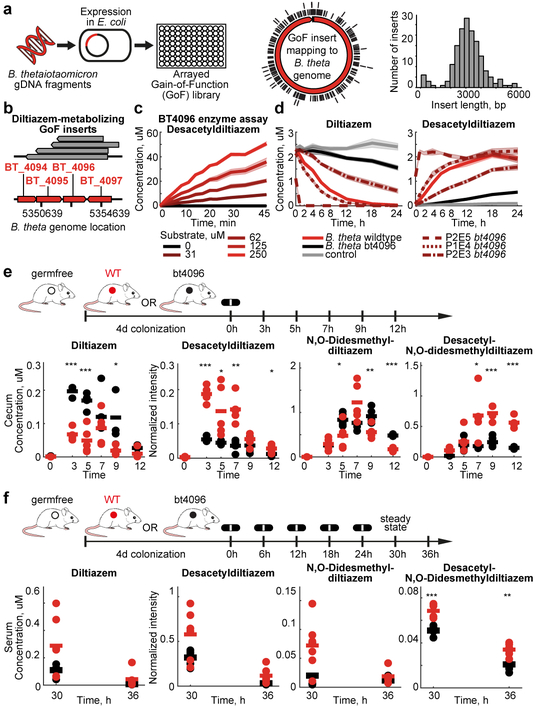
Many of the drug modifications found in the initial screen were generic, such as hydrolyses and reductions, making it challenging to predict responsible gene products from genomic sequences alone. Therefore, we developed a gain-of-function approach to identify DNA fragments from any source species that confer drug metabolic capacity to a heterologous host. To establish this protocol, we selected Bacteroides thetaiotaomicron, which metabolized 46 different drugs including diltiazem, as an exemplary source species (Extended Data Fig. 6a). First, we isolated and sheared B. thetaiotaomicron gDNA to 2–8 kb fragments, cloned them into an E. coli expression vector, and arrayed 51,000 transformed E. coli clones in 384-well format. Sequencing 160 randomly selected clones revealed a mean insert length of 3.1 kb suggesting a homogenous ~25-fold genome coverage for the entire library (Fig. 3a). Second, we assembled 133 pools of 384 clones, incubated them with a mixture of the drugs metabolized by B. thetaiotaomicron, and measured drug and drug metabolite levels over time to identify active library plates that included clones that gained specific drug-metabolizing capacities (e.g., Extended Data Fig. 6b). Third, we pooled rows and columns of active library plates and repeated the drug metabolism assay to identify the plate position (bacterial clone) that gained drug metabolizing function (e.g., Extended Data Fig. 6c). Fourth, we sequenced the gDNA inserts carried by these active clones (e.g., Fig 3b). To validate the identified genes (e.g., bt4096 for diltiazem metabolism), we i) repeated drug-metabolizing assays with expression constructs carrying PCR-amplified gene sequences (Extended Data Fig. 6d-e), ii) demonstrated that the purified enzyme catalyzes the drug transformation (Fig. 3c), and iii) established that in-frame deletion of bt4096 in B. thetaiotaomicron leads to loss of diltiazem-metabolizing activity in vitro, which is restored by gene complementation in a heterologous genomic location (Fig. 3d).
Fig. 3. Identification and in vivo characterization of microbial drug-metabolizing gene products: B. thetaiotaomicron diltiazem metabolism as an example.
a, Scheme for generation of an arrayed gain-of-function library, source genome coverage, and insert size distribution of the B. thetaiotaomicron library. b, Mapping of active insert sequences to the B. thetaiotaomicron genome. c, Enzymatic validation using purified BT4096. d, Diltiazem-metabolizing activity of B. thetaiotaomicron wildtype, bt4096 mutant, and bt4096 complemented strains at different expression levels (promoter strength: P2E5 > P1E4 > P2E3). e, Intestinal kinetics of diltiazem and deacetylated diltiazem metabolites after single oral diltiazem administration to mice mono-colonized with either B. thetaiotaomicron wildtype or bt4096 mutant strains. f, Serum levels of diltiazem and deacetylated diltiazem metabolites after serial oral diltiazem administration to mice mono-colonized with either B. thetaiotaomicron wildtype or bt4096 mutant strains. In (c-d) shaded areas depict the mean and STD of independent assays/cultures (n=4). For (e-f): times reflect hours after oral diltiazem administration and horizontal lines depict the mean per timepoint. * p ≤ 0.05, ** ≤ 0.01, *** ≤ 0.001 (pFDR). See methods and Supplementary Tables 10-11 for statistics and reproducibility.
Diltiazem is an oral calcium channel blocker used in the treatment of hypertension, arrhythmia, and angina pectoris. The drug is metabolized in vivo to multiple metabolites that maintain variable inhibition of calcium channels and are targets of distinct hepatic cytochromes, which gives rise to numerous potential drug-drug interactions14,15. Therefore, we assessed the impact of bacterial activity on intestinal and systemic levels of diltiazem and its metabolites. We colonized germfree mice with either B. thetaiotaomicron wildtype or the bt4096 deletion strain, orally administered diltiazem, and quantified the kinetics of the drug and 9 drug metabolites in 9 body compartments (Extended Data Fig. 6f and 7). Intestinal drug and metabolite levels demonstrate that deacetylation of both diltiazem and diltiazem metabolites in the gut is bt4096-dependent (Fig. 3e, Extended Data Fig. 6g and 8a, Supplementary Tables 10-11). Bacterial contribution to diltiazem metabolism is further accentuated when repeated oral doses (simulating typical treatment schemes) are administered; this also demonstrates the contribution of a single gut bacterial gene to systemic drug metabolism (Fig. 3f, Extended Data Fig. 8b, Supplementary Tables 10-11).
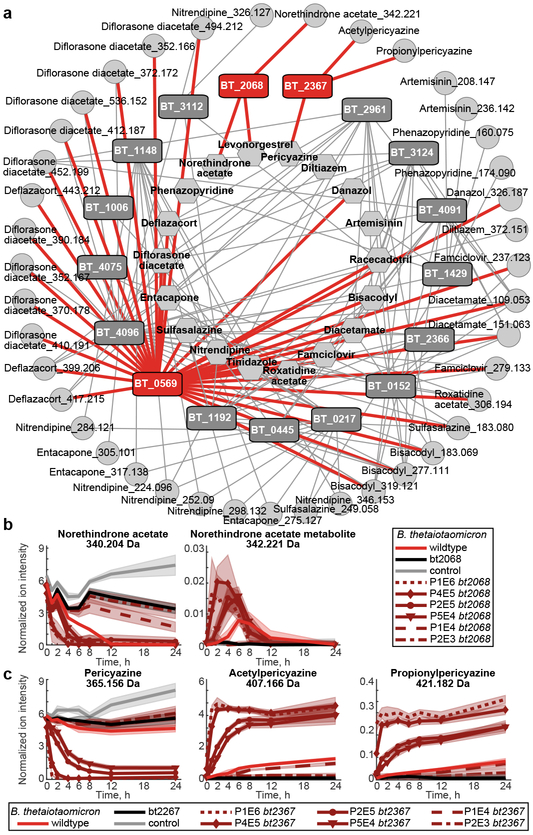
Using this gain-of-function approach, we identified 16 additional B. thetaiotaomicron gene products that (together with BT4096) metabolize 18 different drugs to 41 distinct metabolites; each validated by targeted cloning and expression in E. coli (Supplementary Tables 12-13). The resulting network of bacterial gene products, metabolized drugs, and produced drug metabolites reveals the specificity and cross-activity of these enzymes (Fig. 4a). For example, BT0569 shows promiscuous hydrolase activity towards many structurally diverse drugs; BT2068 targets two and BT2367 only one of the 18 drugs metabolized by the gain-of-function library. Although the gain-of-function approach can identify redundant enzymes, none were found in the B. thetaiotaomicron genome for BT2068- or BT2367-activities (Extended Data Fig. 9a-b). Indeed, in-frame gene deletion and complementation studies in B. thetaiotaomicron confirm that bt2068 and bt2367 expression is required and rate-limiting to metabolize norethindrone acetate and pericyazine, respectively (Fig. 4b-c). Wildtype and bt2068-complemented strains accumulate a norethindrone acetate metabolite that is 2.016 Da heavier than the parent drug, suggesting its reduction. BT2068 also metabolizes the structurally related compounds levonorgestrel and progesterone (Extended Data Fig. 9c-d). Bt2367 encodes a putative acyltransferase; notably, B. thetaiotaomicron converts pericyazine to metabolites with masses consistent with acetyl- and propionylpericyazine (Fig. 4c). Incubation of purified BT2367 with pericyazine and structurally related substrates together with reaction product LC-MS/MS analysis demonstrates that this enzyme uses acetyl-CoA and propionyl-CoA as cofactors to O-acylate pericyazine (Extended Data Fig. 9e-g). Together, the developed approach systematically identifies microbiome-encoded drug-metabolizing gene products resulting in gene-drug-metabolite networks that provide mechanistic insights into microbiome (drug) metabolism.
Fig. 4. Genome-wide identification of drug-metabolizing gene products in B. thetaiotaomicron.
a, Network of enzyme-substrate-product drug metabolic interactions for B. thetaiotaomicron. Each node represents an enzyme (rectangles), a drug substrate (hexagons) or a metabolite product (circles), and each edge represents a validated metabolic interaction (targeted cloning of the gene into E. coli results in metabolism of a given drug or production of a specific drug metabolite). b, Norethindrone acetate-metabolizing activity of B. thetaiotaomicron wildtype, bt2068 mutant, and complemented strains. c, Pericyazine-metabolizing activity of B. thetaiotaomicron wildtype, bt2367 mutant, and complemented strains. In (b-c), promoter strengths are P1E6 > P4E5 >P2E5 > P5E4 >P1E4 > P2E3. Shaded areas depict the mean and STD of independent cultures (n=4). See methods for statistics and reproducibility.
Microbial gene products explain human gut bacteria and community drug metabolism
To further expand our understanding of microbiome drug metabolism, we used the gain-of-function approach to identify 13 drug-metabolizing gene products from Bacteroides dorei and Collinsella aerofaciens that collectively metabolize 16 drugs (Fig. 5a, Extended Data Fig. 10a-b, Supplementary Table 13). We next assessed whether the genomic presence of homologs of these identified drug-metabolizing gene products can explain drug metabolism activities across the 76 bacterial strains (Fig. 1c). For example, homologs of the diltiazem-metabolizing enzyme BT4096 indicate diltiazem-metabolizing activity of these gut bacteria (Fig. 5b, Supplementary Table 14). To systematically investigate whether the identified drug-metabolizing gene products explain drug metabolism activities of the tested species, we performed gene set enrichment analysis for the identified gene products among bacterial strains metabolizing specific drugs16. Indeed, many of the identified drug-metabolizing gene products show significant enrichment and hence likely contribute to the observed microbial drug metabolism (Fig. 5c, Supplementary Table 15). For example, the set of bacterial strains metabolizing norethindrone acetate is significantly enriched for a homolog to BD03091 and BT2068 (pFDR < 10−7), which are also homologous to one another (Fig. 5d, Extended Data Fig. 10c-d, Supplementary Tables 14-15). In fact, all strains carrying a BD03091/BT2068 homolog also metabolize norethindrone acetate, whereas only three of the norethindrone acetate-metabolizing strains do not encode such an enzyme homolog. We repeated the enrichment analysis using combinations of identified (including non-homologous) enzymes that metabolize the same drug. The combination of enzyme sequences originating from different bacterial species targeting the same drug(s) further increases enrichment significance and the ability to explain microbial drug metabolism from genomes (Fig. 5c, Extended Data Fig. 10d-e, Supplementary Table 15). For example, we identified tinidazole-metabolizing gene products from three different bacterial species (Fig. 4a, Extended Data Fig. 10b), none of which individually is significantly enriched among tinidazole-metabolizing bacteria; however, their combination significantly (pFDR = 0.0045) explains tinidazole metabolism across species (Fig. 5c, e, Extended Data Fig. 10c-d).
Fig. 5. Microbiome-encoded drug-metabolizing gene products explain drug metabolism of gut bacterial strains and communities.
a, Genes identified from libraries of B. thetaiotaomicron, B. dorei, and C. aerofaciens genomic DNA. b, Diltiazem metabolism rates for the 67 bacterial strains from Figure 1 with available genome sequences, presence of BT4096 homologs in their genomes, and comparison between maximal BT4096 identity and diltiazem metabolism of each strain. c, Gene set enrichment analysis for specific drug-metabolizing gene products and their combinations among the bacterial strains metabolizing each drug. Enrichment is shown for single (upper panel) and combined (lower panel) drug-metabolizing gene products among sets of bacterial strains metabolizing a given drug. d-e, Norethindrone acetate and tinidazole metabolism of the 67 genome-sequenced gut bacteria and presence of homologs of identified drug-metabolizing gene products. f, Diltiazem conversion to desacetyldiltiazem by 28 different human gut communities and correlation between microbiota diltiazem-metabolizing activity and qPCR-measured abundance of bt4096 homologs. g-h, Metabolism of norethindrone acetate and famciclovir by 28 different human gut communities. Right panels provide correlation coefficients between community drug metabolizing activity and the metagenomic abundance of drug metabolizing bacterial gene products, species, genera and phyla identified in this study. For (f-h) each color represents a different human donor, lines depict the mean of n=4). See methods and Supplementary Tables 14-16 and 18-19 for statistics and reproducibility.
To test whether the abundance of encoded drug metabolizing gene products can also explain drug metabolism of a complex microbial gut community, we used the diltiazem-metabolizing enzyme BT4096 as an example. We measured ex vivo diltiazem deacetylation kinetics of fecal samples collected from 28 unrelated human donors. These gut communities exhibited significant differences in their diltiazem-metabolizing capacity, which correlates with bt4096 homolog abundance (measured by qPCR), but not bacterial density or B. thetaiotaomicron abundance (Fig. 5f, Extended Data Fig. 11a-b, Supplementary Table 16). Although diltiazem deacetylation is a chemically simple reaction, it requires a specific enzyme that is heterogeneously represented across strains and communities. As a result, gene abundance can partially explain the drug metabolizing capacity of individual gut isolates and of human gut microbial communities. To generalize this approach, we performed metagenomic sequencing of the 28 bacterial communities (Extended Data Fig. 11c, Supplementary Tables 17-18). Consistent with the qPCR analysis, the abundance of BT4096 sequence homologs in this metagenomic data highly correlated with the communities’ diltiazem deacetylation activity (Extended Data Fig. 11d, Supplementary Table 19). Unlike qPCR, metagenomic analysis does not rely on specific primers, which allowed us to examine whether less conserved drug-metabolizing genes also correlate with the drug metabolizing capacity of an individual’s microbiome. To this aim, we measured the ex vivo activity of the 28 communities to metabolize two additional drugs, norethindrone acetate and famciclovir, and quantified the metagenomic abundance of bacterial phyla, genera, species and gene products that we identified in the strain- and enzyme-targeted screens to metabolize these two drugs. We found that the gene abundance of identified drug-metabolizing proteins significantly (p-value < 0.05) correlated with the communities’ capacity to metabolize the respective drug (Fig. 5g-h, Extended Data Fig. 11e-f, Supplementary Table 19). In the case of famciclovir, we also found significant correlations between drug-metabolizing microbiota activity and the abundance of certain bacterial species and broader phylogenetic groups, which is consistent with the results of the initial screen shown in Fig. 1c. These results provide a prospective approach to better understand and potentially predict microbiome drug metabolism, in cases when a drug-modifying reaction is catalyzed by a single gene product and also in cases mediated through the metabolic activity of defined members of a microbial community.
Discussion:
We provide an outline of the drug-metabolic activity of human gut bacteria and found that about two thirds of the 271 assayed drugs are metabolized by at least one strain in our survey. Notably, food and endogenous compounds likely serve as physiological substrates for many of these chemical transformations, as illustrated for cortisol and progesterone metabolism. We further developed an approach for microbiome-wide identification of (drug)-metabolic gene products and we validated 30 microbiome-encoded enzymes that collectively convert 20 drugs to 59 candidate metabolites. Depending on the drug and its formulation, we anticipate that such microbiome drug metabolism could play a role in determining intestinal and systemic drug and drug metabolite exposure. Together, these results complement previous studies that highlight the impact of drugs on bacterial fitness and microbiome composition17,18, and others that identify microbiome-induced changes in hepatic drug metabolism19,20. Further, this study provides a mechanistic understanding of microbiome (drug) metabolism that may enable rational strategies to manipulate individuals’ microbiota to beneficially alter metabolic microbiome-host interactions.
Methods:
Chemicals
Screened drugs were picked from the Pharmakon1600 library (MicroSource Discovery Systems) and pooling was performed by the Yale Center for Molecular Discovery. Compounds for follow-up studies were purchased individually (see Supplementary Table 20 for details). LC-MS grade solvents were from Fisher Scientific and other chemicals were from Sigma Aldrich, if not otherwise indicated.
Bacterial Culture Conditions
Bacterial strains used in this study are listed in Supplementary Table 1.
Anaerobic culture conditions –
A flexible anaerobic chamber (Coy Laboratory Products) containing 20% CO2, 10% H2, and 70% N2 was used for all anaerobic microbiology steps. All anaerobic culturing was performed on brain-heart-infusion (BHI; Becton Dickinson) agar supplemented with 10% horse blood (Quad Five Co.). Liquid cultures of bacterial gut isolates and whole communities for drug degradation assays were grown in Gut Microbiota Medium (GMM)21. To make unmarked deletion and complementation strains, B. thetaiotaomicron VPI-5482 (ATCC 29148) derived strains were grown anaerobically at 37°C in liquid TYG medium and on TYG agar supplemented with hemin and vitamin K22. For selection, gentamicin 200 μg/mL, erythromycin 25 μg/mL, and/or 5-fluoro-2-deoxy-uridine (FUdR) 200 μg/mL were added as indicated. CFU (colony forming unit) counting to determine mouse gut colonization levels and in vitro culture densities was performed anaerobically on BHI blood agar.
Aerobic culture conditions –
Escherichia coli strains for molecular cloning were grown aerobically at 37°C in LB medium (200 rpm shaking) and on LB agar supplemented with carbenicillin (100 µg/mL) or kanamycin (50 µg/mL).
Preparing Gain-of-Function Libraries, Strain Pooling, and Hit Validation
Bacterial strains, plasmids, and primers are listed in Supplementary Tables 1 and 12.
Preparing gain-of-function libraries –
Heterologous expression libraries were prepared as previously described23. In brief, genomic DNA was extracted from overnight cultures of the source bacterial strain24. DNA was sheared to 2–8 kb by focused ultrasonication (Covaris E220 with miniTUBE red) and fragments were cloned into PCR-linearized expression vector pZE21 (primer #1–2) by blunt-ended ligation (Epicentre FastLinkTM kit). Before transformation, the ligation products were separated on a 0.5% agarose gel, the region between 5 and 10 kb was excised and DNA was extracted using a gel extraction kit (Qiagen). Ligation products were transformed into E. cloni®10G Elite competent cells (Lucigen) by electroporation. Overnight grown colonies were picked and arrayed in 384-well format into liquid LB medium supplemented with kanamycin using a colony picking robot (Molecular Devices QPix 420). After incubation overnight at 37°C, plates were replicated in duplicate onto LB agar plates supplemented with kanamycin. The first plate served for the initial drug assay described below to identify plates that contain drug-metabolizing gain-of-function hits. The second plate was stored at 4°C for use in the secondary assay to localize drug metabolizing clones within active plates as described below. Primer #3–4 were used for Sanger sequencing of representative library clones and identified drug-metabolizing clones.
Hit validation by targeted gene expression in E. coli –
To validate identified drug-metabolizing gene products from gain-of-function screen, gene sequences were PCR-amplified (primer #5–54, #95–150), cloned into the pZE21 expression plasmid by either blunt-end ligation (T4 polynucleotide kinase and ligase, NEB) or Gibson cloning (NEBuilder HiFi DNA Assembly Kit, NEB), and electro-transformed E. cloni®10G Elite cells. Resulting strains were tested for specific drug-metabolizing activities.
Construction of B. thetaiotaomicron Targeted Mutants and Complementation Strains
Bacterial strains, plasmids, and primers are listed in Supplementary Tables 1 and 12.
Gene deletions and complementations –
A counter-selectable (FUdR, Sigma Aldrich) allelic exchange procedure25 was utilized to generate in-frame, unmarked deletions in a B. thetaiotaomicron VPI-5482 tdk background (wild type; WT) as described 5. In brief, primer #55–60, #63–68, #71–76, and #79–80 were used to generate pExchange-tdk suicide plasmids25 for deletion of bt2068, bt2367, and bt4096 by splicing by overlap extension PCR26, cloning via restriction sites BamHI and XbaI, plasmid sequencing, and PCR-screening of resolved clones after second DNA recombination event. Gene complementations at various expression levels were performed as described5,27 using primer #61–62, #69–70, #77–78, and #81–82 and pNBU2-derived plasmids that integrate into the genome in single copy. Bt4096 complementation using the highest expressing promoters was not successful, possibly due to enzyme toxicity at high expression levels.
Bacterial Drug Metabolism Assays
Drug assays with axenic cultures and fecal communities –
Frozen glycerol stocks of bacterial strains (Supplementary Table 1) were plated on BHI blood agar and incubated at 37°C under anaerobic conditions. Single colonies were inoculated into 6 mL pre-reduced GMM (supplemented with 1% w/v arginine for Eggerthella lenta) and incubated anaerobically at 37°C for 24 h (Akkermansia muciniphila for 48 h). Drug-conversion assays were performed as described5,21. In brief, bacterial cultures were diluted into fresh, pre-reduced GMM (1/5) containing tested drug(s) at 2 µM, incubated anaerobically until samples were collected and samples were stored at −80°C until further processing for analysis by LC-MS (see below).
Gain-of-function screen –
All 384 colonies of a single arrayed library agar plate (see Preparing gain of function libraries section above) were collected en masse by scraping and resuspended in 750 µl of GMM (1/5). 225 µl of the cell suspension and an 8-fold dilution thereof were combined with 25 µl of GMM (1/5) with a drug mixture and incubated anaerobically at 37°C. 20 µL samples were collected after 0, 1, 2, 4, 6, 8, 12 and 24 h of incubation. Plates corresponding to pools that exhibited the capacity to metabolize one or more of the tested drugs were replicated into a 384-well plate containing 70 µL of LB supplemented with kanamycin and cultures were grown aerobically for 12 h at 37°C. For groups of 2×2 active plates, pools were assembled from 20 µL of each culture corresponding to each row (2×16 pools) and to each column (2×24 pools) and tested for drug-metabolizing activity. Identified active gain-of-function clones were colony-purified, four independent colonies were retested for drug-metabolizing activity, and two of the verified, clonal cultures selected for Sanger sequencing of the plasmid inserts (primer #3–4).
Cloning, purification and enzymatic activity testing of BT4096 and BT2367
BT4096 –
Sequence analysis of bt4096 using the SignalP 4.0 server28 suggested an N-terminal export signal with a cleavage site between residues 20 and 21. The open reading frame without this signal sequence was PCR-amplified (primer #85–86) and cloned into the pASG-IBA105 (IBA GmbH) expression plasmid (N-terminal Twin-Strep-Tag® protein fusion and anhydrotetracycline-inducible expression) following the vendor’s protocol for StarGate® cloning. E. coli (E. cloni® 10G, Lucigen) containing a sequence-verified plasmid (primer #87–88) was aerobically cultured (220 rpm shaking) in 1L LB medium with carbenicillin and protein expression was induced with anhydrotetracycline (200 ng/mL) during mid-exponential growth (OD600 = 0.4–0.6). After 3 h, bacteria were collected by centrifugation (4000 x g) and lysed on ice by sonication (8 pulses of 15 s at 45% amplitude in intervals of 60 s) in the presence of protease inhibitors (cOmplete™ protease inhibitor cocktail, Sigma Aldrich). Affinity purification was performed using a gravity flow Strep-Tactin®XT Superflow® column (IBA GmbH) following the manufacturer’s recommendations. Protein purity was verified by SDS-PAGE and coomassie staining and quantified by Bradford protein assay using BSA as a standard (Biorad). Enzyme assays were performed in TrisHCl buffer (10mM, pH 7), supplemented with 2.5 mM MgSO4 and MnCl at 37°C; reaction volumes were 150 µL with BT4096 at 5 µg/µL and varying substrate concentrations: 250, 125, 62.5, 31.3, 15.6, 7.8, 3.9, 0 µM. 10 µL of sample were collected and quenched in ice-cold acetonitrile (10 µL) at times 30, 60, 90, 120, 150, 180, 210, 240, 300, 360, 480, and 600 s of incubation. Samples were stored at −80°C until further processing and analysis by LC-MS (see below).
BT2367 –
The bt2367 open reading frame was PCR-amplified (primer #83–84) and cloned into the pASG-IBA103 (IBA GmbH) expression plasmid (C-terminal Twin-Strep-Tag® protein fusion and anhydrotetracycline-inducible expression) following the vendor’s protocol for StarGate® cloning. E. coli (E. cloni® 10G, Lucigen) containing a sequence-verified plasmid (primer #87–88) was used to express and purify the enzyme as described for BT4096 above. Enzyme assays were performed in TrisHCl buffer (10mM, pH 7), supplemented with 2.5 mM MgSO4 and MnCl at 37°C; reaction volumes were 100 µL with BT2367 at 10 µg/mL and 1 mM of cofactor (either acetyl-CoA or propionyl-CoA) and 100 µM of substrate (either pericyazine, cyamemazine or 1-(3-aminopropyl)piperidin-4-ol) were used to test acyltransferase activity. 5 µL of sample were collected and quenched in ice-cold acetonitrile (15 µL) at times 0, 2.5, 5, 7.5, 10, 15, 20, 25, 30, 40, 50, and 60 min of incubation. Samples were stored at −80°C until further processing and analysis by LC-MS and LC-MS/MS (see below).
qPCR analysis
Fecal DNA was extracted from a biomass pellet of 500 µL community cultures (see above) as described24,29. The abundance of specific bacterial species or bt4096 homologs was assessed by qPCR (primer #89–94) as described previously9,30. A CFX96 instrument (BioRad) and SYBR FAST universal master mix (KAPA Biosystems) were used.
Animal experiments
All experiments using mice were performed using protocols approved by the Yale University Institutional Animal Care and Use Committee in accordance with the highest scientific, humane, and ethical principles and in compliance with federal and state regulations, including the Animal Welfare Act (AWA) and the Public Health Service (PHS).
Germfree (GF) 9–16 week old C57BL/6J mice were maintained in flexible plastic gnotobiotic isolators with a 12-hour light/dark cycle and GF status monitored by PCR and culture-based methods. Conventional C57BL/6J mice (Jackson Laboratories) were purchased at the age of 6–7 weeks and kept in the lab for 2–3 weeks before experiments. All mice were provided a standard, autoclaved mouse chow (5013 LabDiet, Purina) ad libitum.
Dexamethasone treatment –
Serum kinetics of dexamethasone following oral administration was determined using 20 (n = 4 per time point) conventional C57BL/6J mice treated with 10 mg/kg of dexamethasone suspension in PBS. One blood sample was collected from each animal into lithium heparin tubes (BD Life Sciences) by submandibular bleeding and a second sample was collected at time of euthanization. Serum was collected by centrifugation (2500 rcf, 4°C, 10 min) of heparinized blood and stored at −80°C until further processing and analysis by LC-MS (see below).
To compare dexamethasone metabolism between germfree mice and mice mono-colonized with C. scindens (ATCC 35704), individually caged germfree C57BL/6J mice were either directly treated with dexamethasone (as above) or colonized with C. scindens (ATCC 35704) by oral gavage of 200 µL of an overnight bacteria culture in GMM. After 4 days, bacterial loads were determined by CFU plating on BHI blood agar before dexamethasone was orally administered to the mice as described above. Mice were sacrificed 7 h after drug administration, serum was collected as described above and tissue samples were collected into sample tubes and snap-frozen. Fecal samples were collected before euthanization and re-suspended in PBS (1 mL) through vigorous shaking. 20 µL were then plated on BHI blood agar plates and incubated aerobically and anaerobically at 37°C to check animals for contamination.
Diltiazem treatment –
Germfree C57BL/6J mice were mono-colonized with B. thetaiotaomicron wild type or bt4096 mutant strain and bacterial loads were determined by CFU plating four days after colonization as described above. Single-dose treatment: 5 mice per timepoint and group were treated with 50 mg/kg of diltiazem suspension in PBS with 20% glycerol or solely vehicle for non-treated controls (n = 5 per group). One early blood sample (at 0.5, 1, 1.5, 2, and 2.5 h after drug administration) was collected from each animal by submandibular bleeding and a second sample was collected when mice were sacrificed (at 3, 5, 7, 9, and 12 h after drug administration). In addition to serum, the following tissues were collected after euthanization: luminal content of duodenum (SI), jejunum (SII), ileum (SIII), cecum, and colon, and feces, liver and bile. Samples were collected and stored as described above. Multiple-dose treatment: 6 and 5 mice mono-colonized with B. thetaiotaomicron wild type or bt4096 mutant strain, respectively were treated five times with 50 mg/kg of diltiazem suspension in PBS with 20% glycerol in intervals of 6 h. Six h after the last treatment, a blood sample was collected from each animal by submandibular bleeding and animals were sacrificed for sample collection as described above after an additional 6 h.
Mass Spectrometry Analysis of Drugs and Metabolites
Extraction of solid tissues and liquid samples –
Solid tissues and liquid samples were prepared for LC-MS and LC-MS/MS analysis by organic solvent extraction (acetonitrile:methanol, 1:1) at -20°C after the addition of internal standard mix (sulfamethoxazole, caffeine, ipriflavone, and yohimbine each to a final concentration of 80 nM) as described5,29.
LC-MS and LC-MS/MS analysis –
Analyses was performed as previously described5,29. In brief, chromatographic separation was performed by reversed-phase chromatography (C18 Kinetex Evo column, 100 mm x 2.1 mm, 1.7 mm particle size, and according guard columns, Phenomenex) using an Agilent 1200 Infinity UHPLC system and mobile phase A: H2O, 0.1% formic acid and B: methanol, 0.1% formic acid and column compartment was kept at 45°C. 5 µL of sample were injected at 100% A and 0.4 mL/min flow followed by a linear gradient to 95% B over 5.5 min and 0.4 mL/min. To ensure reproducible chromatographic separation (retention shifts between samples < 2% or 0.15min) columns were changed after 1000 sample injections. The qTOF (Agilent 6550) was operated in positive scanning mode (50 – 1000 m/z) with the following source parameters: VCap: 3500 V, nozzle voltage: 2000 V, gas temp: 225 °C; drying gas 13 L/min; nebulizer: 20 psig; sheath gas temp 225 C; sheath gas flow 12 L/min. Online mass calibration was performed using a second ionization source and a constant flow (5 µL/min) of reference solution (121.0509 and 922.0098 m/z). Tandem mass spectrometry analysis (LC-MS/MS) was performed using the chromatographic separation and source parameters described above and the auto-MS/MS mode of the instrument with a preferred inclusion list for parent ions with 20 ppm tolerance, Iso width set to ‘narrow width’ and collision energy to either 15, 20 or 30 eV. The MassHunter Quantitative Analysis Software (Agilent, version 7.0) was used for peak integration based on retention time and accurate mass measurement of chemical standards. Quantification of in vivo samples was based on dilution series of chemical standards spanning 0.001 to 10 µM and measured amounts were normalized by weights of extracted tissue samples. The MassHunter Qualitative Analysis Software (Agilent, version 7.0) and Mass Profiler Professional (Agilent, version 13.0) with standard parameters were used for untargeted feature extraction and peak alignment, respectively allowing tolerances for mass of 0.002 amu or 20 ppm and for retention time of 0.15min or 2%. Statistical analysis and plotting were performed in Matlab 2017b (MathWorks).
Analysis of drug metabolism screen
Identification of metabolized drugs –
For each bacterial strain, drug fold changes were calculated between time points 12 h and 0 h in the 4 pools that contained a specific drug (Supplementary Table 2), and between these drug-containing pools and the 3 non-drug controls at time points 0 h and 12 h. Statistical significance of the drug intensity differences was assessed with two-sided t-test (ttest2 function in MatLab), and p-values were FDR-corrected for multiple hypotheses testing using the Benjamini-Hochberg procedure (mafdr function in MatLab with ‘BHFDR’ parameter). To account for fast drug metabolism (within seconds after exposure), fold changes to control at time point 0 h were used for drug and strain combinations for which i) log2(fold change to control at t=0h) < −5 and ii) pFDR(fold change to control at t=0h) < 0.05 and iii) log2(fold change to control at t=0h) < log2(fold change at t=12h to t=0h). To account for variability in drug measurements, for each drug an adaptive fold change threshold was calculated as either (20%) or (mean+2std of the fold changes, for which log2(fold change at t=12h to t=0h) > 0, to account for measurement noise), whichever was greater. Hierarchical clustering was performed with clustergram function in MatLab using Euclidean distance between the drug fold change vectors for each bacterial strain.
Identification of candidate drug metabolites –
For each drug and each bacterial strain, intensities of all compounds detected in the drug-containing pools (n=4) versus all other pools (n=20) were compared by calculating fold change and statistical significance with two-sided t-test (ttest2 function in MatLab). All p-values were FDR-corrected for multiple hypotheses testing with Benjamini-Hochberg procedure (mafdr function in MatLab with ‘BHFDR’ parameter). The FDR-corrected p-value threshold for candidate drug metabolites was set to 10−6 based on the distribution of p-values of parent drugs in their corresponding four pools versus all other pools (combinatorial pooling scheme shown in Extended Data Fig. 1a, Supplemental Table 2). Briefly, histograms of the pFDR values calculated for the candidate metabolites were compared with the histograms of the pFDR values of the drugs detected in the corresponding drug pools (positive controls) and the pFDR values of metabolites calculated for a random pooling scheme not included in the experiment (negative controls). The pFDR distributions appeared to be bimodal, and findpeaks function in MatLab2017b was used to find the pFDR threshold that corresponds to the local minimum between the distribution peaks, thus separating high confidence pFDR values prevalent in the positive controls. Detailed analysis scheme, distribution plots and analysis scripts are available on GitHub (mszimmermann/drug-bacteria-gene_mapping).
Candidate metabolites were filtered according to the following exclusion criteria: i) metabolite intensity in the drug pools at t=0 h is > 104 ion counts (corresponding to twofold the minimal intensity for chromatographic feature extraction: 5*103 ion counts), and log2(fold change to other pools at t=0 h) < 1; or ii) metabolite intensity in the drug pools at t=12 h is > 104 ion counts, and log2(fold change to other pools at t=12 h) < 1; or iii) the difference of mass defects between the drug and the metabolite is > 0.2 amu; or iv) retention time difference between the drug and the metabolite is < 0.1 min; or v) metabolite mass is similar to one of the metabolites filtered at step iv) (mass difference < 0.002 amu) and retention time is similar to an unfiltered metabolite of the same drug (difference < 0.1 min). Additionally, metabolites were filtered based on whether the parent drug was metabolized, whether the metabolite was identified for a single drug or multiple drugs, and whether the metabolite was increasing in at least one strain at 12 h compared to 0 h (log2(fold change) > 1 and pFDR < 0.05). Mass difference between the parent drug and candidate metabolites were calculated for each drug-metabolite pair and smoothened with 0.002 Da window.
Chemoinformatics
Chemical similarity analysis –
Chemical similarity analysis between the 271 selected drugs and the 2099 clinically approved drugs from DrugBank31 was performed using Morgan chemical fingerprints calculated with AllChem.GetMorganFingerprintAsBitVect function from the RDKit AllChem module (Open Source Chemoinformatics, http://www.rdkit.org). Chemical fingerprints were converted into a binary matrix and subject to principal component analysis. Chemical structure similarity for the drug clusters identified with hierarchical clustering was performed using the maximum common substructure function in RDKit (rdFMCS.FindMCS).
Functional chemical group analysis –
For each drug, the existence of chemical functional groups was calculated with available functions from the rdkit.Chem.Fragments module (Open Source Chemoinformatics, http://www.rdkit.org). Functional group enrichment among metabolized drugs, drugs belonging to specific clusters, or drugs undergoing specific mass difference transformation upon bacterial metabolism, was calculated with Fisher’s exact test. All p-values were FDR-corrected for multiple hypotheses testing using the Benjamini-Hochberg procedure (mafdr function in MatLab with ‘BHFDR’ parameter).
Analysis of drug-metabolizing capacity of bacterial strains and communities
Protein sequence alignments –
Bacterial strains’ genome sequences and protein sequences of the candidate genes were downloaded from NCBI. Sequence similarity between the genomes and proteins of interest was assessed by searching the translated nucleotide database using protein query (tblastn) with default parameters32. Sequence similarity between candidate proteins was assessed with protein blast (blastp) with default parameters32. Protein similarity networks and drug-gene-metabolite networks were visualized in Cytoscape v3.4.033.
Gene set enrichment analysis –
Enrichment of strains encoding a given protein among strains metabolizing a given drug was assessed using the gene set enrichment procedure16. In brief, for each drug, the strains were sorted according to the percent of parent drug that was metabolized, and enrichment of strains encoding y% similar sequence to the protein of interest was calculated with Fisher’s exact test for each set of strains metabolizing more than x% of the drug, where x ranged between 100% and 20% (with step=20%) and y ranged between 100% and 50%. For enrichment analysis of gene combinations, maximal sequence similarity to the corresponding genes was used. The lowest p-value was recorded for each drug-gene pair. All p-values were FDR-corrected for multiple hypotheses testing using the Benjamini-Hochberg procedure (mafdr function in MatLab with ‘BHFDR’ parameter).
Analysis of microbial community drug metabolism –
For the human gut communities, drug metabolism of each community was represented with conversion slopes of the drug and the corresponding drug metabolite. To assess the velocities of drug consumption and drug metabolite production, concentration slope was calculated by fitting a piecewise linear function to the corresponding concentration curves with polyfit function in MatLab 2017b. Correlation between drug consumption or metabolite production slopes and specific gene abundance, bacterial 16S abundance or bacterial CFU mL−1 was calculated with corr function in MatLab 2017b.
Metagenomic analysis
Sample preparation and sequencing –
DNA from bacterial community samples was extracted as described above for the qPCR analysis. Library preparation and sequencing was performed at the Yale Center for Genome Analysis. The Kapa Biosystems Hyper prep kit WGS was used for the preparation of the metagenomic sequencing libraries. 2×150bp sequencing was performed on an Illumina Novaseq 6000 instrument with a S4 flow-cell to target depth of ~20 Mio reads per sample. Raw sequencing data were deposited on the publicly available ENA server (accession no. PRJEB31790).
Data preprocessing –
Metagenomic sequencing data preprocessing and analysis was performed with bioBakery tools34. Paired-end reads from each sample were filtered with KneadData v0.6.1 to trim adaptor sequences with trimmomatic-0.38 and to exclude reads mapping to the human genome35. Filtered paired-end reads were merged before further processing.
OTU construction and taxonomic assignment –
OTU construction and taxonomic assignment was performed with MetaPhlan2 v2.6.036 on the filtered and merged sequencing data. OTU tables were subsequently merged into a summary OTU table with merge_metaphlan_tables function (Supplementary Table 17).
Diversity analysis –
Diversity analysis was performed with Qiime 1.837. OTU tables from metagenomic analysis were converted to biom tables with biom -convert functions. Shannon’s alpha-diversity metric was calculated with alpha_diversity.py function with -m shannon parameter.
Quantification of protein sequence abundance –
Protein sequence abundance quantification was performed with ShortBRED v0.9.538. Target protein sequences were downloaded from NCBI in amino acid fasta format. ShortBRED markers were created with shortbred-identify function using Uniref90 downloaded from https://www.uniprot.org/downloads as a reference39. Protein sequence abundance was quantified using the created reference markers with shortbred_quantify function using built in USEARCH v11.0.667_i86linux32 tool40. The resulting tables for each sample were merged into one summary table (Supplementary Table 18).
Correlation analysis –
Correlation analysis between drug or metabolite conversion slopes was performed in MatLab2017b with corr function (resulting in Pearson’s correlation coefficient and p-value calculated using Student’s t-distribution for statistics t=r*sqrt((n-2)/(1-r^2) with n-2 degrees of freedom, where r is the correlation coefficient, and n is the sample size) (Supplementary Table 19).
Metagenomics analysis workflows are available on GitHub (https://github.com/mszimmermann/drug-bacteria-gene_mapping).
Human fecal material
All samples were collected under Yale University Human Investigation Committee protocol number 1106008725 at Yale University School of Medicine and stored in the Goodman laboratory, using ID numbers which are not associated with study volunteer names or other identifying information. Study volunteers were recruited through the campus billboard advertisement and reviewed an information sheet describing the study prior to deciding to participate. Eligibility criteria included age (20–60 years) and general health status (generally healthy, no long-term chronic diseases or illnesses, no cold, no flu or apparent bacterial or viral infection at the time of contact, not currently on antibiotics or no antibiotic use in the past 2 months, and regular bowel movement). No information was collected from the subjects except for their age and gender (Supplementary Table 9 and 16). Fecal samples were then collected and stored as previously described21.
Statistics and Reproducibility
Statistical analysis of all data was performed in MatLab R2017b. No statistical methods were used to predetermine sample size. For mouse experiments, mice were randomized before allocation to study groups and respective cages. All other experiments conducted for the study were not randomized, and the investigators were not blinded to either allocation during experiments or to outcome assessments.
All in vitro experiments were performed once with indicated replication. Mouse experiments in Fig. 3f and Extended Data Figs. 5a, 8b were performed once, in Extended Data Fig. 5b twice, and in Fig. 3e and Extended Data Fig. 8a three times with indicated replication (Supplementary Tables 7-8 and 10) that resulted to comparable observations between repeats. In Figs. 3e-f and Extended Data Figs. 5a-b and 8, horizontal lines represent mean values of independent animals. P-values were calculated with a two-sided unpaired Student’s t-test, and FDR-corrected for multiple hypotheses testing with Benjamini-Hochberg procedure. The exact number of animals used per time point and calculated pFDR values per compound and time point are indicated in Supplementary Tables 7-8 and 10-11.
In Fig. 2a, volcano plot represents mean fold changes between n=4 drug-containing pools and n=20 non-drug-containing pools (vehicle controls), and p-values were calculated with a two-sided unpaired Student’s t-test and FDR-corrected for multiple hypotheses testing with Benjamini-Hochberg procedure. In Figs. 5d-e, bar plots and error bars represent mean and STD of n=4 independent cultures. In Fig. 5f, each color represents a different human donor, lines depict the mean of n=4 independent samples.
Data and code availability
All data generated during this study are included in this published article and its Supplementary Tables. Data are available from FigShare: https://doi.org/10.6084/m9.figshare.8119058. Raw sequencing data were deposited on the publicly available ENA server (accession no. PRJEB31790). Raw metabolomics data were deposited on the public repository MetaboLights (accession no. MTBLS896).
Analysis pipeline schemes, scripts and input files for analyzing data and generating figures are available on GitHub (https://github.com/mszimmermann/drug-bacteria-gene_mapping) and archived at Zenodo (https://doi.org/10.5281/zenodo.2827640).
Extended Data
Extended Data Figure 1. Setup of drug assay, characterization of tested drugs, and summary of metabolic bacteria-drug interactions.
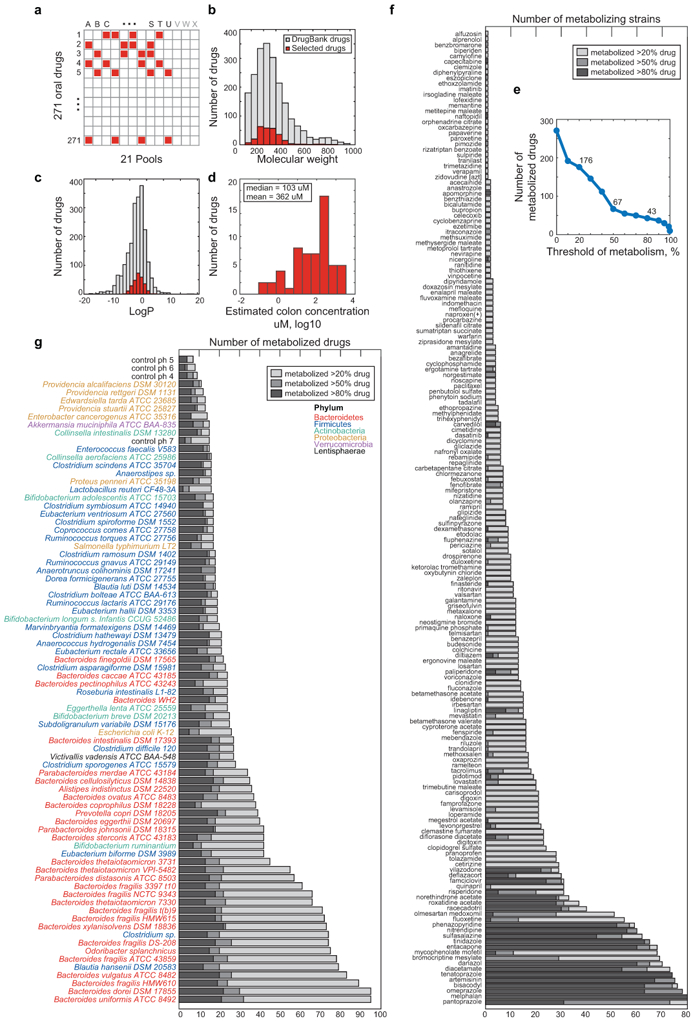
a, Schematic representation of combinatorial pooling scheme using 21 drug pools (A-U) and 3 non-drug controls (V-X). Each of the 271 drugs is tested in quadruplicate (present in 4 pools) and any two drugs are tested in the same pool at most twice (Supplementary Table 2). b-c, Molecular weight (b) and LogP (c) distribution of 271 tested drugs (red) in comparison with 2099 clinically approved drugs (DrugBank31). d, Distribution of predicted colon drug concentration for 58 of the 271 drugs tested (data from Maier et al.17). The predicted median and mean concentration in the large intestine for these compounds is 103 uM and 362 uM, respectively, when each drug is administered at its standard oral dose. e, Number of drugs metabolized as a function of the selection threshold (metabolized fraction). f, Number of gut bacteria that metabolize a given drug. g, Number of drugs metabolized by each bacterial strain.
Extended Data Figure 2. Metabolism of drugs previously reported to be transformed by bacteria and functional chemical group distribution.
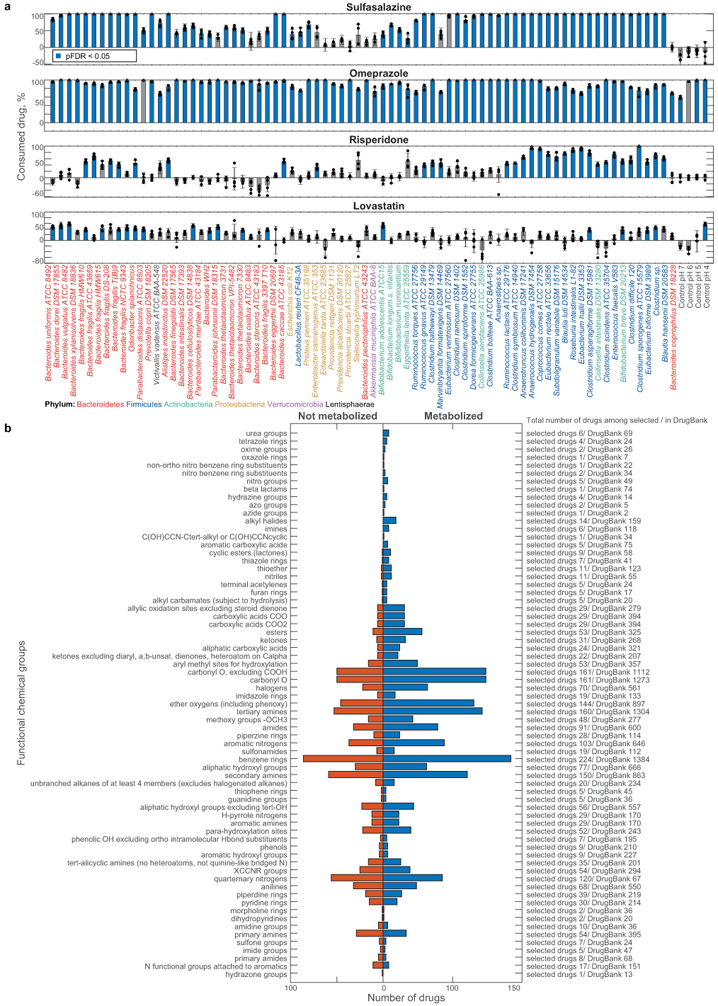
a, Percent of consumption between 0 h and 12 h for each drug after incubation with each gut bacterial species/strain are shown. Bars and error bars depict the mean and STD of n=4 assay replicates. b, Distribution of functional chemical groups in drugs that are metabolized or not metabolized across the 76 tested bacterial strains. Abundance of each chemical group among the 271 selected drugs and 2099 clinical drugs (DrugBank31) is indicated.
Extended Data Figure 3. Hierarchical clustering of bacterial strains/species and drugs according to microbial drug metabolism.
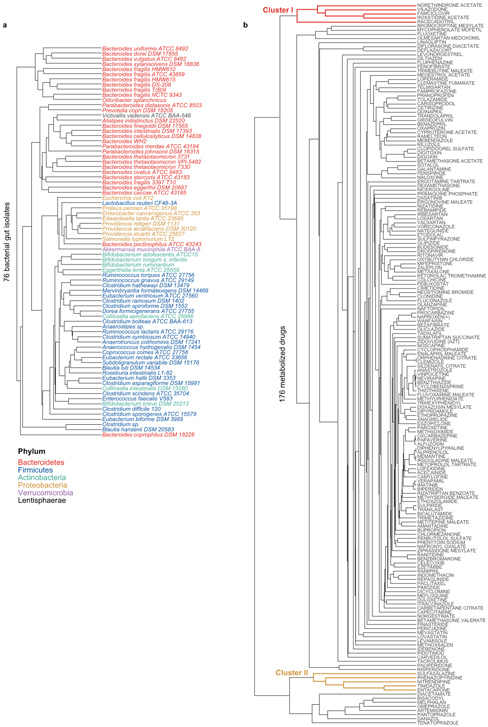
a, Dendrogram of bacterial strains from Fig. 1c (X-axis). b, Dendrogram of drugs from Fig. 1c (Y-axis).
Extended Data Figure 4. Structural drug features targeted for biotransformation and microbiome metabolism of dexamethasone.
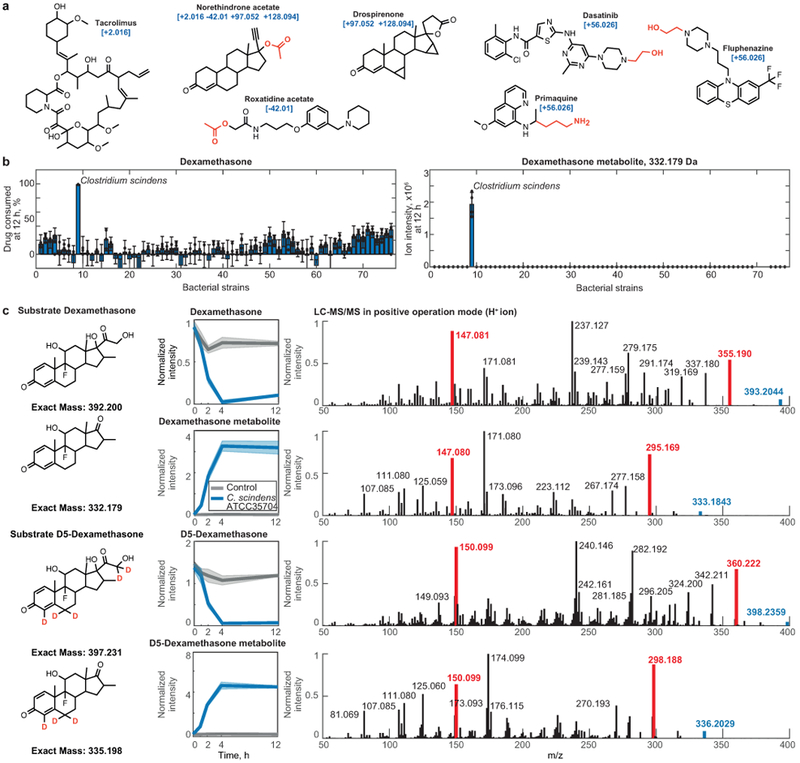
a, Examples of drugs associated with a particular mass shift between a parent drug and its metabolite. Functional groups that are enriched in drugs undergoing a specific mass shift (Fig. 2d) are highlighted. b, Dexamethasone metabolism by each of the 76 tested bacterial strains. Bar plots and error bars represent mean and STD of n=4 assay replicates. c, Validation of C. scindens (ATCC 35704) desmolase activity by mass comparison of metabolites produced from either dexamethasone or D5-dexamethasone and their LC-MS/MS spectra. Shaded areas correspond to mean ± standard deviation, n=6 independent cultures. Highlighted in red are representative ion fragments to illustrate the loss of the dexamethasone side chain (labeled with 2 deuterium atoms, compared to the steroid backbone labeled with 3 deuterium atoms).
Extended Data Figure 5. Microbial corticosteroid metabolism in vivo and in human gut communities.
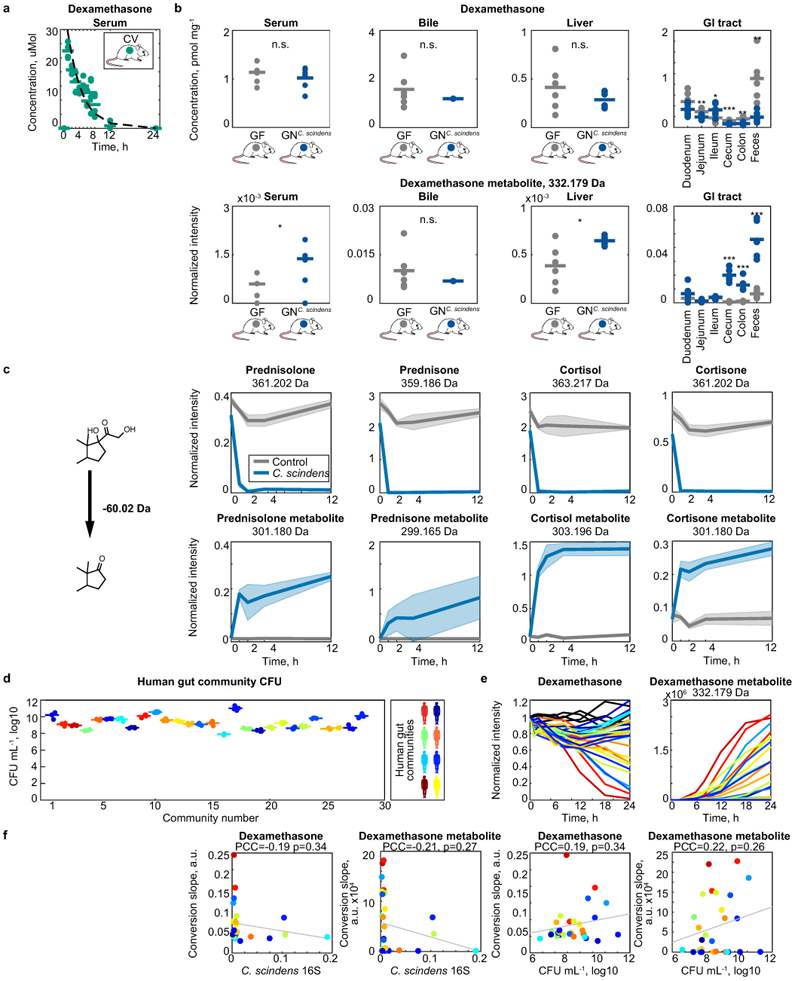
a, Dexamethasone serum profile in conventional mice following a single oral dose of dexamethasone. Line depicts fit of first order drug elimination kinetics. n=4 mice of either gender were used for each time point. Data are provided in Supplementary Table 7. b, Dexamethasone and dexamethasone metabolite levels across tissues of germ-free and C. scindens (ATCC 35704) mono-colonized mice after 7 hours of drug exposure. Horizontal lines show mean values of n=6 animals. * p ≤ 0.05, ** ≤ 0.01, *** ≤ 0.001 (unpaired two-sided Student’s t-test). Data and p-values are provided in Supplementary Table 8. c, C. scindens (ATCC 35704) desmolase activity for different corticosteroids. Shaded areas correspond to mean ± standard deviation, n=6 independent cultures. d, Bacterial density of human gut communities. CFU, colony forming units measured by anaerobic culturing. Horizontal bars represent mean of n=4 independent cultures. e, Ex vivo dexamethasone metabolism of gut communities isolated from 28 humans (each color represents a different human donor, lines depict the mean of n=4 replicate assays). C. scindens species abundance (quantified by species-specific qPCR) is not sufficient to explain the dexamethasone-metabolizing activity of these human gut communities. Data are provided in Supplementary Table 9. f, Correlation between community CFU mL−1 values and dexamethasone (left) or androgen dexamethasone metabolite (right) consumption and production slopes after 12 hours of incubation with each of the 28 human gut communities. P-values were calculated for the null hypothesis that there is zero correlation against the two-sided alternative that there is non-zero correlation (also see methods).
Extended Data Figure 6. Gain-of-function approach to identify microbial drug-metabolizing gene products: B. thetaiotaomicron diltiazem metabolism as an example.
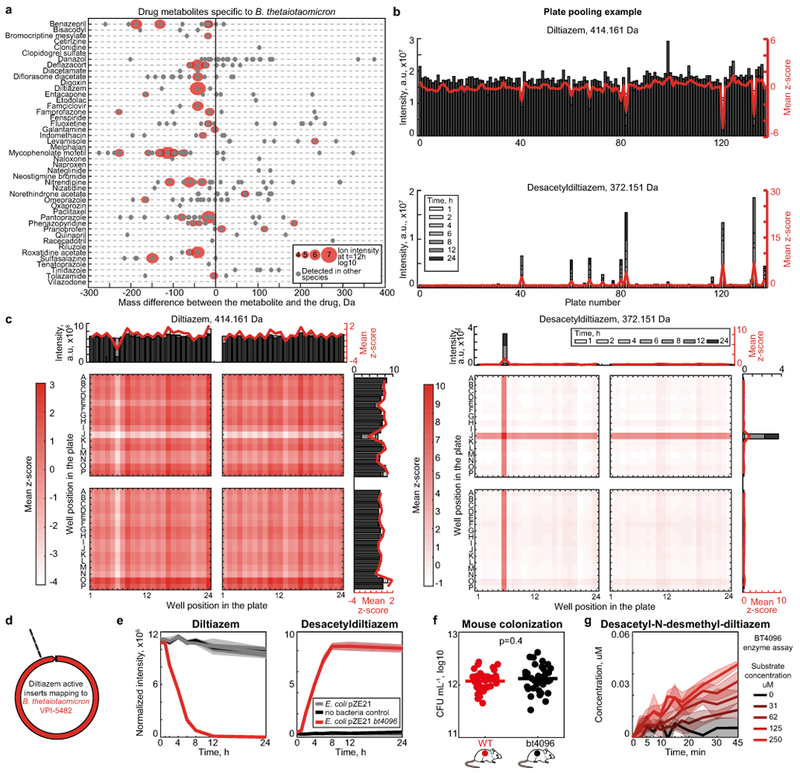
a, Drugs metabolized by B. thetaiotaomicron and candidate drug metabolites identified by untargeted metabolomics. b, Identification of active 384-well library plates that include clones with diltiazem deacetylation activity. c, Mapping of diltiazem-converting activity within active plates to identify active clones. d, Four independent E. coli clones demonstrating gain of diltiazem-metabolizing activity carry inserts that map to the same region in the B. thetaiotaomicron genome. e, Validation of BT4096 activity by targeted expression of the open reading frame in E. coli. Shaded areas depict the mean and STD of independent cultures/assays (n=4). f, Bacterial load of gnotobiotic mice mono-colonized with either B. thetaiotaomicron wildtype or the bt4096 mutant strain. Horizontal bars represent mean of n=35 independent mice per group. P-value was calculated with unpaired two-sided Student’s t-test. g, In vitro enzyme assay with N-desmethyldiltiazem as substrate to demonstrate that BT4096 also deacetylates N-desmethyldiltiazem, which is the major metabolic product of murine diltiazem metabolism. Lines and shaded areas depict the mean and STD of n=4 assay replicates, respectively.
Extended Data Figure 7. In vivo diltiazem metabolism and tandem mass spectrometry to validate metabolite identities.
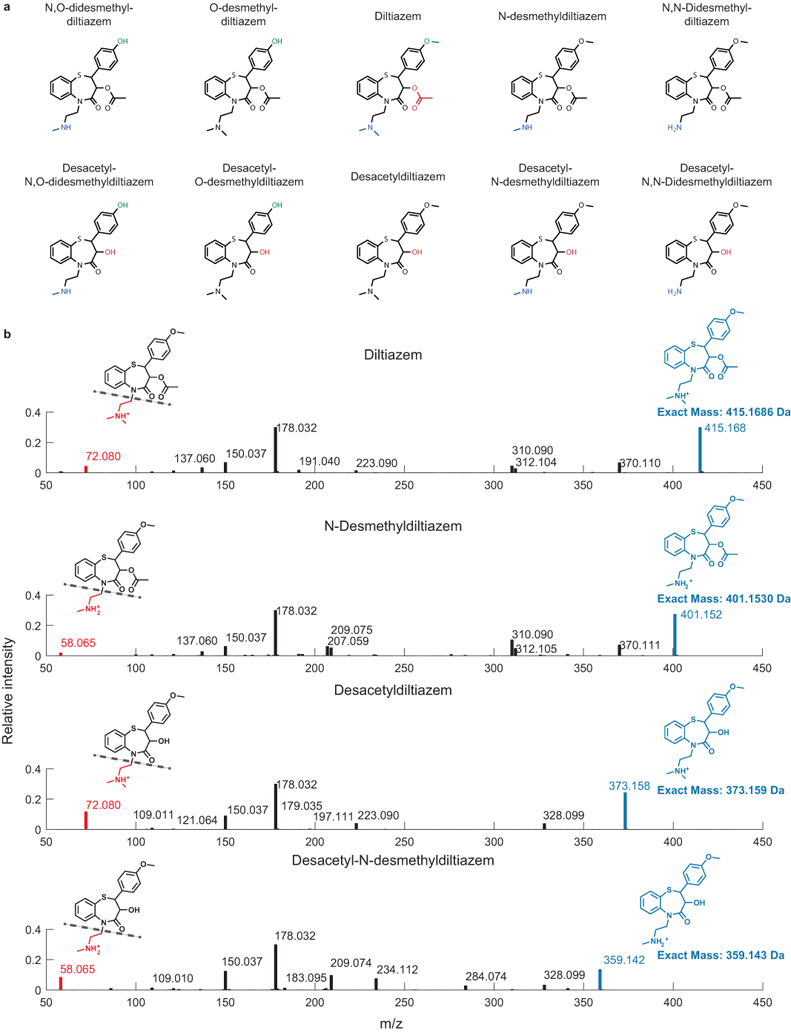
a, Structures of diltiazem in vivo metabolites41. b, Exemplary tandem-MS analysis to validate identities of diltiazem metabolites. LC-MS/MS data for all diltiazem metabolites are compiled in Supplementary Table 21. The experiment was performed n=3 times with comparable results.
Extended Data Figure 8. bt4096-depended in vivo diltiazem metabolism.
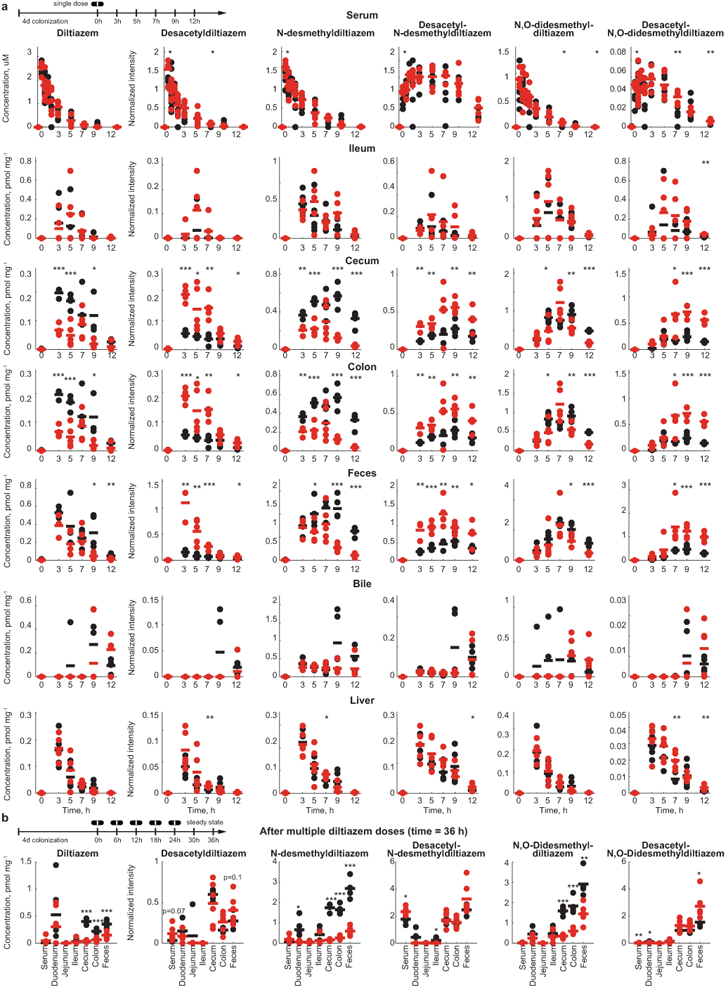
a, Diltiazem and diltiazem metabolite kinetics in different tissues following a single oral dose of diltiazem in gnotobiotic mice mono-colonized with either B. thetaiotaomicron wildtype or the bt4096 mutant strain. b, Intestinal diltiazem and diltiazem metabolite levels following multiple oral doses of diltiazem in mice mono-colonized with either B. thetaiotaomicron wildtype or the bt4096 mutant strain. Five oral doses were administrated to animals in six hour intervals. Tissues were collected 12 hours after the last oral dose of diltiazem. For all mouse experiments: Horizontal lines show the mean of n=5 animals and times reflect hours after oral diltiazem administration. * p ≤ 0.05, ** ≤ 0.01, *** ≤ 0.001 (unpaired two-sided Student’s t-test with FDR correction for multiple hypotheses testing). Data and p-values are provided in Supplementary Tables 10-11.
Extended Data Figure 9. Validation of identified drug-metabolizing gene products.
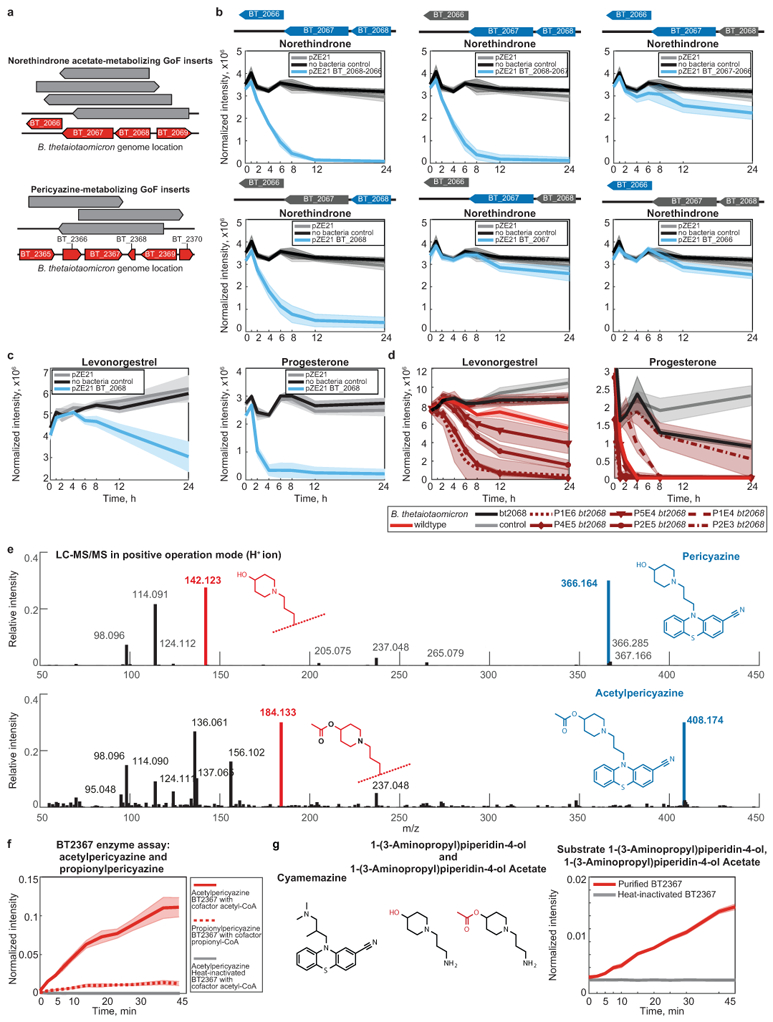
a, B. thetaiotaomicron gDNA fragments identified in norethindrone acetate and pericyazine metabolizing E. coli clones. b, All drug-metabolizing gain-of-function hits were validated by assays with E. coli expression constructs carrying PCR-amplified gene sequences and their combinations in case of operons (e.g., BT_2068–2066 metabolizing norethindrone). c, d, Levonorgestrel and progesterone-metabolizing activity of BT2068 shown by E. coli expressing bt2068 (c) and B. thetaiotaomicron wildtype, bt2068 mutant, and complemented strains (d). Promoter strengths for gene complementation are P1E6 > P4E5 >P2E5 > P5E4 >P1E4 > P2E3. e, Exemplary LC-MS/MS validation of O-acetyl-pericyazine. The experiment was performed n=3 times with comparable results. f, Enzymatic validation of O-acetyl- and O-propionyl-transferase activity using purified BT2367 and periciazine as substrate. e, Enzymatic validation of O-acyl-transferase activity of purified BT2367 using substrates structurally similar to pericyazine. While no acetyl-transferase activity could be measured for cyamemazine, aminopropylpiperidinol is converted to o-acetyl-aminopropylpiperidinol by BT2367. In (a-d) and (f-g), shaded areas depict the mean and STD of independent cultures/assays (n=4).
Extended Data Figure 10. Identified drug-metabolizing gene products explain observed drug metabolism of gut bacteria.
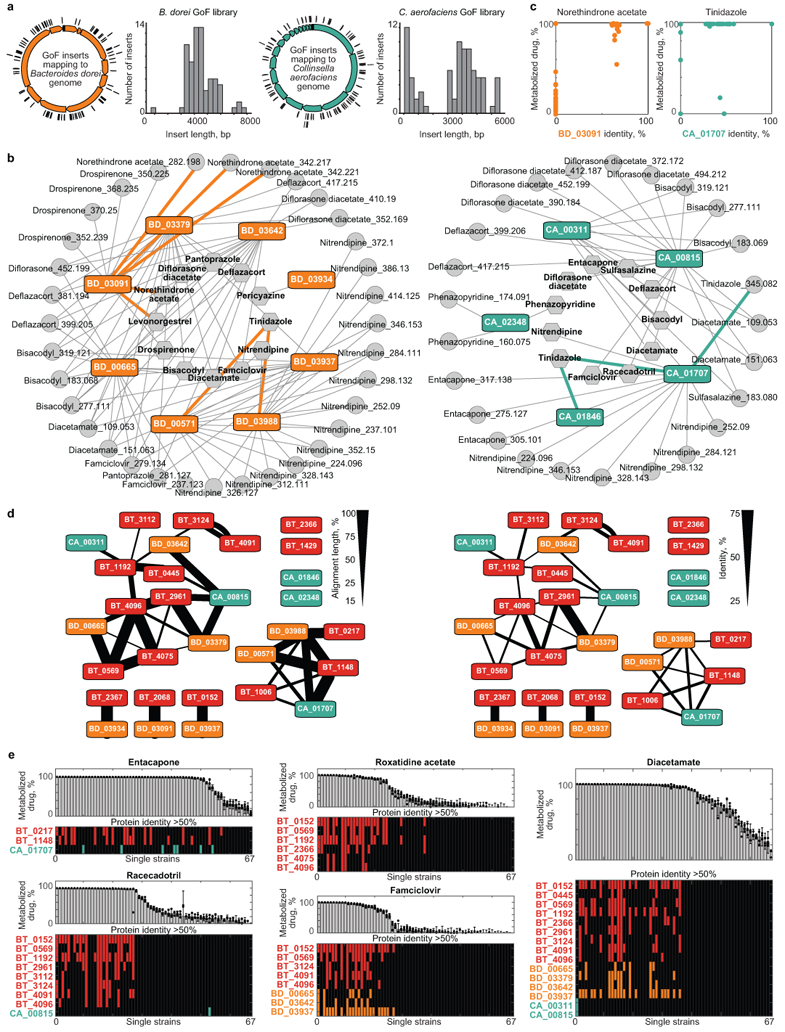
a, Genome coverage and fragment size distribution in E. coli gain-of-function libraries specific for B. dorei (based on 78 sequenced clones) and C. aerofaciens (based on 81 sequenced clones). Both libraries contained ~37,000 clones. b, Network of enzyme-substrate-product drug metabolic interactions for B. dorei and C. aerofaciens. Each node represents an enzyme (rectangles), a drug substrate (hexagons) or a metabolite product (circles), and each edge represents a validated metabolic interaction (targeted cloning of the gene into E. coli results in metabolism of a given drug or production of a specific drug metabolite). c, Comparison between maximal BD03091 and CA01707 identity of a given bacterial strain and its metabolism of norethindrone acetate and tinidazole, respectively. d, e, Reciprocal BLAST analysis of identified drug-metabolizing proteins. Line-width depicts the % of length (d) and identity (e) of mutual protein sequence alignment. e, Specific drug metabolism rates of 67 genome sequenced gut bacteria and presence of homologs to respective drug-metabolizing gene products. Notably, roxatidine acetate, famciclovir, diacetamate and diltiazem (Fig. 5b) all undergo the same chemical transformation (deacetylation), yet distinct sets of gene products explain their microbial metabolism. Bars and error bars represent mean and STD of n=4 assay replicates. Gene locus tag abbreviations: BD: BACDOR; CA: COLAER.
Extended Data Figure 11. Identified drug-metabolizing gene products explain observed drug metabolism of bacterial gut communities.
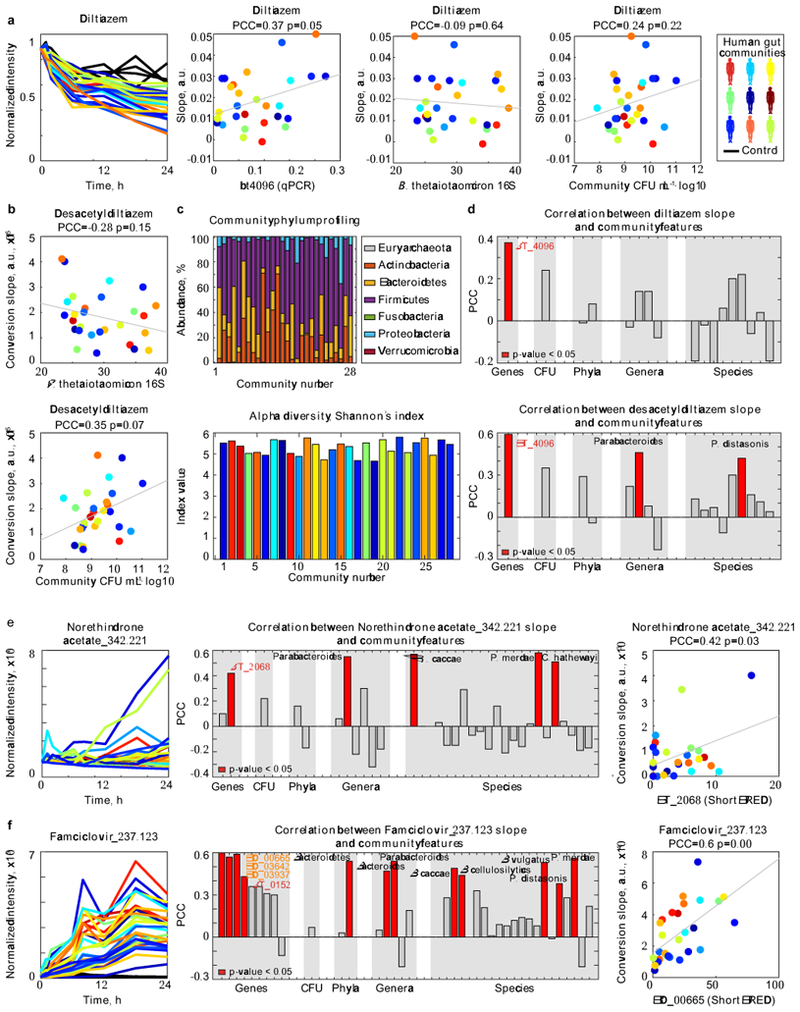
a-b, Diltiazem conversion to desacetyldiltiazem by 28 different human gut communities (each color represents a different human donor, lines depict the mean of n=4 assay replicates). Microbiota diltiazem-metabolizing activity does not correlate with either total bacterial culture densities or microbiota abundance of B. thetaiotaomicron (quantified by species-specific 16S-RNA qPCR). P-values were calculated for the null hypothesis that there is zero correlation against the two-sided alternative that there is non-zero correlation (also see methods). c, Composition and diversity of the 28 bacterial communities based on metagenomic sequencing. d, Correlation analysis between microbiota diltiazem-metabolizing activity and community CFU or metagenomic abundance of BT4096 homologs, diltiazem-metabolizing bacterial species, genera, and phyla identified in this study. e-f, Correlation analysis identical to (d) for the metabolism of norethindrone acetate and famciclovir by the 28 bacterial communities (each color represents a different human donor, lines depict the mean of n=4 replicate assays). P-values were calculated for the null hypothesis that there is zero correlation against the two-sided alternative that there is non-zero correlation (also see methods). Data are available in Supplementary Tables 16-19.
Supplementary Material
Acknowledgments:
We thank the Goodman lab for helpful discussions and N.A. Barry, L. Valle, D. Lazo, W.B. Schofield, P.H. Degnan, T. Wu, and the Yale Center for Molecular Discovery for technical assistance.
Funding: This work was supported by NIH grants GM118159, GM105456, AI124275, DK114793, the Center for Microbiome Informatics and Therapeutics, the Burroughs Wellcome Fund, the Yale Cancer Center, and the HHMI Faculty and Pew Scholars Programs to A.L.G. M.Z. received Early and Advanced Postdoc Mobility Fellowships from the Swiss National Science Foundation (P2EZP3_162256 and P300PA_177915, respectively) and a Long-Term Fellowship (ALTF 670–2016) from the European Molecular Biology Organization. M.Z.K. received an Early Postdoc Mobility Fellowship from the Swiss National Science Foundation (P2EZP3_178482).
Footnotes
Competing interests: MZ., M.Z.K. and A.L.G. have filed a patent application based on these studies with the U.S. Patent and Trademark Office (62/693,741). The specific aspects included in the patent application include methods for measuring microbial drug metabolism and for identifying microbial taxa and gene products associated with drug metabolism.
References:
- 1.Obach RS & Esbenshade TA Pharmacologically Active Drug Metabolites: Impact on Drug Discovery and Pharmacotherapy. Pharmacol Rev 65, 578–640 (2013). [DOI] [PubMed] [Google Scholar]
- 2.Sousa T et al. On the colonic bacterial metabolism of azo-bonded prodrugsof 5-aminosalicylic acid. J Pharm Sci 103, 3171–3175 (2014). [DOI] [PubMed] [Google Scholar]
- 3.Haiser HJ et al. Predicting and manipulating cardiac drug inactivation by the human gut bacterium Eggerthella lenta. Science 341, 295–298 (2013). [DOI] [PMC free article] [PubMed] [Google Scholar]
- 4.Okuda H, Ogura K, Kato A, Takubo H & Watabe T A possible mechanism of eighteen patient deaths caused by interactions of sorivudine, a new antiviral drug, with oral 5-fluorouracil prodrugs. J Pharmacol Exp Ther 287, 791–799 (1998). [PubMed] [Google Scholar]
- 5.Zimmermann M, Zimmermann-Kogadeeva M, Wegmann R & Goodman AL Separating host and microbiome contributions to drug pharmacokinetics and toxicity. Science 363, eaat9931 (2019). [DOI] [PMC free article] [PubMed] [Google Scholar]
- 6.Wallace BD et al. Alleviating cancer drug toxicity by inhibiting a bacterial enzyme. Science 330, 831–835 (2010). [DOI] [PMC free article] [PubMed] [Google Scholar]
- 7.Klatt NR et al. Vaginal bacteria modify HIV tenofovir microbicide efficacy in African women. Science 356, 938–945 (2017). [DOI] [PubMed] [Google Scholar]
- 8.Aziz RK, Hegazy SM, Yasser R, Rizkallah MR & ElRakaiby MT Drug pharmacomicrobiomics and toxicomicrobiomics: from scattered reports to systematic studies of drug–microbiome interactions. Expert Opin Drug Metab Toxicol 14, 1043–1055 (2018). [DOI] [PubMed] [Google Scholar]
- 9.Goodman AL et al. Identifying genetic determinants needed to establish a human gut symbiont in its habitat. Cell Host Microbe 6, 279–289 (2009). [DOI] [PMC free article] [PubMed] [Google Scholar]
- 10.Wilson ID & Nicholson JK Gut microbiome interactions with drug metabolism, efficacy, and toxicity. Transl Res (2016). doi: 10.1016/j.trsl.2016.08.002 [DOI] [PMC free article] [PubMed] [Google Scholar]
- 11.Winter J et al. Mode of action of steroid desmolase and reductases synthesized by Clostridium ‘scindens’ (formerly Clostridium strain 19). The Journal of Lipid Research 25, 1124–1131 (1984). [PubMed] [Google Scholar]
- 12.Morris GN, Winter J, Cato EP, Ritchie AE & Bokkenheuser VD Clostridium scindens sp. nov., a Human Intestinal Bacterium with Desmolytic Activity on Corticoids. International Journal of Systematic and Evolutionary Microbiology 35, 478–481 (1985). [Google Scholar]
- 13.Ridlon JM et al. Clostridium scindens: a human gut microbe with a high potential to convert glucocorticoids into androgens. The Journal of Lipid Research 54, jlr.M038869–2449 (2013). [DOI] [PMC free article] [PubMed] [Google Scholar]
- 14.Boyd RA et al. The pharmacokinetics and pharmacodynamics of diltiazem and its metabolites in healthy adults after a single oral dose. Clin. Pharmacol. Ther. 46, 408–419 (1989). [DOI] [PubMed] [Google Scholar]
- 15.Molden E, Åsberg A & Christensen H Desacetyl-Diltiazem Displays Severalfold Higher Affinity to CYP2D6 Compared with CYP3A4. Drug Metab. Dispos. 30, 1–3 (2002). [DOI] [PubMed] [Google Scholar]
- 16.Subramanian A et al. Gene set enrichment analysis: A knowledge-based approach for interpreting genome-wide expression profiles. Proceedings of the National Academy of Sciences 102, 15545–15550 (2005). [DOI] [PMC free article] [PubMed] [Google Scholar]
- 17.Maier L et al. Extensive impact of non-antibiotic drugs on human gut bacteria. Nature 555, 623–628 (2018). [DOI] [PMC free article] [PubMed] [Google Scholar]
- 18.Wu H et al. Metformin alters the gut microbiome of individuals with treatment-naive type 2 diabetes, contributing to the therapeutic effects of the drug. Nat Med 23, 850–858 (2017). [DOI] [PubMed] [Google Scholar]
- 19.Clayton TA, Baker D, Lindon JC, Everett JR & Nicholson JK Pharmacometabonomic identification of a significant host-microbiome metabolic interaction affecting human drug metabolism. Proceedings of the National Academy of Sciences 106, 14728–14733 (2009). [DOI] [PMC free article] [PubMed] [Google Scholar]
- 20.Björkholm B et al. Intestinal microbiota regulate xenobiotic metabolism in the liver. PLoS ONE 4, e6958 (2009). [DOI] [PMC free article] [PubMed] [Google Scholar]
- 21.Goodman AL et al. Extensive personal human gut microbiota culture collections characterized and manipulated in gnotobiotic mice. Proceedings of the National Academy of Sciences 108, 6252–6257 (2011). [DOI] [PMC free article] [PubMed] [Google Scholar]
- 22.Holdeman LV, 1929, Moore WEC & Cato EP Anaerobe laboratory manual. (1977). [Google Scholar]
- 23.Forsberg KJ et al. The Shared Antibiotic Resistome of Soil Bacteria and Human Pathogens. Science 337, 1107–1111 (2012). [DOI] [PMC free article] [PubMed] [Google Scholar]
- 24.Goodman AL, Wu M & Gordon JI Identifying microbial fitness determinants by insertion sequencing using genome-wide transposon mutant libraries. Nat Protoc 6, 1969–1980 (2011). [DOI] [PMC free article] [PubMed] [Google Scholar]
- 25.Koropatkin NM, Martens EC, Gordon JI & Smith TJ Starch Catabolism by a Prominent Human Gut Symbiont Is Directed by the Recognition of Amylose Helices. Structure 16, 1105–1115 (2008). [DOI] [PMC free article] [PubMed] [Google Scholar]
- 26.Warrens AN, Jones MD & Lechler RI Splicing by overlap extension by PCR using asymmetric amplification: an improved technique for the generation of hybrid proteins of immunological interest. Gene 186, 29–35 (1997). [DOI] [PubMed] [Google Scholar]
- 27.Whitaker WR, Shepherd ES & Sonnenburg JL Tunable Expression Tools Enable Single-Cell Strain Distinction in the Gut Microbiome. Cell 169, 538–546.e12 (2017). [DOI] [PMC free article] [PubMed] [Google Scholar]
- 28.Petersen TN, Brunak S, Heijne, von G & Nielsen H SignalP 4.0: discriminating signal peptides from transmembrane regions. Nat Methods 8, 785 (2011). [DOI] [PubMed] [Google Scholar]
- 29.Lim B, Zimmermann M, Barry NA & Goodman AL Engineered Regulatory Systems Modulate Gene Expression of Human Commensals in the Gut. Cell 169, 547–558.e15 (2017). [DOI] [PMC free article] [PubMed] [Google Scholar]
- 30.Cullen TW et al. Antimicrobial peptide resistance mediates resilience of prominent gut commensals during inflammation. Science 347, 170–175 (2015). [DOI] [PMC free article] [PubMed] [Google Scholar]
- 31.Wishart DS et al. DrugBank 5.0: a major update to the DrugBank database for 2018. Nucleic Acids Res 46, D1074–D1082 (2018). [DOI] [PMC free article] [PubMed] [Google Scholar]
- 32.Camacho C et al. BLAST+: architecture and applications. BMC Bioinformatics 10, 421 (2009). [DOI] [PMC free article] [PubMed] [Google Scholar]
- 33.Shannon P et al. Cytoscape: a software environment for integrated models of biomolecular interaction networks. Genome Res 13, 2498–2504 (2003). [DOI] [PMC free article] [PubMed] [Google Scholar]
- 34.McIver LJ et al. bioBakery: a meta’omic analysis environment. Bioinformatics 34, 1235–1237 (2018). [DOI] [PMC free article] [PubMed] [Google Scholar]
- 35.Bolger AM, Lohse M & Usadel B Trimmomatic: a flexible trimmer for Illumina sequence data. Bioinformatics 30, 2114–2120 (2014). [DOI] [PMC free article] [PubMed] [Google Scholar]
- 36.Truong DT et al. MetaPhlAn2 for enhanced metagenomic taxonomic profiling. Nat Methods 12, 902–903 (2015). [DOI] [PubMed] [Google Scholar]
- 37.Caporaso JG et al. QIIME allows analysis of high-throughput community sequencing data. Nat Methods 7, 335–336 (2010). [DOI] [PMC free article] [PubMed] [Google Scholar]
- 38.Kaminski J et al. High-Specificity Targeted Functional Profiling in Microbial Communities with ShortBRED. PLoS Comput. Biol 11, e1004557 (2015). [DOI] [PMC free article] [PubMed] [Google Scholar]
- 39.Suzek BE et al. UniRef clusters: a comprehensive and scalable alternative for improving sequence similarity searches. Bioinformatics 31, 926–932 (2015). [DOI] [PMC free article] [PubMed] [Google Scholar]
- 40.Edgar RC Search and clustering orders of magnitude faster than BLAST. Bioinformatics 26, 2460–2461 (2010). [DOI] [PubMed] [Google Scholar]
- 41.Yeung PK et al. Pharmacokinetics and metabolism of diltiazem in healthy males and females following a single oral dose. Eur J Drug Metab Pharmacokinet 18, 199–206 (1993). [DOI] [PubMed] [Google Scholar]
Associated Data
This section collects any data citations, data availability statements, or supplementary materials included in this article.
Supplementary Materials
Data Availability Statement
All data generated during this study are included in this published article and its Supplementary Tables. Data are available from FigShare: https://doi.org/10.6084/m9.figshare.8119058. Raw sequencing data were deposited on the publicly available ENA server (accession no. PRJEB31790). Raw metabolomics data were deposited on the public repository MetaboLights (accession no. MTBLS896).
Analysis pipeline schemes, scripts and input files for analyzing data and generating figures are available on GitHub (https://github.com/mszimmermann/drug-bacteria-gene_mapping) and archived at Zenodo (https://doi.org/10.5281/zenodo.2827640).


