

Abstract
Temporal lobe epilepsy (TLE) is the commonest of adult epilepsies, often refractory to antiepileptic medications, whose prevention and treatment rely on understanding basic pathophysiological mechanisms in interlinked structures of the temporal lobe. The medial entorhinal area (MEA) is affected in TLE but mechanisms underlying hyperexcitability of MEA neurons require further elucidation. Previous studies have examined the role of the presubiculum (PrS) in mediating MEA pathophysiology but not the juxtaposed parasubiculum (Par). Here, we report on an electrophysiological assessment of the cells and circuits of the Par, their excitability under normal and epileptic conditions, and alterations in functional connectivity with neighboring PrS and MEA using the rat pilocarpine model of TLE. We show that Par, unlike the cell heterogeneous PrS, has a single dominant neuronal population whose excitability under epileptic conditions is altered by changes in both intrinsic properties and synaptic drive. These neurons experience significant reductions in synaptic inhibition and perish under chronic epileptic conditions. Connectivity between brain regions was deduced through changes in excitatory and inhibitory synaptic drive to neurons recorded in one region upon focal application of glutamate followed by NBQX to neurons in another using a microfluidic technique called CESOP and TLE-related circuit reorganization was assessed using data from normal and epileptic animals. The region-specific changes in Par and neighboring PrS and MEA together with their unexpected interactions are of significance in identifying ictogenic cells and circuits within the parahippocampal region and in unraveling pathophysiological mechanisms underlying TLE.
Keywords: TLE, parasubiculum, presubiculum, MEA, hyperexcitability, CESOP
Introduction
The parasubiculum (Par), defined by Brodmann as area 49, is located between the presubiculum (PrS) and the medial entorhinal area (MEA), and known for its role in spatial information processing (Boccara et al., 2010). However, despite its location between regions implicated in temporal lobe epilepsy (TLE), the Par remains poorly investigated in terms of its cellular composition, the physiological state of its neurons and their potential to drive parahippocampal circuits under normal and epileptic conditions.
The Par is cytoarchietectonically distinguishable from the PrS and MEA by the absence of a densely packed cell layer (L) II that is comprised mostly of pyramidal (PrS) and/or stellate cells (MEA). Layers II and III of the Par are merged, with no coherent differentiation to form the superficial layers (LI-III). The deeper layers (LV-VI) are continuous with the MEA and it is unclear whether they belong to the Par or are part of the MEA proper. Anatomically, input to Par arises from the subiculum, hippocampus and amygdala (Kohler, 1985; van Groen and Wyss, 1990; Witter and Amaral, 2004), the deep layers of the entorhinal cortex (Kohler, 1986), and the retrosplenial and occipital visual cortices (van Groen and Wyss, 1990; Vogt and Miller, 1983). The Par sends outputs to PrS (LII and III), dentate gyrus and subiculum (Kohler, 1985; van Groen and Wyss, 1990) as well as a major projection to LII of MEA, targeting dendrites of principal neurons, and a minor projection to the lateral entorhinal cortex (Caballero-Bleda and Witter, 1993; Kohler, 1985; van Groen and Wyss, 1990). These anatomical projections form the basis of our investigation into the functional connectivity and interactions between the Par, PrS and MEA under normal and epileptic conditions.
Projections from the pre- and parasubiculum to the MEA are of significance in understanding why principal cells in LII and LIII are rendered hyperexcitable in TLE (Bear et al., 1996; Kumar and Buckmaster, 2006; Scharfman et al., 1998) and why LIII neurons are selectively lost in patients and animal models of TLE (Du et al., 1995; Du et al., 1993). Additionally, the observation that unilateral ablation of PrS and the adjoining Par prevents cell loss in MEA, providing a partial neuroprotective effect (Eid et al., 2001), calls for a careful examination of the excitability of neurons within the PrS and Par under normal conditions and their potential for hyperexcitability under epileptic conditions. Recently, we classified PrS neurons into distinct cell types based on electrophysiological criteria, establishing baselines for intrinsic properties mediating action potential waveforms and synaptic drive in each of the neuron types (Abbasi and Kumar, 2013). We assessed the physiological state of PrS neurons in animals with TLE directly to determine which of these neuronal populations are affected along with the nature of their physiological alterations (Abbasi and Kumar, 2014; Abbasi and Kumar, 2015). Through the present study, we showcase the Par by assessing a) the diversity of its neurons electrophysiologically; b) their intrinsic excitability as well as their excitatory and inhibitory synaptic drive under normal and epileptic conditions and c) their connectivity and influence over the dominant cell types in the PrS (LII and LIII) and the MEA (LII and LIII) using CESOP, a novel microfluidic technique for focal drug application (Abbasi and Kumar, 2015). To gain insights into how Par neuronal function and circuitry might be altered in TLE, we reassessed the physiological state of Par neurons and their connections in epileptic animals using the well-established pilocarpine model of TLE (Buckmaster, 2004). Our results facilitate the identification of ictogenic cells and circuits within these regions while providing specific insights into mechanisms underlying excitability of the Par and its potential to drive aberrant activity in parahippocampal target structures that mediate TLE.
Experimental Procedures
Animals
Sprague-Dawley rats (male; n = 19 epileptic, n = 31 controls) from postnatal (P) days 40 – 90 were used in this study. All experiments were carried out in accordance with the National Institute of Health Guide for the Care and Use of Laboratory Animals and were approved by the Florida State University Institutional Animal Care and Use Committee. Rats were made epileptic according to previously described protocols for bringing up the pilocarpine model of TLE (Buckmaster, 2004). Briefly, rats were treated with pilocarpine (P41, 141 ± 2 g; 380 mg/kg i.p.) 20 min after scopolamine methylnitrate (1 mg/kg i.p.). Diazepam (10 mg/kg i.p.) was administered 2 h after the onset of status epilepticus and repeated as needed. Following recovery from status epilepticus, rats were video monitored (40 h/wk) for spontaneous seizures. Animals used for electrophysiological experiments were confirmed epileptic, displaying frank spontaneous recurrent seizures scored 3 or greater on the Racine scale (Racine, 1972) on two or more observations during the 40 h/wk video monitoring. Recordings from epileptic animals were made on average 39 days post status epilepticus (range: 25-47 days), with initial seizures observed behaviorally between 5 and 29 days post status. Control groups consisted of age-matched naïve rats.
In vitro slice preparation and electrophysiology
Rats were deeply anesthetized with urethane (1.5 g/kg i.p.) before decapitation. The brain was quickly removed from the skull before being placed in a chilled (4°C) low-Ca2+, low-Na+ “cutting solution” containing (in mM) 230 sucrose, 10 D-glucose, 26 NaHCCE, 2.5 KC1, 1.25 NaH2PO4, 10 MgSO4, and 0.5 CaCl2 equilibrated with a 95%-5% mixture of O2 and CO2. After removing the cerebellum and rostral half of the brain, a 10-15° semi-horizontal cut was made to the dorsal part of the cortex with respect to the horizontal plane. The cut dorsal surface of the brain was adhered to the cutting platform using cyanoacrylate glue. This cutting angle was chosen to increase the likelihood of preserving PrS/Par projections to MEA in acute brain slices (Abbasi and Kumar, 2014; Abbasi and Kumar, 2015; Canto et al., 2012; Honda and Ishizuka, 2004; Tolner et al., 2007). Semi-horizontal slices (400 μm) were prepared using a microslicer (VT1000S, Leica, Germany) in the chilled cutting solution and allowed to equilibrate in oxygenated artificial cerebrospinal fluid (aCSF) containing (in mM) 126 NaCl, 26 NaHCO3, 3 KCl, 1.25 NaH2PO4, 2 MgSO4, 2 CaCl2, 0.25 L-Glutamine, and 10 D-glucose (pH 7.4), first at 32°C for 1 h and subsequently at room temperature before being transferred to the recording chamber.
Whole-cell patch clamp recordings (MultiClamp 700B amplifier and pCLAMP software; Molecular Devices, Union City, CA) were obtained at 32 ± 1°C from neurons in LII and LIII of the Par, PrS and MEA under Nomarski optics (Zeiss) using a visualized infrared setup (Hamamatsu) that enabled identification of their location within the various lamina. Patch electrodes were pulled from borosilicate glass (1.5 mm outer diameter, 0.75 mm inner diameter, 3–6 MΩ). Current-clamp experiments were conducted with an internal solution containing (in mM): 105 potassium gluconate, 30 KC1, 10 HEPES, 10 phosphocreatine, 4 MgATP, 0.3 GTP (pH adjusted to 7.3 with KOH; final osmotic concentration, 300 mOsm). Voltage-clamp experiments were conducted with an internal solution containing (in mM): 120 cesium gluconate, 1 MgCl2, 1 CaCl2, 11 CsCl, 10 HEPES, 2 NaATP, 0.3 NaGTP, 1 QX-314, 11 EGTA, and 20 biocytin (pH 7.3, corrected with Cs-OH; final osmotic concentration, 290 mOsm). Recording conditions were the same for control and epileptic animals. Slices were maintained in oxygenated (95% O2-5% CO2) aCSF, flowing at a rate of 2 ml/min. Drugs were applied focally via CESOP (see description below). Spontaneous (s) and miniature (m) excitatory postsynaptic currents (EPSCs) were obtained by holding the cell at −70 mV, while inhibitory postsynaptic currents (IPSCs) were recorded at a holding potential of 0 mV, close to the reversal potential for glutamate. Recorded signals were filtered at 1–2 kHz (10 kHz for current clamp), digitized at 10–20 kHz, and stored electronically. Series resistance was monitored continuously, and those cells in which this parameter exceeded 20 MΩ or changed by >20% were rejected. Series resistance compensation was not used. Sodium glutamate (100 μM), 2,3-dioxo-6-nitro-l,2,3,4-tetrahydrobenzo[f]quinoxaline-7-sulfonamide (NBQX, 10 μM), Amaranth (0.4 mM), and Tetrodotoxin (TTX, 1 μM), purchased from Sigma (Sigma, St. Louis, MO ), were prepared fresh in aCSF, and were used in experiments accordingly.
Electrical stimulation and Data analysis
Cnrrent-clamp:
Bipolar electrodes (CE-2C75; Fredrick Haer, Brunswick, ME) with 25-μm tip diameters were positioned in LII-III of Par / PrS in the vicinity of the recorded neurons to stimulate local afferents to evoke action potentials. Threshold (T) was defined as the minimal current required for evoking an action potential on 50% of the trials in the recorded neuron. Stimulus intensity ranged between 0.2 – 1.2 mA, for a 50 μs stimulus pulse. Additional current-clamp recordings from Par neurons were obtained to assay single action potential properties and discharge profiles (Table 1) by injecting hyperpolarizing and depolarizing current steps, 600-800 ms in duration, with amplitude ranging from −200 to 400 pA, delivered in 20 pA step increments.
Table 1.
Action Potential waveform properties in Par neurons. Values represent mean ± SE of the indicated parameters for the number of cells tested in each group (n). Rheobase refers to the minimum current required to evoke a single action potential in a neuron.
| Action Potential waveform properties | rheobase | 2× rheobase | ||
|---|---|---|---|---|
| control (n = 17) |
epileptic (n = 14) |
control (n = 17) |
epileptic (n = 14) |
|
| current injected (pA) | 105 ± 9 | 116 ± 17 | 209 ± 17 | 247 ± 26 |
| latency to firing (ms) | 305 ± 29 | 368 ± 37 | 62 ± 5 | 83 ± 7** |
| δ Vm (mV) | 27 ± 1 | 25 ± 2 | 29 ± 1 | 28 ± 2 |
| AP amplitude (mV) | 76 ± 1 | 69 ± 5 | 73 ± 2 | 68 ± 3 |
| width at half max (ms) | 1.5 ± 0.04 | 1.4 ± 0.09 | 1.4 ± 0.04 | 1.4 ± 0.10 |
| 10-90% rise time (ms) | 0.5 ± 0.02 | 0.6 ± 0.04 | 0.5 ± 0.05 | 0.6 ± 0.04 |
| area (mV .ms) | 116 ± 3 | 101 ± 4 *** | 102 ± 3 | 93 ± 4 (p = 0.058) |
| after-hyperpolarization amplitude (mV) | 11 ± 1 | 13 ± 1 * | 8 ± 2 | 14 ± 1 * |
| Rin(MΩ) | 158 ± 12 | 137 ± 10 | 158 ± 12 | 137 ± 10 |
| resting Vm (mV) | −65 ± 1 | −62 ± 1 | −65 ± 1 | −62 ± 1 |
p < 0.05,
p < 0.01,
p < 0.001, t-test.
Voltage-clamp:
The spontaneous and miniature postsynaptic current data, obtained from 1-min-long continuous recordings, were analyzed with Mini Analysis (Synaptosoft, Decatur, GA). The threshold for event detection was set at 3 × root mean square noise level and software-detected events were verified visually before measuring their frequency and amplitude.
Statistical methods used:
Measurements are presented as mean ± SEM. Drug effects on peak PSC amplitudes and frequencies were assessed using the one-way repeated measures ANOVA, with pair-wise comparisons measured using the Bonferroni post-hoc parametric t-test. Note that significance of the pairwise comparison between aCSF and NBQX is not indicated in Fig. 4–8 to avoid clutter. Cross comparisons between control and epileptic data including changes in EPSC kinetics were assessed using the unpaired two-tailed Student’s t-test, unless otherwise indicated. Statistical analysis was carried out using SigmaStat (V4, Systat Software, San Jose, CA).
Figure 4.

Assaying PrS→Par interactions using CESOP. Schematic (top left) of the recording configuration showing location of recording (R) and CESOP electrodes. A-B, Voltage-clamp recordings of EPSCs (inward events at −70 mV holding potential) from Par neurons in control (A) and epileptic (B) rats while perfusing the indicated compounds in PrS (top: aCSF; middle: 100 μm glutamate; bottom: 10 μm NBQX) sequentially; insets (A-B) are composite averages of all detectable events in a given trace (below). C-D, plots of averaged frequency (C) and amplitude (D) as a function of the experimental condition for EPSCs during 1 min-long recordings from control and epileptic animals. E-F, Voltage-clamp recordings of IPSCs (outward events at 0 mV holding potential) from Par neurons in control (E) and epileptic (F) rats while perfusing the indicated compound in the PrS; insets (E-F) are composite averages of all detectable events in a given trace (below). G-H, plots of averaged frequency (G) and amplitude (H) as a function of the experimental condition for IPSCs during 1 min-long recordings from control and epileptic animals. Schematic (top) is an interim summary of all PrS→Par interactions gleaned from the electrophysiological data under control (left) and epileptic (right) conditions. PrS-mediated synaptic inhibition but not excitation of Par neurons is compromised under epileptic conditions. For this and all subsequent figures error bars, where these are bigger than the size of the symbols used, represent SEM. Statistical significance between control and epileptic groups, *p < 0.05; ** p < 0.01; *** p < 0.001, t-test; before and after comparisons, † p < 0.05, †† p < 0.01, ††† P < 0.001, paired t-test.
Figure 8.

Assaying Par→MEA (LIII) interactions using CESOP. Schematic (top left) of the recording configuration showing location of recording (R) and CESOP electrodes. A-B, Voltage-clamp recordings of EPSCs (inward events at −70 mV holding potential) from pyramidal cells in LIII of MEA in control (A) and epileptic (B) rats while perfusing the indicated compounds in Par (top: aCSF; middle: 100 μm glutamate; bottom: 10 μm NBQX) sequentially; insets (A-B) are composite averages of all detectable events in a given trace (below). C-D, plots of averaged frequency (C) and amplitude (D) as a function of the experimental condition for EPSCs during 1 min-long recordings from control and epileptic animals. E-F, Voltage-clamp recordings of IPSCs (outward events at 0 mV holding potential) from pyramidal cells in LIII of MEA in control (E) and epileptic (F) rats while perfusing the indicated compound in the Par; insets (E-F) are composite averages of all detectable events in a given trace (below). G-H, plots of averaged frequency (G) and amplitude (H) as a function of the experimental condition for IPSCs during 1 min-long recordings from control and epileptic animals. Schematic (top) is an interim summary of all Par→MEA (LIII) interactions gleaned from the electrophysiological data under control (left) and epileptic (right) conditions. Par-mediated inhibition of pyramidal neurons in LIII of MEA is compromised in TLE.
Concomitant Ejection and Suction of Perfusate (CESOP)
Experimental compounds were focally applied within the Par / PrS using CESOP (Abbasi and Kumar, 2015) to maximize neuronal accessibility while minimizing spillover into neighboring nuclei, especially under turbulent or non-laminar flow conditions in the recording chamber. This system consisted of two perfusion pipettes piggy-backed onto one another and staggered such that the longer, narrower pipette (~250 μm) served as the inflow line, while the other, with a slightly larger tip diameter (~750 μm), served as the outflow. The inflow perfusion pipette was attached to a multi-barrel gravity fed perfusion system coupling multiple drug reservoirs, and enabling rapid exchange of experimental solutions. The outflow line consisted of a single line attached to a variable-speed peristaltic pump for suction of ejected perfusate. To minimize spread of chemical compounds outside the region of interest, flow rates for “in” and “out” lines were balanced at ~0.7 ml/min. Amaranth, a food coloring dye, dissolved in aCSF was used for visual identification of the perfusate and calibration of flow rate (see Fig. 3B). Following placement of the CESOP electrode in the bath (aCSF) just above the brain slice, flow rates in both in and out lines were adjusted to restrict perfusate to the region of interest before switching to normal aCSF. Connectivity between regions was confirmed via electrical stimulation prior to CESOP and baseline measurements of sEPSCs and sIPSCs were recorded in aCSF following complete exchange of fluid in the inflow line (~1 min). To confirm restriction of the perfusate to the region of interest, the dye laden aCSF was re-perfused at the end of each recording session.
Figure 3.
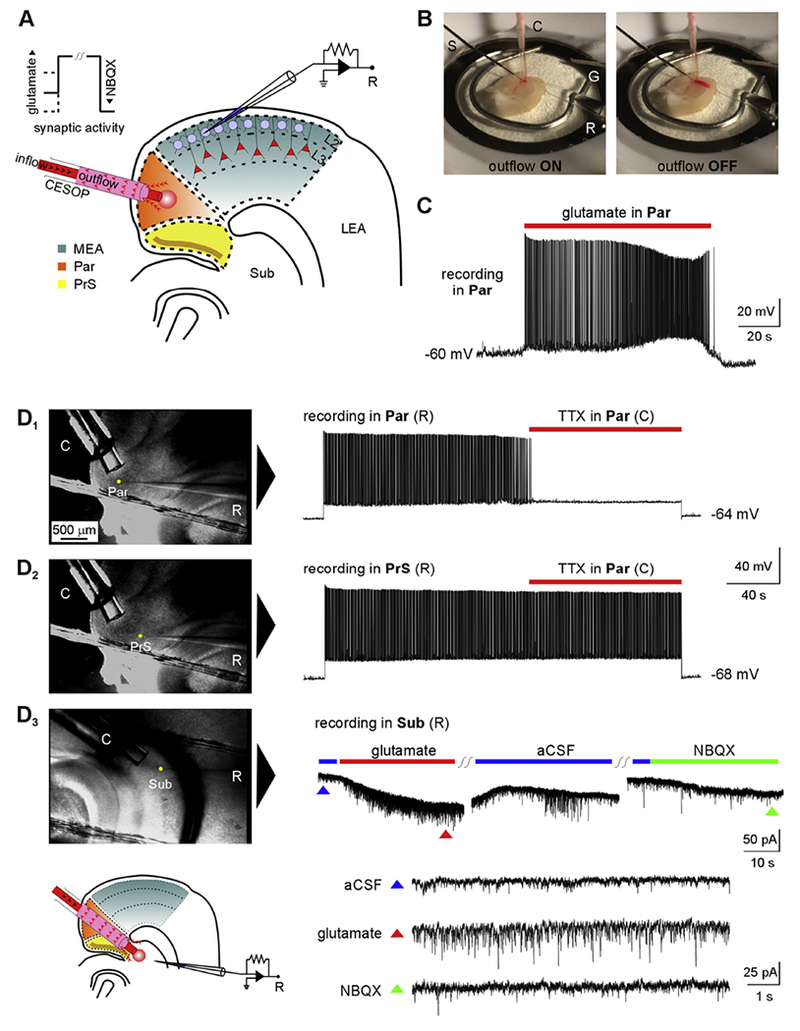
Concomitant ejection and suction of perfusate (CESOP) – a technique for focal application of drugs in submerged brain slices. A, schematic of the CESOP system. The red circle represents the perfusate applied via CESOP while recording from stellate cells in LII of MEA. B, CESOP in action as previously published (Abbasi and Kumar, 2015). Dye-laden aCSI (for visualization and calibration) is localized to the Par when CESOP is activated (left) but diffuses away when outflow is turned off (right) during focal application of perfusate to the region in a brain slice submerged in aCSF (electrodes: S, stimulation; C, CESOP; G, ground; R, recording). C, sustained AP discharge triggered in a RS cell of Par in response to focal application of glutamate (100 μm) via CESOP. D1-2; DIC images (left) of recorded neurons in Par (D1) and PrS (D2) showing differential effects of focal TTX (1 μm) application in Par using CESOP on AP discharge of RS cells in the respective regions evoked by depolarizing current injections (right). Resting membrane potentials in recorded neurons are indicated juxtaposed to the respective traces. D3, Whole-cell voltage-clamp recordings from a subicular neuron in response to application of glutamate and NBQX via CESOP in the subiculum (Sub). Colored triangles in the panel (below) correspond to time-expanded views of regions indicated in the original recording (above).
NeuN-biocytin immimohistochemistry
Neurons were filled with biocytin during recording (20 mM, included in the internal solution). To visualize biocytin-labeled neurons after recording, slices were fixed in 4% paraformaldehyde in 0.1 M phosphate buffer (PB, pH 7.4) at 4°C for at least 24 h. After fixation, slices were stored in 30% ethylene glycol and 25% glycerol in 50 mM PB at −20°C before being processed with a whole-mount protocol with counterstaining by NeuN immunocytochemistry. Slices were rinsed in 0.5% Triton X-100 and 0.1 M glycine in 0.1 M PB and then placed in a blocking solution containing 0.5% Triton X-100, 2% goat serum (Vector Laboratories, Burlingame, CA), and 2% bovine serum albumin in 0.1 M PB for 4 h. Slices were incubated in mouse anti-NeuN serum (1:1,000; MAB377, Chemicon, Temecula, CA) in blocking solution overnight. After a rinsing step, slices were incubated with the fluorophores Alexa 594 streptavidin (5 μg/ml) and Alexa 488 goat anti-mouse (10 μg/ml; Molecular Probes, Eugene, OR) in blocking solution overnight. Slices were rinsed, mounted on slides and coverslipped with Vectashield (Vector Laboratories) before being examined with a confocal microscope (LSM 880, Zeiss).
Cell Counting
Tile scan images of brain slices used in electrophysiology and processed for NeuN immunofluorescence (488 nm; z-stack depth 150 μm) were captured on a confocal microscope (×63 magnification, LSM 880, Zeiss) with the Par and MEA in view. Grid dimensions (19 × 18 tiles), tile / capture areas (4556 μm2 / 1.56 mm2) were set to cover the regions of interest. Each tile was imaged independently at multiple depths in intervals of 10 μm. Laser intensity and gain were adjusted before image acquisition of the tiles to optimize visualization and saturation of signal. Optical sections within a z-stack were projected orthogonally to generate a single two-dimensional composite image using maximum intensity projection (Zen Black software, Zeiss) for each tile. Cells in tiles within the demarcation boundaries of the Par and LIII of MEA were counted manually using user-defined exclusion / inclusion boundaries (top-right (purple) / bottom-left (green), see Fig. 9) to prevent double counting. Cell counts and density measurements were averaged across brain slices for comparison between control and epileptic animals.
Figure 9.

Evidence for cell loss in Par of epileptic rats. A1, a composite of confocally-acquired tile scan images of z-stacked, maximally-projected optical sections (range: 150 μm; increment: 10 μm; ×63 magnification) of acute brain slices processed for NeuN immunofluorescence (white arrows indicate pial surface). A2, a mosaic of confocal images highlighting the regions used for cell counting (Par, blue; LIII MEA, yellow). A3, a sample tile from the composite image (A2, red border) showing somata of the cells counted (red dots) along with the exclusion (purple) and inclusion (green) boundaries used. B, bar plot of the averaged NeuN-positive cells per mm2 in Par and LIII of MEA (internal control). **p < 0.01, ***p < 0.001, t-test.
Results
Intrinsic properties of RS cells in Par are altered in epileptic rats
We recorded from a total of 173 neurons in superficial layers II and III of Par in brain slices (Fig. 1A) from normal (n = 96 cells) and epileptic (n = 77 cells) rats. Neurons were selected randomly under DIC optics, and laminar location was determined visually during recordings and confirmed using biocytin labeling and counterstaining for NeuN immunoreactivity (Fig. 1B). Whole-cell current-clamp recordings were used to determine resting membrane potential of neurons (Vm), single action potential properties (Table 1), and depolarization-induced action potential discharge profiles for cell-type identification and assessment of intrinsic excitability (Fig. 1C–1D). All neurons recorded in a random sampling of the Par (100%; n = 17 and 14 under control and epileptic conditions respectively) were regular-spiking (RS) (Funahashi and Stewart, 1997), characterized by sustained firing of regularly spaced action potentials in response to current injections (Fig. 1C1–1C2), making them the dominant type of neuron in the Par. RS cells typically had pyramidal-shaped somata under DIC optics and biocytin labeling of these neurons indicated distinct patterns of dendritic branching that was confined to the Par; some had single spiny apical dendrites that extended towards the pial surface but did not cross into LI, while others had diffusely branching apical dendrites that ramified distally in LI (Fig. 1B). Basilar dendrites, defined as short dendritic segments (typically <100 μm in length) emanating from somata of neurons that otherwise have a well-identified apical dendrite (> 100 μm long), were generally oriented in a direction opposite to the cells apical dendrite. RS cells are likely projection neurons because, in addition to projecting locally within Par, their axons extend into the MEA and PrS (Caballero-Bleda and Witter, 1993; Canto, et al., 2012). While there were no obvious differences in cell morphology between normal and epileptic animals, RS cells were intrinsically more excitable in epileptic compared with nonepileptic, control tissue (Fig 1C1–1C2). While RS cells in both groups responded similarly by firing regularly-spaced action potentials once threshold was reached, the frequency of action potential discharge in epileptic tissue was significantly greater compared with controls at all levels of current injection (range: 20-400 pA, increment: 20 pA; p < 3.2×10⁻¹³, one-way ANOVA; n = 14 and 17 cells respectively; Fig. 1D). These data suggest an increased intrinsic excitability of Par neurons in TLE. Action potential waveform properties in Par neurons supported increased intrinsic excitability in epileptic animals through changes in area of AP (epileptics: 101 ± 4 mV-ms, controls: 116 ± 3 mV-ms; p < 0.0001, t-test; Table 1) and/or increased after-hyperpolarization (AHP amplitudes in epileptics: 13 ± 0.8 mV were significantly larger than in controls: 11 ± 0.7 mV; p < 0.05, t-test; Table 1), suggesting the potential involvement of calcium-activated potassium channels and their alterations (N’Gouemo, 2011).
Figure 1.
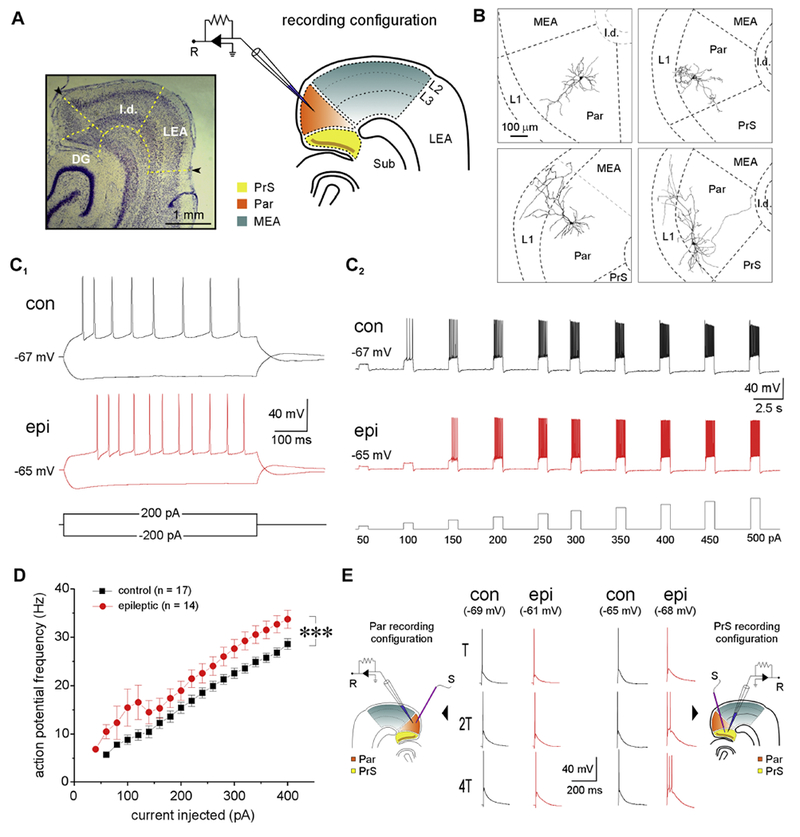
Electrophysiological profile of regular spiking (RS) cells in the Par under control and epileptic conditions. A, representative thionin-stained brain section and schematic indicating relative locations of the parasubiculum (Par), presubiculum (PrS), medial entorhinal area (MEA), lateral entorhinal area (LEA), lamina dissecans (l.d.), subiculum (Sub) and dentate gyrus (DG) at the level of the hippocampus. Brain regions used for electrophysiological recordings (R) are color-coded for easy reference. B, representative Neiirohicida reconstructions of biocytin-filled neurons in Par highlighting dendritic morphology. C, action potential (AP) discharge profile of RS cells in Par from control (con) and epileptic (epi) rats in response to hyper- and depolarizing current injections (±200 pA at resting Vm, 600 ms) (C1) and in response to current injections of increasing amplitude (50 – 500 pA; increments: 50 pA; duration: 800 ms; interval: 3s) (C2). Note the hyperexcitability of the neuron under epileptic conditions despite an increased rheobase and latency to fire action potentials. D, plot of instantaneous AP firing frequency as a function of current injected (20 – 400 pA; increments: 20 pA; duration: 600 ms) in control and epileptic animals. Each point on the plot is an ensemble average of the indicated number of neurons and error bars, where these are bigger than the size of the symbols used, represent SEM. E, action potentials evoked in RS cells (at resting Vm) from Par (left) and PrS (right, (Abbasi and Kumar, 2014)) in response to local electrical stimulation (S) at threshold (T) and increasing multiples of T. Note that RS cells in the PrS, but not Par, fire multiple APs when stimulated under epileptic conditions. ***p < 0.001, one-way repeated measures ANOVA.
Hyperexcitability of RS cells in Par was also assessed based on the propensity of neurons to fire multiple action potentials in response to increasing intensity of extracellular stimulation of local afferents, expressed as multiples of threshold (T; control: 0.27 ± 0.04, epileptic: 0.27 ± 0.01 mA; p = 0.9, t-test)– the current required for evoking a single action potential on ~50% of the trials (Kumar and Buckmaster 2006). We found that RS cells from epileptic animals (n = 8) were indistinguishable from those in the control group (n = 4) based either on the mean number of action potentials evoked and/or the area under the composite EPSP; they reliably fired a single action potential in response to extracellular electrical stimulation of local afferents even with stimulus intensities upwards of 4T (Fig. 1E). This was in sharp contrast with RS cells in the PrS which were shown previously to be hyperexcitable in epileptic tissue, firing multiple action potentials in response to even modest current increments. Both the number of action potentials evoked in response to increasing stimulus intensity and area under the composite EPSP were significantly increased compared with controls despite comparable T values (Abbasi and Kumar, 2014). These data suggest that the propensity of RS cells to fire multiple action potentials is significantly enhanced under epileptic conditions in the PrS, but not Par. Given the increased excitability of RS cells in Par in response to direct current injection in epileptic animals, and the possibility of PrS-Par interactions, we hypothesized that RS neurons of the Par would also be hyperexcitable synaptically under epileptic conditions. However, there was no apparent difference in the responses of RS cells to extracellular stimulation. We next set out to directly measure changes in the excitatory and inhibitory synaptic drive in these neurons under epileptic conditions.
Assessment of synaptic drive in Par neurons in epileptic rats
Whole-cell voltage-clamp recordings of spontaneous PSCs were used to assay the excitatory and inhibitory synaptic drive to RS cells in Par under control and epileptic conditions. Cells were held at −70 or 0 mV, close to the reversal potentials for GABA and glutamate respectively, to assay changes in the frequency and amplitude of spontaneous (s) and miniature (m) excitatory (E) and inhibitory (I) post-synaptic currents (PSCs). All PSCs could be antagonized with a cocktail of picrotoxin (50 μM), NBQX (10 μM) and D-AP5 (40 μM) (data not shown). The average frequency and amplitude of sEPSCs (inward events at −70 mV) in RS cells from epileptic rats were similar to controls (Table 2, Fig. 2A–2B, and 2C–2D). On the other hand, the average frequency of sIPSCs (outward events at 0 mV) in RS cells from epileptic rats was 52% of controls, but average amplitude was similar to controls (Table 2, Fig. 2E–2F, 2G–2H). These data suggest that reduced inhibition contributes to the hyperexcitability of RS cells in the Par. To further investigate whether alterations of postsynaptic currents in RS cells were mediated by changes in spontaneous activity of local excitatory / inhibitory circuits, number of synapses, or probability of action potential-dependent neurotransmitter release, we recorded PSCs in the presence of TTX (1 μM). We found that while average frequency of mEPSCs in RS cells from epileptic rats was similar to controls, mEPSC amplitudes in epileptic animals were significantly larger, suggesting an increased turnover in excitatory postsynaptic receptors (Table 2, Fig. 2A–2B, and 2C–2D). The average frequency of mIPSCs in RS cells from epileptic rats was 63% of controls (Table 2, Fig. 2E–2F, 2G) suggesting a reduction in the number of inhibitory synapses and/or probability of action potential-dependent GABA release. However, the average amplitude of mIPSCs in RS cells from epileptic rats was significantly larger suggesting a concomitant compensatory uptick in inhibitory postsynaptic receptors (Table 2, Fig. 2E–F, 2H). The kinetic properties of spontaneous, s- and miniature, m- E/IPSCs in Par neurons were mostly invariant under control and epileptic conditions (Table 3, upper panel).
Table 2.
Values represent mean ± SEM of spontaneous (s-) and miniature (m-) E/IPSC frequencies (Hz) and amplitudes (pA) respectively, for the number of cells tested is each group (n).
| RS cells in Par | control | epileptic | |
|---|---|---|---|
| n = 19; 20 | n = 15; 17 | ||
| sEPSC | 6.4 ±0.9 Hz | 5.2 ±0.9 Hz | |
| 26 ± 2 pA | 26 ± 3 pA | ||
| mEPSC | 1.2 ±0.2 Hz | 2.0 ± 0.3 Hz | |
| 14 ± 1 pA | 17 ± 1 pA | * | |
| sIPSC | 6.9 ± 0.8 Hz | 3.6 ± 0.5 Hz | *** |
| 55 ± 5 pA | 45 ± 5 pA | ||
| mIPSC | 1.6 ± 0.3 Hz | 1.0 ± 0.2 Hz | * |
| 16 ± 1 pA | 21 ± 2 pA | * |
p < 0.05,
p < 0.01,
p < 0.001, t-test.
Figure 2.
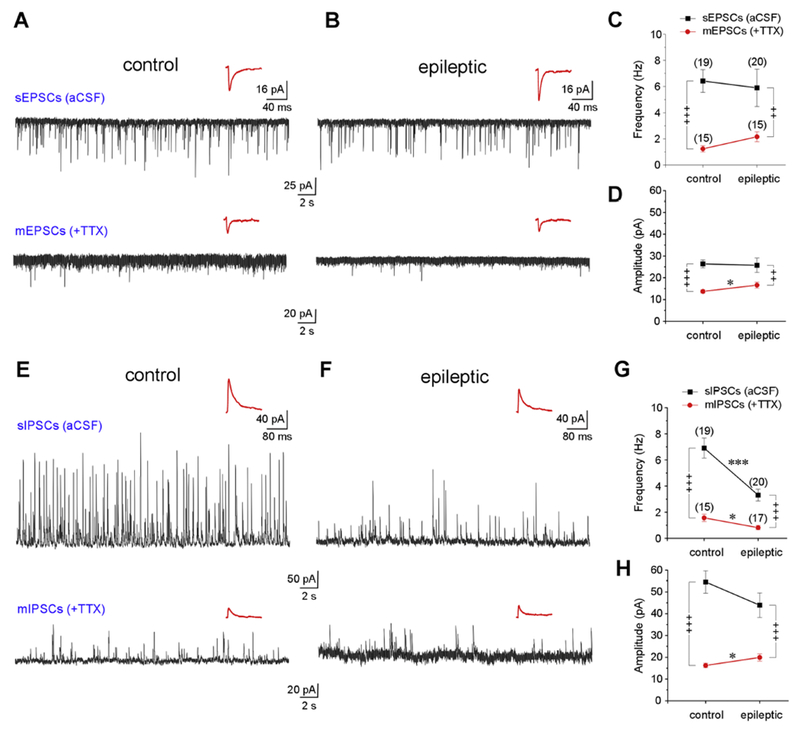
Excitatory and inhibitory synaptic drive to RS cells in control and epileptic rats. A-D, Excitatory synaptic drive to Par neurons in epileptic rats is similar to controls. A, B voltage-clamp recordings (1 min-long) of spontaneous (s) (in aCSF, top) and miniature (m) (in TTX, bottom) EPSCs (inward events recorded at −70 mV holding potential) in control and epileptic animals. C, D plots of averaged frequency and amplitude of s- and mEPSCs in control and epileptic animals. E-H, inhibitory synaptic drive to Par neurons is significantly diminished in epileptic rats. E, F voltage-clamp recordings of s- and mIPSCs (outward events recorded at 0 mV holding potential) in control and epileptic animals. G, H, plots of averaged frequency and amplitude of s- and mIPSCs in control and epileptics. Insets (A-B, E-F) are composite averages of all detectable events in a given trace (below). Error bars, where these are bigger than the size of the symbols used, represent SEM. Statistical significance between control and epileptic groups, * p < 0.05; ** p < 0.01; *** p < 0.001, t-test; before and after TTX comparisons, + p < 0.05, ++ p < 0.01, +++ p < 0.001, paired t-test.
Table 3.
Kinetic properties of spontaneous (s-), miniature (m-), excitatory (E) and inhibitory (I) postsynaptic currents (PSC) recorded under the indicated conditions. Recording configuration A→B indicates CESOP in region A while recording in region B. Values represent mean ± SEM of the 10-90% rise times (RT) and decay time constants (τ) for number of cells tested in each group (n).
| recording region | in ms | PSCs |
n con, epi |
control | epileptic | in ms | PSCs | n | control | epileptic | ||
|---|---|---|---|---|---|---|---|---|---|---|---|---|
| Par | RT | sE | 20, 18 | 1.8 ± 0.1 | 1.5 ± 0.1 | RT | sI | 17, 17 | 2.3 ±0.1 | 2.1 ± 0.1 | ||
| mE | 15, 16 | 1.4 ± 0.1 | 1.3 ± 0.1 | mI | 13, 16 | 2.1 ± 0.3 | 1.8 ± 0.2 | |||||
| τ | sE | 20, 18 | 8.4 ± 0.7 | 8.6 ± 0.9 | τ | si | 17, 17 | 21.5 ± 1.4 | 22 ±3.9 | |||
| mE | 15, 16 | 5.8 ± 0.4 | 5.3 ± 0.3 | mI | 13, 16 | 15.2 ± 1.6 | 17.3 ± 1.8 | |||||
| CESOP | aCSF | glutamate | NBQX | |||||||||
| recording configuration | in ms | PSCs |
n con, epi |
control | epileptic | control | epileptic | control | epileptic | |||
| PrS → Par | RT | E | 12, 8 | 1.9 ± 0.1 | 1.7 ± 0.1 | 1.8 ± 0.1 | 1.7 ± 0.1 | 2.1 ± 0.2 | 1.6 ± 0.1 | |||
| I | 10, 7 | 2.3 ± 0.2 | 2.0 ± 0.2 | 2.3 ± 0.1 | 2.2 ± 0.1 | 2.2 ± 0.1 | 2.2 ± 0.2 | |||||
| τ | E | 12,8 | 8.2 ± 0.6 | 10.5 ± 2.7 | 8.3 ± 0.4 | 10.1 ± 2.1 | 9.5 ± 1.3 | 7.7 ± 1.2 | ||||
| I | 10, 7 | 20.6 ± 2.5 | 22.5 ± 2.2 | 20.9 ± 1.9 | 20.9 ± 2.3 | 22.4 ± 2.3 | 23.8 ± 3.6 | |||||
| Par → LII PrS |
RT | E | 11, 8 | 1.6 ± 0.1 | 1.4 ± 0.1 | 1.7 ± 0.1 | 1.4 ± 0.2 | 2.0 ± 0.4 | 1.3 ± 0.1 | |||
| I | 10, 8 | 2.2 ± 0.2 | 1.8 ± 0.1 | 2.3 ± 0.2 | 1.9 ± 0.2 | 2.2 ± 0.2 | 1.9 ± 0.1 | |||||
| τ | E | 11, 8 | 8.5 ± 0.7 | 7.3 ± 1.2 | 8.8 ± 0.9 | 7.5 ± 1.1 | 9.0 ± 1.4 | 6.2 ± 0.9 | ||||
| I | 10, 8 | 24.8 ± 2.9 | 19.7 ± 2 | 19.5 ± 1.4 | 18.1 ± 1.4 | 21.4 ± 2.1 | 19.9 ± 2 | |||||
| Par → LIII PrS |
RT | E | 12, 9 | 1.7 ± 0.2 | 1.3 ± 0.1 | 1.6 ± 0.2 | 1.4 ± 0.1 | 1.7 ± 0.2 | 1.3 ± 0.1 | |||
| I | 10, 9 | 2.4 ± 0.1 | 1.8 ± 0.2 | ** | 2.3 ± 0.1 | 1.9 ± 0.1 | 2.1 ± 0.1 | 1.9 ± 0.1 | ||||
| τ | E | 12, 9 | 9.6 ± 0.7 | 10.7 ± 4.2 | 8.1 ± 0.8 | 5.8 ± 0.4 | * | 8.7 ± 0.9 | 6.0 ± 0.5 | * | ||
| I | 10, 9 | 21.8 ± 1.5 | 20.4 ± 1.6 | 18.5 ± 1.1 | 15.8 ± 1.4 | 19.1 ± 1.6 | 15.6 ± 1.5 | |||||
| Par → LII MEA |
RT | E | 13, 9 | 1.6 ± 0.1 | 1.6 ± 0.1 | 1.7 ± 0.1 | 1.6 ± 0.1 | 1.8 ± 0.1 | 1.7 ± 0.2 | |||
| I | 14, 8 | 2.1 ± 0.1 | 2.3 ± 0.2 | 2.2 ± 0.1 | 4.6 ± 2.6 | 2.2 ± 0.1 | 2.1 ± 0.1 | |||||
| τ | E | 13, 9 | 5.9 ± 0.6 | 9.0 ± 1 | ** | 6.1 ± 0.6 | 8.0 ± 1 | 5.9 ± 0.5 | 9.2 ± 1.5 | * | ||
| I | 14, 8 | 14.0 ± 1.3 | 19.0 ± 1.3 | * | 16.8 ± 2.1 | 21.4 ± 2.6 | 13.8 ± 1.4 | 20.6 ± 1.7 | ** | |||
| Par → LIII MEA |
RT | E | 13, 9 | 1.5 ± 0.1 | 1.4 ± 0.2 | 1.6 ± 0.1 | 1.4 ± 0.1 | 1.6 ± 0.1 | 1.3 ± 0.1 | |||
| I | 12, 8 | 2.2 ± 0.1 | 1.7 ± 0.1 | * | 2.1 ± 0.1 | 1.7 ± 0.1 | 1.8 ± 0.1 | 1.7 ± 0.2 | ||||
| τ | E | 13, 9 | 10.0 ± 2.9 | 8.3 ± 1.5 | 9.6 ± 1.7 | 7.5 ± 1.1 | 8.1 ± 0.8 | 7.5 ± 1.2 | ||||
| I | 12, 8 | 14.9 ± 1.2 | 17.6 ± 2.1 | 14.7 ± 1.9 | 17.0 ± 0.8 | 13.5 ± 1.7 | 18.8 ± 1.2 | |||||
p < 0.05,
p < 0.01, t-test.
Assessment of functional connectivity between juxtaposed brain regions using CESOP
We showed previously that regular-spiking (RS) neurons in the PrS are hyperexcitable in epileptic animals (Abbasi and Kumar, 2014), and through the present work, extended these findings to RS cells in the Par. To assess the influence of RS neuron hyperexcitability on stellate cells in LII and pyramidal neurons in LIU of MEA and assay potential TLE-related alterations in PrS→Par, Par→PrS (superficial LII and LIII), Par→MEA (LII and LIII) connectivity, we measured changes in excitatory and inhibitory synaptic drive to neurons in these regions following focal application of glutamate (to evoke AP firing in neurons through synaptic depolarization) followed by NBQX (to suppress excitation of neurons by antagonizing glutamatergic AMPA receptors) to the Par/PrS in control and epileptic tissue.
Functional interactions between Par, PrS and the adjacent MEA were assayed using concomitant ejection and suction of perfusate (CESOP; Fig. 3A). CESOP enables focal application of pharmacological compounds to a brain region in submerged slices, while restricting their spillover to juxtaposed regions (Fig. 3B (Abbasi and Kumar, 2015), 3D1–3D3). Because ambient network activity could vary between slices, glutamate (100 μM) application was followed by NBQX (10 μM) using CESOP, the pharmacological equivalent of a pulse function, to maximally enhance and then suppress overall synaptic activity of neurons in one region while recording from another neighboring region of interest (Fig. 3A). We obtained whole-cell voltage-clamp recordings from subicular neurons to test the EPSC enhancing and suppressing capability of glutamate and NBQX applied via CESOP. While the subiculum is not a part of this study, changes in EPSC frequency shown in Fig. 3D3 exemplify the utility of the pharmacological pulse function. Note that glutamate both depolarizes the recorded neurons and increases EPSC frequency.
Connectivity between regions was established using electrical stimulation prior to use of CESOP and baseline voltage-clamp traces were recorded while perfusing aCSF and no more than one neuron per nuclei was used in assaying drug effects. E/IPSCs were recorded by holding the neurons near the reversal potentials for GABA/glutamate (−70/0 mV) and recordings from control tissue served as baseline for comparisons of synaptic activity in epileptic tissue. Note that recording intervals for PSCs correlated with periods of sustained action potential firing of Par/PrS neurons depolarized by focal glutamate application via CESOP (Fig. 3C). We also assayed kinetic properties of E/IPSCs under the various recording configurations in control and epileptic animals using 10-90% rise times and decay kinetics of PSCs which were comparable between the two groups barring the few significant differences highlighted in Table 3 (lower panel). Excitatory and inhibitory connectivity between regions deduced from the CESOP data is depicted monosynaptically for clarity and intended to provide the most parsimonious representation of the circuitry (interim summaries in Fig. 4–8 and Fig. 10). However, we acknowledge the possibility of alternative interpretations using second- or third-order synaptic connections mediated directly or indirectly through intermediary structures. Major cell types in regions other than the Par were deduced from our prior work in the PrS (Abbasi and Kumar, 2013; Abbasi and Kumar, 2014) and the MEA (Kumar and Buckmaster, 2006; Kumar et al., 2007; Pilli et al., 2012) and depicted schematically.
Figure 10.

Synthesis of CESOP data from interim summary Figures 4 through 8 highlighting detailed functional connectivity between Par, PrS, and MEA in control (left) and epileptic (right) animals. Note that single fiber projections are depicted as monosynaptic for illustrative purposes.
Assaying PrS→Par connectivity: PrS-mediated synaptic inhibition but not excitation of Par neurons is compromised under epileptic conditions
Previous work has shown that RS cells of the PrS become hyperexcitable under epileptic conditions (Abbasi and Kumar, 2014). To determine whether hyperexcitability of PrS influences synaptic activity of neurons within Par, we used CESOP in PrS while recording from RS cells within the Par under normal and epileptic conditions (Fig. 4).
Although focal application of glutamate to PrS in control tissue did not significantly affect average baseline EPSC frequency, subsequent application of NBQX elicited significant reductions (p < 0.001, one-way repeated measures ANOVA, Table 4, Fig. 4A, 4C). There was an overall reduction in average EPSC amplitude as well particularly following application of NBQX (p = 0.01, one-way repeated measures ANOVA, Table 4, Fig. 4A, 4D). Overall, these data suggest that although PrS is connected with Par, its ability to enhance the excitatory drive of RS cells in Par is minimal in control animals. The baseline excitatory drive to Par neurons in epileptic rats (in aCSF) was comparable to controls, with averaged EPSC frequency and amplitude being similar for both groups (p = 0.41 and 0.18 respectively, t-test, Table 4, Fig. 4A-4D). As with control animals, focal application of glutamate to PrS in epileptic animals failed to produce any significant changes in average baseline EPSC frequency but subsequent application of NBQX elicited significant reductions (p = 0.005, one-way repeated measures ANOVA, Table 4, Fig. 4B, 4C). Averaged EPSC amplitude was unaffected (p = 0.441, one-way repeated measures ANOVA, Table 4, Fig. 4B, 4D). EPSCs were generally larger in amplitude in epileptic animals compared with controls. Together, these data suggest that PrS neurons project to RS cells in Par and that excitatory drive to Par is comparable between control and epileptic rats. Glutamate application in PrS is likely ineffective because PrS→Par connectivity is maximally driven under both conditions and could only be suppressed with NBQX.
Table 4.
Frequency and amplitude of excitatory (E) and inhibitory (I) postsynaptic currents (PSC) recorded under the indicated conditions. Recording configuration A→B indicates CESOP in region A while recording in region B. Values represent mean ± SEM for number of cells tested in each group (n). Significance of drug effects assessed using the one-way repeated measures ANOVA are indicated by the bolded text.
| CESOP | aCSF | glutamate | NBQX | |||||||||
|---|---|---|---|---|---|---|---|---|---|---|---|---|
| recording configuration | measure | PSCs |
n con, epi |
control | epileptic | control | epileptic | control | epileptic | |||
| PrS → Par | frequency (Hz) | E | 12, 8 | 7.0 ± 2.1 | 9.4 ± 1.7 | 5.3 ± 1.8 | 7.5 ± 1.1 | 2.9 ± 1.2 | 5.5 ± 1.1 | |||
| I | 9, 7 | 7.1 ± 1.9 | 6.1 ± 1.7 | 6.3 ± 2.1 | 4.9 ± 1.6 | 3.7 ± 1.4 | 5.0 ± 1.8 | |||||
| amplitude (pA) | E | 12,8 | 21 ± 4 | 29 ± 3 | 19 ± 3 | 27 ± 3 | 15 ± 3 | 26 ± 4 | * | |||
| I | 9, 7 | 53 ± 12 | 45 ± 6 | 37 ± 8 | 38 ± 5 | 26 ± 5 | 32 ± 4 | |||||
| Par → LII PrS |
frequency (HZ) | E | 11, 8 | 4.2 ± 1 | 4.1 ± 1.5 | 3.6 ± 0.8 | 3.6 ± 1.2 | 3.3 ± 0.7 | 1.9 ± 0.4 | |||
| I | 10, 8 | 4.0 ± 1.3 | 4.1 ± 1.7 | 4.0 ± 0.9 | 4.0 ± 1.9 | 3.5 ± 1 | 1.7 ± 0.6 | |||||
| amplitude (pA) | E | 11, 8 | 22 ± 3 | 23 ± 2 | 21 ± 2 | 27 ± 3 | 20 ± 2 | 21 ± 3 | ||||
| I | 10, 8 | 34 ± 4 | 41 ± 9 | 33 ± 4 | 49 ± 16 | 27 ± 3 | 30 ± 7 | |||||
| Par → LIII PrS |
frequency (Hz) | E | 12, 9 | 5.9 ± 1.5 | 4.7 ± 1.3 | 4.7 ± 1.3 | 5.1 ± 1.5 | 2.8 ± 1.1 | 3.0 ± 1.0 | |||
| I | 10, 8 | 7.0 ± 1.2 | 4.5 ± 1.5 | 4.0 ± 1 | 2.4 ± 0.8 | 2.7 ± 0.6 | 2.3 ± 0.8 | |||||
| amplitude (pA) | E | 12, 9 | 20 ± 2 | 19 ± 2 | 19 ± 2 | 20 ± 1 | 17 ± 1 | 18 ± 2.4 | ||||
| I | 10, 8 | 38 ± 6 | 31 ± 4 | 37 ± 8 | 27 ± 4 | 24 ± 2 | 24 ± 4 | |||||
| Par → LII MEA |
frequency (Hz) | E | 12, 9 | 8.5 ± 1.1 | 8.6 ± 3 | 6.9 ± 1.1 | 7.3 ± 2.3 | 5.6 ± 0.8 | 6.1 ± 2.4 | |||
| I | 11, 9 | 4.7 ± 1 | 7.5 ± 1.7 | 5.0 ± 1.2 | 6.4 ± 1.6 | 3.3 ± 0.9 | 4.0 ± 1.1 | |||||
| amplitude (pA) | E | 12, 9 | 31 ± 4 | 22 ± 2 | * | 26 ± 4 | 22 ± 1 | 24± 4 | 23 ± 2 | |||
| I | 11, 9 | 69 ± 13 | 71 ± 12 | 60 ± 13 | 72 ± 10 | 55 ± 9 | 62 ± 11 | |||||
| Par → LIII MEA |
frequency (Hz) | E | 13, 9 | 7.2 ± 2.1 | 11.5 ± 1.5 | 7.0 ± 2.6 | 10.6 ± 2 | 6.1 ± 2.4 | 8.4 ± 2.5 | |||
| I | 12, 8 | 3.0 ± 0.6 | 5.3 ± 1 | 2.8 ± 0.5 | 5.9 ± 1.6 | * | 1.9 ± 0.4 | 4.6 ± 1.4 | * | |||
| amplitude (pA) | E | 13, 9 | 26 ± 2 | 26 ± 1 | 22 ± 1 | 27 ± 3 | 21 ± 1 | 25 ± 3 | ||||
| I | 12, 8 | 48 ± 6 | 57 ± 11 | 47 ± 9 | 58 ± 14 | 40 ± 5 | 47 ± 9 | |||||
p < 0.05 (t-test), for cross-comparisons between control and epileptic tissue.
Focal application of glutamate followed by NBQX to PrS in control tissue significantly reduced average baseline IPSC frequency (p = 0.01, one-way repeated measures ANOVA, Table 4, Fig. 4E, 4G), with the greatest reduction observed between aCSF and NBQX. There was an overall reduction in average IPSC amplitude as well (p = 0.001, one-way repeated measures ANOVA, Table 4, Fig. 4E, 4H). Overall, these data suggest that although PrS is connected with Par, its ability to enhance the inhibitory drive of RS cells in Par is minimal in control animals. Synaptic inhibition of RS cells in the Par was reduced in epileptic rats albeit not significantly in this cohort of animals as suggested by the averaged baseline IPSC frequency and amplitude (p = 0.69 and 0.56 respectively, t-test, Table 4, Fig. 4E–4H, 2E–2G). Focal application of glutamate followed by NBQX to PrS in epileptic animals failed to produce any significant changes in average baseline IPSC frequency (p = 0.220, one-way repeated measures ANOVA, Table 4, Fig. 4F, 4G) despite reductions in averaged IPSC amplitude (p < 0.001, one-way repeated measures ANOVA, Table 4, Fig. 4F, 4H). Together, these data suggest a maximally driven GABAergic projection from PrS to Par under normal conditions that is compromised in epileptic animals.
Overall (Fig. 4, interim summary), our data suggests that PrS contributes to both excitatory and inhibitory synaptic drive of Par neurons in control animals. However, the loss of inhibitory (but not excitatory) synaptic drive in epileptic animals is consistent with reductions in the number of inhibitory synapses and/or probability of action potential-dependent GABA release (Fig. 2G), likely due to loss of inhibitory neurons in the PrS (Abbasi and Kumar, 2015).
Assaying Par→PrS (LII) connectivity: Par and PrS (LII) are not synaptically connected
Given that PrS projects to the Par, we assessed the reverse connectivity using CESOP in Par while recording from cells in LII of PrS under normal and epileptic conditions (Fig. 5). Focal application of glutamate followed by NBQX to Par in control tissue did not significantly affect average baseline EPSC frequency (p = 0.619, one-way repeated measures ANOVA, Table 4, Fig. 5A, 5C) or amplitude (p = 0.813, one-way repeated measures ANOVA, Table 4, Fig. 5A, 5D). Overall, these data suggest that Par and PrS (LII) are not synaptically connected in control animals and Par neurons do not contribute to PrS (LII) excitability. The baseline excitatory drive to LII PrS neurons in epileptic rats (in aCSF) was comparable to controls, with averaged EPSC frequency and amplitude being similar for both groups (p = 0.93 and 0.89 respectively, t-test, Table 4, Fig. 5A–5D). As with control animals, focal application of glutamate followed by NBQX to Par in epileptic animals failed to produce significant changes in average frequency (p = 0.114, one-way repeated measures ANOVA, Table 4, Fig. 5B, 5C) or amplitude (p = 0.092, one-way repeated measures ANOVA, Table 4, Fig. 5B, 5D). Together, these data further confirm that Par contributes minimally, if at all, to the excitability of LII cells in PrS in control and epileptic animals.
Figure 5.

Assaying Par→PrS (LII) interactions using CESOP. Schematic (top left) of the recording configuration showing location of recording (R) and CESOP electrodes. PrS connectivity in this and all subsequent figures as previously published (Abbasi and Kumar, 2015). A-B, Voltage-clamp recordings of EPSCs (inward events at −70 mV holding potential) from LII PrS neurons in control (A) and epileptic (B) rats while perfusing the indicated compounds in Par (top: aCSF; middle: 100 μm glutamate; bottom: 10 μm NBQX) sequentially; insets (A-B) are composite averages of all detectable events in a given trace (below). C-D, plots of averaged frequency (C) and amplitude (D) as a function of the experimental condition for EPSCs during 1 min-long recordings from control and epileptic animals. E-F, Voltage-clamp recordings of IPSCs (outward events at 0 mV holding potential) from LII PrS neurons in control (E) and epileptic (F) rats while perfusing the indicated compound in the Par; insets (E-F) are composite averages of all detectable events in a given trace (below). G-H, plots of averaged frequency (G) and amplitude (H) as a function of the experimental condition for IPSCs during 1 min-long recordings from control and epileptic animals. Schematic (top) is an interim summary of all Par→PrS (LII) interactions gleaned from the electrophysiological data under control (left) and epileptic (right) conditions. The Par and PrS (LII) are not synaptically connected with each other.
Synaptic inhibition, like excitation, of LII cells in the PrS is unaffected in epileptic rats as suggested by the averaged baseline IPSC frequency and amplitude (p = 0.97 and 0.47 respectively, t-test, Table 4, Fig. 5E–5H). Focal application of glutamate followed by NBQX to Par in control animals did not significantly affect average IPSC frequency (p = 0.837, one-way repeated measures ANOVA, Table 4, Fig. 5E, 5G) or amplitude (p = 0.336, one-way repeated measures ANOVA, Table 4, Fig. 5E, 5H). As expected, cells in LII of PrS in epileptic animals were also unaffected by glutamate and NBQX in average IPSC frequency (p = 0.171, one-way repeated measures ANOVA, Table 4, Fig. 5F, 5G) or amplitude (p = 0.261, one-way repeated measures ANOVA, Table 4, Fig. 5F, 5H). These data suggest that Par is not synaptically connected with LII of PrS and does not contribute to its inhibition in control and epileptic animals.
Overall (Fig. 5, interim summary), our data suggest that Par does not contribute to either the excitatory or inhibitory synaptic drive of LII PrS neurons in control and epileptic animals. These data nonetheless serve as a negative control, further validating the effects of glutamate and/or NBQX application via CESOP.
Assaying Par→PrS (LIII) connectivity: Par-mediated synaptic excitation and inhibition of LIII neurons in PrS is compromised in epileptic animals
Previous work has shown that RS cells in the PrS become hyperexcitable under epileptic conditions (Abbasi and Kumar, 2014). To determine whether Par contributes to this hyperexcitability, we used CESOP in Par while recording from cells in LIII of PrS under normal and epileptic conditions (Fig. 6).
Figure 6.

Assaying Par→PrS (LIII) interactions using CESOP. Schematic (top left) of the recording configuration showing location of recording (R) and CESOP electrodes. A-B, Voltage-clamp recordings of EPSCs (inward events at −70 mV holding potential) from PrS (LIII) neurons in control (A) and epileptic (B) rats while perfusing the indicated compounds in Par (top: aCSF; middle: 100 μm glutamate; bottom: 10 μm NBQX) sequentially; insets (A-B) are composite averages of all detectable events in a given trace (below). C-D, plots of averaged frequency (C) and amplitude (D) as a function of the experimental condition for EPSCs during 1 min-long recordings from control and epileptic animals. E-F, Voltage-clamp recordings of IPSCs (outward events at 0 mV holding potential) from PrS (LIII) neurons in control (E) and epileptic (F) rats while perfusing the indicated compound in the Par; insets (E-F) are composite averages of all detectable events in a given trace (below). G-H, plots of averaged frequency (G) and amplitude (H) as a function of the experimental condition for IPSCs during 1 min-long recordings from control and epileptic animals. Schematic (top) is an interim summary of all Par→PrS (LIII) interactions gleaned from the electrophysiological data under control (left) and epileptic (right) conditions. Par-mediated synaptic excitation and inhibition of LIII neurons in PrS is compromised in epileptic animals.
Focal application of glutamate followed by NBQX to Par in control tissue both significantly reduced average baseline EPSC frequency (p = 0.002, one-way repeated measures ANOVA, Table 4, Fig. 6A, 6C) but not amplitude (p = 0.08, one-way repeated measures ANOVA, Table 4, Fig. 6A, 6D) in LIII PrS neurons. Overall, these data suggest direct glutamatergic and indirect GABAergic synaptic inputs from Par influence excitability of LIII PrS in control animals. The baseline excitatory drive to cells in LIII of PrS in epileptic rats (in aCSF) was comparable to controls, with averaged EPSC frequency and amplitude being similar for both groups (p = 0.56 and 0.61 respectively, t-test, Table 4, Fig. 6A–6D). Unlike controls, focal application of glutamate followed by NBQX to Par in epileptic animals had no effect on average EPSC frequency (p = 0.2, one-way repeated measures ANOVA, Table 4, Fig. 6B, 6C) or amplitude (p = 0.463, one-way repeated measures ANOVA, Table 4, Fig. 6B, 6D). Together, these data suggest that the direct glutamatergic and indirect GABAergic synaptic inputs from Par to LIII neurons of PrS in controls are compromised under epileptic conditions.
Synaptic inhibition of LIII PrS cells was comparable in epileptic rats as suggested by the averaged baseline IPSC frequency and amplitude (p = 0.2 and 0.3 respectively, t-test, Table 4, Fig. 6E–6H). Focal application of glutamate followed by NBQX to Par in control animals both significantly reduced average IPSC frequency (p < 0.001, one-way repeated measures ANOVA, Table 4, Fig. 6F, 6G) and amplitude (p = 0.022, one-way repeated measures ANOVA, Table 4, Fig. 6F, 6H). However, cells in LIII of PrS in epileptic animals were unaffected by glutamate or NBQX in average IPSC frequency (p = 0.067, one-way repeated measures ANOVA, Table 4, Fig. 6F, 6G) or amplitude (p = 0.214, one-way repeated measures ANOVA, Table 4, Fig. 6F, 6H) compared with controls. These data suggest that inhibition of LIII neurons in PrS is controlled indirectly through Par mediated disinhibition of GABAergic synaptic inputs in control animals. However, this inhibitory drive appears to be disrupted in epileptic animals.
Overall (Fig. 6, interim summary), our data suggests that both Par-mediated synaptic excitation and inhibition of LIII neurons in PrS are compromised in epileptic animals. The compromised excitatory synaptic drive in epileptic animals is likely mediated by loss of RS cells within Par. The compromised inhibitory synaptic drive in epileptic animals, on the other hand, is likely mediated by loss of Par-driven GABAergic neurons outside of the Par (Kumar and Buckmaster, 2006).
Assaying Par→MEA (LII) connectivity: Par contributes more to LII stellate cell inhibition in the MEA than excitation
Previous work has shown that stellate cells in LII of MEA, the major source of excitatory synaptic input to the dentate gyrus (Segal and Landis, 1974; Steward and Scoville, 1976) become hyperexcitable under epileptic conditions (Bear, et al., 1996; Scharfman, et al., 1998; Tolner et al., 2005). Hyperexcitability of these neurons has been attributed, at least in part, to loss of GABAergic synaptic input and reduced recurrent inhibition (Kumar and Buckmaster, 2006; Kumar, et al., 2007). To determine whether Par also contributes to this hyperexcitability, given potential anatomical connectivity (Canto, et al., 2012), we used CESOP in Par while recording from cells in LII of MEA under normal and epileptic conditions (Fig. 7).
Figure 7.

Assaying Par→MEA (LII) interactions using CESOP. Schematic (top left) of the recording configuration showing location of recording (R) and CESOP electrodes. A-B, Voltage-clamp recordings of EPSCs (inward events at −70 mV holding potential) from stellate cells in LII of MEA in control (A) and epileptic (B) rats while perfusing the indicated compounds in Par (top: aCSF; middle: 100 μm glutamate; bottom: 10 μm NBQX) sequentially; insets (A-B) are composite averages of all detectable events in a given trace (below). C-D, plots of averaged frequency (C) and amplitude (D) as a function of the experimental condition for EPSCs during 1 min-long recordings from control and epileptic animals. E-F, Voltage-clamp recordings of IPSCs (outward events at 0 mV holding potential) from stellate cells in LII of MEA in control (E) and epileptic (F) rats while perfusing the indicated compound in the Par; insets (E-F) are composite averages of all detectable events in a given trace (below). G-H, plots of averaged frequency (G) and amplitude (H) as a function of the experimental condition for IPSCs during 1 min-long recordings from control and epileptic animals. Schematic (top) is an interim summary of all Par→MEA (LII) interactions gleaned from the electrophysiological data under control (left) and epileptic (right) conditions. Par contributes more to LII stellate cell inhibition in the MEA than excitation.
Focal application of glutamate followed by NBQX to Par in control tissue significantly reduced average baseline EPSC frequency (p = 0.002, one-way repeated measures ANOVA, Table 4, Fig. 7A, 7C) but not amplitude (p = 0.106, one-way repeated measures ANOVA, Table 4, Fig. 7A, 7D) in LII MEA neurons. Overall, these data suggest that although Par is connected with LII of MEA, its ability to alter the excitatory dive of stellate cells in this region is minimal in control animals.
The baseline excitatory drive to LII stellate cells in MEA in epileptic rats (in aCSF) was comparable to controls, with averaged EPSC frequency being similar for both groups (p = 0.97, t-test, Table 4, Fig. 7A–7C). We did however observe a significantly reduced averaged EPSC amplitude in the epileptic animals (p < 0.05, t-test, Table 4, Fig. 7A–7D). Unlike controls, focal application of glutamate followed by NBQX to Par in epileptic animals had no effect on average EPSC frequency (p = 0.089, one-way repeated measures ANOVA, Table 4, Fig. 7B, 7C) or amplitude (p = 0.915, one-way repeated measures ANOVA, Table 4, Fig. 7B, 7D). Together, these data suggest that excitatory synaptic inputs from Par to LII stellate cells in MEA may be compromised under epileptic conditions.
Par mediated synaptic inhibition of stellate cells in LII of MEA was unexpectedly similar in this cohort of epileptic rats as suggested by the averaged baseline IPSC frequency and amplitude (p = 0.16 and 0.93 respectively, t-test, Table 4, Fig. 7E–7H, c.f. (Kumar and Buckmaster, 2006)). Focal application of glutamate followed by NBQX to Par in control tissue significantly reduced average IPSC frequency (p = 0.015, one-way repeated measures ANOVA, Table 4, Fig. 7E, 7G) and amplitude (p = 0.007, one-way repeated measures ANOVA, Table 4, Fig. 7E, 7H). As with controls, average IPSC frequency in LII cells of MEA in epileptic tissue was significantly reduced by glutamate followed by NBQX (p < 0.001, one-way repeated measures ANOVA, Table 4, Fig. 7F, 7G) but not amplitude (p = 0.979, one-way repeated measures ANOVA, Table 4, Fig. 4F, 4H). These data suggest a maximally active inhibitory synaptic input in controls that is conserved in epileptic animals.
Overall (Fig. 7, interim summary), our data suggests that Par contributes to both excitation and inhibition of LII stellate cells in the MEA under normal conditions. However, only the inhibitory synaptic drive is conserved under epileptic conditions, presumably due to loss of RS cells within Par. Stellate cell hyperexcitability is therefore influenced not only by their connectivity within MEA (Kumar and Buckmaster, 2006; Kumar, et al., 2007) but also the PrS (Abbasi and Kumar, 2015) and now, the Par.
Assaying Par→MEA (LIII) connectivity: Par-mediated inhibition of pyramidal neurons in LIII of MEA is compromised in TLE
Loss of LIII neurons in MEA is a hallmark of TLE (Clifford et al., 1987; Du, et al., 1995; Du, et al., 1993; Kumar and Buckmaster, 2006; Schwob et al., 1980). To determine whether Par contributes to the pathophysiology of this region, we used CESOP in Par while recording from pyramidal neurons in LIII of the MEA under normal and epileptic conditions (Fig. 8).
Focal application of glutamate followed by NBQX to Par in control tissue did not significantly alter average baseline EPSC frequency (p = 0.262, one-way repeated measures ANOVA, Table 4, Fig. 8A, 8C) despite a significant reduction in averaged EPSC amplitude (p = 0.011, one-way repeated measures ANOVA, Table 4, Fig. 8A, 8D). Overall, these data suggest that Par does not contribute significantly to the excitatory drive of LIII pyramidal neurons in control animals.
The baseline excitatory drive to LIII neurons of MEA neurons in epileptic rats (in aCSF) was comparable to controls, with averaged EPSC frequency and amplitude being similar for both groups (p = 0.15 and 0.91 respectively, t-test, Table 4, Fig. 8A–8D). We noted that EPSC frequency tended to be higher in epileptic animals, but this difference was not statistically significant. Focal application of glutamate followed by NBQX to Par in epileptic tissue failed to produce significant changes in average EPSC frequency (p = 0.213, one-way repeated measures ANOVA, Table 4, Fig. 8B, 8C) or amplitude (p = 0.633, one-way repeated measures ANOVA, Table 4, Fig. 8B, 8D). As expected, these data corroborate that Par neurons likely have no significant influence on the excitatory drive of LIII pyramidal cells in the MEA.
Synaptic inhibition of these neurons was comparable between control and epileptic rats with average baseline IPSC frequency and amplitudes being similar (p = 0.06 and 0.44 respectively, t-test, Table 4, Fig. 8E–8H). Focal application of glutamate to Par followed by NBQX in control tissue significantly reduced average IPSC frequency (p = 0.003, one-way repeated measures ANOVA, Table 4, Fig. 8E, 8G), however this trend was abolished in epileptic tissue (p = 0.433, one-way repeated measures ANOVA, Table 4, Fig. 8F, 8G). Average IPSC frequency, but not amplitude, was significantly elevated in epileptic compared with control tissue during application of glutamate and NBQX (p < 0.05 for both, t-test, Table 4, Fig. 8G). Focal application of glutamate followed by NBQX to Par did not significantly affect averaged IPSC amplitudes in control (p = 0.525, one-way repeated measures ANOVA, Table 4, Fig. 8E, 8H) or epileptic (p = 0.263, one-way repeated measures ANOVA, Table 4, Fig. 8F, 8H) tissue.
Overall (Fig. 8, interim summary), our data suggests that LIII pyramidal neurons in MEA receive indirect inhibitory synaptic inputs from Par and other adjoining regions including the MEA (Kumar and Buckmaster, 2006) and the PrS (Abbasi and Kumar, 2014; Abbasi and Kumar, 2015). However, the inhibitory drive from the Par appears to be lost under epileptic conditions, presumably due to the loss of RS cells within the Par.
Loss of neurons in Par under epileptic conditions
Analysis of Par-PrS-MEA connectivity using CESOP suggests that RS cells in the Par are lost under chronically epileptic conditions (Figs. 6–8). To assay potential loss of Par neurons, we used an indigenously developed cell counting method to approximate the relative numbers of NeuN-positive cells in the 400 μm-thick brain sections from control and epileptic animals that were used for gathering electrophysiological data. We also quantified the characteristic TLE-related cell loss in LIII of MEA in these sections as an internal control. Confocal images of NeuN-stained brain slices containing the Par and MEA (Fig. 9A1) were obtained using an inbuilt tile scanning protocol that enabled sequential capture of individual tiles under high-magnification (Fig. 9A2). NeuN-positive cells within individual tiles (Fig. 9A3) in a demarcated region of interest were then counted manually for estimates of the total number of cells per unit area of that region. The average NeuN-positive cell density in LIII of MEA in slices from epileptic animals was significantly reduced compared to controls (control: 2893 ± 167 cells/mm2, epileptic: 872 ± 97 cells/mm2; p <0.001; t-test), as was the average NeuN-positive cell density in Par (control: 3210 ± 259 cells/mm2, epileptic: 1953 ± 160 cells/mm2; p <0.005; t-test; Fig 9B). Taken together, these data confirm a significant reduction in cell counts in Par under chronically epileptic conditions. While this method cannot distinguish between excitatory and inhibitory neurons, circuit analysis with CESOP suggests loss of predominantly RS cells within the Par (Fig. 10).
Discussion
This study reports on an assessment of the cellular composition of the Par, the intrinsic characteristics / state of its neurons, and their connectivity and influence over the excitability of juxtaposed PrS and MEA in the context of normal function and TLE (see synthesis Fig. 10). Using CESOP, we have identified and isolated potential epileptogenic cells and circuits within the Par and determined how they influence the excitability of neurons in PrS and MEA. The findings are of significance given that TLE is often intractable to anticonvulsant therapy and understanding basic pathophysiological mechanisms in interlinked structures of the temporal lobe constitutes an essential approach for developing new interventional strategies.
The pre- and parasubiculum, relatively obscure structures lying at the interface between the hippocampus and entorhinal cortex, have been implicated in rendering neurons in the MEA hyperexcitable during TLE. We find that Par neurons, which are predominantly RS cells, are hyperexcitable in TLE, but mechanisms underlying their hyperexcitability differ from those in juxtaposed PrS or MEA. The Par is disconnected with LII of the PrS, but strongly modulates excitability of LIII PrS neurons (Funahashi and Stewart, 1997) which together contribute significantly to regulating the excitability of LIII pyramids in the MEA. However, the Par becomes essentially decoupled from the PrS under epileptic conditions. Although Par does not directly contribute to pyramidal neuron excitability in LIII of MEA, c.f. (Canto, et al., 2012), it does influence it indirectly through feed-forward inhibition. The Par contributes to both the excitatory and inhibitory synaptic drive of stellate cells in LII of MEA under normal conditions, however excitatory drive is disrupted under epileptic conditions presumably due to loss of RS cells in Par. The electrophysiologically predicted cell loss in Par is confirmed through histology and together suggest loss of excitatory neurons in the Par, a trend that is opposite to the one seen in the PrS where inhibitory neurons seem to be lost. Our data also suggest that unlike PrS, which has a heterogeneous cell population, the Par is a more homogenous structure with a single dominant cell type.
CESOP for deciphering epileptogenic changes in parahippocampal cells and circuits
The CESOP approach lends itself nicely for assessments of not only connectivity between juxtaposed regions, but also the determination of how enhancement and suppression of excitation in one region affect the excitatory and inhibitory synaptic drive of neurons in another interconnected region. This is advantageous in deciphering the pathophysiology of TLE which is known for the hyperexcitability and loss of neurons and circuit disruptions. Assessments of functional connectivity via CESOP are particularly useful in situations that require co-activation of larger cohorts of neurons in a region of interest than is possible with either glutamate-uncaging or optogenetic stimulation. Additionally, CESOP circumvents confounding issues arising from activating fibers of passage with electrical stimulation alone and can aid in bolstering and/or refining anatomical findings using retrograde and anterograde tracers whose scope might be limited to first order synapses. Indeed, as can be seen form the synthesis Figure 10, stitched from the interim summary figures of the pairwise assessment of regional connectivity, much of the control of neurons in LII and LIII of MEA is through second order feed forward inhibition and/or disinhibition (Jones and Buhl, 1993). Note however, that several factors including the nature of the brain slice preparation, desensitization of receptors and depolarization induced block of AP firing (Bianchi et al., 2012) may preclude the generation of EPSC barrages in postsynaptic target neurons upon stimulation of presynaptic neurons with glutamate in acute brain slices. This coupled with the observation that neuronal firing rates may be lower in vivo compared with frequencies of recorded events in slices and subject to oscillations in Vm and cholinergic modulation (Alonso and Llinas, 1989; Destexhe and Pare, 1999; Fernandez et al., 2018; Glasgow and Chapman, 2013; Heys et al., 2012) suggests limits to depolarization-induced firing of neurons beyond which glutamate might be ineffective in driving neuronal circuits further. Because of the possibility that this state might already be reached in an in vitro system such as the one used in this study, it is imperative to follow glutamate application with NBQX to suppress the responses in querying synaptic connectivity between regions.
GABAergic neurons in LIII of MEA are lost in TLE (Kumar and Buckmaster, 2006) leading to hyperexcitability of LII stellate cell and reduced inhibition of LIII pyramidal neurons. Additionally, the balance of excitation versus inhibition in these structures, LIII MEA in particular, appears to be disrupted in TLE in two other underappreciated ways: 1) indirectly, through loss of excitatory RS cells in Par, which severely compromise feed forward inhibition of LIII pyramidal neurons (the foot-off brakes-off scenario), and 2) directly, through loss of GABAergic neurons in PrS, which compromises inhibition of principal neurons in LII and LIII of MEA (the foot-on brakes-off scenario). Additionally, the loss of RS cells in Par, may disrupt feed-forward inhibition of RS cells in PrS, contributing to their hyperexcitability under epileptic conditions. The loss of neurons, particularly GABAergic interneurons, in selective areas of the parahippocampal region is a key pathophysiological feature of TLE leading to disruptions in the balance between excitation and inhibition. However, we observed unusually large variations in synaptic inhibition between cohorts of animals used in this and previous studies suggesting caution in making cross comparisons. We are unsure about how or why these differences are manifest, but one hypothesis is the variability in the number of GABAergic neurons lost in these animals under epileptic conditions.
Early anatomical studies have indicated that PrS and Par projections to the MEA are cell specific (Tang et al., 2016) and lamina-specific with PrS projecting to LI and LIII and Par projecting to LII of MEA (Caballero-Bleda and Witter, 1993; Caballero-Bleda and Witter, 1994; Kohler, 1984; van Groen and Wyss, 1990). More recently, however, it was postulated that neurons in all principal layers of MEA receive monosynaptic inputs from both Par and PrS owing to their dendritic extensions which span multiple layers of MEA (Canto, et al., 2012; Tolner, et al., 2007; Wouterlood et al., 2004). Although our study cannot specify the terminal fields of Par / PrS projections to the MEA, it does shed light on which of these projections are functional in regulating the excitability of their target neurons. The physiological data obtained through CESOP suggesting preferential targeting of neurons in LII of MEA by Par inputs is consistent with anatomical findings. However, data regarding the lack of effect of glutamate application in the Par on the excitability of LIII pyramidal neurons in MEA is inconsistent with a monosynaptic projection. Application of glutamate via CESOP presumably activates a large number of neurons in Par, yet, average EPSC frequency in LIII neurons of MEA remained largely unaffected (Fig. 8). One explanation for the lack of an effect is the co-activation of local GABAergic neurons which hyperpolarize MEA-projecting RS cells. However, the lack of effect of subsequent application of NBQX, which presumably decouples this inhibition, falsifies this hypothesis. Furthermore, there was no decrease in average EPSC frequency in these neurons despite loss of RS cells in the Par and changes in IPSC frequency in epileptic animals. This example illustrates how CESOP can aid in deciphering excitatory and inhibitory functional connectivity between regions and refine anatomically-based inferences.
Functional Significance
The Par and PrS contribute significantly to TLE-related pathophysiology. The targeting of LII cells in the MEA by Par neurons potentially affects their excitability and that of downstream hippocampal structures via the perforant pathway (Caruana and Chapman, 2004). Ablation of Par/PrS has been shown to restrict seizure-induced cell loss in LIII of MEA (Eid, et al., 2001). Together with our previous findings in the PrS (Abbasi and Kumar, 2013; Abbasi and Kumar, 2014; Abbasi and Kumar, 2015), data from the Par suggest that the two structures contribute to MEA excitability through different mechanisms and exhibit distinct pathologies and pathophysiologies. While RS cells in PrS are hyperexcitable by virtue of a diminished inhibitory synaptic drive under epileptic conditions, RS cells in the Par are intrinsically hyperexcitable under the same conditions. Potential loss of inhibitory neurons in the PrS is contrasted by loss of excitatory neurons in the Par under epileptic conditions. Additionally, Par and PrS influence each other’s excitability through bilateral connections. Given the different etiologies for TLE-mediated hyperexcitability of neurons in the parahippocampal region, it would be reasonable to assume that a one-size-fits-all approach to intervention might be less efficacious than a region-specific strategy. Thus, drugs targeting BKCa channels to control temporal lobe seizures (N’Gouemo, 2011) might be more efficacious in the Par than in the PrS.
Highlights.
A physiological characterization of the parasubiculum under normal and epileptic conditions.
Functional analysis of parahippocampal circuitry and its alterations in TLE using CESOP.
Parasubicular neuron loss deduced from circuit-level functional analysis and confirmed using confocal microscopy.
Acknowledgements:
We thank Dr. Stephen Beesley for critically reading the manuscript and for his suggestions and Ruth Didier for her expert guidance and assistance with confocal microscopy. We acknowledge with gratitude the encouragement and support of our epilepsy research program by Dr. Barbara Licht, retired Professor, Dept. of Psychology, Florida State University.
Grants: This work was supported in part by grants from the CRC and CoM at Florida State University, Epilepsy Foundation, and the National Institutes of Health [R01NS097802].
Footnotes
Publisher's Disclaimer: This is a PDF file of an unedited manuscript that has been accepted for publication. As a service to our customers we are providing this early version of the manuscript. The manuscript will undergo copyediting, typesetting, and review of the resulting proof before it is published in its final citable form. Please note that during the production process errors may be discovered which could affect the content, and all legal disclaimers that apply to the journal pertain.
References
- Abbasi S, Kumar SS (2013), Electrophysiological and morphological characterization of cells in superficial layers of rat presubiculum. J Comp Neurol 521:3116–3132. [DOI] [PubMed] [Google Scholar]
- Abbasi S, Kumar SS (2014), Regular-spiking cells in the presubiculum are hyperexcitable in a rat model of temporal lobe epilepsy. J Neurophysiol 112:2888–2900. [DOI] [PMC free article] [PubMed] [Google Scholar]
- Abbasi S, Kumar SS (2015), Layer-specific modulation of entorhinal cortical excitability by presubiculum in a rat model of temporal lobe epilepsy. J Neurophysiol 114:2854–2866. [DOI] [PMC free article] [PubMed] [Google Scholar]
- Alonso A, Llinas RR (1989), Subthreshold Na+-dependent theta-like rhythmicity in stellate cells of entorhinal cortex layer II. Nature 342:175–177. [DOI] [PubMed] [Google Scholar]
- Bear J, Fountain NB, Lothman EW (1996), Responses of the superficial entorhinal cortex in vitro in slices from naive and chronically epileptic rats. J Neurophysiol 76:2928–2940. [DOI] [PubMed] [Google Scholar]
- Bianchi D, Marasco A, Limongiello A, Marchetti C, Marie H, Tirozzi B, Migliore M (2012), On the mechanisms underlying the depolarization block in the spiking dynamics of CA1 pyramidal neurons. J Comput Neurosci 33:207–225. [DOI] [PubMed] [Google Scholar]
- Boccara CN, Sargolini F, Thoresen VH, Solstad T, Witter MP, Moser EI, Moser MB (2010), Grid cells in pre- and parasubiculum. Nat Neurosci 13:987–994. [DOI] [PubMed] [Google Scholar]
- Buckmaster PS (2004), Laboratory animal models of temporal lobe epilepsy. Comp Med 54:473–485. [PubMed] [Google Scholar]
- Caballero-Bleda M, Witter MP (1993), Regional and laminar organization of projections from the presubiculum and parasubiculum to the entorhinal cortex: an anterograde tracing study in the rat. J Comp Neurol 328:115–129. [DOI] [PubMed] [Google Scholar]
- Caballero-Bleda M, Witter MP (1994), Projections from the presubiculum and the parasubiculum to morphologically characterized entorhinal-hippocampal projection neurons in the rat. Exp Brain Res 101:93–108. [DOI] [PubMed] [Google Scholar]
- Canto CB, Koganezawa N, Beed P, Moser EI, Witter MP (2012), All layers of medial entorhinal cortex receive presubicular and parasubicular inputs. J Neurosci 32:17620–17631. [DOI] [PMC free article] [PubMed] [Google Scholar]
- Caruana DA, Chapman CA (2004), Stimulation of the parasubiculum modulates entorhinal cortex responses to piriform cortex inputs in vivo. J Neurophysiol 92:1226–1235. [DOI] [PubMed] [Google Scholar]
- Clifford DB, Olney JW, Maniotis A, Collins RC, Zorumski CF (1987), The functional anatomy and pathology of lithium-pilocarpine and high-dose pilocarpine seizures. Neuroscience 23:953–968. [DOI] [PubMed] [Google Scholar]
- Destexhe A, Pare D (1999), Impact of network activity on the integrative properties of neocortical pyramidal neurons in vivo. J Neurophysiol 81:1531–1547. [DOI] [PubMed] [Google Scholar]
- Du F, Eid T, Lothman EW, Kohler C, Schwarcz R (1995), Preferential neuronal loss in layer III of the medial entorhinal cortex in rat models of temporal lobe epilepsy. J Neurosci 15:6301–6313. [DOI] [PMC free article] [PubMed] [Google Scholar]
- Du F, Whetsell WO Jr., Abou-Khalil B, Blumenkopf B, Lothman EW, Schwarcz R (1993), Preferential neuronal loss in layer III of the entorhinal cortex in patients with temporal lobe epilepsy. Epilepsy Res 16:223–233. [DOI] [PubMed] [Google Scholar]
- Eid T, Du F, Schwarcz R (2001), Ibotenate injections into the pre- and parasubiculum provide partial protection against kainate-induced epileptic damage in layer III of rat entorhinal cortex. Epilepsia 42:817–824. [DOI] [PubMed] [Google Scholar]
- Fernandez FR, Rahsepar B, White JA (2018), Differences in the Electrophysiological Properties of Mouse Somatosensory Layer 2/3 Neurons In Vivo and Slice Stem from Intrinsic Sources Rather than a Network-Generated High Conductance State. eNeuro 5. [DOI] [PMC free article] [PubMed] [Google Scholar]
- Funahashi M, Stewart M (1997), Presubicular and parasubicular cortical neurons of the rat: electrophysiological and morphological properties. Hippocampus 7:117–129. [DOI] [PubMed] [Google Scholar]
- Glasgow SD, Chapman CA (2013), Muscarinic depolarization of layer II neurons of the parasubiculum. PLoS One 8:e58901. [DOI] [PMC free article] [PubMed] [Google Scholar]
- Heys JG, Schultheiss NW, Shay CF, Tsuno Y, Hasselmo ME (2012), Effects of acetylcholine on neuronal properties in entorhinal cortex. Front Behav Neurosci 6:32. [DOI] [PMC free article] [PubMed] [Google Scholar]
- Honda Y, Ishizuka N (2004), Organization of connectivity of the rat presubiculum: I. Efferent projections to the medial entorhinal cortex. J Comp Neurol 473:463–484. [DOI] [PubMed] [Google Scholar]
- Jones RS, Buhl EH (1993), Basket-like interneurones in layer II of the entorhinal cortex exhibit a powerful NMDA-mediated synaptic excitation. Neurosci Lett 149:35–39. [DOI] [PubMed] [Google Scholar]
- Kohler C (1984), Morphological details of the projection from the presubiculum to the entorhinal area as shown with the novel PHA-L immunohistochemical tracing method in the rat. Neurosci Lett 45:285–290. [DOI] [PubMed] [Google Scholar]
- Kohler C (1985), Intrinsic projections of the retrohippocampal region in the rat brain. I. The subicular complex. J Comp Neurol 236:504–522. [DOI] [PubMed] [Google Scholar]
- Kohler C (1986), Intrinsic connections of the retrohippocampal region in the rat brain. II. The medial entorhinal area. J Comp Neurol 246:149–169. [DOI] [PubMed] [Google Scholar]
- Kumar SS, Buckmaster PS (2006), Hyperexcitability, interneurons, and loss of GABAergic synapses in entorhinal cortex in a model of temporal lobe epilepsy. J Neurosci 26:4613–4623. [DOI] [PMC free article] [PubMed] [Google Scholar]
- Kumar SS, Jin X, Buckmaster PS, Huguenard JR (2007), Recurrent circuits in layer II of medial entorhinal cortex in a model of temporal lobe epilepsy. J Neurosci 27:1239–1246. [DOI] [PMC free article] [PubMed] [Google Scholar]
- N’Gouemo P (2011), Targeting BK (big potassium) channels in epilepsy. Expert Opin Ther Targets 15:1283–1295. [DOI] [PMC free article] [PubMed] [Google Scholar]
- Pilli J, Abbasi S, Richardson M, Kumar SS (2012), Diversity and excitability of deep-layer entorhinal cortical neurons in a model of temporal lobe epilepsy. J Neurophysiol 108:1724–1738. [DOI] [PubMed] [Google Scholar]
- Racine RJ (1972), Modification of seizure activity by electrical stimulation. II. Motor seizure. Electroencephalogr Clin Neurophysiol 32:281–294. [DOI] [PubMed] [Google Scholar]
- Scharfman HE, Goodman JH, Du F, Schwarcz R (1998), Chronic changes in synaptic responses of entorhinal and hippocampal neurons after amino-oxyacetic acid (AOAA)-induced entorhinal cortical neuron loss. J Neurophysiol 80:3031–3046. [DOI] [PubMed] [Google Scholar]
- Schwob JE, Fuller T, Price JL, Olney JW (1980), Widespread patterns of neuronal damage following systemic or intracerebral injections of kainic acid: a histological study. Neuroscience 5:991–1014. [DOI] [PubMed] [Google Scholar]
- Segal M, Landis S (1974), Afferents to the hippocampus of the rat studied with the method of retrograde transport of horseradish peroxidase. Brain Res 78:1–15. [DOI] [PubMed] [Google Scholar]
- Steward O, Scoville SA (1976), Cells of origin of entorhinal cortical afferents to the hippocampus and fascia dentata of the rat. J Comp Neurol 169:347–370. [DOI] [PubMed] [Google Scholar]
- Tang Q, Burgalossi A, Ebbesen CL, Sanguinetti-Scheck JI, Schmidt H, Tukker JJ, Naumann R, Ray S, et al. (2016), Functional Architecture of the Rat Parasubiculum. J Neurosci 36:2289–2301. [DOI] [PMC free article] [PubMed] [Google Scholar]
- Tolner EA, Frahm C, Metzger R, Gorter JA, Witte OW, Lopes da Silva FH, Heinemann U (2007), Synaptic responses in superficial layers of medial entorhinal cortex from rats with kainate-induced epilepsy. Neurobiol Dis 26:419–438. [DOI] [PubMed] [Google Scholar]
- Tolner EA, Kloosterman F, van Vliet EA, Witter MP, Silva FH, Gorter JA (2005), Presubiculum stimulation in vivo evokes distinct oscillations in superficial and deep entorhinal cortex layers in chronic epileptic rats. J Neurosci 25:8755–8765. [DOI] [PMC free article] [PubMed] [Google Scholar]
- van Groen T, Wyss JM (1990), The connections of presubiculum and parasubiculum in the rat. Brain Res 518:227–243. [DOI] [PubMed] [Google Scholar]
- van Groen T, Wyss JM (1990), Connections of the retrosplenial granular a cortex in the rat. J Comp Neurol 300:593–606. [DOI] [PubMed] [Google Scholar]
- Vogt BA, Miller MW (1983), Cortical connections between rat cingulate cortex and visual, motor, and postsubicular cortices. J Comp Neurol 216:192–210. [DOI] [PubMed] [Google Scholar]
- Witter MP, Amaral DG (2004) Hippocampal Formation. In: The Rat Nervous System, vol. (Paxinos G, ed), pp. 635–704. Elsevier Academic Press. [Google Scholar]
- Wouterlood FG, Van Haeften T, Eijkhoudt M, Baks-Te-Bulte L, Goede PH, Witter MP (2004), Input from the presubiculum to dendrites of layer-V neurons of the medial entorhinal cortex of the rat. Brain Res 1013:1–12. [DOI] [PubMed] [Google Scholar]