

Abstract
Mammalian target of rapamycin (mTOR) signaling is often aberrantly activated, particularly when genetically activated, in human cancers. mTOR inhibitors targeting the activated mTOR signaling are highly promising anti-cancer drugs. Knowing the activating genetic change in mTOR can help guide the use of mTOR inhibitors for cancer treatment. This study was conducted to identify and characterize novel oncogenic mTOR mutations that can potentially be therapeutic targets in human cancer.
We sequenced 30 exons of the mTOR gene in 12 thyroid cancer cell lines, 3 melanoma cell lines, 20 anaplastic thyroid cancer (ATC) tumors, and 23 melanoma tumors and functionally characterized the identified novel mTOR mutations in vitro and in vivo.
We identified a novel point mutation A1256G in ATC cell line and G7076A in melanoma tumor in exon 9 and exon 51 of the mTOR gene, respectively. Overexpression of the corresponding mTOR mutants H419R and G2359E created through induced mutagenesis showed dramatically elevated protein kinase activities associated with the activation of mTOR/p70S6K signaling in HEK293T cells. Stable expression of the two mTOR mutants in NIH3T3 cells strongly activated the mTOR/p70S6K signaling pathway and induced morphologic transformation, cell focus formation, anchorage-independent cell growth, and invasion. Inoculation of these mutant-expressing cells in athymic nude mice induced rapid tumor development, showing their driving oncogenicity. We also demonstrated that transfection with the novel mutants conferred cells high sensitivities to the mTOR inhibitor temsirolimus. We speculate that human cancers harboring these mTOR mutations, such as ATC and melanoma, may be effectively treated with inhibitors targeting mTOR.
Keywords: mTOR mutation, oncogene, mTOR/p70S6K signaling, thyroid cancer, melanoma
Introduction
Mammalian target of rapamycin (mTOR) is a serine/threonine protein kinase that functions as a master regulator of various fundamental cellular functions such as cell proliferation, growth, metabolism, and autophagy in response to the stimulation by various growth factors, amino acids and nutrients [1, 2]. mTOR forms two functionally distinct complexes termed mTORC1 and mTORC2 (mammalian target of rapamycin complex 1 and 2) by binding to various signaling protein molecules [1]. Many cancer-promoting signaling systems activate the mTORC1 pathway [3]. In response to growth factors and nutrients, mTORC1 regulates cell growth and proliferation through the phosphorylation of downstream effector substrates, ribosomal protein S6 kinase 1 (S6K1; also known as p70S6K) and eukaryotic translation initiation factor 4E-binding protein 1 (4EBP1) [1]. The function of mTORC2 is not very well understood, but it is considered as part of the PI3K/Akt pathway as it directly phosphorylates the hydrophobic motif at Ser 473 of Akt, which is one of the phosphorylation sites that are required for Akt activation in response to growth factor stimulation [3].
Aberrant activation of the mTOR signaling pathway has been reported in the majority of human cancers [1], including melanoma [4], and thyroid cancer [5]. mTOR plays a key role in human malignancies, making it an attractive target for cancer therapy. The mTOR inhibitors rapamycin and rapalogues (analogues of rapamycin) have been extensively studied as anti-neoplastic drugs in clinical trials. In particular, temsirolimus (also known as CCI-779) and everolimus are approved for the treatments of patients with advanced renal-cell carcinoma. Temsirolimus is also approved for the treatment of mantle-cell lymphoma. In addition to these drugs, second-generation inhibitors of mTOR have also entered clinical development [6].
Several studies have identified activating mTOR mutations with gain-of-function via artificial mutagenesis [7–9]. Expression of ΔTOR-deletion mutant (deletion of amino acids 2430–2450 in the kinase domain of the mTOR) in the HEK293 cells showed a 3.5-fold increase in the kinase activity, followed by enhanced phosphorylation of p70S6K [7]. Expression of this mutant in p53−/− MEF increased colony formation and addition of adenoviral E1A protein further enhanced the number of colonies. These results suggest that the ΔTOR expression could contribute to cell survival and transformation [10]. Some gain-of-function mTOR mutations are also on the list of cancer-associated mutations derived from COSMIC (Catalog Of Somatic Mutations in Cancer) database (http://www.sanger.ac.uk/genetics/CGP/cosmic/) [11].
We previously demonstrated that artificially generated mutations in the critical domains of mTOR enhanced protein kinase activities of mTOR, activated mTOR/p70S6K signaling pathway, caused cell transformation and invasion, and induced rapid tumor formation in nude mice, suggesting that mTOR is tumorigenic upon mutation [12]. However, to date, whether mTOR is mutated in human cancers has not been functionally well studied. In the present study, we investigated the mutational status of mTOR gene in two aggressive human cancers, anaplastic thyroid cancer (ATC) and melanoma, as the PI3K/Akt/mTOR signaling pathway genes are often genetically altered in these cancers [13,4].
Results
Identification of two novel mTOR mutations
To test whether mTOR gene was mutated in thyroid cancer and melanoma, we examined 30 exons of the mTOR gene for mutation in 12 thyroid cancer cell lines (including 8 ATC cell lines), 20 ATC tumor samples, 3 melanoma cell lines, and 23 melanoma tumor samples. We chose these exons because they covered the important domains of mTOR, such as FAT and kinase domains in which a few mutations had been previously documented in the COSMIC database. We found 2 novel heterozygous point mutations, one in the ATC C643 cell line and the other in a melanoma tumor sample. As illustrated in Figure 1A, the mutation found in C643 cell line showed an A>G transition in nucleotide position 1256. This mutation changed codon 419 from CAT to CGT, resulting in the amino acid change of histidine to arginine (H419R) of mTOR. As shown also in Figure 1A, the other mutation found in a melanoma tumor represented a G>A transition in nucleotide position 7076. This mutation changed codon 2359 from GGG to GAG, resulting in the amino acid change of glycine to glutamic acid (G2359E) of mTOR. Reverse, multiple independent PCR and re-sequencing confirmed the 2 mutations to be authentic. These mutations were not found in the COSMIC database and in the literature. We also did not find them in the databases of single-nucleotide polymorphism NCBI (http://www.ncbi.nlm.nig.gov/projects/SNP/) and ENSEMBL (http://uswest.ensembl.org). Thus, these were two novel point mutations of the mTOR gene in human cancers. The prevalence of the mTOR mutations was 12% (1/8) in ATC cell lines and 4% (1/23) in melanoma.
Fig. 1. Identification of novel mTOR mutations in an anaplstic thyroid cancer cell line and in a melanoma tumor.

A. Sequencing electropherogram of the mTOR gene. Shown in the top row of Fig.1A are the sequencing results of the C643 cell line: shown in the left and right portions are the sense and antisense strands of the sequencing of exon 9 of the mTOR gene, respectively, showing the heterozygous A>G mutation at nucleotide position 1256, resulting in the H419R amino acid change of mTOR. Shown in the bottom row of Fig.1A are the sequencing results of a melanoma tumor: shown in the left and right portion are the sense and antisense strands of a region of exon 51 of the mTOR gene, respectively, showing the heterozygous G>A mutation at nucleotide position 7076, resulting in the G2359E amino acid change of mTOR. B. Amino-acid sequence alignment of the mTOR proteins from 12 different species. Shown are the H419 and G2359, the novel mutation-affected residues that are evolutionarily highly conserved among 12 different species. The numbers indicate amino acid residuals or codon positions, with the initiation codon (methionine) of the protein defined as number 1. C. Schematic diagram of the mTOR protein showing various functional domains. mTOR contains HEAT repeats (Huntington, elongation factor 3, protein phosphatase 2A, and TOR1), FAT (FRAP, ATM and TRRAP), kinase, and FATC domain (a short FAT domain in the C-terminus). Shown are the relative positions of the novel mTOR mutations H419R and G2359E, which are located in the HEAT repeats and kinase domain, respectively.
In vitro protein kinase activity of novel mTOR mutants
As shown in Figure 1B, comparison of multiple amino acid sequences of mTOR in 12 different species of eukaryote revealed that the H419 and G2359 residues were evolutionarily conserved in the mTOR proteins among various species. As also depicted in Figure 1C, 2A & Supplementary Figure S1, the mutated amino acid residues H419 and G2359 were located within the HEAT repeats and kinase domains, respectively and altered confirmation of native protein. We therefore surmised that these novel mTOR mutations probably altered the serine/threonine kinase activity of mTOR. To test this possibility, we conducted in vitro site-directed mutagenesis to artificially generate these 2 mutations and examined the protein kinase activities of their mutants, using 2 mTOR mutants from our previous studies as positive controls. To this end, we transiently transfected HEK293T cells, immunoprecipitated the vector, wild-type mTOR and each of the mutants, and examined and compared the in vitro protein kinase activities of mTOR. As shown in Figure 2B, the 2 novel mTOR mutants showed 3–7 folds of enhanced protein kinase activities on the substrate p70S6K-GST fused protein in comparison with the wild-type mTOR. The artificially created activating mutation from our previous studies also displayed high activities (Figure 2B). As shown in Figure 2C, wild-type and mutant mTOR protein expression were confirmed by Western blotting both in whole cell lysates and in immunoprecipitates and no expression was observed with the control vector as expected. These results showed that the 2 novel mTOR mutations were gain-of-function protein kinase mutations.
Fig. 2. Enhanced protein kinase activities of novel mTOR mutants.

A. Structure of wild-type and mutants of human mTOR in mTORC1 form. Shown is the 3D modeling of wild-type mTOR (180º top-to-bottom rotated) in dimerized form as mTORC1. Mutated amino acids are indicated. Box (on top) indicates the zoomed view of H419R mutant form in HEAT repeats of mTOR and box (on bottom) shows the zoomed view of G2359E mutant form in kinase domain of mTOR. B. In vitro assay of protein kinase activities of novel mTOR mutants. HEK293T cells were transiently transfected with myc-tagged vector, wild-type mTOR (Wt), and each of the 2 novel mTOR mutants (H419R and G2359E) and two hyperactive mutants (P2273S and E2288K) as positive control as indicated. Cell lysates were immunoprecipitated with the anti-c-myc antibody and immunoprecipitates were assayed for protein kinase activity of mTOR as described in the Materials and Methods. C. Expression of novel mTOR mutants in the HEK293T cells corresponding to the assays in Fig. 2B. HEK293T cells transiently transfected with the indicated expression vector constructs as described in Fig. 2B and cell lysate proteins were subjected to immunoprecipitation followed by the corresponding protein kinase assays as shown in Fig. 2B. Parts of these immunoprecipitates and whole cell lysate from the above indicated transfectants were subjected to Western blotting analyses using appropriate antibodies as described in the Materials and Methods. Successful immunoprecipitation of myc-tagged wild-type mTOR and each of the novel mTOR mutants is shown in the top row of Fig. 2C. Successful expression of the wild-type and each of the novel mTOR mutants and positive control was reconfirmed by analyzing the whole cell lysate shown in the subsequent row. The β-actin was used for quality control of the loading proteins. D. Activation of the mTOR/p70S6K and Akt signaling pathways by novel mTOR mutants in HEK293T cells. Western blotting analysis of the HEK293T cells transiently transfected with myc-tagged vector, wild-type mTOR and each of novel mTOR mutants H419R and G2359E. Activation of downstream signaling was reflected by increased phosphorylation of p70S6K (P-p70S6K) and Akt (P-Akt). HEK293T cells were transiently transfected with c-myc-tagged vector, wild-type mTOR (Wt), and each of novel mTOR mutants as mentioned. Transiently transfected HEK293T cell lysates were subjected to Western blotting analyses for the indicated protein molecules using appropriate antibodies as described in the Materials and Methods. Shown, from top to bottom, are the expression of empty vector, wild-type mTOR (Wt) and two novel mTOR mutants; phosphorylation levels of p70S6K (Thr389); total p70S6K; phosphorylation levels of Akt (Ser473); total Akt; and β-actin for quality controls of loading proteins. E and F. Quantitative presentation of the phosphorylation levels of p70S6K and Akt, respectively. Phosphorylation levels of p70S6K and Akt corresponding to the transfection conditions in Fig. 2D as indicated were normalized by dividing the intensities of P-p70S6K and P-Akt by the total p70S6K and Akt, respectively in Fig. 2D. Results represent mean ± S.D. of three independent experiments.
Novel mTOR mutants activated mTOR/p70S6K and Akt signaling pathways in HEK293T cells
We tested the possibility that mTOR/ p70S6K signaling might be activated by the two novel mTOR mutants since they had elevated serine/threonine protein kinase activities. To investigate particularly the functional consequences of the mTOR mutations in the downstream mTOR signaling, we examined mTOR mutant-induced activation of the p70S6K, which is a well-defined direct substrate of mTOR. We specifically examined the phosphorylation level of p70S6K (threonine 389) in HEK293T cells transfected with the vector, wild-type and novel mTOR mutants. As illustrated in Figure 2D, all the mTOR mutant-transfected cells showed several-fold increase in the phosphorylation compared with wild-type transfected cells. As seen in Figure 2E, comparing the wild-type phosphorylation with mutants by quantifying the intensity of the bands showed that mutants had robust protein kinase activities. There was no change observed in total p70S6K and β-actin protein expression levels. We next determined whether the novel mTOR mutants activated mTORC2 by examining the phosphorylation of Akt at Ser-473, a direct substrate of mTORC2. As illustrated in Fig. 2D and F, these novel mTOR mutants highly phosphorylated Akt. These results strongly suggest that the novel mutants could activate both mTORC1 and 2. Therefore our data demonstrated that these novel mTOR mutations represented gain-of-function mutations.
Novel mTOR mutants promoted anchorage-independent growth and focus formation in NIH3T3 cells in vitro
To explore further the oncogenic potential of these novel mutations, we analyzed whether these mTOR mutants could induce any oncogenic phenotypes in the NIH3T3 cell. To test this, we performed soft agar colony formation assay by transiently transfecting NIH3T3 cells and seeding them on soft-agar and evaluating anchorage-independent cell growth. As shown in Figure 3A and B, the novel mTOR mutants formed more colonies than the wild-type-expressing cells. Similarly, in focus formation assay as shown in Figure 3C, all the mutant-transfected cells readily formed multi-layered foci but not the wild-type transfected cells. As shown in Figure 3D, the mutant-transfected cells formed more foci than the wild-type and the wild-type showed only a few multi-layered colonies. These results suggested that the gain-of-function mTOR mutants were oncogenic.
Fig. 3. Anchorage-independent growth and focus-formation of NIH3T3 cells promoted by novel mTOR mutants.

A. Anchorage-independent cell growth of the novel mTOR mutants on soft agar. NIH3T3 cells transiently transfected with the empty vector, wild-type mTOR, and the novel mTOR mutants as indicated were seeded in soft agar. Colonies formed 4 weeks later and were photographed with 40X magnification. B. Analyses of the number of colonies. The number of cell colonies corresponding to Fig. 3A that were > 0.1 mm in diameter was counted. Results represent mean ± S.D. of three independent experiments. C. Cell focus-forming activities of mTOR mutants. Shown are images of adherent growth of NIH3T3 cells transfected with myc-tagged vector, wild-type mTOR, and each of the mTOR mutants H419R and G2359E. Cells were cultured in regular medium with 10% FCS under standard conditions. Images of cell foci were photographed with 40X magnification after appropriate culture of cells as described in the Materials and Methods. Transfection of cells with activated mTOR mutant P2273S and E2288K as positive control induced cell focus formation. D. Number of cell foci formed with the indicated transfections. The number of foci was counted 21 days after cell transfection. Results represent mean ± S.D. of three independent experiments.
Stably transfected novel mTOR mutants induced morphological transformation and activation of the mTOR/p70S6K and Akt signaling pathways
The above-observed strong focus-forming ability of the mTOR mutants suggested that the mTOR mutant-expressing cells might have lost its original morphology and undergone transformation. Indeed, as illustrated in Figure 4A with stable transfection, we found that the vector and wild type-expressing cells resembled the parental NIH3T3 cells but the mutant-expressing cells showed many morphological differences. The H419R and G2359E mutants and the positive control (E2288K) exhibited complete adherence loss, thickening, more twisted and spindle-shaped appearance, growth on each another, and more aggressive appearance. These are all the characteristic features of a typically transformed cell. Moreover, as shown in Figure 4B and C, Western blotting assay confirmed the expression of mTOR and the phosphorylation of p70S6K (threonine 398), consistent with the activation of the mTOR/p70S6K signaling pathway. We next examined whether these mutants activated 4EBP1, another substrate of mTOR, and phosphorylated Akt at S473 to determine whether these mutants activated mTOR complex 2. Indeed, as shown in Figure 4E & D, these mTOR mutants activated 4EBP1 and Akt, suggesting that these mutants could activate both mTOR complex 1 and 2.
Fig. 4. Morphologic transformation and activated mTOR/p70S6K and Akt signaling in NIH3T3 cells stably expressing novel mTOR mutants.

A. Morphologic transformation of NIH3T3 cells stably transfected novel mTOR mutants. Cells stably transfected with indicated transfectants were plated at low density, cultured, maintained and photographed as described in the Materials and Methods. Panel shows the representative images of morphology of NIH3T3 cells stably expressing empty vector, wild-type mTOR and the indicated novel mTOR mutants. B. Corresponding stable expression of the novel mTOR mutants and their activation of the mTOR/p70S6K and Akt signaling in NIH3T3 cells. NIH3T3 cells corresponding to Fig. 4A stably transfected with the empty vector, wild-type mTOR, and the indicated novel mTOR mutants were subjected to lysis and Western blotting analyses as shown in Fig. 2B. Stable expression of the novel mTOR mutants in NIH3T3 cells also activated the mTOR/p70S6K and Akt signaling, consistent with the similar observations in transiently transfected HEK293T cells with novel mTOR mutants (Fig 2). C, D and E. Relative phosphorylation of the p70S6K, Akt and 4EBP1 protein in stably transfected NIH3T3 cells. Shown are the densitometric measurements performed from the densities of the phospho-p70S6K, p70S6K, phospho-Akt, Akt, phospho-4EBP1 and 4EBP1 bands in Fig. 4B. The relative phospho-p70S6K, phospho-Akt and phospho-4EBP1 levels were obtained by dividing their band densities by the corresponding p70S6K, Akt and 4EBP1 band density, respectively.
To further test the oncogenic potential of the novel mTOR mutants H419R and G2359E, we performed anchorage-independent soft agar colony formation assay using NIH3T3 cells stably expressing the mTOR mutants. As shown in Supplementary Figure S2A and B, the mTOR mutant-expressing cells formed more colonies on soft agar than the wild type-expressing cells; the wild type-expressing cells showed fewer colonies and were growing mostly in single cells. This was consistent with the results of anchorage-independent cell growth assay performed using transiently transfected cells (Figure 3A and B). These results again suggested that the mTOR mutants were gain-of-function mutants which were oncogenic by their own.
Novel mTOR mutants promoted invasion of NIH3T3 cells
Promotion of cell invasion is a characteristic feature of a typical oncogene and earlier studies showed an important role of an activated-p70S6K [14] and mTOR mutants [12] in cell motility. We were therefore interested in finding out whether the novel mTOR mutants could promote cell invasion in the present study. As shown in Figure 5A, NIH3T3 cells stably expressing the mTOR mutants H419R and G2359E were much more invasive on Matrigel matrix-coated membrane than vector or wild type-expressing cells. The number of invading cells was much larger with the mTOR mutants than with the vector and wild-type mTOR (Figure 5B), suggesting again that the novel mTOR mutants could function as oncogenes.
Fig. 5. Novel mTOR mutants promoted cell invasion.

A. In vitro invasion assay of NIH3T3 cells with transfection of novel mTOR mutants. Cell invasion assay performed as described in the Materials and Methods using stably transfected cells with the empty vector, wild-type mTOR, and the indicated novel mTOR mutants. Shown are cells that invaded on the matrigel matrix-coated polyethylene terephthalate membrane after removal of the non-invasive cells. B. Shown are the number of invading cells with the indicated stable transfectants. Results of each column represent the mean ± S.D. of the numbers of invasive cells from three independent experiments.
The novel mTOR mutants promoted xenograft tumor formation in nude mice
To test the tumorigenic potential of the two novel mTOR mutants, H419R and G2359E, we injected NIH3T3 cells stably expressing empty vector, wild-type and mTOR mutants as well as a positive control mTOR mutant (E2288K) in athymic nude mice, followed by monitoring of potential tumor formation. As illustrated in Figure 6A, two weeks after the inoculation, 5 out of 5 mice in each of the two groups of the novel mTOR mutants and the group of the positive control mTOR mutant developed tumors. We observed no tumors in mice inoculated with vector and wild-type mTOR-expressing cells. This result confirmed the oncogenic and trmorigenic role of the novel mTOR mutations (Figure 6B).
Fig. 6. Novel mTOR mutants induced tumorigenicity in nude mice in vivo.

A. In vivo tumorigenic assay of NIH3T3 cells with various transfections of novel mTOR mutants. NIH3T3 cells stably transfected with the empty vector, wild-type mTOR, and the novel mTOR mutants H419R or G2359E were inoculated subcutaneously into the athymic nude mice as described in Materials and Methods and subsequently monitored for tumor formation. Photographs of the tumors and animals were taken two weeks after cell inoculation. Tumor necrosis was seen in some cases. Each group consisted of five mice. A representative mouse is shown for each group and the number shown in the bracket for each group represents the number of animals that formed tumor out of five mice. B. Schematic illustration shows the mutant mTOR-mediated signaling to promote tumorigenesis in cancer. In normal cell, mTOR regulates cell proliferation and motility by integrating inputs from upstream from the PI3K/AKT signaling upon amino acids and growth factors stimulation via receptor tyrosine kinases. Mutation in mTOR activates it and aberrantly activated mTOR phosphorylates its substrates, p70S6K and AKT, to promote tumorigenesis by triggering cell proliferation, growth, and invasion.
Novel mTOR mutants conferred sensitivity of NIH3T3 cells to mTOR inhibitor
Anaplastic thyroid cancer and melanoma are among the most deadly and aggressive human cancers [13,15]. Receptor tyrosine kinase inhibitors (RTKi) were clinically evaluated and some are currently approved for the treatment of human cancers, including advanced thyroid cancer. However, acquired drug resistance remains a challenge [16]. As mTOR is a downstream member of the RTKs, occurrence of mutation in the mTOR gene could be a potential mechanism in acquired drug resistance to currently available RTKi-mediated therapy. However, acquired mTOR mutations are still sensitive to mTOR kinse inhibitor in human cancers [17]. In fact, this was seen in a case of ATC [18]. In this context, we explored the effect of a mTOR kinase inhibitor, temsirolimus, on the proliferation of mTOR mutant-expressing cells through performing MTT assay. To determine this, we transiently overexpressed vector, wt-mTOR, and each of the mTOR mutants in NIH3T3 cells and assessed the sensitivities of the transfectant cells to temsirolimus at 0 nM, 10 nM and 1 µM. Our results showed that all the mutants (H419R, G2359E, and E2288K) were much more sensitive to temsirolimus in a dose-dependent manner than the vector and wild-type mTOR-expressing cells which showed a modest sensitivity. These results demonstrated that the mTOR mutants conferred a growth advantage to cells and hence sensitivity to the mTOR kinase inhibitor (Figure 7). This result also suggests that mTOR kinase inhibitors could also overcome mTOR mutation-mediated acquired resistance to RTK inhibitors.
Fig. 7. Effects of temsirolimus on the proliferation of NIH3T3 cells transfected with novel mTOR mutants.
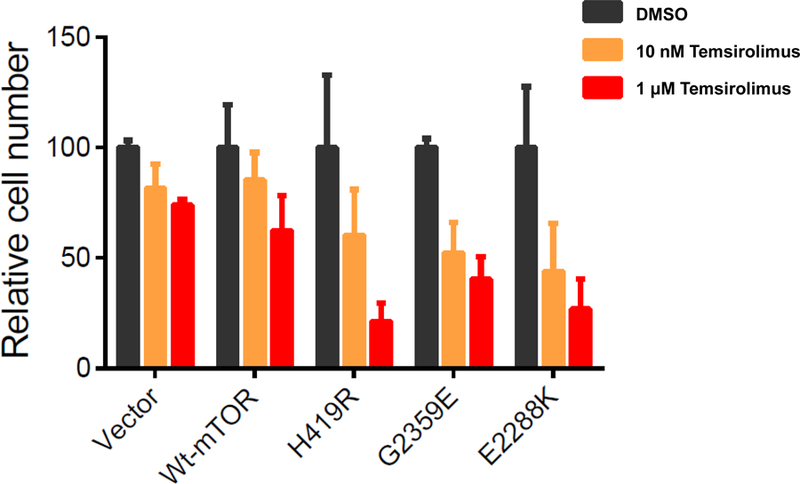
NIH3T3 cells were transiently transfected with the empty vector, wild-type mTOR, and mTOR mutants as indicated. Two days after the transfection, cells were treated for 3 days with 0 nM (DMSO), 10 nM or 1 μM temsirolimus. MTT assay was used to measure cell proliferation. Data were shown as means ± SD.
Integrated analyses of TCGA data revealed the presence of mTOR mutations in poorly-differentiated and anaplastic thyroid cancers
We analyzed the TCGA data of 624 samples consisting of well-differentiated thyroid cancer (WDTC), poorly-differentiated thyroid cancer (PDTC), and anaplastic thyroid cancers (ATC) from the cBioPortal database. Analyses of 507 WDTC samples showed the absence of mTOR mutation, suggesting that the mTOR mutation is a rare, if any, event in WDTC. Analyses of 117 PDTC and ATC samples revealed mTOR mutations in 1.2% (1/84) PDTC and 6.1% (2/33) ATC. More details are shown in Figure 8 and Supplementary Table S3.
Fig. 8. Integrated analyses of TCGA data for mTOR gene mutation in thyroid cancers.

A. Pie chart of thyroid cancer. It shows the total number of samples analyzed, the number of studies included and their related sample size. B. The histogram shows the alteration frequency of mTOR across cancer studies. The bar indicates an overall 2.5% of mTOR mutation in poorly-differentiated and anaplastic thyroid cancer (MSKCC) and absence of mTOR mutations in well-differentiated thyroid cancer (TCGA). C. The prevalence of mTOR mutations in thyroid cancer sub-types. The histogram shows the highest frequency of mTOR mutation in anaplastic thyroid cancer (6.1%) followed by poorly-differentiated thyroid cancer (1.2%) and no mutation in well-differentiated thyroid cancer. D. The OncoPrint tab. It shows the mTOR mutations across the poorly-differentiated and anaplastic thyroid cancer sample set (MSKCC). The row represents the mTOR gene and column represents a tumor sample. The green squares are non-synonymous mutations. E. Mutation tab. The schematic diagram shows the mTOR protein domains and the positions of specific mutations. The length of the line that connects the mutation annotation to the protein is directly proportional to the number of samples with the mutation. The most recurrent is shown in the diagram. F. Survival curve. The diagram shows the Kaplan-Meier plot of overall survival curve of the poorly-differentiated and anaplastic thyroid cancer patients without or with mTOR mutations in blue and red color, respectively.
Discussion
We report here the discovery and functional characterization of two novel oncogenic mTOR mutations in human cancer. Specifically, we found 2 novel missense mTOR point mutations, A1256G and G7076A, in C643 cell line and melanoma tumor, respectively. These 2 mutations resulted in amino acid change from histidine to arginine (H419R) and glycine to glutamic acid (G2359E) of mTOR, respectively. These mutations are novel somatic mutations that have not been previously reported. A mutation at codon position G2359 was identified previously (G2359R) in a metastatic cutaneous squamous cell carcinoma [19]. The two novel mutations discovered in the present study were in exon 9 and exon 51 of the mTOR gene, with a prevalence of 12.5% of ATC cell lines and 4% of melanoma tumors. While our manuscript was under preparation, some studies came out reporting different mTOR mutations both in anaplastic thyroid cancer and melanomas. A recent study on whole exome sequencing of ATC samples identified ~10% (2/22) of mTOR mutations (R164Q and M2327I), but there was no functional characterization (20). Another study found no mTOR mutations in differentiated thyroid cancer (DTC) samples [21]. A recent study showed mTOR somatic mutations in melanoma with a prevalence of ~11%, which were associated with increased melanoma-specific mortality [15]. These studies, together with ours, suggest that mTOR mutations play an important oncogenic role in a subset of ATC and melanoma.
The novel mutations (H419R and G2359E) discovered in the present study are in in amino acid residues H419 and G2359 that are evolutionarily highly conserved over the divergence of various species and these residues are also conserved within the other members of the PIKK family. It has been known that mutations affecting preferentially the evolutionarily conserved amino cid residues are likely of critical functional importance [22]. Indeed, the majority of cancer-associated mutations are in evolutionarily highly conserved residues [23,11]. The mutated residues H419 and G2359 of the mTOR protein are located in the HEAT repeats and the kinase domain, respectively. More specifically, the H419R mutation is located in the linker region between the HEAT repeat 1 and 2 of the HEAT repeat domain and the G2359E mutation is located within the region of “activation loop” in the catalytic domain of mTOR (Fig. 2A). It has been shown that the activation loop of protein kinases is a short fragment of ~20–30 amino acid residues, which is flanked by conserved N and C terminal anchor regions [24]. The amino acid residues from 2357–73 is depicted as the “activation loop” of mTOR [25]. It has also been postulated that activating mutations of TOR are in similar structures as oncogenic mutations in PIK3Cα [26]. Hence, amino acid changes in this region may result in conformational change of the mTOR protein, with significant functional consequences to the kinase activities and interaction of upstream and downstream proteins of the mTOR signaling pathway.
The intrinsic oncogenic activity of the mTOR mutants is reflected in their enzymatic properties. Functional analysis of the two novel mutations showed that both were of gain-of-function, conferring enhanced protein kinase activities of mTOR. This is consistent with a previous study showing enhanced enzymatic activity of human mTOR mutants [11]. Our mutants H419R and G2359E robustly activated the mTOR-associated downstream signaling proteins such as p70S6K, 4EBP1and Akt by hyper phosphorylating them at Thr-389, Thr-37/Thr-46 and Ser-473, respectively. These mutants also strongly promoted focus formation, morphological transformation, anchorage-independent growth, cell invasion, and rapid tumor formation in nude mice, demonstrating their oncogenic and tumorigenic function. Although rare point mutations of mTOR have been previously reported in a few cancer types, no functional validation has been done with them. Interestingly, among some mTOR mutations selected from the human cancer genome database (A8S, S2215Y, P2476L and R2505P) and introduced into wt-mTOR and expressed in HEK293T cells, S2215Y and R2505P showed increased kinase activities and activation of mTOR/p70S6K signaling; the phosphorylation of mTORC1 substrates retained even under nutrient-starved conditions. Increased number of foci have been observed in Rat 1 cells when the mTOR S2215Y mutant was co-expressed with mutant K-ras but no much significant difference was observed when comparing the mutant mTOR (S2215Y) alone with wt mTOR [11]. A previous study showed that a renal cell carcinoma-associated mutant (L2431P) over-activated the p70S6K signaling pathway [27]. While we were preparing our manuscript, a mTOR mutation (L2209V) identified in a neuroendocrine cancer was demonstrated to be a transforming somatic mutation [28] and mTOR mutations identified in melanoma [15] and derived from COSMIC were also shown to be gain-of-function and tumorigenic [17,29,30]. These results are consistent with our findings in the present study and collectively suggest that mTOR mutations can be oncogenic and promote tumorigenesis.
ATC is the most aggressive type of thyroid cancer; in fact, it is one of the most lethal human malignancies. Most patients with ATC do not live more than 6 months from the initial diagnosis [31]. Likewise, malignant melanoma is highly lethal [4]. The finding of mTOR mutations in ATC cell line, ATC, and melanoma, but not in WDTC suggests that activating genetic alterations of the mTOR occur in aggressive cancers. They likely play a role in the aggressiveness of a subgroup of ATC and melanoma. It is possible that mTOR mutations could promote cancer aggressiveness by inducing invasion and metastasis by affecting the tumor microenvironment equilibrium with the interplay between tumor cells (thyroid/melanoma) and tumor-associated endothelial cells (pericytes) for the angiogenesis- invasion (paracrine mechanisms) and metastasis likely by activating the mTORC1 and 2 systems [32,33]. This is consistent with the previous findings that the mTOR pathway is highly activated and plays an important role in ATC [34] and melanomas [4]. The mTOR mutation-mediated oncogenic cellular signaling is mediated via the downstream p70S6K/ 4EBP1 and Akt signaling as suggested by our results of hyper-phosphorylation of p70S6K/ 4EBP1 and Akt, the immediate downstream effectors of mTORC1 and 2, respectively [12]. Consistently, the PI3K/Akt/mTOR signaling pathway has been known to be important in thyroid tumorigenesis [35]. Activation of the PI3K/Akt pathway has been shown to play an important role in ATC and genetic alterations of this pathway are a fundamental mechanism for the pathogenesis of ATC [36]. This is also the case with melanoma [4]. mTOR mutations discovered in the present study represent a novel set of genetic alterations that contributes to the PI3K/Akt/mTOR signaling pathway in human cancer.
Interestingly, a mTOR mutation identified in an ATC was shown to confer resistance to allosteric mTOR inhibition but sensitive to kinase inhibitors [18] while some cancer-associated mutants exhibited sensitivities to rapamycin [17]. Our present study showed that NIH3T3 cells expressing the novel mutants (H419R, G2359E, and E2288K) gained robust sensitivities to temsirolimus at clinically relevant concentration. This result was consistent with our previous report that mTOR mutant (H419R)-bearing C643 cell line was remarkably sensitive to temsirolimus in vivo [37]. These results suggest that mTOR inhibitors could overcome the acquired mTOR mutant-mediated drug resistance to RTK inhibitors in the treatment of cancers.
A previous study found mTOR mutations to exist as heterogenic mutations (intra-tumor heterogeneity) in human cancer [27]. It is possible that mTOR mutations might have been missed in our mutation detection process in the present study using Sanger’s sequencing on genomic DNA isolated from whole tumor tissues. However, analysis of 507 WDTC in the TCGA database determined using next-generation sequencing also did not show mTOR mutations, which was consistent with our previous report [21], while mTOR mutations were found in PDTC and ATC [20]. These results suggest that mTOR mutations are indeed present in aggressive thyroid cancers, but not WDTC.
In summary, we report here the identification and functional characterization of two novel gain-of-function mTOR mutations in ATC and melanoma. This provides further evidence that oncogenic mTOR mutations can be an important genetic mechanism in human cancer and are effective therapeutic targets for human cancer using mTOR kinase inhibitors.
Materials and Methods
Cell lines, tumor samples and DNA isolation
A total of 58 samples, including 12 thyroid cancer cell lines (K1, BCPAP, K5, FTC133, OCUT-1, OCUT-2, FB-1, SW1736, HTh7, HTh74, KAT18 and C643, with the later 8 cell lines derived from ATC), 3 melanoma cell lines (M14, A375 and UACC62), 20 anaplastic thyroid cancer samples (ATC), and 23 melanoma tumor samples, were used in this study. Human tumor tissues were used with the approval by the Institutional Review board (IRB). Thyroid cancer cell lines were tested and authenticated as described before [38]. Cancer cell lines were cultured and genomic DNA was isolated from cell lines and tumor samples as described previously [39].
PCR, sequencing and mutational analyses
PCR amplification and sequencing were performed on genomic DNA isolated from cancer cell lines and primary tumors. Sequences for all annotated exons and adjacent introns mTOR gene were extracted from human genome sequences (http://www.genome.ucsc.edu). Primers were designed using the Primer 3 program (http://frodo.wi.mit.edu/primer3) and synthesized by Invitrogen Life Technologies (Invitrogen, Carlsbad, CA) (Supplementary Table S1). Each PCR reaction was performed in a 20-µl total volume and PCR products were directly sequenced using the BigDye terminator v3.1 cycle sequencing ready reaction kit (Applied Biosystems) and an ABI PRISM 3730 automated next generation genetic analyzer. All coding nucleotides and amino acids were numbered corresponding to the human mTOR (NCBI Reference: NM_004958.3).
Multiple amino acid sequence alignment
Amino acid sequences of mTOR of various species of eukaryote were obtained from NCBI database (http://www.ncbi.nlm.nih.gov/protein/) as follows: H_sapiens (NP_004949.1), C_lupus familiaris (XP_535407.2), B_taurus (XP_001788280.1), M_musculus (NP_064393.1), R_norvegicus (NP_063971.1), G_gallus (XP_417614.2), D_rerio (NP_001070679.2), D_melanogaster (NP_524891.1), S_cerevisiae (NP_012719.2), K_lactis (NP_012719.2), A_gossypii (NP_985967.1), and A_thaliana (NP_175425.2). These amino acid sequences were compared using a computer based multiple sequence alignment program (http://pir.georgetown.edu/pirwww/search/multialn.shtml).
mTORC1 3D structure
The PDB file of mTOR (wild-type & dimer) in the form of mTORC1 was downloaded from http://www.rcsb.org/pdb/home/home.do using PDB ID: 5H64 and the mutated amino acid residues were localized in wild-type native protein structure. Mutations were induced in mTOR in silico, modeled and visualized by PyMOL® build version 2.0.6.
Expression vector and site-directed mutagenesis
A mammalian expression vector (pCMV6) containing the human wild-type mTOR as described previously [12] was used to generate 2 mTOR mutants H419R and G2359E with a Quick Change XL II Site-Directed mutagenesis kit (Stratagene, Lajolla CA) according to instructions of the manufacturer. The primers were designed using a template specific mutagenic primer design program and the primer sequences for the mutants (H419R & G2359E) were listed in Supplementary Table S2. The mutations were confirmed in the vectors by sequencing with the primer SEQ-7F and SEQ-3F (Supplementary Table S2). Two mutants, P2273S and E2288K, from our previous study were used as positive controls. Plasmid DNAs for the transfection experiments were purified using a mini prep kit (Cat # K2100–11, Invitrogen, Carlsbad CA).
Cell culture, transient transfection and cell lysate preparation
HEK293T cells were purchased from American Type Culture Collection and grown at 37 °C in Dulbecco’s Modified Eagle’s Medium (DMEM) supplemented with 10% fetal bovine serum (FBS) and transiently transfected with an empty vector, wild-type or each of the novel mutant mTOR expression vectors using the Lipofectamine 2000 reagent per instructions of the manufacturer (Invitrogen Life Technologies, CA). After 24 h transfection, cells were refreshed with fresh medium and, after 48 h, cells were lyzed and protein concentrations were determined as described before [12] and this cell lysate was used for Western blotting and immunoprecipitation.
Immunoprecipitation
For various lysates, the protein concentration was adjusted to 1 µg/µl using ice cold cell lysis buffer. For immunoprecipitation, 500 µg total lysate protein from each sample was used and immunoprecipitated as exactly mentioned earlier [12]. One half of the immunoprecipitate was used for assaying mTOR kinase activity and the other half was resolved in a SDS/PAGE and subjected to Western blotting analyses.
Protein kinase assay of mTOR
The protein kinase activity of mTOR was determined as described previously [40, 12], using K-LISA mTOR (Recombinant) Activity kit (Cat # CBA104, Calbiochem-EMD Chemical Inc., Philadelphia, PA) per the manufacturer’s instructions. Briefly, immunoprecipitates obtained above were re-suspended in 50 µl of 2X kinase buffer and gently mixed with 50 µl of mTOR substrate and reaction was initiated by an incubation at 30ºC for 30 min. After the incubation, the reaction mixture was incubated in a glutathione-coated 96-well plate to facilitate the binding of substrate (GST-fused p70S6K) to the plate. The phosphorylation of the substrate was detected using anti-p70S6K-phospho-Thr389 antibody, followed by detection with HRP-antibody conjugate and TMB substrate. The sensitivity was increased by the addition of ELISA stop solution and relative activities were determined by spectrophotometric reading at 450 nm.
Western blotting
Cells were lyzed in ice cold RIPA lysis Buffer (Cat. No. sc-24948, Santa Cruz Biotechnology, Santa Cruz CA) after washing once with phosphate-buffered saline (PBS). Western blotting was performed using 45 μg of cell lysates resolved on SDS/PAGE and transferred to a PVDF membrane (Millipore Co., Bedford, MA). The membrane was blocked with 5% skim-milk/PBS containing 0.1% Tween 20 (PBST) for 1 hour at room temperature. The membrane was then sliced based on the molecular weights and incubated overnight at 4ºC with primary antibodies. The membranes used for phospho-4EBP1, phospho-p70S6K and phospho-Akt were stripped off for total 4EBP1, p70S6K and total Akt, respectively. After four times of washing with PBST, blots were incubated with respective HRP conjugated anti-rabbit or anti-mouse secondary antibodies for 1 h at room temperature and protein bands were detected as exactly mentioned previously [12].
Cell culture, transfection and focus formation assay of NIH3T3 cells
NIH3T3 cells were obtained from ATCC and cultured in DMEM supplemented with fetal calf serum (FCS) and focus formation assay was done as described previously [41,12]. In brief, NIH3T3 cells were transfected with equal amount of empty vector or vectors expressing the wild-type mTOR or each of novel mutant mTOR H419R, G2359E and E2288K) in a 6-well plate (Costar® Corning, NY) using the Lipofectamine 2000 according to the manufacturer’s instructions (Invitrogen Life Technologies, Carlsbad, CA). After 48 hrs of transfection, cells were washed once with PBS, tripsinized briefly, and transferred equally to two T-75 plates containing DMEM supplemented with 10% FCS and 800µg/mL G418. Medium was regularly changed every 3–4 days. After 3 weeks of transfection, morphologically transformed, multi-layered cell foci were counted and photographed (Nikon Eclipse Ti-U, Tokyo, Japan).
Cell focus cloning and stable cell line establishment
Cell focus cloning and stable cell establishment were performed as described previously [12]. Each single multi-layered foci formed from cells transfected with the empty vector, wild-type mTOR, novel mutant mTOR H419R, G2359E and E2288K during the afore-mentioned focus formation assay was cloned using a sterile, wax coated and disposable cloning cylinders (Cat # TR-1004, Millipore, Billerica MA). All single colonies cloned were cultured, expanded and maintained in DMEM +10% FCS+800µg/ml G418. All the clones were subjected to extraction of genomic DNA followed by PCR amplification, sequencing and Western blotting for confirmation of integration and expression of the vector constructs. In brief, part of each stably transfected NIH3T3 cell clone was lysed and genomic DNA was extracted as described previously [39]. Integration of the plasmid and presence of the mutation in the mTOR ORF and myc-tag were confirmed by PCR amplification of the genomic DNA using a sense primer binding in the mTOR cDNA and the antisense primer binding in the vector back bone of pCMV6. The amplicons were directly sequenced as described previously [12]. Cells of all the single clones were also analyzed by Western blotting as described above for over-expression of mTOR protein and activation of the mTOR/p70S6K signaling pathway. The above verified clones were used in further experiments for functional studies of mTOR.
Determination of morphological transformation
Changes in the morphology of NIH3T3 cells expressing novel mTOR mutants were determined as described previously [42,12]. Briefly, NIH3T3 cells stably transfected with the empty vector, wild-type mTOR, and the indicated mTOR mutants were plated in 60-mm culture plates (Corning, NY) at a density of 3 X 10⁵ cells. Cells were cultivated one day in regular medium (DMEM+10% FCS+G418 800µg/ml), followed by examination of the cell morphology under a microscope (Nikon Eclipse Ti-U, Tokyo, Japan).
Soft-agar colony formation assay
Anchorage-independent soft-agar colony formation assay was performed as previously described [41,12]. Briefly, NIH3T3 cells transiently or stably transfected with the indicated type of mTOR construct were seeded at 1.0 X 10⁴ cells/well on 6-well plates (Costar® Corning, NY) in 0.3% agar (Cat # 214010, BD Biosciences) over a bottom layer of 0.6% agar. After 4 weeks, colonies of > 0.1 mm were counted and photographed (Zeiss Axiovert 200M, CarlZeiss, Germany).
Invasion assay
Cell invasion assay was performed as detailed previously [12] using matrigel invasion chambers consisting of BD Falcon™ cell culture inserts containing a polyethylene terephthalate (PET) membrane with 8 µm pores coated with matrigel matrix (BD BioCoat™ Matrigel™ Invasion Chamber, BD Biosciences, Bedford, MA).
Xenograft tumorigenicity assay
Xenograft tumor development assay was performed as described previously [12]. Briefly, four-week-old female nude mice (Hsd: Athymic Nude-Foxn1nuMICE) were purchased (Harlon, Frederick MD) and maintained under standard conditions and in vivo experiments were performed per our institution’s guidelines.
Cell proliferation assay
Cell proliferation assay was performed as described previously [37]. Briefly, NIH3T3 cells (5,000/well) were seeded in triplicates into a 96-well plate and transiently transfected with vector, wild-type mTOR or each of the mTOR mutant constructs. Two days later, cells were treated daily with DMSO or 10 nM or 1 μM of temsirolimus for 3 days. Cells were then added with 10 μL of 12 mM MTT agent (#M6494, Thermo Fisher Scientific) and incubated for 4 h, followed by addition of 100 μL of 10% SDS solution and incubated overnight. The absorbance was read at 570 nm on a microplate reader with a reference wavelength of 670 nm.
Analyses of TCGA data for mTOR gene mutation in thyroid cancer
We analyzed the TCGA data from two major studies (TCGA and MSKCC) with a total of 624 samples consisting of 507 well-differentiated thyroid cancer (WDTC), 84 poorly-differentiated thyroid cancer (PDTC) and 33 anaplastic thyroid cancer (ATC) [43,44]. All the analyses (visualization, analysis, and acquisition of data) were performed using the tools available in the cBioPortal database as described previously [45].
Supplementary Material
Acknowledgements
We thank Drs. N.E. Heldin, K.B. Ain, N. Onoda, M. Santoro, D. Wynford Thomas, G. Brabant, A.P. Dackiw, R Schweppe, and B. Haugen for kindly providing us the accessibility to the cell lines used in this study.
Funding
This study was supported by U.S.A. National Institutes of Health (NIH) grants R01CA215142 and R01CA189224 to M Xing.
Footnotes
Declaration of interest
The authors have no conflict of interest to declare.
Reference
- 1.Laplante M, Sabatini DM. mTOR signaling in growth control and disease. Cell 2012;149:274–93. [DOI] [PMC free article] [PubMed] [Google Scholar]
- 2.Paquette M, El-Houjeiri L, Pause A. mTOR Pathways in Cancer and Autophagy. Cancers (Basel) 2018;10:pii: E18. [DOI] [PMC free article] [PubMed] [Google Scholar]
- 3.Sarbassov DD, Guertin DA, Ali SM, Sabatini DM. Phosphorylation and regulation of Akt/PKB by the rictor-mTOR complex. Science 2005;307:1098–1101. [DOI] [PubMed] [Google Scholar]
- 4.Karbowniczek M, Spittle CS, Morrison T, Wu H, Henske EP. mTOR is activated in the majority of malignant melanomas. J Invest Dermatol 2008; 128: 980–7. [DOI] [PubMed] [Google Scholar]
- 5.Souza EC, Ferreira AC, Carvalho DP. The mTOR protein as a target in thyroid cancer. Expert Opin Ther Targets 2011;15:1099–112. [DOI] [PubMed] [Google Scholar]
- 6.Janku F, Yap TA, Meric-Bernstam F. Targeting the PI3K pathway in cancer: are we making headway? Nat Rev Clin Oncol 2018;15:273–91. [DOI] [PubMed] [Google Scholar]
- 7.Sekulić A, Hudson CC, Homme JL, Yin P, Otterness DM, Karnitz LM, et al. A direct linkage between the phosphoinositide 3-kinase-AKT signaling pathway and the mammalian target of rapamycin in mitogen-stimulated and transformed cells. Cancer Res 2000;60:3504–13. [PubMed] [Google Scholar]
- 8.Urano J, Sato T, Matsuo T, Otsubo Y, Yamamoto M, Tamanoi F. Point mutations in TOR confer Rheb-independent growth in fission yeast and nutrient-independent mammalian TOR signaling in mammalian cells. Proc Natl Acad Sci USA 2007;104:3514–9. [DOI] [PMC free article] [PubMed] [Google Scholar]
- 9.Ohne Y, Takahara T, Hatakeyama R, Matsuzaki T, Noda M, Mizushima N, et al. Isolation of hyperactive mutants of mammalian target of rapamycin. J Biol Chem 2008;283:31861–70. [DOI] [PubMed] [Google Scholar]
- 10.Edinger AL, Thompson CB. An activated mTOR mutant supports growth factor-independent, nutrient-dependent cell survival. Oncogene 2004;23:5654–63. [DOI] [PubMed] [Google Scholar]
- 11.Sato T, Nakashima A, Guo L, Coffman K, Tamanoi F. Single amino-acid changes that confer constitutive activation of mTOR are discovered in human cancer. Oncogene 2010;29:2746–52. [DOI] [PMC free article] [PubMed] [Google Scholar]
- 12.Murugan AK, Alzahrani A, Xing M. Mutations in critical domains confer the human mTOR gene strong tumorigenicity. J Biol Chem 2013;288:6511–21. [DOI] [PMC free article] [PubMed] [Google Scholar]
- 13.Xing M Genetic alterations in the phosphatidylinositol-3 kinase/Akt pathway in thyroid cancer. Thyroid 2010;20:697–706. [DOI] [PMC free article] [PubMed] [Google Scholar]
- 14.Berven LA, Crouch MF. Cellular function of p70S6K: a role in regulating cell motility. Immunol Cell Biol 2000;78:447–51. [DOI] [PubMed] [Google Scholar]
- 15.Kong Y, Si L, Li Y, Wu X, Xu X, Dai J, et al. Analysis of mTOR Gene Aberrations in Melanoma Patients and Evaluation of Their Sensitivity to PI3K-AKT-mTOR Pathway Inhibitors. Clin Cancer Res 2016;22:1018–27. [DOI] [PubMed] [Google Scholar]
- 16.Jiao Q, Bi L, Ren Y, Song S, Wang Q, Wang YS. Advances in studies of tyrosine kinase inhibitors and their acquired resistance. Mol Cancer 2018;17:36. [DOI] [PMC free article] [PubMed] [Google Scholar]
- 17.Grabiner BC, Nardi V, Birsoy K, Possemato R, Shen K, Sinha S, et al. A diverse array of cancer-associated MTOR mutations are hyperactivating and can predict rapamycin sensitivity. Cancer Discov 2014;4:554–63. [DOI] [PMC free article] [PubMed] [Google Scholar]
- 18.Wagle N, Grabiner BC, Van Allen EM, Amin-Mansour A, Taylor-Weiner A, Rosenberg M, et al. Response and acquired resistance to everolimus in anaplastic thyroid cancer. N Engl J Med 2014;371:1426–33. [DOI] [PMC free article] [PubMed] [Google Scholar]
- 19.Li YY, Hanna GJ, Laga AC, Haddad RI, Lorch JH, Hammerman PS. Genomic analysis of metastatic cutaneous squamous cell carcinoma. Clin Cancer Res 2015;21:1447–56. [DOI] [PMC free article] [PubMed] [Google Scholar]
- 20.Kunstman JW, Juhlin CC, Goh G, Brown TC, Stenman A, Healy JM, et al. Characterization of the mutational landscape of anaplastic thyroid cancer via whole-exome sequencing. Hum Mol Genet 2015;24:2318–29. [DOI] [PMC free article] [PubMed] [Google Scholar]
- 21.Murugan AK, Humudh EA, Qasem E, Al-Hindi H, Almohanna M, Hassan ZK, et al. Absence of somatic mutations of the mTOR gene in differentiated thyroid cancer. Meta Gene 2015;6:69–71. [DOI] [PMC free article] [PubMed] [Google Scholar]
- 22.Kang S, Bader AG, Vogt PK. Phosphatidylinositol 3-kinase mutations identified in human cancer are oncogenic. Proc Natl Acad Sci U S A 2005;102:802–7. [DOI] [PMC free article] [PubMed] [Google Scholar]
- 23.Davies H, Hunter C, Smith R, Stephens P, Greenman C, Bignell G, et al. Somatic mutations of the protein kinase gene family in human lung cancer. Cancer Res 2005;65:7591–5. [DOI] [PubMed] [Google Scholar]
- 24.Loch-head PA. Protein kinase activation loop autophosphorylation in cis: overcoming a Catch-22 situation. Sci Signal 2009;2:pe4. [DOI] [PubMed] [Google Scholar]
- 25.Hardt M, Chantaravisoot N, Tamanoi F. Activating mutations of TOR (target of rapamycin). Genes Cells 2011;16:141–51. [DOI] [PMC free article] [PubMed] [Google Scholar]
- 26.Sturgill TW, Hall MN. Activating mutations in TOR are in similar structures as oncogenic mutations in PI3KCα. ACS Chem Biol 2009;4:999–1015. [DOI] [PMC free article] [PubMed] [Google Scholar]
- 27.Gerlinger M, Rowan AJ, Horswell S, Larkin J, Endesfelder D, Gronroos E, et al. Intratumor heterogeneity and branched evolution revealed by multiregion sequencing. N Engl J Med 2012;366:883–92. [DOI] [PMC free article] [PubMed] [Google Scholar]
- 28.Yamaguchi H, Kawazu M, Yasuda T, Soda M, Ueno T, Kojima S, et al. Transforming somatic mutations of mammalian target of rapamycin kinase in human cancer. Cancer Sci 2015;106(12):1687–92. [DOI] [PMC free article] [PubMed] [Google Scholar]
- 29.Ghosh AP, Marshall CB, Coric T, Shim EH, Kirkman R, Ballestas ME, et al. Point mutations of the mTOR-RHEB pathway in renal cell carcinoma. Oncotarget 2015;6:17895–910. [DOI] [PMC free article] [PubMed] [Google Scholar]
- 30.Xu J, Pham CG, Albanese SK, Dong Y, Oyama T, Lee CH, et al. Mechanistically distinct cancer-associated mTOR activation clusters predict sensitivity to rapamycin. J Clin Invest 2016;126:3526–40. [DOI] [PMC free article] [PubMed] [Google Scholar]
- 31.Neff RL, Farrar WB, Kloos RT, Burman KD. Anaplastic thyroid cancer. Endocrinol Metab Clin North Am 2008;37:525–38. [DOI] [PubMed] [Google Scholar]
- 32.Sadow PM, Priolo C, Nanni S, Karreth FA, Duquette M, Martinelli R, et al. Role of BRAFV600E in the first preclinical model of multifocal infiltrating myopericytoma development and microenvironment. J Natl Cancer Inst 2014;106(8). pii: dju182. doi: 10.1093/jnci/dju182. [DOI] [PMC free article] [PubMed] [Google Scholar]
- 33.Prete A, Lo AS, Sadow PM, Bhasin SS, Antonello ZA, Vodopivec DM, et al. Pericytes Elicit Resistance to Vemurafenib and Sorafenib Therapy in Thyroid Carcinoma via the TSP-1/TGFβ1 Axis. Clin Cancer Res 2018;24:6078–6097. [DOI] [PMC free article] [PubMed] [Google Scholar]
- 34.Liu J, Brown RE. Morphoproteomics demonstrates activation of mTOR pathway in anaplastic thyroid carcinoma: a preliminary observation. Ann Clin Lab Sci 2010;40:211–7. [PubMed] [Google Scholar]
- 35.Saji M, Ringel MD. The PI3K-Akt-mTOR pathway in initiation and progression of thyroid tumors. Mol Cell Endocrinol 2010;321:20–8. [DOI] [PMC free article] [PubMed] [Google Scholar]
- 36.Liu Z, Hou P, Ji M, Guan H, Studeman K, Jensen K, et al. Highly prevalent genetic alterations in receptor tyrosine kinases and phosphatidylinositol 3-kinase/akt and mitogen-activated protein kinase pathways in anaplastic and follicular thyroid cancers. J Clin Endocrinol Metab 2008;93:3106–16. [DOI] [PubMed] [Google Scholar]
- 37.Liu D, Hou P, Liu Z, Wu G, Xing M. Genetic alterations in the phosphoinositide 3-kinase/Akt signaling pathway confer sensitivity of thyroid cancer cells to therapeutic targeting of Akt and mammalian target of rapamycin. Cancer Res 2009;69:7311–9. [DOI] [PMC free article] [PubMed] [Google Scholar]
- 38.Schweppe RE, Klopper JP, Korch C, Pugazhenthi U, Benezra M, Knauf JA. Deoxyribonucleic acid profiling analysis of 40 human thyroid cancer cell lines reveals cross-contamination resulting in cell line redundancy and misidentification. J Clin Endocrinol Metab 2008;93:4331–41. [DOI] [PMC free article] [PubMed] [Google Scholar]
- 39.Murugan AK, Dong J, Xie J, Xing M. MEK1 mutations, but not ERK2 mutations, occur in melanomas and colon carcinomas, but none in thyroid carcinomas. Cell Cycle 2009;8:2122–4. [DOI] [PubMed] [Google Scholar]
- 40.Völkers M, Toko H, Doroudgar S, Din S, Quijada P, Joyo AY, et al. Pathological hypertrophy amelioration by PRAS40-mediated inhibition of mTORC1. Proc Natl Acad Sci U S A 2013;110:12661–6. [DOI] [PMC free article] [PubMed] [Google Scholar]
- 41.Murugan AK, Xing M. Anaplastic thyroid cancers harbor novel oncogenic mutations of the ALK gene. Cancer Res 2011;71:4403–11. [DOI] [PMC free article] [PubMed] [Google Scholar]
- 42.Fukui Y, Ihara S. A mutant of SWAP-70, a phosphatidylinositoltrisphosphate binding protein, transforms mouse embryo fibroblasts, which is inhibited by sanguinarine. PLoS One 2010;5:e14180. [DOI] [PMC free article] [PubMed] [Google Scholar]
- 43.Agrawal N, Akbani R, Aksoy BA, Ally A, Arachchi H, Asa SL et al. Integrated genomic characterization of papillary thyroid carcinoma. Cell 2014;159:676–90. [DOI] [PMC free article] [PubMed] [Google Scholar]
- 44.Landa I, Ibrahimpasic T, Boucai L, Sinha R, Knauf JA, Shah RH, et al. Genomic and transcriptomic hallmarks of poorly differentiated and anaplastic thyroid cancers. J Clin Invest 2016;126:1052–66. [DOI] [PMC free article] [PubMed] [Google Scholar]
- 45.Gao J, Aksoy BA, Dogrusoz U, Dresdner G, Gross B, Sumer SO, et al. Integrative analysis of complex cancer genomics and clinical profiles using the cBioPortal. Sci Signal 2013;6:pl1. [DOI] [PMC free article] [PubMed] [Google Scholar]
Associated Data
This section collects any data citations, data availability statements, or supplementary materials included in this article.