

Bacteria can be exposed to H2O2 and NO· concurrently within phagosomes. In such multistress situations, bacteria could have evolved to simultaneously degrade both toxic metabolites or preferentially detoxify one over the other. Here, we found that simultaneous exposure to H2O2 and NO· leads to prioritized detoxification, where detoxification of NO· is hampered until H2O2 has been eliminated. This phenomenon resembles CCR, where bacteria consume one substrate over others in carbon source mixtures. Further experimentation revealed a central role for transcriptional regulation in the prioritization of H2O2 over NO·, which is also important to CCR. This study suggests that regulatory scenarios observed in bacterial consumption of growth-promoting compound mixtures can be conserved in bacterial detoxification of toxic metabolite mixtures.
KEYWORDS: Hmp, hydrogen peroxide, nitric oxide
ABSTRACT
Hydrogen peroxide (H2O2) and nitric oxide (NO·) are toxic metabolites that immune cells use to attack pathogens. These antimicrobials can be present at the same time in phagosomes, and it remains unclear how bacteria deal with these insults when simultaneously present. Here, using Escherichia coli, we observed that simultaneous exposure to H2O2 and NO· leads to prioritized detoxification, where enzymatic removal of NO· is impeded until H2O2 has been eliminated. This phenomenon is reminiscent of carbon catabolite repression (CCR), where preferred carbon sources are catabolized prior to less desirable substrates; however, H2O2 and NO· are toxic, growth-inhibitory compounds rather than growth-promoting nutrients. To understand how NO· detoxification is delayed by H2O2 whereas H2O2 detoxification proceeds unimpeded, we confirmed that the effect depended on Hmp, which is the main NO· detoxification enzyme, and used an approach that integrated computational modeling and experimentation to delineate and test potential mechanisms. Plausible interactions included H2O2-dependent inhibition of hmp transcription and translation, direct inhibition of Hmp catalysis, and competition for reducing equivalents between Hmp and H2O2-degrading enzymes. Experiments illustrated that Hmp catalysis and NAD(P)H supply were not impaired by H2O2, whereas hmp transcription and translation were diminished. A dependence of this phenomenon on transcriptional regulation parallels CCR, and we found it to involve the transcriptional repressor NsrR. Collectively, these data suggest that bacterial regulation of growth inhibitor detoxification has similarities to the regulation of growth substrate consumption, which could have ramifications for infectious disease, bioremediation, and biocatalysis from inhibitor-containing feedstocks.
IMPORTANCE Bacteria can be exposed to H2O2 and NO· concurrently within phagosomes. In such multistress situations, bacteria could have evolved to simultaneously degrade both toxic metabolites or preferentially detoxify one over the other. Here, we found that simultaneous exposure to H2O2 and NO· leads to prioritized detoxification, where detoxification of NO· is hampered until H2O2 has been eliminated. This phenomenon resembles CCR, where bacteria consume one substrate over others in carbon source mixtures. Further experimentation revealed a central role for transcriptional regulation in the prioritization of H2O2 over NO·, which is also important to CCR. This study suggests that regulatory scenarios observed in bacterial consumption of growth-promoting compound mixtures can be conserved in bacterial detoxification of toxic metabolite mixtures.
INTRODUCTION
Phagocytic cells of the innate immune response deploy a number of weapons to neutralize invading pathogens, including reactive oxygen and nitrogen species (ROS and RNS) (1–3). Of these, nitric oxide (NO·) and hydrogen peroxide (H2O2) are of particular interest due to their rapid ability to diffuse across cell membranes (4, 5). Accordingly, microbes have evolved detoxification and repair systems to withstand these stresses, the importance of which has been highlighted by the numerous pathogens that suffer attenuated virulence when one or more of their NO· or H2O2 detoxification systems are impaired (6–13). The physiological interactions of concurrent NO· and H2O2 stresses, which can be encountered within phagosomes (3, 14–16), are not well understood. In vitro studies have suggested that NO· can both reduce and enhance killing by high concentrations of H2O2 depending on the organism and treatment conditions (17–20). For example, Pacelli and colleagues observed that simultaneous exposure to 1 mM H2O2 and 1 mM diethylamine (DEA) NONOate, a NO· donor, led to increased killing of different strains of Escherichia coli (18). Similarly, Yadav and coworkers found that millimolar concentrations of H2O2 and NO· donors enhanced killing of E. coli as well as Actinobacillus actinomycetemcomitans, Actinomyces viscosus, Streptococcus mutans, and Streptococcus sobrinus (17). On the other hand, Gusarov and Nudler found that 30 μM boluses of NO· delivered right before 10 mM boluses of H2O2 protected Bacillus subtilis from cell death through reactivation of a catalase and inhibition of thioredoxin and thioredoxin reductase, which limited Fenton chemistry (19). Additionally, H2O2 has been shown to inhibit expression of the E. coli NO· detoxification enzyme flavorubredoxin under anaerobic conditions (21). With few exceptions, the concentrations used in previous studies were beyond those found physiologically, which are in the micromolar range (22, 23), and reaction fluxes through the major detoxification systems (for H2O2, alkyl hydroperoxidase [Ahp] and catalases [KatE, KatG] [4, 24]; for NO·, flavorubredoxin [NorV], flavohemoglobin [Hmp], and periplasmic formate-dependent nitrite reductase [NrfA] [25–27]) were not quantified. Since the physiological impacts of NO· and H2O2 exposure are concentration dependent (22, 28), it is important to understand the functioning of and interactions between these defense networks at phagosomal concentrations.
The H2O2 and NO· biochemical reaction networks of E. coli are complex, and dynamic models have proven useful in quantifying the distributions of these toxic metabolites and exploring system behaviors (29–35). These previously developed models included detoxification by antioxidants and enzymes, transcriptional regulation and inactivation of enzymes, damage and repair of DNA and Fe-S clusters, and destruction of amino acids by the hydroxyl radical, ·OH, and they were compartmentalized (intracellular, media, and gaseous) to account for the cell-dependent and cell-independent reactions. The models have correctly predicted major genetic (29) and environmental (34) perturbations and been used to dissect network behavior, such as NO· detoxification under microaerobic conditions (32) and impaired NO· dioxygenase activity in a ΔclpP mutant (30). To date, these models have been used to analyze the complex networks of single-agent stresses, and given the considerably more complex nature of multistress conditions, multistress models have the potential to be even more enlightening.
Here, we examined the response of E. coli to concurrent exposure to physiologically relevant concentrations of both NO· and H2O2. We observed that H2O2 detoxification was not affected by the presence of NO·, whereas NO· clearance was delayed in an H2O2 concentration-dependent manner. Interestingly, computational analyses revealed that metabolic detoxification of these stressors is prioritized, with H2O2 preceding NO·. Carbon catabolite repression (CCR), which produces prioritized consumption of nutrients, has been widely observed (36), and the data presented here suggest that processing of toxic metabolites has notable parallels. Possible mechanisms behind this phenomenon were explored, and we found that transcriptional regulation, which also plays a significant role in CCR (36), was a major driver of this multistress physiology.
RESULTS
NO· and H2O2 detoxification under simultaneous nitrosative and oxidative stress.
In this work, we sought to explore interactions within the NO· and H2O2 biochemical networks using concentrations that resemble those found within phagosomes (22, 23). Exponentially growing E. coli cells were washed and used to inoculate a bioreactor to an optical density at 600 nm (OD600) of 0.025 before being treated with the NO· donor DPTA NONOate ((Z)-1-[N-(3-aminopropyl)-N-(3-ammoniopropyl)amino]diazen-1-ium-1,2-diolate; here referred to as DPTA; 50 μM; resulting in a peak NO· concentration of ∼1 to 2 μM) and/or various bolus concentrations of H2O2 (10 to 30 μM). NO· had no effect on detoxification of H2O2 (Fig. 1A); however, we observed that H2O2 delayed NO· detoxification in a dose-dependent manner (Fig. 1B). There was no effect on NO· or H2O2 levels in cell-free controls due to the addition of the other chemical (see Fig. S1 in the supplemental material). Also, we note that no loss in viability (Fig. S2) was observed during treatment, and cultures resumed growth after clearance of both H2O2 and NO· (Fig. S3).
FIG 1.

H2O2 and NO· clearance. Exponentially growing wild-type cells were inoculated into a bioreactor containing 0, 10, 20, or 30 μM H2O2 in M9 medium with 10 mM glucose. The culture was then immediately treated with 50 μM DPTA or an equivalent amount of the DPTA solvent. H2O2 concentrations (A) were quantified every 5 min, whereas NO· (B) was monitored continuously. (C) Cumulative consumption of NO· by cells was quantified by modeling with a black-box cellular compartment. Error bars show the standard errors of the means from three biological replicates.
Further analysis of the cotreatment results compared to those for cell-free controls revealed that E. coli exhibits biphasic detoxification of NO· (Fig. 1C). In the first phase, NO· is consumed at a lower rate, ∼1.5 nmol of NO· per min, whereas the rate in the second phase is >3-fold higher. Interestingly, the initial detoxification rate deviates little between cultures, and cultures do not enter the second NO· detoxification phase until after they had detoxified their respective boluses of H2O2. These data suggest that detoxification of H2O2 is prioritized over that of NO· when both are present in E. coli cultures. Such a phenomenon is reminiscent of specific nutrient consumption patterns exhibited by E. coli, where simultaneous exposure to two carbon sources leads to prioritized consumption of substrates (36). For example, when presented with glucose and fructose in the media, E. coli will prioritize glucose consumption (37). Media with glucose and gluconate provide an example of consumption in parallel, where glucose and gluconate are consumed simultaneously (38).
Possible causes of prioritized detoxification of H2O2 over NO· center on Hmp.
Parallels exist between the detoxifications of H2O2 and NO· by E. coli, such as that both are governed by enzymes, the expression of those enzymes is generally induced by their toxic substrates, and both depend to some extent on reducing power (39). Previous studies with either H2O2 or NO· (but not both) in the same growth phase, comparable media, and concentrations similar to those used here identified KatG and AhpCF as the main determinants of H2O2 detoxification and Hmp as the major NO· detoxification enzyme (30, 34). Distributions calculated with a model that includes both H2O2 and NO· stress networks, which was constructed in this investigation, also indicate that KatG, AhpCF, and Hmp are the major detoxification systems (Fig. 2 and Fig. S4) (see Materials and Methods).
FIG 2.

Simulation results under various H2O2 and NO· stress conditions. Response of the wild type to individual stress was simulated using the ensemble of models that have an ER of <10 after MCMC. Predicted H2O2 fluxes through Ahp, KatE, and KatG were calculated when 10 μM H2O2 (A), 20 μM H2O2 (B), or 30 μM H2O2 (C) was delivered. (D) Predicted NO· flux through Hmp and NorV after a bolus treatment of 50 μM DPTA was also quantified.
Since all three of those defense systems are induced by their respective stresses, we assayed whether induced responses contributed to the detoxification pattern observed. We found that inducible responses to H2O2 played a minor role in detoxification under cotreatment, whereas they were critical for NO· detoxification (Fig. 3). We expect that this feature largely resulted from the trace levels of Hmp that are present under normal growth conditions compared to the measurable abundances of H2O2-degrading enzymes (4, 40).
FIG 3.
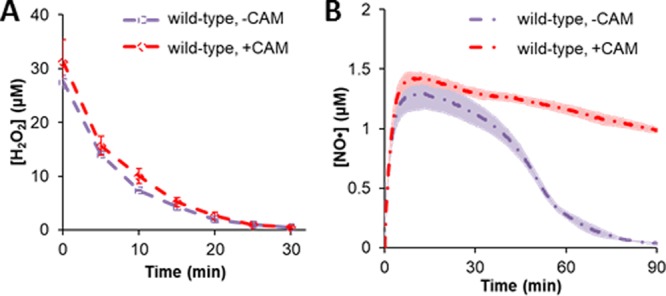
Importance of stress-induced response to NO· and H2O2 detoxification. Before treatment with 50 μM DPTA and 30 μM H2O2, 100 μg/ml of CAM or ethanol (−CAM), its solvent, was added to the growing culture to prevent further translation. H2O2 (A) and NO· (B) consumption assays were then performed to assess the importance of protein synthesis during simultaneous NO· and H2O2 stress. The dots in panel A and dashed lines in panel B represent the means from three biological replicates, and the error bars in panel A and shadows around the lines in panel B represent the standard errors of the means.
Both AhpCF and Hmp use NADH; however, H2O2 detoxification depends less on the reductant because KatG exhibits catalase activity, which does not require NADH, and AhpCF has a lower apparent KM for NADH (approximately 1 μM compared to 5 μM for Hmp) (29, 34, 41, 42). These data and knowledge suggested that H2O2 detoxification would be more robust than NO· detoxification under the conditions studied here and that Hmp availability or reducing equivalent supply underlies the detoxification pattern observed. In addition, it is possible that H2O2 or a cellular component that is modulated by it directly inhibits Hmp. Further, it is worth noting that the NO· dioxygenase activity of Hmp requires O2 and that the O2 level stayed far higher than the apparent KM of Hmp for O2 (Fig. S5, 190 μM ≫ 100 μM) (41).
The scenarios delineated above center on perturbations to Hmp activity, which led us to hypothesize that Hmp was the target for H2O2-dependent inhibition of NO· detoxification. We confirmed that hypothesis to be true with a Δhmp mutant (Fig. 4A). Further, complementation of the Δhmp mutant with hmp expressed from its native promoter in a low-copy-number plasmid restored the H2O2-dependent delay of NO· detoxification, whereas an empty plasmid control could not (Fig. 4B and C and Fig. S6).
FIG 4.

Hmp is required for H2O2 to delay NO· clearance. (A) Without Hmp (Δhmp), NO· detoxification was equivalently slow with or without H2O2. (B and C) When hmp was complemented by expressing it from its native promoter (hmpp) on the pUA66 plasmid, delay of NO· detoxification by H2O2 was restored. (B) Due to copy number or leakiness effects from the plasmid-borne hmp, cells could more readily consume NO· when 50 μM DPTA was delivered, resulting in a comparatively low [NO·] peak and fast NO· clearance. (C) When the concentration of DPTA was increased 2.5-fold to 125 μM, the NO· concentration was closer to what was observed in wild-type cultures (Fig. 1) and the inhibition of NO· detoxification by H2O2 became more evident. An empty plasmid control has been provided in Fig. S6.
To assess whether altered Hmp availability, catalytic activity, and/or NADH supply were feasible mechanisms for how NO· detoxification was stalled by H2O2, we performed simulations with the combined H2O2-NO· stress model (Fig. S7). Notably, the model did not predict that H2O2 would impair NO· detoxification, which suggested that one or more missing interactions between the stress networks was not in the current knowledge base (Fig. S8A). Decreasing kmax for hmp transcription or the first-order kinetic constant for translation by 35-fold was sufficient to delay NO· detoxification to levels observed in the cultures cotreated with 30 μM H2O2. In addition, impairing Hmp catalysis by decreasing the rate of the catalytic step for NO3− generation or initial NAD(P)H levels by 150- and 4,000-fold, respectively, was also able to recapitulate NO· dynamics in the presence of 30 μM H2O2. Notably, the lower availability of reducing equivalents simulated in Fig. S7D led to slower detoxification of H2O2 (Fig. S8B), which was not observed experimentally, and a decrease of 4,000-fold seemed unreasonable given previous measurements of NAD(P)H pools (43, 44). Collectively, these simulations revealed that while impaired transcription, translation, and catalysis might underlie the delay in NO· detoxification that we observed, it was unlikely that insufficient NAD(P)H levels contributed to the phenomenon.
Inhibition of Hmp catalysis does not underlie delayed NO· detoxification, and NAD(P)H levels are confirmed to be sufficient.
We sought to experimentally assess contributions of the scenarios delineated in the previous section to delayed NO· detoxification in the presence of 30 μM H2O2. One experiment we devised had the capacity to assess whether inhibition of Hmp catalysis participated in delaying NO· detoxification, as well as to assess the computational prediction that NAD(P)H supply was nonlimiting (Fig. 5A). In this experiment, a Φ(Hmp-GFP) translational fusion would be preexpressed prior to treatment, and a translational inhibitor would be included during treatment to prevent further protein production. Introduction of cells into an environment that already contained NO· with and without H2O2 would produce identical NO· clearance profiles if Hmp catalysis were unimpeded and NAD(P)H supply were sufficient. However, if either one contributed, the NO clearance profiles would differ significantly (Fig. 5A). When this experiment was performed, clearance of NO· by preexpressed Φ(Hmp-GFP) was indistinguishable in the presence and absence of 30 μM H2O2 (Fig. 5B), and initial Φ(Hmp-GFP) concentrations were confirmed to be equivalent in the NO·-only and NO·-with-H2O2 experiments. Uninduced controls showed that cultures could not clear NO· in the presence or absence of H2O2 without the induced Φ(Hmp-GFP) (Fig. S9), and controls with only green fluorescent protein (GFP) showed that the presence of the fluorophore does not impact NO· clearance (Fig. S10). These data eliminated inhibition of Hmp catalytic activity as a potential mechanism and confirmed the model prediction that NAD(P)H supply is sufficient for NO· detoxification in the presence of H2O2.
FIG 5.

Catalytic activity of Hmp in presence and absence of H2O2. A translational fusion of Φ(Hmp-GFP) was expressed from pUA66 T5p-Φ(hmp-gfpsf) in exponentially growing Δhmp cells. After 15 min, translation was inhibited with 100 μg/ml CAM, and cells were washed and used to inoculate a bioreactor containing 50 μM DPTA and 100 μg/ml CAM. DPTA was added to the bioreactor 10 min prior to inoculation, allowing a stable NO· concentration to be reached before addition of Φ(Hmp-GFP)-containing cells. (Inset) Comparable levels of Φ(Hmp-GFP) under both treatment conditions were confirmed based on fluorescence measurements. Simulated effects of decreased Hmp catalytic activity and reduced availability of NAD(P)H are shown in panel A, and experimental observations are shown in panel B. NO· measurements and fluorescence readings show the averages from three biological replicates, with error bars representing the standard errors of the means.
H2O2 reduces the NO·-induced protein and transcript output from the hmp promoter.
With Hmp present before H2O2 and NO· treatment, H2O2 no longer impaired NO· detoxification. To assess whether insufficient Hmp availability underscored the phenomenon, we quantified transcript and protein output from the hmp promoter with a previously constructed reporter plasmid (pUA66 hmpp-gfpmut2 [30]). To maintain consistent NO· dynamics between conditions, experiments were performed in a Δhmp background. GFP fluorescence levels were significantly lower in the presence of H2O2 (Fig. 6A). In fact, no detectable GFP was produced in the first 15 min. However, after H2O2 had cleared from the system (∼25 min), GFP production initiated (Fig. S11) and resembled the sample without H2O2 with a time delay. The lower GFP levels in cells experiencing simultaneous NO· and H2O2 treatment is at least partially explained by a significant defect in transcript abundance (Fig. 6B). These data suggest that the delay in NO· detoxification observed arises from difficulties associated with Hmp synthesis under concurrent NO· and H2O2 stress.
FIG 6.

H2O2 reduces protein and transcript output from the hmp promoter. Exponentially growing Δhmp cells transformed with an hmp transcriptional reporter (pUA66 hmpp-gfpmut2) were inoculated into a bioreactor containing 0 or 30 μM H2O2 in M9 medium with 10 mM glucose and then immediately treated with 50 μM DPTA or an equivalent amount of the DPTA solvent. A Δhmp background was used to maintain identical NO· environments in the two samples. GFP production (A) was significantly inhibited, which is at least partially explained by a reduction in gfpmut2 transcript levels (B). Here, the relative [mRNA] represents the [mRNA] normalized by the maximum concentration observed in the experiment, which happens at t = 15 min for NO· (blue). Samples collected at t = 0 were fixed (A) or treated with RNAprotect (B) before exposure to stress, as described in Materials and Methods.
NO· reduces the H2O2-induced protein output from the katG promoter.
To complement results from the hmp promoter, we performed similar experiments with a katG transcriptional reporter. We observed that H2O2 by itself induced protein output from the katG promoter, which is consistent with previous reports (34, 45), whereas NO· by itself failed to induce protein production (Fig. 7). Interestingly, simultaneous stress eliminated the ability of H2O2 to induce GFP production from the katG promoter under the conditions tested here. These data from the hmp and katG transcriptional reporters suggest that either a shared regulator of these genes is perturbed by simultaneous exposure or a more global effect is present. Also, it is worth noting that these results complement those shown in Fig. 3 and further illustrate that H2O2 detoxification is more robust than NO· detoxification because it can function almost equivalently with or without its induced response under the conditions considered here.
FIG 7.
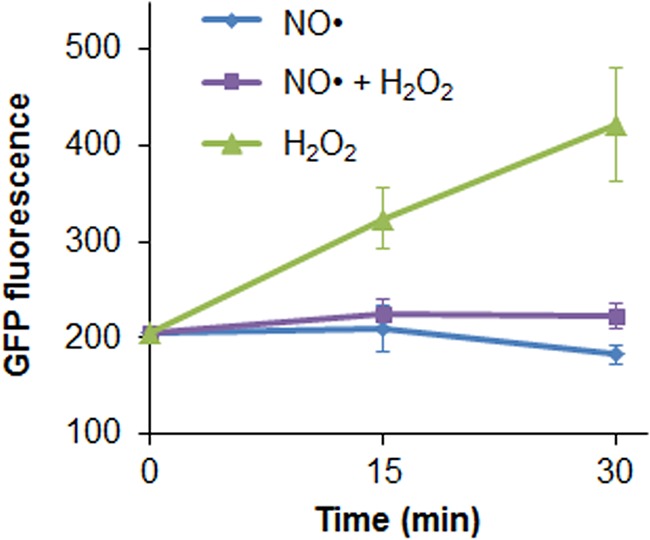
Expression from the katG promoter is also inhibited by simultaneous NO· and H2O2 stress. Exponentially growing Δhmp cells transformed with pUA66 katGp-gfpmut2 were inoculated into a bioreactor containing 0 or 30 μM H2O2 in M9 medium with 10 mM glucose and then immediately treated with 50 μM DPTA NONOate or an equivalent amount of the DPTA solvent. Measurable GFP (P < 0.05) is observed in the H2O2-only case within 15 min, but expression is not significant in the presence of NO· after 15 or 30 min.
Involvement of known regulators of hmp and katG expression.
Given the defective output from both the hmpp and katGp transcriptional reporters, we performed experiments to assess the involvement of known regulators of hmp or katG expression. FNR and Fur have been identified as regulators of both hmp and katG, whereas NsrR, RpoS, SdsN, and MetR have been implicated in the regulation of hmp and OxyR in the regulation of katG (39, 46–55). In addition, we assessed the involvement of DksA, the stringent response regulator, which has recently emerged as a regulator of oxidative and nitrosative stresses in Salmonella enterica (56–59) and that we have identified as important for expression of Hmp in E. coli (60).
The roles of FNR, Fur, RpoS, SdsN, and OxyR were addressed by examining NO· detoxification with and without H2O2 in Δfnr, Δfur, ΔrpoS, ΔsdsN, and ΔoxyR mutants (Fig. S12). There was not a notable difference in detoxification dynamics between wild-type and Δfnr, ΔrpoS, and ΔoxyR strains. A minor difference in NO· dynamics was observed in the ΔsdsN mutant; however, it was transient and NO· clearance times with and without H2O2 were indistinguishable from those of the wild type (Fig. S12A). A slight delay in NO· clearance in the presence of H2O2 was observed in the case of the Δfur mutant (Fig. S12E), but it was accompanied by a delay in H2O2 clearance (Fig. S12K). The delay in H2O2 clearance is not surprising, given that Fur is known to be a transcriptional activator of katG expression (53).
NsrR is the main transcriptional regulator responsible for repression of hmp expression in the absence of NO·; thus, when nsrR is deleted, Hmp is no longer at trace levels under normal growth (47). Indeed, when the ΔnsrR mutant was stressed with NO· in the presence and absence of 30 μM H2O2, simultaneous detoxification was observed and the NO· clearance profiles with and without H2O2 were indistinguishable (Fig. 8A). When nsrR was complemented by a plasmid-borne copy expressed from its native promoter, prioritized detoxification of H2O2 over NO· was restored, which was not observed with an empty vector control (Fig. 8B and Fig. S13). These data demonstrate that the prioritized detoxification observed depends on both NsrR and Hmp (Fig. 4).
FIG 8.

NsrR is required for compromised NO· detoxification in the presence of H2O2. (A) Exponentially growing ΔnsrR cells were transferred to a bioreactor that consisted of M9 medium with 10 mM glucose with or without 30 μM H2O2 and immediately treated with 50 μM DPTA. The △nsrR mutant was able to detoxify NO· in the presence or absence of H2O2. (B) When the △nsrR mutant was complemented by expressing nsrR under the control of its native promoter (nsrRp) on a pUA66 plasmid, the ability of H2O2 to inhibit NO· detoxification was restored.
As described above, delayed NO· detoxification in the presence of H2O2 is associated with low Hmp levels at the onset of stress and insufficient induction during simultaneous stress. The ΔnsrR mutant increases the abundance of Hmp prior to stress, but data shown in Fig. 8 do not assess whether reduced hmp expression during simultaneous stress was present in the ΔnsrR mutant. To assess this aspect of transcriptional regulation in the ΔnsrR mutant, we assessed hmpp transcript output via a gfp mRNA transcript expressed from hmpp. These experiments were performed in the Δhmp ΔnsrR mutant to ensure identical NO· environments, and we observed that the transcript level of gfp in NO· with H2O2 was significantly less than that in the NO·-only sample after 15 min (Fig. 9). Treatment with rifampin at the onset of the assay led to negligible transcript levels under both conditions, suggesting that the transcripts measured in the absence of rifampin were synthesized during NO·-only and cotreatment exposures. These data indicate that simultaneous H2O2 and NO· stress suppresses the transcript output of hmpp, even in the absence of NsrR. Collectively, these data suggest that NsrR is required for the observed prioritization of detoxification due to its impact on basal Hmp levels, whereas it is not required to observe suppressed expression of hmp under simultaneous stress compared to NO·-only stress.
FIG 9.
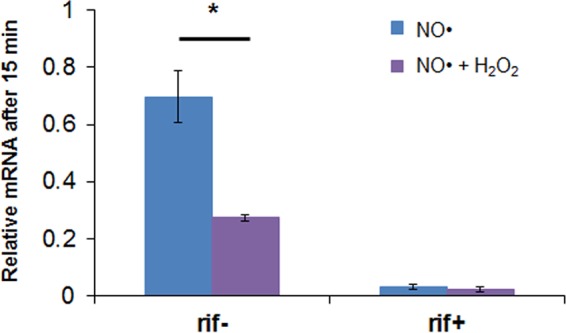
NsrR is not required for the suppression of hmp expression under simultaneous stress. Exponentially growing Δhmp ΔnsrR cells transformed with an hmp transcriptional reporter (pUA66 hmpp-gfpmut2) were inoculated into a bioreactor containing 0 or 30 μM H2O2 in M9 medium with 10 mM glucose and then immediately treated with 50 μM DPTA NONOate. In the Δhmp ΔnsrR mutant, gfp transcripts are constitutively expressed, so transcript levels after 15 min were compared to those at time zero (prior to treatment). gfp transcript levels drop after 15 min in the presence of NO·. They drop significantly more so (P < 0.05) in the H2O2-containing sample, indicating that the transcriptional defect is present even in the absence of NsrR. Rifampin-treated samples (rif+) were included to confirm that transcripts would degrade significantly over 15 min if expression was inhibited. Error bars show the standard errors of the means for five biological replicates in rif− samples and three biological replicates in rif+ samples.
MetR is also known to regulate hmp expression (46), although unlike the other regulators its knockout mutant cannot grow in minimal medium (61, 62), which was the medium of this study. Therefore, to test the involvement of MetR, we complemented the Δhmp mutant with hmp expressed from its native promoter and a truncated version that was missing the MetR regulatory site (Fig. S14). Removal of the MetR binding site impaired NO· detoxification, which is consistent with previous reports identifying MetR as an activator of hmp expression (46); however, H2O2 delayed NO· detoxification in the presence and absence of the MetR binding site. Further, we constructed hmp reporter plasmids both with and without the MetR binding site, and GFP production in the presence of NO· with and without H2O2 was consistent with results from the NO· detoxification assays. The initial GFP level was lower in the absence of the MetR binding site, the rate at which GFP accumulated without the MetR site was lower than that in the construct with the site, and H2O2 inhibited the rate at which GFP was synthesized from both reporter constructs (Fig. S15).
Recently, we found DksA to be a critical regulator of Hmp expression (60). A dksA deletion mutant is an auxotroph for multiple amino acids; therefore, to test its involvement in the phenomenon studied here, we had to assess whether H2O2 delayed NO· detoxification in media that allowed ΔdksA growth (63, 64). In addition, we had to confirm that the addition of those amino acids did not alter H2O2 and NO· concentrations in a cell-free system. As depicted in Fig. S16, the addition of those amino acids did not alter H2O2 or NO· concentrations appreciably in a cell-free system, and H2O2 still impaired NO· detoxification in wild-type cultures (Fig. S12F). When treated with NO· only, the ΔdksA mutant exhibited a significant delay in NO· detoxification compared to that of the wild type (Fig. S12F). Cotreatment with H2O2 delayed NO· detoxification in the ΔdksA mutant even further (Fig. S12F). For the ΔdksA mutant, the presence of NO· inhibited H2O2 detoxification, unlike H2O2-only treatments (Fig. S17), which was not an effect seen with the wild type (Fig. 1). When ΔdksA mutant culturability was measured, H2O2 by itself did not have much of an impact, NO·-only treatments produced an ∼3-fold loss in culturability, and the cotreatment decreased culturability by ∼1,000-fold (Fig. S18A). Due to this excessive cell death, which was not observed for the wild type (Fig. S18B), we were unable to exclude or implicate DksA in the ability of H2O2 to delay NO· detoxification.
DISCUSSION
For infecting pathogens, the phagosomal environment is a deadly nutrient-depriving compartment of ROS, RNS, acidic pH, antimicrobial peptides, and proteases (1–3). While many studies have examined the mechanisms of these antimicrobial defenses, most have focused on isolated stresses. Under conditions with a single insult, resources can be focused toward relieving the stress imposed; however, in multistress environments, resource allocation can be more complicated. Bacteria could have evolved to process the stresses simultaneously or prioritize defense against one or more of the insults over the others. How bacterial resources are distributed to cope with two or more phagosomal stresses remains largely an open question. In general, multistress environments are not rare for microbes; organisms used for bioremediation often encounter environments with solvents, heavy metals, oxidants, and other toxic species (65), whereas biocatalysts are exposed to furans, weak acids, and phenolic compounds in lignocellulosic hydrolysates (66, 67). We speculate that bacterial regulatory structures that have evolved to weather specific multistress environments are conserved under conditions with different stressors.
Here, we explored the response of E. coli to simultaneous exposure to H2O2, an ROS, and NO·, an RNS. We observed that H2O2 detoxification was prioritized over that of NO· and used a computational model and experimentation to enumerate and test different mechanistic possibilities. Hmp was the main enzyme used by E. coli to detoxify NO· under the conditions used here, and H2O2 had no effect on its catalytic activity or the requirement of the enzyme for reducing equivalents (Fig. 5B). Rather, H2O2 was shown to delay NO·-induced Hmp synthesis with significant repression of transcript and protein output from the hmp promoter (Fig. 6). H2O2 detoxification was more robust than that of NO·, which was due to the nonnegligible basal levels of defense enzymes that could cope with micromolar concentrations of H2O2 (4). When basal levels of Hmp were increased by synthetic preexpression or knockout of the transcriptional repressor NsrR, NO· and H2O2 detoxification proceeded simultaneously (Fig. 5B and 8A). These data suggest that transcriptional regulation plays a pivotal role in the prioritized detoxification of H2O2 over NO·.
CCR is used by bacteria to prioritize consumption of nutrients. In E. coli and many other bacteria, glucose is the preferred substrate and is consumed first when multiple carbon sources are present (36). Transcriptional regulation is a major driver of such prioritized catabolism (36). In E. coli, the major transcription factor is cyclic AMP (cAMP) receptor protein (CRP), which activates the expression of machinery to consume less preferred carbon sources when cAMP accumulates in the absence of glucose and other preferred substrates (36). In Bacillus subtilis, a different regulatory scheme, namely, transcriptional repression by CcpA in the presence of glucose, is used to achieve CCR (36). Prioritized consumption and the central role of transcriptional regulation is also observed for other growth substrates, such as with exogenous terminal electron acceptors from which O2 is typically respired first (68). The widespread use of CCR by bacteria suggests that it has been a favorable evolutionary solution for organisms presented with multiple growth-promoting compounds. Data presented here suggest that regulation of the detoxification of growth-inhibitory compounds has similar features. However, it is worth noting that there are significant differences between the prioritized detoxification described here and CCR. For example, inducer exclusion, which is where the presence of glucose interferes with the import of other carbon sources, contributes to CCR (36), whereas it cannot exist for H2O2 and NO· detoxification because they passively diffuse across membranes (4, 5).
We rationalize that there are several reasons as to how regulation had evolved to yield prioritized detoxification of H2O2 over that of NO. For one, E. coli is exposed to H2O2 from its own metabolism during normal aerobic growth (4). Inadvertent loss of electrons to O2 will produce superoxide, O2−, which in turn will be dismutated to H2O2. Strains devoid of all catalases and hydroperoxidases, ΔkatE ΔkatG ΔahpCF mutants, have been shown to accumulate inhibitory levels of H2O2 in culture (4, 69). Such a scenario would explain the measureable hydroperoxidase activity that E. coli cultures exhibit in the absence of exogenous H2O2. On the other hand, NO· is a less common stress that E. coli encounters as a product of immune cells or metabolic intermediate released from organisms conducting denitrification. It would seem beneficial for resource conservation to not express NO· detoxification machinery at high basal levels if the stressor is not encountered frequently, and that becomes even more advantageous considering that Hmp generates ROS when NO· is not present (70, 71). We reason that E. coli regulation in this case has evolved to readily deal with oxidative stress from aerobic metabolism while limiting the use of Hmp to conditions where its benefits outweigh the costs. The consequences of such regulation would be prioritized detoxification of H2O2 over NO· during cotreatment if induced responses were difficult to mount in the multistress environment, which appears to be the case here (Fig. 6 and 7). In all, several factors that center on the lifestyle and physiology of E. coli could explain how its regulation has evolved to detoxify these metabolites.
Questions still remain regarding the molecular mechanism of the interaction described here. Specifically, data from the katG transcriptional reporter (Fig. 7) suggested that the effect was not confined to the hmp promoter. Further, transcript measurements in the ΔnsrR mutant showed that lower levels are found under dual stress conditions whether or not the main regulator of hmp expression is present (Fig. 9). It is possible that the H2O2 and NO· response networks interact more globally, for instance, as a result of their impacts on cellular metabolism (72, 73) and/or through a major transcription or translation regulator. Investigating those avenues of the phenomenon will be the focus of future studies.
MATERIALS AND METHODS
Chemicals.
The NO· donor DPTA NONOate {(Z)-1-[N-(3-aminopropyl)-N-(3-ammoniopropyl)amino]diazen-1-ium-1,2-diolate} (Cayman Chemical), which we refer to as DPTA and which releases 2 molecules of NO· per parent compound, was dissolved in 10 mM NaOH to a working concentration of 72 mM DPTA and stored on ice prior to addition to the bioreactor. H2O2 (35 wt% solution in water) was purchased from Fisher Scientific. M9 minimal salts (5×) were purchased from BD Difco and prepared according to the manufacturer’s instructions or were made from components. Potassium phosphate buffer (PBS) was sterile filtered with a 0.22-μm filter, and LB was sterilized by autoclaving. Bovine liver catalase at 2,000 to 5,000 U/mg protein was purchased from Sigma-Aldrich, dissolved in 50 mM potassium phosphate buffer, pH 7.0, and passed through a 0.22-μm filter before addition to media.
Bacterial strains.
All assays were performed with E. coli MG1655. For assays with mutants, mutations were moved into MG1655 via P1 phage transduction and assessed for proper chromosomal integration and lack of gene duplication using the primers listed in Table S1 in the supplemental material. When necessary, mutants were cured using pCP20 and confirmed for proper scar sequence size using the primers described in Table S1.
NO· and H2O2 measurements.
NO· was measured continuously (20 reads/s) using an ISO-NOP 2-mm electrode (World Precision Instruments, Inc.). The sensor was calibrated daily according to the manufacturer’s instructions in order to convert the raw output signal (pA) to NO· concentration (μM). For calibrations performed with S-nitroso-N-acetyl-d,l-penicillamine (SNAP) (Cayman Chemical), a conversion factor of 0.457 NO· per SNAP molecule was used (60). H2O2 from the sterile filtered samples was measured using the Amplex red hydrogen peroxide/peroxidase kit (Life Technologies) according to the manufacturer’s instructions, following dilution to below 10 μM H2O2. A standard curve from 0 to 10 μM H2O2 was used to convert raw fluorescence values to H2O2 concentration.
NO· and H2O2 consumption assays.
E. coli from a −80°C stock were grown aerobically in 1 ml LB plus 30 to 75 U/ml catalase for 4 h at 37°C with shaking at 250 rpm, and 10 μl was used to inoculate 1 ml M9 minimal medium with 10 mM glucose plus 30 to 75 U/ml catalase. This overnight culture was grown for 16 h at 37°C with shaking at 250 rpm and was used to inoculate a 250-ml baffled flask containing 20 ml M9 10 mM glucose plus 30 to 75 U/ml catalase to an OD600 of 0.01. OD600 measurements were performed on a Synergy H1 hybrid microplate reader (BioTek Instruments). Catalase was added in these steps to prevent H2O2 accumulation in strains lacking major detoxifying enzymes and added to wild-type cultures to maintain consistency across strains. The catalase concentration was determined based on the amount required for maximal growth rate in M9 minimal medium with 10 mM glucose for a mutant lacking all major H2O2 detoxification enzymes (ΔkatE ΔkatG ΔahpCF) and has been used in previous studies under similar conditions (34, 74). To support growth of the ΔdksA mutant, which is auxotrophic, M9 glucose medium used for growth and stress assays was supplemented with 400 μg/ml serine and 40 μg/ml each of aspartate, glutamate, histidine, isoleucine, leucine, phenylalanine, threonine, and valine (63, 64, 75). M9 glucose medium supplemented with these amino acids is referred to as M9 minAA.
When the culture reached an OD600 of ∼0.2, 12 ml was removed to a prewarmed 15-ml Falcon tube and centrifuged at 37°C and 4,000 rpm for 10 min. A 10.8-ml volume of spent medium was removed, the cell pellet was resuspended, and 1 ml was transferred to a warm 1.5-ml microcentrifuge tube. Cells were washed a total of four times to remove all catalase. For each wash, the sample was centrifuged at 14,000 rpm for 2 min, 980 μl of medium was removed, and the cell pellet was resuspended with 980 μl fresh warm media. Washed cells were used to inoculate a bioreactor to an OD600 of 0.025. The bioreactor consisted of 10 ml medium in a 50-ml Falcon tube with a sterile magnetic stirring bar (0.5 in.) and immersed in a 37°C stirred water bath (∼400-rpm stirring), and it was used in previous studies (29–33).
Where applicable, H2O2 was added just prior to inoculation with cells by adding 10 μl of the appropriate stock to reach the desired final concentration (e.g., 10 μl of 10 mM H2O2 to reach 10 μM H2O2). Time 0 H2O2 concentration measurements were taken before the addition of cells to allow for an initial measurement. Immediately after inoculation, 6.95 μl of 72 mM DPTA in 10 mM NaOH was added to reach the desired concentration. For assays without NO·, 6.95 μl of 10 mM NaOH was added. At each time point, 150 μl was sampled and sterile filtered (0.22-μm syringe filter) for H2O2 measurement. For samples containing only NO·, 150 μl was discarded at each time point to maintain consistent volumes across samples.
CFU assays.
Cultures were grown and washed identically to the method for the NO· and H2O2 consumption assays and used to inoculate a bioreactor. For CFU assays, DPTA and/or H2O2 were added following inoculation, so a time 0− (untreated) point could be sampled prior to stress. Time 0− samples, as well as samples from different times following treatment, were washed and plated using a serial dilution method. Washing consisted of removing 200 μl to a 1.5-ml microcentrifuge tube followed by centrifuging for 3 min at 15,000 rpm. The cell pellet was washed by discarding 180 μl supernatant and resuspending the pellet with 980 μl PBS. The sample was centrifuged again, and 980 μl supernatant was discarded. The pellet was resuspended a final time with 80 μl PBS, serially diluted in PBS, and plated on LB-agar plates containing 25 mM pyruvate to scavenge any residual H2O2. Plates were incubated for 16 h at 37°C before colonies were counted.
GFP fluorescence measurements.
Green fluorescence was quantified on a per-cell basis using an LSR II flow cytometer (BD Biosciences, San Jose, CA) using 488-nm excitation and a 525/20 bandpass filter. Data were acquired using FACSDiva software (BD Biosciences, San Jose, CA). Prior to measurement, cells were fixed using paraformaldehyde (PFA). The fixation protocol consisted of removing 200 μl of cell culture to a 1.5-ml microcentrifuge tube, centrifuging at 15,000 rpm for 3 min, and replacing 180 μl of supernatant with 180 μl of 4% PFA in PBS. After 25 min at room temperature, cells were centrifuged again, 180 μl of supernatant was removed, and 480 μl of PBS was used to resuspend the cell pellet. Fixed cells were stored at 4°C until analysis by flow cytometry. For data presentation and statistical analyses, the median fluorescence values of the entire population were used.
Φ(Hmp-GFP) preexpression assay.
A low-copy-number plasmid bearing an isopropyl-β-d-thiogalactopyranoside (IPTG)-inducible translationally fused Φ(Hmp-GFP), pUA66 T5p-Φ(hmp-gfpsf) lacIq (pWCKA1) (30), was transformed into a cured Δhmp mutant to eliminate NO·-induced hmp expression. Strains were grown identically to the procedures of the NO· and H2O2 consumption assays, except that 30 μg/ml kanamycin (KAN) was included in all steps for plasmid retention. When the OD600 reached 0.2, the culture was induced with 20 μM IPTG. After 15 min of induction, 100 μg/ml of chloramphenicol (CAM) was added to prevent further translation. Washing was performed identically to the method described for the NO· and H2O2 consumption assays, except that 30 μg/ml KAN and 100 μg/ml CAM were included in all wash steps. Meanwhile, the bioreactor containing 10 ml of M9 medium with 10 mM glucose was dosed with 50 μM DPTA, such that the cells were washed and inoculated to the bioreactor 10 min after dosing. The washed cells used to inoculate the bioreactor were fixed and used to quantify Φ(Hmp-GFP) levels via fluorescence.
GFP reporter assays and gfp transcript measurement.
Transcriptional reporter plasmids (pUA66 hmpp-gfpmut2 [pWCKA05] [30], pUA66 hmpptrunc-gfpmut2 [pWCKA06; this work], and pUA66 katGp-gfpmut2 [pWCKA07] [76]) were transformed into cured Δhmp cells. Cells lacking hmp were used to obtain identical NO· dynamics throughout the assay. Cultures were grown and washed by a method identical to the method for the NO· and H2O2 consumption assays, except for the inclusion of 30 μg/ml KAN for plasmid retention, and used to inoculate a bioreactor containing 0 or 30 μM H2O2. Samples were then quickly treated with 50 μM DPTA or 6.95 μM NaOH (solvent that was added with DPTA). GFP levels were quantified as described above, with the time zero point being fixed from the washed cells prior to inoculation into the bioreactor. Samples were treated with RNAprotect bacterial reagent as described below in the case of the accompanying transcript measurements for the hmp reporter assay, with time zero being sampled from the 0 μM H2O2 bioreactor prior to dosing with DPTA and an equivalent volume being discarded from the 30 μM H2O2 bioreactor for consistency. For both GFP and transcript level measurements, the time zero point is therefore identical across samples in a replicate, since identical cells were used to inoculate multiple bioreactors.
qPCR.
Real-time quantitative PCR (qPCR) was performed as described previously (30). Briefly, 1 ml of RNAprotect bacterial reagent (Qiagen) was used to stabilize 500 μl of culture according to the manufacturer’s instructions. Stabilized cell pellets were stored at −80°C until all samples could be purified simultaneously. RNA was purified using the RNeasy minikit (Qiagen) according to the manufacturer’s instructions with on-column DNase digestion using RNase-free DNase I (Qiagen). To account for variations in RNA loss during processing, 50 μg of an external mRNA standard was spiked into each of the samples prior to purification. Preparation of the external standard was described previously (30, 77, 78). Briefly, phzM from Pseudomonas aeruginosa PAO1 was synthetically transcribed off linearized pET-11a-phzM using the T7 high-yield synthesis kit (NEB) and purified using the RNeasy minikit (Qiagen) with on-column DNase digestion.
Purified mRNA was converted to cDNA using TaqMan reverse transcription reagents (ThermoFisher Scientific) according to the manufacturer’s instructions, using a 10-μl reaction volume (3.85 μl purified RNA) and random hexamers. Controls lacking reverse transcriptase were included to determine if there was any DNA contamination. After conversion to cDNA, samples were stored at −20°C until the real-time PCR could be performed. Real-time PCR was performed using the Power SYBR green PCR master mix (Applied Biosystems) in an optical 96-well plate, using 20-μl reaction volumes that included 10 μl Power SYBR green PCR master mix, 1 μl cDNA, and 250 μM (each) forward and reverse primers (Table S2), balanced with RNase-free water. Each sample was prepared with phzM and gfp primers in separate wells to quantify individual phzM and gfp concentrations. Standard curves were included that consisted of serial dilutions of pET-11a-phzM (with phzM primers) or the plasmid encoding gfp (with gfp primers) to allow for absolute quantification of mRNA levels. The plate was run for 40 PCR cycles in an ABI 7900 HT real-time thermocycler, and threshold cycle (CT) values were obtained from amplification curves using SDS 2.3 software. All samples were normalized by phzM concentration.
Model construction and parameter optimization.
Preexisting NO· (30) and H2O2 (34) models were combined, with a few minor changes: the superoxide dismutase (SOD) reaction, as well as reactions of tryptophan and cysteine with hydroxyl radical described in reference 30, were replaced with those from reference 34. The periplasmic SOD reaction (30) was removed because the model developed here does not include the periplasmic compartment, and it was replaced with the two cytoplasmic SOD enzymes (34). Reaction of tryptophan and cysteine with ·OH was changed from generating dead-end metabolites (30) to be consistent with the formalism in reference 34, which modeled the reaction as destruction of amino acids. Additionally, KatG and Ahp production from reference 34 was split into transcription (H2O2 concentration-dependent Hill function with n = 1), translation, and mRNA degradation, as described in reference 30. For all transcription reactions, a basal transcription rate was added, as described in reference 32. The concentrations of all amino acids were held constant because the model did not include amino acid biosynthesis to replenish the amino acid pools. Even without any decrease in amino acid concentrations, this pathway did not represent a significant sink. Ferric and ferrous iron concentrations were held constant because their reactions did not represent major sinks for NO· or H2O2.
All uncertain parameters were trained on data by minimizing the variance-weighted sum of squared residuals (SSR) between model simulations and data, as described previously (32, 34). Parameter sets were compared using evidence ratios (ER), which represent model likelihoods compared to the best model identified, as described previously (32, 34). Models with an ER of >10 were discarded, which is a commonly used cutoff (32, 34, 79). Medium-specific model parameters related to NO· (NO· loss to the gas phase, kLaNO·; NO· autoxidation, kNO·-O2; rate of NO· dissociation from DPTA, kNONOate,DPTA) were trained on cell-free data of NO· for 2 h following addition of 50 μM DPTA. The spontaneous degradation rate of H2O2 was trained on H2O2 measurements for 30 min (10-min time points) following addition of 10, 20, and 30 μM H2O2 to cell-free M9 medium with 10 mM glucose. The gas phase transfer rate of O2 between media and the atmosphere (kLaO2) was trained on experimental measurements of [O2] within medium that was deficient in O2 due to prior pumping of N2 after being exposed to the atmosphere. Uncertain cellular parameters (29–32, 34) were trained on clearance of 50 μM DPTA by wild-type cells (NO· data) and clearance of 10, 20, and 30 μM H2O2 by wild-type, ΔkatE, and ΔkatG strains (H2O2 data) (Fig. S4). Previous work suggested that clearance by single ΔkatE and ΔkatG catalase mutants is required while fitting uncertain cellular parameters to generate models with consistent detoxification distributions among the major H2O2 detox pathways (34).
Uncertain cell-free parameters were categorized into groups based on the chemical species (e.g., O2, H2O2, and NO·) they affected. Each group of parameters was optimized from 100 random initial values. ER of the optimized values were calculated, and those with an ER of <10 were used as initial points for 10,000 iterations of a Markov chain Monte Carlo (MCMC) process to further explore the parameter space (80). Of note, after 100 optimizations, all the optimized values of parameters responsible for O2 and H2O2 cell-free kinetics had an ER close to 1. Therefore, 5 sets of optimized parameter values were chosen randomly from the O2 and H2O2 groups, and the sole optimized parameter set for the NO· group with an ER of <10 was used as initial conditions for the subsequent MCMC optimization. After the completion of the MCMC algorithm, ER of the accepted values was calculated, and those with an ER of <10 were retained.
Uncertain cellular parameters were optimized from 50 random initial parameter sets to account for the nonlinear nature of the optimization. During each of these optimizations, the values of cell-free parameters were randomly assigned from the ensembles of possible parameter values obtained from MCMC. Among the 50 optimized parameter sets, 4 had an ER of less than 10, and these models were individually used as the starting point for 10,000 iterations of MCMC exploration. After the MCMC process, 2,208 accepted parameter sets had an ER of <10 from the total of 40,000 iterations. All of these models accurately captured cellular responses to the NO·- and H2O2-only stress conditions (Fig. S4) and predicted similar flux predictions through the different NO· and H2O2 detoxification systems (Fig. 2). Simulations of NO· and H2O2 cotreatment did not agree with experimental data (Fig. S8), which suggested that interactions were missing from the combined model and knowledge base that it was built from. To evaluate the possible effects of H2O2 on different facets of the NO· detoxification pathway, namely, hmp transcription and translation, Hmp catalysis, and reducing agent availability, parameter values governing these cellular processes were manually changed in the best-fit model such that the resulting model was able to approximate NO· data under simultaneous NO· and H2O2 treatment (Fig. S7).
Black-box modeling.
Using the best model obtained from the previous section, simulation of cell-free NO· release, resulting from addition of 50 μM DPTA to fresh media, was performed by setting the cell fraction parameter to 0. Between each time point of the experimental data, cell-free simulation was performed to calculate the amount of NO· released by DPTA while accounting for the loss of NO· through gas-phase transfer and autoxidation. The difference between the experimental data and simulation results was treated as black-box consumption by the cells. This procedure was carried out for every time point of the experimental data to calculate the cumulative consumption of NO· by cells. This was done because the combined model was missing interactions that were needed to predict the impact of H2O2 on NO· detoxification. The resulting cumulative NO· consumption curves (Fig. 1C) depict 2 distinct regimes of NO· consumption under cotreatment conditions. The rate of NO· clearance in each of these regimes was quantified as the slope of the fitted line through the linear portion of data (Fig. S19). The number of data points used for linear fitting was determined by maximizing the number of points used while ensuring that the addition of data points did not significantly increase the SSR.
Statistical analysis.
Statistical significance was assessed using two-tailed t tests with unequal variances. Statistically different values were defined as having a P value less than 0.05.
Supplementary Material
ACKNOWLEDGMENTS
We thank the National BioResource Project (National Institute of Genetics, Japan) for its support of the distribution of the Keio Collection. We thank Christina J. DeCoste, John Grady, and the Flow Cytometry Resource Facility for assistance with flow cytometry experiments. Parameter optimizations were performed using the Terascale Infrastructure for Groundbreaking Research in Science and Engineering (TIGRESS) high-performance computer center at Princeton University, which is jointly supported by the Princeton Institute for Computational Science and Engineering (PICSciE) and the Princeton University Office of Information Technology’s Research Computing department. In addition, we thank Jonathan Robinson, Joshua Rabinowitz, Stanislav Shvartsman, and José Avalos for their suggestions on this project. We also thank Elliot Horlick for his assistance on this project.
This work was supported by National Science Foundation grant CBET-1453325, the Forese Family Fund for Innovation, and the generosity of Helen Shipley Hunt *71 through a Focused Research Team award.
The funders had no role in the preparation of the manuscript or decision to publish, and this content is solely the responsibility of the authors and does not necessarily represent the views of the funding agencies. We have no conflicts of interest to declare.
Footnotes
Supplemental material for this article may be found at https://doi.org/10.1128/JB.00081-19.
REFERENCES
- 1.Diacovich L, Gorvel JP. 2010. Bacterial manipulation of innate immunity to promote infection. Nat Rev Microbiol 8:117–128. doi: 10.1038/nrmicro2295. [DOI] [PubMed] [Google Scholar]
- 2.Fang FC. 2004. Antimicrobial reactive oxygen and nitrogen species: concepts and controversies. Nat Rev Microbiol 2:820–832. doi: 10.1038/nrmicro1004. [DOI] [PubMed] [Google Scholar]
- 3.Flannagan RS, Cosio G, Grinstein S. 2009. Antimicrobial mechanisms of phagocytes and bacterial evasion strategies. Nat Rev Microbiol 7:355–366. doi: 10.1038/nrmicro2128. [DOI] [PubMed] [Google Scholar]
- 4.Seaver LC, Imlay JA. 2001. Alkyl hydroperoxide reductase is the primary scavenger of endogenous hydrogen peroxide in Escherichia coli. J Bacteriol 183:7173–7181. doi: 10.1128/JB.183.24.7173-7181.2001. [DOI] [PMC free article] [PubMed] [Google Scholar]
- 5.Denicola A, Souza JM, Radi R, Lissi E. 1996. Nitric oxide diffusion in membranes determined by fluorescence quenching. Arch Biochem Biophys 328:208–212. doi: 10.1006/abbi.1996.0162. [DOI] [PubMed] [Google Scholar]
- 6.Robinson JL, Adolfsen KJ, Brynildsen MP. 2014. Deciphering nitric oxide stress in bacteria with quantitative modeling. Curr Opin Microbiol 19:16–24. doi: 10.1016/j.mib.2014.05.018. [DOI] [PMC free article] [PubMed] [Google Scholar]
- 7.Stevanin TM, Poole RK, Demoncheaux EA, Read RC. 2002. Flavohemoglobin Hmp protects Salmonella enterica serovar typhimurium from nitric oxide-related killing by human macrophages. Infect Immun 70:4399–4405. doi: 10.1128/IAI.70.8.4399-4405.2002. [DOI] [PMC free article] [PubMed] [Google Scholar]
- 8.Richardson AR, Dunman PM, Fang FC. 2006. The nitrosative stress response of Staphylococcus aureus is required for resistance to innate immunity. Mol Microbiol 61:927–939. doi: 10.1111/j.1365-2958.2006.05290.x. [DOI] [PubMed] [Google Scholar]
- 9.Shimizu T, Tsutsuki H, Matsumoto A, Nakaya H, Noda M. 2012. The nitric oxide reductase of enterohaemorrhagic Escherichia coli plays an important role for the survival within macrophages. Mol Microbiol 85:492–512. doi: 10.1111/j.1365-2958.2012.08122.x. [DOI] [PubMed] [Google Scholar]
- 10.Darwin KH, Ehrt S, Gutierrez-Ramos JC, Weich N, Nathan CF. 2003. The proteasome of Mycobacterium tuberculosis is required for resistance to nitric oxide. Science 302:1963–1966. doi: 10.1126/science.1091176. [DOI] [PubMed] [Google Scholar]
- 11.Cosgrove K, Coutts G, Jonsson IM, Tarkowski A, Kokai-Kun JF, Mond JJ, Foster SJ. 2007. Catalase (KatA) and alkyl hydroperoxide reductase (AhpC) have compensatory roles in peroxide stress resistance and are required for survival, persistence, and nasal colonization in Staphylococcus aureus. J Bacteriol 189:1025–1035. doi: 10.1128/JB.01524-06. [DOI] [PMC free article] [PubMed] [Google Scholar]
- 12.Hebrard M, Viala JP, Meresse S, Barras F, Aussel L. 2009. Redundant hydrogen peroxide scavengers contribute to Salmonella virulence and oxidative stress resistance. J Bacteriol 191:4605–4614. doi: 10.1128/JB.00144-09. [DOI] [PMC free article] [PubMed] [Google Scholar]
- 13.Manca C, Paul S, Barry CE III, Freedman VH, Kaplan G. 1999. Mycobacterium tuberculosis catalase and peroxidase activities and resistance to oxidative killing in human monocytes in vitro. Infect Immun 67:74–79. [DOI] [PMC free article] [PubMed] [Google Scholar]
- 14.Vazquez-Torres A, Jones-Carson J, Mastroeni P, Ischiropoulos H, Fang FC. 2000. Antimicrobial actions of the NADPH phagocyte oxidase and inducible nitric oxide synthase in experimental salmonellosis. I. Effects on microbial killing by activated peritoneal macrophages in vitro. J Exp Med 192:227–236. doi: 10.1084/jem.192.2.227. [DOI] [PMC free article] [PubMed] [Google Scholar]
- 15.Carreras MC, Pargament GA, Catz SD, Poderoso JJ, Boveris A. 1994. Kinetics of nitric oxide and hydrogen peroxide production and formation of peroxynitrite during the respiratory burst of human neutrophils. FEBS Lett 341:65–68. doi: 10.1016/0014-5793(94)80241-6. [DOI] [PubMed] [Google Scholar]
- 16.MacMicking J, Xie QW, Nathan C. 1997. Nitric oxide and macrophage function. Annu Rev Immunol 15:323–350. doi: 10.1146/annurev.immunol.15.1.323. [DOI] [PubMed] [Google Scholar]
- 17.Yadav R, Samuni Y, Abramson A, Zeltser R, Casap N, Kabiraj TK, L Banach M, Samuni U. 2014. Pro-oxidative synergic bactericidal effect of NO: kinetics and inhibition by nitroxides. Free Radic Biol Med 67:248–254. doi: 10.1016/j.freeradbiomed.2013.10.012. [DOI] [PubMed] [Google Scholar]
- 18.Pacelli R, Wink DA, Cook JA, Krishna MC, DeGraff W, Friedman N, Tsokos M, Samuni A, Mitchell JB. 1995. Nitric oxide potentiates hydrogen peroxide-induced killing of Escherichia coli. J Exp Med 182:1469–1479. doi: 10.1084/jem.182.5.1469. [DOI] [PMC free article] [PubMed] [Google Scholar]
- 19.Gusarov I, Nudler E. 2005. NO-mediated cytoprotection: instant adaptation to oxidative stress in bacteria. Proc Natl Acad Sci U S A 102:13855–13860. doi: 10.1073/pnas.0504307102. [DOI] [PMC free article] [PubMed] [Google Scholar]
- 20.Woodmansee AN, Imlay JA. 2003. A mechanism by which nitric oxide accelerates the rate of oxidative DNA damage in Escherichia coli. Mol Microbiol 49:11–22. doi: 10.1046/j.1365-2958.2003.03530.x. [DOI] [PubMed] [Google Scholar]
- 21.Baptista JM, Justino MC, Melo AM, Teixeira M, Saraiva LM. 2012. Oxidative stress modulates the nitric oxide defense promoted by Escherichia coli flavorubredoxin. J Bacteriol 194:3611–3617. doi: 10.1128/JB.00140-12. [DOI] [PMC free article] [PubMed] [Google Scholar]
- 22.Toledo JC Jr, Augusto O. 2012. Connecting the chemical and biological properties of nitric oxide. Chem Res Toxicol 25:975–989. doi: 10.1021/tx300042g. [DOI] [PubMed] [Google Scholar]
- 23.Winterbourn CC, Hampton MB, Livesey JH, Kettle AJ. 2006. Modeling the reactions of superoxide and myeloperoxidase in the neutrophil phagosome: implications for microbial killing. J Biol Chem 281:39860–39869. doi: 10.1074/jbc.M605898200. [DOI] [PubMed] [Google Scholar]
- 24.Mishra S, Imlay J. 2012. Why do bacteria use so many enzymes to scavenge hydrogen peroxide? Arch Biochem Biophys 525:145–160. doi: 10.1016/j.abb.2012.04.014. [DOI] [PMC free article] [PubMed] [Google Scholar]
- 25.Gardner PR, Gardner AM, Martin LA, Salzman AL. 1998. Nitric oxide dioxygenase: an enzymic function for flavohemoglobin. Proc Natl Acad Sci U S A 95:10378–10383. doi: 10.1073/pnas.95.18.10378. [DOI] [PMC free article] [PubMed] [Google Scholar]
- 26.Gardner AM, Helmick RA, Gardner PR. 2002. Flavorubredoxin, an inducible catalyst for nitric oxide reduction and detoxification in Escherichia coli. J Biol Chem 277:8172–8177. doi: 10.1074/jbc.M110471200. [DOI] [PubMed] [Google Scholar]
- 27.Poock SR, Leach ER, Moir JW, Cole JA, Richardson DJ. 2002. Respiratory detoxification of nitric oxide by the cytochrome c nitrite reductase of Escherichia coli. J Biol Chem 277:23664–23669. doi: 10.1074/jbc.M200731200. [DOI] [PubMed] [Google Scholar]
- 28.Gough DR, Cotter TG. 2011. Hydrogen peroxide: a Jekyll and Hyde signalling molecule. Cell Death Dis 2:e213. doi: 10.1038/cddis.2011.96. [DOI] [PMC free article] [PubMed] [Google Scholar]
- 29.Robinson JL, Brynildsen MP. 2013. A kinetic platform to determine the fate of nitric oxide in Escherichia coli. PLoS Comput Biol 9:e1003049. doi: 10.1371/journal.pcbi.1003049. [DOI] [PMC free article] [PubMed] [Google Scholar]
- 30.Robinson JL, Brynildsen MP. 2015. An ensemble-guided approach identifies ClpP as a major regulator of transcript levels in nitric oxide-stressed Escherichia coli. Metab Eng 31:22–34. doi: 10.1016/j.ymben.2015.06.005. [DOI] [PubMed] [Google Scholar]
- 31.Robinson JL, Miller RV, Brynildsen MP. 2014. Model-driven identification of dosing regimens that maximize the antimicrobial activity of nitric oxide. Metab Eng Commun 1:12–18. doi: 10.1016/j.meteno.2014.08.001. [DOI] [PMC free article] [PubMed] [Google Scholar]
- 32.Robinson JL, Brynildsen MP. 2016. Discovery and dissection of metabolic oscillations in the microaerobic nitric oxide response network of Escherichia coli. Proc Natl Acad Sci U S A 113:E1757–E1766. doi: 10.1073/pnas.1521354113. [DOI] [PMC free article] [PubMed] [Google Scholar]
- 33.Robinson JL, Brynildsen MP. 2016. Construction and experimental validation of a quantitative kinetic model of nitric oxide stress in enterohemorrhagic Escherichia coli O157:H7. Bioengineering (Basel) 3:9. doi: 10.3390/bioengineering3010009. [DOI] [PMC free article] [PubMed] [Google Scholar]
- 34.Adolfsen KJ, Brynildsen MP. 2015. A kinetic platform to determine the fate of hydrogen peroxide in Escherichia coli. PLoS Comput Biol 11:e1004562. doi: 10.1371/journal.pcbi.1004562. [DOI] [PMC free article] [PubMed] [Google Scholar]
- 35.Sacco SA, Adolfsen KJ, Brynildsen MP. 27 April 2017. An integrated network analysis identifies how ArcAB enables metabolic oscillations in the nitric oxide detoxification network of Escherichia coli. Biotechnol J doi: 10.1002/biot.201600570. [DOI] [PubMed] [Google Scholar]
- 36.Gorke B, Stulke J. 2008. Carbon catabolite repression in bacteria: many ways to make the most out of nutrients. Nat Rev Microbiol 6:613–624. doi: 10.1038/nrmicro1932. [DOI] [PubMed] [Google Scholar]
- 37.Clark B, Holms WH. 1976. Control of the sequential utilization of glucose and fructose by Escherichia coli. J Gen Microbiol 96:191–201. doi: 10.1099/00221287-95-2-191. [DOI] [PubMed] [Google Scholar]
- 38.Bachi B, Kornberg HL. 1975. Utilization of gluconate by Escherichia coli. A role of adenosine 3':5'-cyclic monophosphate in the induction of gluconate catabolism. Biochem J 150:123–128. doi: 10.1042/bj1500123. [DOI] [PMC free article] [PubMed] [Google Scholar]
- 39.Keseler IM, Mackie A, Santos-Zavaleta A, Billington R, Bonavides-Martínez C, Caspi R, Fulcher C, Gama-Castro S, Kothari A, Krummenacker M, Latendresse M, Muñiz-Rascado L, Ong Q, Paley S, Peralta-Gil M, Subhraveti P, Velázquez-Ramírez DA, Weaver D, Collado-Vides J, Paulsen I, Karp PD. 2017. The EcoCyc database: reflecting new knowledge about Escherichia coli K-12. Nucleic Acids Res 45:D543–D550. doi: 10.1093/nar/gkw1003. [DOI] [PMC free article] [PubMed] [Google Scholar]
- 40.Stevanin TM, Ioannidis N, Mills CE, Kim SO, Hughes MN, Poole RK. 2000. Flavohemoglobin Hmp affords inducible protection for Escherichia coli respiration, catalyzed by cytochromes bo' or bd, from nitric oxide. J Biol Chem 275:35868–35875. doi: 10.1074/jbc.M002471200. [DOI] [PubMed] [Google Scholar]
- 41.Gardner AM, Martin LA, Gardner PR, Dou Y, Olson JS. 2000. Steady-state and transient kinetics of Escherichia coli nitric-oxide dioxygenase (flavohemoglobin). The B10 tyrosine hydroxyl is essential for dioxygen binding and catalysis. J Biol Chem 275:12581–12589. doi: 10.1074/jbc.275.17.12581. [DOI] [PubMed] [Google Scholar]
- 42.Poole LB, Ellis HR. 1996. Flavin-dependent alkyl hydroperoxide reductase from Salmonella typhimurium. 1. Purification and enzymatic activities of overexpressed AhpF and AhpC proteins. Biochemistry 35:56–64. doi: 10.1021/bi951887s. [DOI] [PubMed] [Google Scholar]
- 43.Bennett BD, Kimball EH, Gao M, Osterhout R, Van Dien SJ, Rabinowitz JD. 2009. Absolute metabolite concentrations and implied enzyme active site occupancy in Escherichia coli. Nat Chem Biol 5:593–599. doi: 10.1038/nchembio.186. [DOI] [PMC free article] [PubMed] [Google Scholar]
- 44.de Graef MR, Alexeeva S, Snoep JL, Teixeira de Mattos MJ. 1999. The steady-state internal redox state (NADH/NAD) reflects the external redox state and is correlated with catabolic adaptation in Escherichia coli. J Bacteriol 181:2351–2357. [DOI] [PMC free article] [PubMed] [Google Scholar]
- 45.Loewen PC, Switala J, Triggs-Raine BL. 1985. Catalases HPI and HPII in Escherichia coli are induced independently. Arch Biochem Biophys 243:144–149. doi: 10.1016/0003-9861(85)90782-9. [DOI] [PubMed] [Google Scholar]
- 46.Membrillo-Hernandez J, Coopamah MD, Channa A, Hughes MN, Poole RK. 1998. A novel mechanism for upregulation of the Escherichia coli K-12 hmp (flavohaemoglobin) gene by the “NO releaser,” S-nitrosoglutathione: nitrosation of homocysteine and modulation of MetR binding to the glyA-hmp intergenic region. Mol Microbiol 29:1101–1112. doi: 10.1046/j.1365-2958.1998.01000.x. [DOI] [PubMed] [Google Scholar]
- 47.Bodenmiller DM, Spiro S. 2006. The yjeB (nsrR) gene of Escherichia coli encodes a nitric oxide-sensitive transcriptional regulator. J Bacteriol 188:874–881. doi: 10.1128/JB.188.3.874-881.2006. [DOI] [PMC free article] [PubMed] [Google Scholar]
- 48.Partridge JD, Bodenmiller DM, Humphrys MS, Spiro S. 2009. NsrR targets in the Escherichia coli genome: new insights into DNA sequence requirements for binding and a role for NsrR in the regulation of motility. Mol Microbiol 73:680–694. doi: 10.1111/j.1365-2958.2009.06799.x. [DOI] [PubMed] [Google Scholar]
- 49.D'Autreaux B, Touati D, Bersch B, Latour JM, Michaud-Soret I. 2002. Direct inhibition by nitric oxide of the transcriptional ferric uptake regulation protein via nitrosylation of the iron. Proc Natl Acad Sci U S A 99:16619–16624. doi: 10.1073/pnas.252591299. [DOI] [PMC free article] [PubMed] [Google Scholar]
- 50.Cruz-Ramos H, Crack J, Wu G, Hughes MN, Scott C, Thomson AJ, Green J, Poole RK. 2002. NO sensing by FNR: regulation of the Escherichia coli NO-detoxifying flavohaemoglobin, Hmp. EMBO J 21:3235–3244. doi: 10.1093/emboj/cdf339. [DOI] [PMC free article] [PubMed] [Google Scholar]
- 51.Poole RK, Anjum MF, Membrillo-Hernandez J, Kim SO, Hughes MN, Stewart V. 1996. Nitric oxide, nitrite, and Fnr regulation of hmp (flavohemoglobin) gene expression in Escherichia coli K-12. J Bacteriol 178:5487–5492. doi: 10.1128/jb.178.18.5487-5492.1996. [DOI] [PMC free article] [PubMed] [Google Scholar]
- 52.Hao Y, Updegrove TB, Livingston NN, Storz G. 2016. Protection against deleterious nitrogen compounds: role of sigmaS-dependent small RNAs encoded adjacent to sdiA. Nucleic Acids Res 44:6935–6948. doi: 10.1093/nar/gkw404. [DOI] [PMC free article] [PubMed] [Google Scholar]
- 53.Hoerter JD, Arnold AA, Ward CS, Sauer M, Johnson S, Fleming T, Eisenstark A. 2005. Reduced hydroperoxidase (HPI and HPII) activity in the Deltafur mutant contributes to increased sensitivity to UVA radiation in Escherichia coli. J Photochem Photobiol B 79:151–157. doi: 10.1016/j.jphotobiol.2005.01.003. [DOI] [PubMed] [Google Scholar]
- 54.Constantinidou C, Hobman JL, Griffiths L, Patel MD, Penn CW, Cole JA, Overton TW. 2006. A reassessment of the FNR regulon and transcriptomic analysis of the effects of nitrate, nitrite, NarXL, and NarQP as Escherichia coli K12 adapts from aerobic to anaerobic growth. J Biol Chem 281:4802–4815. doi: 10.1074/jbc.M512312200. [DOI] [PubMed] [Google Scholar]
- 55.Tartaglia LA, Storz G, Ames BN. 1989. Identification and molecular analysis of oxyR-regulated promoters important for the bacterial adaptation to oxidative stress. J Mol Biol 210:709–719. doi: 10.1016/0022-2836(89)90104-6. [DOI] [PubMed] [Google Scholar]
- 56.Crawford MA, Henard CA, Tapscott T, Porwollik S, McClelland M, Vazquez-Torres A. 2016. DksA-dependent transcriptional regulation in Salmonella experiencing nitrosative stress. Front Microbiol 7:444. doi: 10.3389/fmicb.2016.00444. [DOI] [PMC free article] [PubMed] [Google Scholar]
- 57.Henard CA, Tapscott T, Crawford MA, Husain M, Doulias PT, Porwollik S, Liu L, McClelland M, Ischiropoulos H, Vazquez-Torres A. 2014. The 4-cysteine zinc-finger motif of the RNA polymerase regulator DksA serves as a thiol switch for sensing oxidative and nitrosative stress. Mol Microbiol 91:790–804. doi: 10.1111/mmi.12498. [DOI] [PMC free article] [PubMed] [Google Scholar]
- 58.Henard CA, Bourret TJ, Song M, Vazquez-Torres A. 2010. Control of redox balance by the stringent response regulatory protein promotes antioxidant defenses of Salmonella. J Biol Chem 285:36785–36793. doi: 10.1074/jbc.M110.160960. [DOI] [PMC free article] [PubMed] [Google Scholar]
- 59.Kim JS, Liu L, Fitzsimmons LF, Wang Y, Crawford MA, Mastrogiovanni M, Trujillo M, Till JKA, Radi R, Dai S, Vazquez-Torres A. 2018. DksA-DnaJ redox interactions provide a signal for the activation of bacterial RNA polymerase. Proc Natl Acad Sci U S A 115:E11780–E11789. doi: 10.1073/pnas.1813572115. [DOI] [PMC free article] [PubMed] [Google Scholar]
- 60.Chou WK, Brynildsen MP. 2019. Loss of DksA leads to multi-faceted impairment of nitric oxide detoxification by Escherichia coli. Free Radic Biol Med 130:288–296. doi: 10.1016/j.freeradbiomed.2018.10.435. [DOI] [PubMed] [Google Scholar]
- 61.Baba T, Ara T, Hasegawa M, Takai Y, Okumura Y, Baba M, Datsenko KA, Tomita M, Wanner BL, Mori H. 2006. Construction of Escherichia coli K-12 in-frame, single-gene knockout mutants: the Keio collection. Mol Syst Biol 2:2006.0008. [DOI] [PMC free article] [PubMed] [Google Scholar]
- 62.Joyce AR, Reed JL, White A, Edwards R, Osterman A, Baba T, Mori H, Lesely SA, Palsson BO, Agarwalla S. 2006. Experimental and computational assessment of conditionally essential genes in Escherichia coli. J Bacteriol 188:8259–8271. doi: 10.1128/JB.00740-06. [DOI] [PMC free article] [PubMed] [Google Scholar]
- 63.Potrykus K, Murphy H, Philippe N, Cashel M. 2011. ppGpp is the major source of growth rate control in E. coli. Environ Microbiol 13:563–575. doi: 10.1111/j.1462-2920.2010.02357.x. [DOI] [PMC free article] [PubMed] [Google Scholar]
- 64.Brown L, Gentry D, Elliott T, Cashel M. 2002. DksA affects ppGpp induction of RpoS at a translational level. J Bacteriol 184:4455–4465. doi: 10.1128/JB.184.16.4455-4465.2002. [DOI] [PMC free article] [PubMed] [Google Scholar]
- 65.de Lorenzo V, Loza-Tavera H. 2011. Microbial bioremediation of chemical pollutants: how bacteria cope with multi-stress environmental scenarios, p 481–492. In Storz G, Hengge R (ed), Bacterial stress responses, 2nd ed American Society for Microbiology, Washington, DC. [Google Scholar]
- 66.Almeida JR, Modig T, Petersson A, Hähn-Hägerdal B, Lidén G, Gorwa-Grauslund MF. 2007. Increased tolerance and conversion of inhibitors in lignocellulosic hydrolysates by Saccharomyces cerevisiae. J Chem Technol Biotechnol 82:340–349. doi: 10.1002/jctb.1676. [DOI] [Google Scholar]
- 67.Jonsson LJ, Alriksson B, Nilvebrant NO. 2013. Bioconversion of lignocellulose: inhibitors and detoxification. Biotechnol Biofuels 6:16. doi: 10.1186/1754-6834-6-16. [DOI] [PMC free article] [PubMed] [Google Scholar]
- 68.Unden G, Bongaerts J. 1997. Alternative respiratory pathways of Escherichia coli: energetics and transcriptional regulation in response to electron acceptors. Biochim Biophys Acta 1320:217–234. doi: 10.1016/S0005-2728(97)00034-0. [DOI] [PubMed] [Google Scholar]
- 69.Seaver LC, Imlay JA. 2001. Hydrogen peroxide fluxes and compartmentalization inside growing Escherichia coli. J Bacteriol 183:7182–7189. doi: 10.1128/JB.183.24.7182-7189.2001. [DOI] [PMC free article] [PubMed] [Google Scholar]
- 70.Wu G, Corker H, Orii Y, Poole RK. 2004. Escherichia coli Hmp, an “oxygen-binding flavohaemoprotein,” produces superoxide anion and self-destructs. Arch Microbiol 182:193–203. doi: 10.1007/s00203-004-0699-8. [DOI] [PubMed] [Google Scholar]
- 71.Membrillo-Hernandez J, Ioannidis N, Poole RK. 1996. The flavohaemoglobin (HMP) of Escherichia coli generates superoxide in vitro and causes oxidative stress in vivo. FEBS Lett 382:141–144. doi: 10.1016/0014-5793(96)00154-8. [DOI] [PubMed] [Google Scholar]
- 72.Stern AM, Liu B, Bakken LR, Shapleigh JP, Zhu J. 2013. A novel protein protects bacterial iron-dependent metabolism from nitric oxide. J Bacteriol 195:4702–4708. doi: 10.1128/JB.00836-13. [DOI] [PMC free article] [PubMed] [Google Scholar]
- 73.Zampieri M, Zimmermann M, Claassen M, Sauer U. 2017. Nontargeted metabolomics reveals the multilevel response to antibiotic perturbations. Cell Rep 19:1214–1228. doi: 10.1016/j.celrep.2017.04.002. [DOI] [PubMed] [Google Scholar]
- 74.Adolfsen KJ, Brynildsen MP. 2015. Futile cycling increases sensitivity toward oxidative stress in Escherichia coli. Metab Eng 29:26–35. doi: 10.1016/j.ymben.2015.02.006. [DOI] [PMC free article] [PubMed] [Google Scholar]
- 75.Amato SM, Orman MA, Brynildsen MP. 2013. Metabolic control of persister formation in Escherichia coli. Mol Cell 50:475–487. doi: 10.1016/j.molcel.2013.04.002. [DOI] [PubMed] [Google Scholar]
- 76.Zaslaver A, Bren A, Ronen M, Itzkovitz S, Kikoin I, Shavit S, Liebermeister W, Surette MG, Alon U. 2006. A comprehensive library of fluorescent transcriptional reporters for Escherichia coli. Nat Methods 3:623–628. doi: 10.1038/nmeth895. [DOI] [PubMed] [Google Scholar]
- 77.Amato SM, Brynildsen MP. 2014. Nutrient transitions are a source of persisters in Escherichia coli biofilms. PLoS One 9:e93110. doi: 10.1371/journal.pone.0093110. [DOI] [PMC free article] [PubMed] [Google Scholar]
- 78.Amato SM, Brynildsen MP. 2015. Persister heterogeneity arising from a single metabolic stress. Curr Biol 25:2090–2098. doi: 10.1016/j.cub.2015.06.034. [DOI] [PubMed] [Google Scholar]
- 79.Uriarte M, Condit R, Canham CD, Hubbell SP. 2004. A spatially explicit model of sapling growth in a tropical forest: does the identity of neighbours matter? J Ecol 92:348–360. doi: 10.1111/j.0022-0477.2004.00867.x. [DOI] [Google Scholar]
- 80.Zamora-Sillero E, Hafner M, Ibig A, Stelling J, Wagner A. 2011. Efficient characterization of high-dimensional parameter spaces for systems biology. BMC Syst Biol 5:142. doi: 10.1186/1752-0509-5-142. [DOI] [PMC free article] [PubMed] [Google Scholar]
Associated Data
This section collects any data citations, data availability statements, or supplementary materials included in this article.