

Abstract
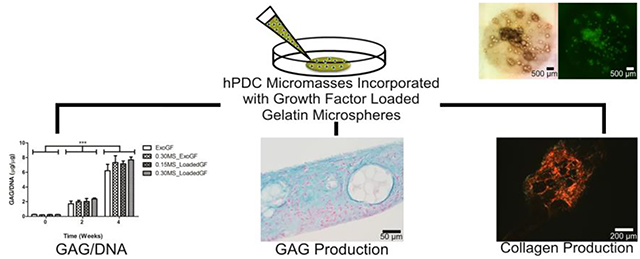
For cartilage tissue engineering, several in vitro culture methodologies have displayed potential for the chondrogenic differentiation of mesenchymal stem cells (MSCs). Micromasses, cell aggregates or pellets, and cell sheets are all structures with high cell density that provides for abundant cell-cell interactions, which have been demonstrated to be important for chondrogenesis. Recently, these culture systems have been improved via the incorporation of growth factor releasing components such as degradable microspheres within the structures, further enhancing chondrogenesis. Herein, we incorporated different amounts of gelatin microspheres releasing transforming growth factor β1 (TGF-β1) into micromasses composed of human periosteum derived cells (hPDCs), an MSC-like cell population. The aim of this research was to investigate chondrogenic stimulation by TGF-β1 delivery from these degradable microspheres in comparison to exogenous supplementation with TGF-β1 in the culture medium. Microscopy showed that the gelatin microspheres could be successfully incorporated within hPDC micromasses without interfering with the formation of the structure, while biochemical analysis and histology demonstrated increasing DNA content at week 2 and accumulation of glycosaminoglycan and collagen at weeks 2 and 4. Importantly, similar chondrogenesis was achieved when TGF-β1 was delivered from the microspheres compared to controls with TGF-β1 in the medium. Increasing the amount of growth factor within the micromasses by increasing the amount of microspheres added did not further improve chondrogenesis of the hPDCs. These findings demonstrate the potential of using cytokine releasing, gelatin microspheres to enhance the chondrogenic capabilities of hPDC micromasses as an alternative to supplementation of the culture medium with growth factors.
Keywords: gelatin microspheres, growth factor delivery, mesenchymal stem cells, high cell density culture, cartilage tissue engineering
Graphical Abstract
1. Introduction
Cartilage tissue engineering offers a promising therapeutic approach for joint surface repair and regeneration through the combination of cells, biomaterials, and/or bioactive factors. In this approach, the manner in which the cells are cultured plays an important part in determining the biological outcome. High density, aggregation-based culture methods such as pellets or micromasses have been shown to be valuable models of in vitro chondrogenesis [1–4]. These systems promote neo-cartilage formation by mimicking the in vivo process of cellular condensation during early cartilage development. The cell-cell interactions established during condensation of mesenchymal stem cells (MSCs) and their subsequent chondrogenic differentiation lead to activation and progressive down-regulation of N-cadherin [5], which is tightly controlled via the interplay between the Wnt signaling and MAP kinase pathways [3]. Moreover, when cultured in medium with transforming growth factor-β (TGF-β) superfamily members (e.g., bone morphogenetic proteins and/or TGF-βs), these dense in vitro condensation methods result in enhanced neo-cartilage formation due to the well-established chondro-stimulatory effects of these molecules [3, 4, 6].
Although promising for studying the chondrogenic process and for tissue engineering strategies, high density culture systems also have drawbacks. For instance, the neo-cartilage produced via pellet culturing is often heterogeneous in nature, with regions of undifferentiated or apoptotic and necrotic cells [7–9]. This is potentially due to diffusion limitations that prevent the stimulatory molecules from reaching the cells deeper within the pellet in addition to increased uptake of the growth factors by the cells at the surface [10–12]. In comparison, micromasses provide an alternate high density culture system that is user-friendly and addresses some of these limitations. For instance, they are formed via pipetting droplets comprised of a high cell density in a restricted area in a well plate forming a cell layer greater than confluency [13]. The resulting shape with one dimension much smaller than the others helps in circumventing the aforementioned diffusion limitations. First utilized by Ahrens et al. [13], micromasses have been used for the in vitro, sequential chondrogenic cellular differentiation and maturation of limb-bud MSCs [2] as well as bone marrow MSCs (BM-MSCs) [1, 14]. Furthermore, a recent comparison between micromasses and pellets demonstrated that the neo-cartilage produced via micromass culture was more homogenous and displayed decreased fibrocartilage-like and hypertrophic features [1]. The success of the micromass system with other chondrogenic progenitor cell types has made it an attractive culture system to study the in vitro chondrogenesis of human periosteum derived cells (hPDCs) [15]. Additionally, micromasses of hPDCs cultured in chondrogenic medium containing the Rho-kinase inhibitor Y27632 (ROCKi) remained attached to the well plate and displayed a more flattened overall 3D profile while maintaining similar glycosaminoglycan (GAG) production and a higher cellular metabolic activity when compared to micromasses cultured without ROCKi, which detached, adopted a pellet-like structure, and developed a necrotic core [16]. Micromasses of hPDCs treated with ROCKi have also shown increased gene expression for collagen type II [17].
PDCs are found in the inner cambium of the periosteum, a thin fibrous tissue layer surrounding long bones. The periosteum tissue as a whole has long been used for orthopedic tissue graft applications [18] and is US Food and Drug Administration (FDA) approved as a tissue flap for autologous chondrocyte implantation (ACI) surgeries. Similar to MSCs harvested from different tissue sources, such as BM-MSCs [19, 20], adipose tissue (AD-MSCs) [19], and the synovial membrane (SD-MSCs) [21], PDCs exhibit strong MSC-like multipotent characteristics at the single cell level [22, 23]. Of relevance for tissue engineering, PDCs are able to differentiate into the adipogenic, osteogenic, and chondrogenic lineages [22–26], can lead to bone formation when implanted in vivo [24, 26], and can produce cartilage in osteochondral defects [27]. When compared to BM-MSCs, AD-MSCs, and SD-MSCs, PDCs displayed one of the higher proliferative capacities along with the SD-MSCs and possessed the highest amount of progenitor cells when seeded at low densities [24–26]. Further, PDCs are an interesting cell source for cartilage tissue engineering due to their ease of isolation and expansion potential based on their stability in culture, which can be attributed to the presence of long telomeres [23, 28]. Additionally, adult hPDCs have been shown to be able to be expanded through 15 passages in vitro without losing their chondrogenic potential [15]. Our research group has demonstrated the in vitro and in vivo capabilities of hPDCs when cultured in 3D scaffolds [29, 30] as well as in densely populated micromasses cultured in medium containing different growth factors, including members of the TGF-β family [16]. In particular, in vitro treatment with TGF-β1 led to SOX-9 and collagen type II gene expression as well as GAG production by hPDCs, although at slightly lower levels than human articular chondrocytes cultured under the same conditions [27, 29, 31, 32].
To enhance the differentiation of high density MSC culture systems, such as cell sheets and pellets, researchers have integrated microsphere based growth factor delivery systems to circumvent the diffusion limitations and heterogeneity produced by these densely populated systems [33–35]. Further, these systems can provide extended release after a single administration. Naturally, growth factors act locally in an autocrine or paracrine manner, exhibit short-range diffusion through the extracellular matrix, and possess short half-lives [36]. These characteristics, in most cases, necessitate an increase in growth factor concentration in the culture medium to achieve desired outcomes, invariably decreasing the economic and clinical feasibility of this approach. By incorporating microsphere growth factor delivery systems, cells can be stimulated at the local level over a sustained period, and thus the need for exogenous stimulation in the culture medium is removed [37]. Microspheres act as an excellent delivery system due to the high surface area to volume ratio of their spherical geometry, which allows for the efficient sequestering and release of the growth factors.
Gelatin, a hydrolyzed form of collagen type I, is an attractive choice as a base material for microspheres to deliver growth factors. Gelatin is widely used in the food industry and in biomedical research and has been approved by the US FDA [38] as well as the Scientific Steering Committee (SSC) of the European Union [39]. Since it is a naturally derived biomaterial, gelatin contains cellular adhesion sites and can be degraded through the action of matrix metalloproteinases (MMPs). However, gelatin is known to melt at 37 °C and thus requires additional crosslinking to enhance its mechanical stability for drug release applications under physiological conditions. Genipin, derived from the fruit of the gardenia plant, crosslinks gelatin with minimal toxic residual products by forming covalent bonds between primary amine groups on the gelatin chains, thus leading to a crosslinked structure of intramolecular and short-range intermolecular bonds [40–42]. Furthermore, depending on its processing, gelatin possesses charged amino acid side chains that can form ionic complexes with other charged molecules. This feature allows loading of proteins and growth factors into gelatin-based systems [37, 43, 44].
Recently, self-assembled cell sheets and cell pellets of BM-MSCs incorporating TGF-β1 loaded gelatin microspheres displayed a more robust, homogenous neo-cartilage formation compared to the respective cell sheets and pellets without the incorporation of the gelatin microspheres [33, 34]. The growth factor release from the genipin crosslinked gelatin microspheres can be manipulated based on the degree of crosslinking and is dependent on the action of proteases. For instance, after 16 days in protease free cell culture medium, highly crosslinked (~68 %) microspheres displayed a release of only ~0.6% of the total loaded growth factor [34], whereas low crosslinked (~30 %) microspheres released only ~4 % of the total loaded TGF-β1, which indicated that the remaining growth factor was still attached to the microspheres via charge interactions [43]. Additionally, the degradation of the microspheres was inversely related to the degree of crosslinking. The lower crosslinked microspheres completely degraded after 7 days whereas the higher crosslinked microspheres still possessed ~50 % of their initial mass after 3 weeks in protease containing medium [34]. These characteristics provide a sustained stimulation within high density cultures. For example, the GAG production per sheet was significantly higher and more homogeneous in MSC cell sheets containing growth factor loaded microspheres than in control sheets receiving stimulation exogenously via the medium. Moreover, after 3 weeks of culture, the cell sheets with microspheres were significantly thicker than the control sheets and had a higher equilibrium compressive modulus than that of the control sheets, which could not be measured [34].
Therefore, the research herein aims to take advantage of the gelatin-based microsphere delivery system to enhance the chondrogenic stimulation of hPDC micromasses by providing sustained and localized presentation of TGF-β1. The objectives of this study were to test if the genipin crosslinked gelatin microspheres could be successfully integrated within the hPDC micromasses without disrupting their structure and to test the extent of chondrogenic differentiation that could be achieved via this growth factor delivery system compared to exogenous presentation in the culture medium.
2. Materials and Methods
2.1. Human Periosteum Derived Cell Isolation and Culture
Cells isolated from adult donors undergoing distraction osteogenesis were pooled as previously described [45]. The patients’ informed consent forms were obtained, and the procedures were approved by the Ethical Committee for Human Medical Research (KU Leuven). Briefly, periosteal biopsies (50 mm2) from the tibia were harvested using a periosteal lifter and maintained in growth medium comprised of high-glucose Dulbecco’s modified Eagle’s medium (DMEM Glutamax; Invitrogen) supplemented with 10 % fetal bovine serum (FBS; BioWhittaker), 1 % sodium pyruvate (Invitrogen), and 1 % antibiotic-antimycotic solution (100 units/mL penicillin, 100 mg/mL streptomycin, and 0.25 mg/mL amphotericin B; Invitrogen). The harvested tissues were digested at 37 °C overnight in a solution of 0.2 % type IV collagenase (440 units/mg; Invitrogen) in growth medium. Subsequently, the periosteal cells from individual donors were collected via centrifugation, seeded in a T-25 flask and expanded separately. After passage 2, cells demonstrating similar in vitro growth kinetics, such as population doubling times, and in vivo bone forming capacity were pooled together from different donors (n=4; two male and two female donors, aged 28.7 ± 10.6 years) and further expanded. Trypsin-released hPDCs (0.25 % trypsin, 1 mM EDTA; Invitrogen) were cryopreserved in DMEM containing 20 % FBS and 10 % dimethyl sulfoxide (DMSO; Sigma). Thawed hPDCs were re-plated in T-175 flasks at 5000 cells/cm2 and further sub-cultured. The cells were harvested for micromass formation at passage 6.
2.2. Gelatin Microsphere Synthesis and Loading with Growth Factor
Genipin-crosslinked gelatin microspheres were formed via a previously established protocol [46]. Briefly, at 45 °C, a preheated aqueous solution of 11.1 wt.% of Type A gelatin (Sigma) was added dropwise into 250 mL of preheated olive oil and stirred at 500 RPM for 10 min. The mixture was constantly stirred and slowly cooled to 4 °C to allow gelation. After 30 min at 4 °C, a first round of 100 mL of chilled acetone was combined with the stirring solution. Subsequently, after 1 h, a second round of 100 mL chilled acetone was added to the emulsion and stirred for 5 min at 1000 RPM. The resulting microspheres were gathered via filtration, further washed with acetone to remove residual oil, and air dried. The dry microspheres were crosslinked using a 1 wt.% genipin aqueous solution at room temperature. Crosslinked microspheres were collected, washed, and lyophilized. Microspheres with a crosslinking density of ~35 %, determined using a ninhydrin assay, as previously reported [46], were used in this study. To load TGF-β1 into the microspheres and ensure complete absorption of the growth factor during this process, the crosslinked microspheres were soaked in a solution of TGF-β1 (Peprotech) in phosphate buffered saline (PBS; Gibco) at a concentration of 400 ng TGF-β1 per mg microsphere, at pH 7.4 for 2 h at 37 °C, in volumes less than the equilibrium swelling volume of the microspheres. Microspheres without growth factors were hydrated in similar fashion with PBS alone.
2.3. Microsphere-incorporated hPDC Micromass Formation
Based on the various micromass culture conditions (Table 1), the necessary amounts of crosslinked microspheres were weighed and UV sterilized for 10 min. Next, the microspheres were hydrated with PBS or loaded with growth factor, as described above. hPDCs at passage 6 were trypsinized and re-suspended at a concentration of 20 × 106 cells/mL. Micromasses of hPDCs were prepared based on previous protocols with minor changes [16]. Briefly, control micromasses without microspheres (ExoGF) were made by seeding 20 μL droplets of the cell suspension in a 24 well plate, which leads to 400,000 cells per micromass of about 6 mm in diameter (Fig. 1A). For the conditions that contained microspheres, the cell suspension was first combined with the microspheres, with (0.15MS_LoadedGF and 0.30MS_LoadedGF) or without (0.30MS_ExoGF) growth factor, followed by seeding 20 μL droplets in a 24 well plate (Fig. 1B & C). Subsequently, the seeded droplets were incubated at 37 °C in 95 % humidity for 3 h. Following the 3 h incubation time, 500 μL of chemically defined chondrogenic medium [High Glucose DMEM, 1 % ITS+ Premix (BD Biosciences), 1 % antibiotics, 100 nM dexamethasone, 37.5 μg/mL ascorbate-2-phosphate, 1 % sodium pyruvate, 1 % nonessential amino acids, and 10 ng/mL TGF-β1] [34], supplemented with 20 μM of ROCKi to minimize cytoskeletal tension and prevent cell detachment [16], was added to the wells containing the ExoGF and 0.30MS_ExoGF groups. For the groups containing growth factor loaded microspheres within the micromasses, TGF-β1 was excluded from the medium. Media were replenished every other day throughout the duration of the experiment. Brightfield and fluorescent images of the micromasses were taken at 2 w and at 4 w using an Olympus inverted microscope, with an excitation filter of 470–495 nm and emission filter of 510–550 nm. ImageJ was used to count the number of individual microspheres within each image.
Table 1.
Experimental conditions of hPDC micromasses with and without gelatin microspheres. Exo = exogenous; GF = growth factor; MS = microsphere.
| Condition | TGF-β1 Source | Medium | Microspheres per Micromass (mg) | Total TGF-β1 added over 4 weeks (ng) |
|---|---|---|---|---|
| ExoGF | Exogenous via medium | Full Chondrogenic Medium | 0 | 60 |
| 0.30MS_ExoGF | Exogenous via medium | Full Chondrogenic Medium | 0.30 | 60 |
| 0.15MS_LoadedGF | Loaded microspheres | Chondrogenic Medium w/o TGF-β1 | 0.15 | 60 |
| 0.30MS_LoadedGF | Loaded microspheres | Chondrogenic Medium w/o TGF-β1 | 0.30 | 120 |
Fig. 1.

Schematic representation of the formation of various hPDC micromasses with and without gelatin microspheres as well as the medium formulations used. Control hPDC micromasses without microspheres, ExoGF (A); hPDC micromasses with 0.30 mg unloaded microspheres, 0.30MS_ExoGF (B); hPDC micromasses combined with growth factor loaded gelatin microspheres: 0.15 mg loaded microspheres per hPDC micromass, 0.15MS_LoadedGF (Ci); 0.30 mg loaded microspheres per hPDC micromass, 0.30MS_LoadedGF (Cii).
2.4. Picogreen/Quant-iT DNA Quantification
The DNA quantity of 3 micromasses per condition per time point was calculated using the Picogreen DNA Quant-iT kit and the Qubit Fluorometer measuring device (Invitrogen). The micromasses were first degraded in 200 μL digestion buffer composed of proteinase-K (0.5 mg/mL; Sigma Aldrich), phosphate buffered EDTA (5 mM EDTA in PBS; pH 7.1; PBE), and 0.1 % Triton X-100 at 60 °C. Next, a working solution of the reagent and the buffer (1:200) was prepared according to the instructions of the manufacturer. The working solution was mixed with the provided standards as well as the degraded samples. The samples were read using the Qubit Fluorometer, and the DNA concentration was calculated for time points 0 w (24 h after seeding), 2 w, and 4 w.
2.5. Dimethylmethylene Blue Glycosaminoglycan Assay
A dimethylmethylene blue (DMMB) GAG assay was used to analyze the in vitro GAG content of the hPDC micromasses. At each time point, the same digested samples used for the DNA quantification assay were used for the GAG assay. Briefly, 1,9–dimethylmethylene blue chloride (Sigma) was dissolved in ethanol overnight and then added to a sodium chloride (0.04 M NaCl)/glycine solution, pH 3, for a final concentration of 46 μM DMMB. 30 μL of the samples were loaded into a 96 well plate, along with 270 μL of the DMMB dye solution, and the absorbance was read at 570 nm. The GAG concentration was calculated from a standard curve generated using a serial dilution of chondroitin sulfate (Sigma).
2.6. RNA extraction and quantitative PCR
Total RNA was extracted from the various micromasses using the Qiagen RNeasy Extraction Kit (Qiagen) following the protocol provided by the manufacturer. The isolated RNA was quantified with using a NanoDrop Spectrophotometer (Thermo Scientific). 250 ng of total RNA from each sample was used to synthesize complementary DNA (cDNA) via the RevertAid™ H Minus First Strand cDNA synthesis kit (Fermentas) using Oligo(dT) 18 primer. Subsequently, for qPCR, SYBR Green (Applied Biosystems) primers and a Rotor-Gene sequence detector were utilized. Independent triplicate samples were measured in duplicate, and the relative gene expression was calculated using 2−ΔCT and the β-actin housekeeping gene. The primer sequences can be found in Table 2. The genes examined were SOX-9, aggrecan (ACAN), collagen type II (COL2A1), collagen type X (COL10A1), collagen type I (COL1A), MMP-13 (MMP13), and Indian hedgehog (Ihh).
Table 2.
Primer sequences.
| Gene | Forward Sequence | Reverse Sequence |
|---|---|---|
| β-Actin | CCCAGATCATGTTTGAGACCT | CCTGTAGATGGGCACAGT |
| SOX-9 | TGGAGACTTCTGAACGAGAGC | CGTTCTTCACCCACTTCCTC |
| COL-2A | GGCTTCCATTTCAGCTATGG | AGCTGCTTCGTCCAGATAGC |
| ACAN | GTCTCACTGCCCAACTAC | GGAACACGATGCCTTTCAC |
| COL-10A | ACGATACCAAATGCCCACAG | GTGGACCAGGAGTACCTTGC |
| COL-1A | GTCACCCACCGACCAAGAAACC | AAGTCCAGGCTGTCCAGGGATG |
| MMP-13 | TCCCAGGAATTGGTGATAAAGTAGA | CTGGCATGACGCGAACAATA |
| Ihh | CATTGAGACTTGACTGGGCAAC | AGAGCAGGCTGAGTTGGGAGTCGC |
2.7. Histology and Immunohistochemistry
Micromasses (n=3 per treatment group) cultured for 2 w and 4 w were cryosectioned with 5 μm thick sections used for histological analysis. The micromass samples were cross-sectioned in different orientations because most of the micromasses for the ExoGF conditions detached from the well plate and curled up whereas the micromasses for the LoadedGF conditions remained attached to the well plate and flat. Specifically, the micromasses that did not curl up have a relatively rectangular cross-section, as expected. For the curled up samples, the cross-sections are more round, and it is assumed that the bottom of the micromass that was attached to the plate is on the inside after curling up. To qualitatively observe the sulfated GAG content of the various micromasses, sections were stained with alcian blue at low pH. Briefly, the cryosections were rehydrated, incubated at room temperature for 1 h in 1 % alcian blue solution (pH 1), and then subsequently placed in nuclear fast red solution for 10 min to stain cellular nuclei. The stained sections were dehydrated in graded ethanol and mounted. Additional cryosections were stained with safranin-O/fast green to further analyze the micromasses’ GAG content. Sections were first rehydrated and immersed in a 0.03 % fast green solution for 5 min. Next, stained sections were dipped in 1 % acetic acid three to five times. Following the acetic acid washes, sections were immersed in 0.25 % safranin-O solution for 7 min, rinsed with water, dehydrated via graded ethanol, and mounted. Lastly, picrosirius red was used to stain the collagen produced in the micromasses. Briefly, the cryosections were rehydrated and placed in a picrosirius red solution (Sigma) for 1 h at room temperature. Next, stained sections were washed twice in fresh acidified water, dehydrated in graded ethanol, and finally mounted. Brightfield images were taken using an Olympus inverted microscope. Polarized images of picrosirius red stained sections were taken using a Leica DMR microscope. For all sections, images were taken using a 10X objective, whereas for the alcian blue and safranin-O stained sections, an additional image was taken using a 20X objective.
Immunohistochemistry (IHC) was conducted for collagen type I (rabbit:antihuman; product number PA1–36057, Thermo fisher), collagen type II (rabbit:antihuman; product number AB 761, Millipore/Chemicon), and collagen type X (mouse:antihuman; product number AB4995, Abcam). Briefly, prior to IHC staining, the cryosections were placed in ice cold acetone, washed in PBS, air dried, and prepared for staining. For collagen type I and collagen type II, samples were quenched with 3 % H2O2, which was immediately followed by antigen retrieval for 15 min using pepsin (1 mg/mL) in 0.02 M HCL. Following two subsequent washes in Tris-buffered saline and 0.1 % Tween 20 (TBST, Sigma-Aldrich), samples were incubated for 30 min at room temperature in a 5 % bovine serum albumin (BSA, Sigma-Aldrich) in TBST solution to block non-specific binding. Samples were then incubated overnight at 4 °C in their respective primary antibodies diluted (1:200) in 5 % BSA in TBST. Following the overnight incubation, samples were washed in TBST three times, for 5 min each, and incubated at room temperature for 40 min in 5 % BSA in TBST. Subsequently, sections were placed in horseradish peroxidase (HRP)-conjugated anti-rabbit secondary antibodies diluted (1:500) in TBST and incubated for 30 min at room temperature. Samples were then washed 2 times for 5 min each in TBST and incubated 5 min at room temperature with 3,3’-diaminobenzidine (DAB+, Sigma-Aldrich) substrate. Samples were rinsed with water, counterstained with hematoxylin, dehydrated, and mounted. For IHC for collagen type X, sections were first incubated in a solution of 10 mg/mL hyaluronidase in PBS for 40 min at 37 °C, followed by 3 subsequent washes of 5 min each in TBST. Non-specific binding was blocked by incubating the samples in a dilution (1:5) of goat serum in TBST for 40 min at room temperature. Next, the primary antibody was diluted (1:400) in TBST, and the samples were incubated overnight at 4 °C. After washing 3 times in TBST, the samples were quenched in 3 % H2O2 twice for 10 min each. Samples were then incubated for 40 min at room temperature in a blocking solution of (1:5) goat serum in TBST and subsequently washed 3 times for 5 min each in TBST. Next, HRP-conjugated anti-mouse antibody was diluted (1:500) in TBST and applied to the samples for 30 min at room temperature. After 30 min, sections were washed in TBST again 3 times for 5 min each and then incubated at room temperature for 5 min in DAB+ substrate. Lastly, samples were rinsed, counterstained with hematoxylin, dehydrated, and mounted. Sections were imaged using a Leica DMR microscope with a 20X objective.
2.8. Statistical Analysis
A minimum sample size of n=3 was determined based on a power analysis (α=0.05; power=0.8) using expected mean and standard deviation values for the DNA and GAG assays based on data from previous publications [31]. Quantitative results in all text and figures are expressed as mean ± standard deviation. A two-way ANOVA was performed for the DNA and GAG assays. Results were considered significant with p-values below 0.05 (*p<0.05; **p<0.01; ***p<0.001).
3. Results
3.1. Microsphere Incorporation within hPDC Micromasses
Genipin crosslinked gelatin microspheres were successfully incorporated within 20 μL hPDC micromasses, each consisting of about 400,000 cells (Fig. 2). In this study, hPDC micromasses containing two different amounts of gelatin microspheres loaded with TGF-β1 (0.15MS_LoadedGF and 0.30MS_LoadedGF) were compared to micromasses receiving growth factor stimulation exogenously via the culture medium (ExoGF and 0.30MS_ExoGF) (Table 1 and Fig.1). The 0.30MS_ExoGF condition contained microspheres that were not loaded with TGF-β1 as an additional control group to compare to micromasses without microspheres (ExoGF). After 2 weeks of in vitro culture, the incorporated microspheres were clearly visible in the brightfield images. Furthermore, the differences in the amount of microspheres added to the micromasses could also be observed, with 0.30MS_ExoGF (Fig. 2A; n=590) and 0.30MS_LoadedGF (Fig. 2E; n=463) conditions displaying a higher number of microspheres than the 0.15MS_LoadedGF (Fig. 2C; n=224) condition. In addition, since genipin crosslinking of gelatin induces a strong fluorescence, fluorescent images (Fig. 2B, D, F; n=494, 254, 690, respectively) further confirmed the successful incorporation of the microspheres and demonstrated the differences in the number of individual fluorescent microspheres incorporated within the micromasses. It is important to consider the number of individual particles and not the average fluorescence intensity when comparing the images because the images were taken with a standard fluorescence microscope and the fluorescence intensity can vary due to the thickness of the sample and the selection of the focal plane. After 4 weeks of in vitro culture, the gelatin microspheres were still present in the hPDC micromasses, as seen in both the brightfield (Fig. 2G, I, K; n=432, 289, 337, respectively) and the fluorescent (Fig. 2H, J, L; n=451, 294, 410, respectively) images. The ExoGF micromasses detached and curled up during the culture period; therefore, their images were not included. Moreover, micromasses cultured in regular growth medium dissociated already after a few days in culture and thus were not included in this study. Overall, this allowed us to conclude that the addition of gelatin microspheres did not seem to hinder the process of hPDC micromass formation and further that the microspheres remained incorporated throughout the 4 week culture period.
Fig. 2.

Microscopy images of “top” view of whole micromasses successfully combined with genipin crosslinked gelatin microspheres after 2 (A-F) and 4 weeks (G-L) of in vitro culture. Brightfield images of gelatin microspheres in hPDC micromasses (A, C, E, G, I, K). Corresponding fluorescent images of gelatin microspheres (fluorescent green spheres) incorporated within micromasses (B, D, F, H, J, L). 0.30MS_ExoGF (A, B, G, H); 0.15MS_LoadedGF (C, D, I, J); 0.30MS_LoadedGF (E, F, K, L). (Scale bar = 500 μm)
3.2. DNA Content and GAG Accumulation within Microsphere Incorporated hPDC Micromasses
The DNA content of the micromasses for the various conditions was measured at 0 (24 hours after seeding), 2, and 4 weeks of in vitro culture. At each of the time points, there was no significant difference in the DNA content among the different experimental conditions, indicating that the incorporation of the gelatin microspheres did not interfere with the viability of the hPDCs within the micromasses (Fig. 3A). Moreover, the lack of a significant difference in DNA content at 0 weeks was a good indication that all of the micromasses had an equal initial number of cells. However, when comparing the DNA content of the various experimental groups over time, there was a significant difference. After 2 weeks of culture, each of the groups had a significantly higher DNA content compared to its 0 week counterpart (p<0.001). Although there was a significant increase from 0 to 2 weeks of culture, at 4 weeks the DNA content of all the conditions containing microspheres dropped significantly when compared to 2 weeks (p<0.001), whereas the drop in the DNA content of the control micromass group was still present but the difference was not statistically significant. Moreover, the DNA level at 4 weeks in each of the groups was not significantly different compared to the respective DNA level at 0 weeks, thus indicating that the number of cells remaining in the micromass was unchanged when compared to the start of the experiment.
Fig. 3.

DNA quantification (A) and GAG accumulation (B) of hPDC micromasses (average and standard deviation of n=3; ***p<0.001).
When quantifying the GAG accumulation in the micromasses using a DMMB assay, there was an overall increase over time for all of the conditions (Fig. 3B). In a similar manner as with the DNA content, the GAG content of the hPDC micromasses was not disturbed by the addition of the microspheres. At 0 weeks, the GAG/DNA content of the micromasses was close to negligible without any differences among the micromass conditions. However, after 2 weeks of in vitro chondrogenic stimulation, all of the micromass conditions demonstrated a significantly higher GAG/DNA level compared to that at 0 weeks (p<0.001). Although there were no significant differences among the various micromass conditions at 2 weeks, the conditions containing microspheres (0.30MS_ExoGF, 0.15MS_LoadedGF, and 0.30MS_LoadedGF) had a slightly higher GAG/DNA content than the control micromasses. After 4 weeks of in vitro culture, each of the micromass conditions contained significantly more GAG/DNA than not only its 0 week but also its 2 week counterpart (p<0.001). Although there was a drop in DNA content at 4 weeks, the cells continued to deposit more GAG per cell over time. Moreover, similar to the results at 2 weeks, the micromasses with gelatin microspheres contained slightly more GAG/DNA than the control micromass condition after 4 weeks of culture.
3.3. Alcian Blue and Safranin-O Staining Display GAG Accumulation
Alcian blue (Fig. 4) and safranin-O (Fig. 5) stained histology sections displayed the GAG being deposited by the hPDCs within the various micromass conditions. More specifically, when looking at the staining of the micromasses with alcian blue, which stains sulfated GAGs at low pH [47], at 2 weeks (Fig. 4A–D), it can be seen via the intense blue staining that all of the different culture conditions stimulated sulfated GAG deposition by hPDCs within the micromasses. At 4 weeks, the alcian blue staining (Fig. 4E–H) displayed a similar trend, except in the 0.15MS_LoadedGF and 0.30MS_LoadedGF micromass conditions (Fig. 4G–H), where the more intense blue staining seemed to be localized to the areas surrounding the growth factor loaded microspheres (*). Furthermore, when looking at the ExoGF (Fig. 4E) and 0.30MS_ExoGF (Fig. 4F) conditions, the cellular morphology seemed to be more rounded and contained a large lacuna (↓), whereas the hPDC morphology within the LoadedGF conditions, which was more clearly visible in the 0.30MS_LoadedGF (Fig. 4H) micromasses, was more spread out and without a large lacuna.
Fig. 4.

Microscopy images of alcian blue/nuclear fast red stained hPDC micromass histology sections after 2 (A-D) and 4 weeks (E-H) of in vitro chondrogenic culture. ExoGF (A, E); 0.30MS_ExoGF (B, F); 0.15MS_LoadedGF (C, G); 0.30MS_LoadedGF (D, H). The blue color indicates the presence of GAG deposition by the cells. Arrows (↓) indicate rounded cellular morphology with large lacuna (E, F) and asterisks (*) indicate higher GAG accumulation localized to areas around microspheres (G, H). (Inset scale bar = 100 μm; main panel scale bar = 50 μm)
Fig. 5.

Microscopy images of safranin-O/fast green stained hPDC micromass histology sections after 2 (A-D) and 4 weeks (E-H) of in vitro chondrogenic culture. ExoGF (A, E); 0.30MS_ExoGF (B, F); 0.15MS_LoadedGF (C, G); 0.30MS_LoadedGF (D, H). The red color indicates positive staining for GAG content within micromasses. (Inset scale bar = 100 μm; main panel scale bar = 50 μm)
The safranin-O staining of the micromasses after 2 weeks in culture (Fig. 5A–D) confirmed that highly sulfated GAG was being deposited, indicated via the red color, in all of the conditions. Further, when looking at the micromasses after 4 weeks in culture (Fig. 5E–H), the conditions receiving growth factor stimulation exogenously via the medium, ExoGF and 0.30MS_ExoGF, displayed a decrease in positive safranin-O staining (Fig. 5E, F), whereas the micromasses with the growth factor loaded gelatin microspheres, 0.15MS_LoadedGF and 0.30MS_LoadedGF, maintained their level of GAG accumulation, demonstrated by the continued presence of positive red stain (Fig. 5G, H). These results were in contrast to the biochemical data obtained from the DMMB GAG assay, which also measures sulfated GAG. A potential explanation could be the change in size of the micromasses in the ExoGF conditions, which detached from the plate and balled up. This would lead to more intense staining in those samples despite equal GAG numbers in the DMMB assay.
3.4. Collagen Deposition in hPDC Micromasses and Gene Expression
Polarized light microscopy images of picrosirius red stained sections were used to observe the collagen deposition of the hPDCs within the different micromass conditions (Fig. 6). Under polarized light, due to the birefringence of collagen fibers, picrosirius red stained collagen fibers appear yellow-orange or green in color, depending on if the fibers are thick and tightly packed or thin and poorly packed, respectively [48]. After 2 weeks of culture (Fig. 6A–D), all of the different micromass conditions were already producing a network of collagen fibers. More specifically, the micromasses receiving stimulation exogenously, ExoGF and 0.30MS_ExoGF (Fig. 6A, B), produced more tightly packed (yellow-orange) fibers at 2 weeks, compared to the thinner (green) fibers observed in the 0.15MS_LoadedGF and 0.30MS_LoadedGF conditions (Fig. 6C, D). At 4 weeks (Fig. 6E–H), all the micromasses continued their accumulation and organization of collagen fibers, with the LoadedGF micromasses (Fig. 6G, H) displaying, qualitatively, an increase in thicker, more tightly packed fibers than at 2 weeks, based on the increase in yellow-orange color, especially around the gelatin microspheres still present within the micromasses.
Fig. 6.

Polarized light microscopy images of picrosirius red stained hPDC micromass histology sections after 2 (A-D) and 4 weeks (E-H) of in vitro chondrogenic culture. ExoGF (A, E); 0.30MS_ExoGF (B, F); 0.15MS_LoadedGF (C, G); 0.30MS_LoadedGF (D, H). Collagen birefringence leads to yellow-orange (thick/packed fibers) or green (thin/loose fibers) color under polarized light. (Scale bar = 200 μm)
Additionally, IHC analysis demonstrated the chondrogenic differentiation, including maturation towards hypertrophy, of the hPDC micromasses. After 2 weeks of culture, all of the conditions showed some positive staining for collagen type I, II, and X (data not shown). After 4 weeks of culture (Fig. 7), the micromasses continued to exhibit positive staining. In general, both ExoGF and 0.30MS_ExoGF conditions showed similar patterns of staining, as did both 0.15MS_LoadedGF and 0.30MS_LoadedGF conditions; therefore, only images from the ExoGF and 0.30MS_LoadedGF are displayed. The sections for all groups showed strong positive staining throughout for all three types of collagen when compared to the negative controls (Fig. 7C,F,I), indicating the retention of collagen within the extracellular matrix of the micromasses. The images further showed a heterogeneous population of rounded cells and fibroblastic cells, with the latter being more present in the LoadedGF conditions. Collagen type I (Fig. 7A,B) was found to be deposited within the matrix throughout the different micromasses, with a higher level of positive staining associated with the more fibroblastic cells. For collagen type II (Fig. 7D,E), the rounded cells were more often positively stained. All conditions also displayed some positive staining for collagen type X (Fig. 7G,H), which is a chondrogenic hypertrophy associated protein. Large lacunae containing cells were present in all conditions, and these cells within the LoadedGF micromasses tended to be closer in proximity to the loaded microspheres and thus the local source of TGF-β1.
Fig. 7.

Microscopy images of immunohistochemistry stains of ExoGF (A, D, G) and 0.30MS_LoadedGF (B, E, H) conditions after 4 weeks of in vitro culture. Collagen type I (A,B); collagen type II (D, E); collagen type X (G, H) all demonstrated positive brown staining, compared to negative controls (C, F, I) without primary antibody. (Scale bar = 100 μm)
The observations in collagen IHC analysis for positive staining of individual cells were supported by quantitative gene expression data (Fig. 8) for the three types of collagen. After 2 weeks of culture, COL1A expression was at similar levels for all samples, whereas COL2A1 and COL10A1 were more highly expressed in the ExoGF and 0.30MS_ExoGF conditions than in the 0.15MS_LoadedGF and 0.30MS_LoadedGF conditions. Looking at other chondrogenic markers of differentiation, the expression of SOX-9 and Ihh was upregulated in the ExoGF and 0.30MS_ExoGF conditions at 2 weeks, whereas no changes were observed for the 0.15MS_LoadedGF and 0.30MS_LoadedGF groups. ACAN levels were unchanged in all groups between 0 and 2 weeks. Interestingly, MMP13 expression was increased at 2 weeks compared to 0 weeks and there was higher MMP13 expression in the ExoGF and 0.30MS_ExoGF conditions when compared to the 0.15MS_LoadedGF and 0.30MS_LoadedGF conditions. Importantly, the qPCR data should be interpreted with caution, as the yield of RNA decreased by several fold at the 2 week time point, which was unexpected because of the increased cell numbers observed in the DNA measurements.
Fig. 8.

Chondrogenic gene expression of hPDC micromasses receiving growth factor stimulation either exogenously via the medium (ExoGF, 0.30MS_ExoGF) or via the incorporation of growth factor loaded microspheres (0.15MS_LoadedGF, 0.30MS_LoadedGF) after 0 weeks (24 h in GM) and after 2 weeks. Gene expression was normalized to the housekeeping gene, β-Actin. (A) SOX-9 (SOX-9); (B) ACAN (ACAN); (C) COL2A1 (COL-2A); (D) COL10A1 (COL-X); (E) COL1A (COL-1); (F) MMP13 (MMP13); (G) Ihh (Ihh). Results are presented as mean ± standard deviation (n=3).
4. Discussion
Through this study, we were able to show that genipin crosslinked gelatin microspheres, which can be loaded with growth factors such as TGF-β1, can be successfully implemented within a hPDC micromass culture system. The brightfield and fluorescent images of intact micromasses along with the histological sections displayed the presence of the gelatin microspheres within the micromasses over the entire culture period. Furthermore, the inclusion of the growth factor loaded microspheres within hPDC micromasses seemed to permit chondrogenesis to at least the same extent as exogenous growth factor delivery, as demonstrated quantitatively via the increasing GAG/DNA content of the micromasses with time and qualitatively through histological and immunohistochemical stains showing accumulation of GAG and collagen. These findings demonstrate the potential of using cytokine releasing, gelatin microspheres to enhance the chondrogenic capabilities of hPDC micromasses as an alternative to supplementation of the medium with growth factors. This approach may have several advantages, anticipating a more effective use of the growth factors especially considering longer in vitro culture periods, prolonged stimulation even after implantation in vivo, and potential for upscaling.
Although majority of the micromasses maintained their shape throughout the study due to the presence of ROCKi (Y27632), some micromasses in certain conditions, namely the ExoGF and 0.30MS_ExoGF conditions, detached and balled up, resembling pellets. In previous work with similar high density micromasses, the addition of ROCKi demonstrated no cumulative effect on GAG deposition by hPDCs, while in its absence, the micromasses detached and formed pellet-like structures with the appearance of a necrotic center [16]. One could speculate that the detachment seen here could possibly be attributed to cytoskeletal tension created by the activation of the RhoA GTPases in culture conditions supplemented with TGF-β1 [49, 50], which may not have been sufficiently counteracted by the amount of ROCKi used. Moreover, the presence of the microspheres within these micromasses, cultured in the presence of the ROCKi, seemed to help with the maintenance of the overall shape of the micromasses.
While the gelatin microspheres were successfully combined with the high density micromass culture system of hPDCs, the continued presence of the gelatin microspheres after 4 weeks of in vitro culture, as seen in the brightfield and fluorescent images (Fig. 2), was unexpected and contrary to their more rapid degradation in previous studies with BM-MSCs [33, 34]. In the previous work, gelatin microspheres that were crosslinked to a similar degree (28 ± 8 %) were completely degraded after 2 – 3 weeks of culture within aggregates and self-assembled cell sheets of BM-MSCs [33, 34]. This reduction in biomaterial degradation, which has been observed before, can possibly be attributed to a lower amount of protease secretion by hPDCs. For instance, when hPDCs were encapsulated within a polyethylene glycol (PEG) hydrogel that was crosslinked with protease sensitive peptides, the hydrogel remained structurally intact over 4 weeks of in vitro chondrogenic culture [29]. However, a similar hydrogel composition, containing BM-MSCs, was degraded over time [51]. Hence, it appears that there may be a difference in protease production between hPDCs and BM-MSCs, which is an aspect that can be further investigated in the future. Here we examined the expression of MMP13 in the qPCR analysis. Although MMP13 was upregulated in all groups at 2 weeks compared to 0 weeks, the levels of MMP13 were lower in the 0.15MS_LoadedGF and 0.30MS_LoadedGF groups compared to the ExoGF and 0.30MS_ExoGF groups, which may explain the slow degradation of the microspheres.
The GAG accumulation (Fig. 3), a measure of chondrogenic differentiation, of hPDCs cultured in micromasses was not compromised by the inclusion of the gelatin microspheres. The GAG/DNA content significantly increased over time, even though after 4 weeks there was a drop in DNA content. This was a sign that the cells were active in biosynthesis, suggesting that the cells were undergoing differentiation but not proliferation, which was expected due to the fact that the medium used with the micromasses was serum free and tailored for differentiation unlike the serum-containing medium used initially for cell expansion in 2D culture. One advantage of the incorporation of the microspheres within the micromasses is providing more space for newly produced GAG to accumulate as the microspheres are degrading. The microspheres can act as 3D spacers providing a mechanically advantageous construct while conferring enhanced permeability and allowing increased diffusion of molecules through the high density micromass, as previously reported for other stem cell aggregates incorporating gelatin microspheres [34, 52]. For instance, gelatin microspheres incorporated within self-assembling BM-MSC cell sheets had a significant impact on the overall thickness as well as the compressive modulus of the tissue engineered construct [34], which can be advantageous when upscaling and conducting in vivo experiments in the future. Additionally, we have measured a similar normalized GAG content for hPDCs encapsulated in enzymatically degradable PEG hydrogels when the cells were suspended at a much lower seeding density and cultured in medium containing 10 ng/mL TGF-β1 [31]. Moreover, the alcian blue, safranin-O, and picrosirius red histological stains (Fig. 4–6) further demonstrated the successful integration and biological activity of growth factor loaded gelatin microspheres within the hPDC micromasses. For example, whereas the alcian blue stains of the LoadedGF conditions showed localized accumulation of GAG near the microspheres, the safranin-O stains of the LoadedGF conditions at 4 weeks displayed an intense staining and uniform distribution of GAG throughout the micromass. The latter is similar to results obtained with BM-MSC cell sheets, which demonstrated a high level of homogenous GAG production, observed via safranin-O staining, when incorporated with similar low crosslinked, growth factor loaded gelatin microspheres [34].
In addition, it was found through IHC analysis (Fig.7) that the incorporation of the growth factor loaded microspheres within hPDC micromasses can lead to similar levels of collagen type I, II, and X protein accumulation as micromasses stimulated exogenously via the medium. The heterogeneity of the cell population witnessed, especially within the 0.15MS_LoadedGF and 0.30MS_LoadedGF conditions, can be resolved in the future via the optimization of the amount of microspheres incorporated within each micromass. In the current study, the weight of microspheres added per micromass was determined based on results and optimized protocols used for BM-MSC cell sheets and aggregates [33, 34]. In this previous work, the effect of the loaded microspheres providing stimulation to the cells deep within the system and the resulting homogeneity of the cells and protein deposition was far greater and more visible, compared to the cell sheet and pellets receiving exogenous stimulation, where the growth factors may not reach the inner depths of the construct. In our case, the diffusion limitations within the micromasses is much less, and thus the control conditions with exogenous medium supplementation also performed well. Further optimization with the micromasses to achieve a more even distribution of the microspheres or working with microspheres that have a smaller particle size should lead to a more homogenous cell population in addition to possibly utilizing less growth factors and fewer materials. Besides the production of collagen type II that is typical of chondrocytes, both IHC and qPCR analysis indicated the production of collagen type X, which suggests that the micromasses are undergoing chondrogenic differentiation including maturation towards hypertrophy. This is potentially relevant as a tissue engineering approach to promote improved bone regeneration via endochondral ossification, as we have previously shown [27].
Finally, although the qPCR analysis did not show an upregulation of the chondrogenic markers SOX-9 and Ihh in the conditions where TGF-β1 was delivered from the microspheres, these results need to be interpreted with caution. Although a standard protocol was used, the yield of RNA from the samples at 2 weeks was dramatically reduced compared to the samples at 0 weeks, even though the DNA content was higher at 2 weeks. This suggests that the extracellular matrix accumulation in the micromasses may be interfering with the RNA harvest and may potentially bias the results. It is known that RNA isolation from cartilage tissue is difficult due to the highly crosslinked extracellular matrix containing large amounts of proteoglycans [53–55]. Further, while RNA is easily isolated from chondrocytes in 2D culture, the quantity and quality of RNA is significantly reduced when isolated from cartilage tissue [53, 56], and the proteoglycans can also co-precipitate with the RNA, thus interfering with the qPCR analysis [57–59]. Although starting from cultured cells, the micromasses form 3D structures that accumulate GAGs over the time in culture, as demonstrated with the DMMB assay. Further, as seen in the histology and IHC images, the distribution of differentiated cells and matrix production is different between the samples receiving growth factor stimulation through the medium (ExoGF and 0.30MS_ExoGF) and those receiving TGF-β1 via the microspheres (0.15MS_LoadedGF and 0.30MS_LoadedGF), and the differentiated cells are located deeper within the micromasses around the microspheres in the latter case. A possibility is that only the superficial cells were efficiently extracted with low yields obtained for the deeper clusters during RNA isolation, and even though equal amounts of RNA are used in the assay and the results are normalized to the housekeeping gene, this could explain the reduced gene expression patterns for the 0.15MS_LoadedGF and 0.30MS_LoadedGF groups.
Overall, these results provide a good indication not only that the microspheres do not hinder the chondrogenic process of hPDCs but also that the TGF-β1 loaded microspheres can locally provide a continuous stimulation that matches exogenous medium based stimulation, which aligns well with previous work with BM-MSCs [34]. This aspect is relevant when looking at the costs of this tissue engineering approach. Even though in the current study the overall amount of growth factor used throughout the 4 weeks of medium changes was similar to the amount loaded in the 0.15MS_LoadedGF microspheres (Table 1), we would expect the conditions with growth factor loaded microspheres to perform better over longer experiments and culture times as well as when upscaling to clinically relevant implants, as medium supplementation in these cases would lead to an increased use of growth factors, thus incurring higher costs. Additionally, the increased amount of growth factor within the micromasses, which was varied by the amount of microspheres incorporated, did not seem to significantly enhance the chondrogenesis of the hPDCs. In the present study, the amount of TGF-β1 delivered in the 0.15MS_LoadedGF condition was within the dosage range utilized previously in BM-MSC aggregates [33], whereas the relative amount of TGF-β1 per cell delivered in the 0.30MS_LoadedGF condition was the same as the amount reported in previous studies with BM-MSC cell sheets [34]. Optimizing the total TGF-β1 dosage via microspheres for hPDC micromasses is an avenue to explore in future work, further aiding in reducing costs associated with this strategy.
Lastly, the motivation to utilize the microspheres combined with TGF-β1 was due to the highly successful outcomes seen in BM-MSC aggregates and cell sheets [33, 34] and the desire to reproduce these successes with hPDC micromasses. Also, previous work in our lab validated the use of TGF-β1 as a chondrogenic stimulatory cytokine for hPDCs. For example, hPDCs within PEG hydrogels cultured in chondrogenic medium containing TGF-β1 demonstrated successful GAG production and enhanced chondrogenic gene expression over time [29]. Alternatively, these gelatin microspheres can be used to deliver other growth factors to the hPDC micromasses for osteogenic or chondrogenic stimulation. For example, BMP-2 and BMP-6 have similar isoelectric points to that of TGF-β1, thus making their sequestration into the microspheres facile, and they have also been shown to be important in stimulating hPDCs to go down the chondrogenic lineage when cultured in 3D PEG hydrogels [29], on 2D flasks [30], and in micromasses [16]. In the future, it would be interesting to test the hPDCs as cell sheets incorporating the microspheres, as previously done with BM-MSCs [34], as well as to test the growth factor loaded microspheres and cells encapsulated together in PEG-based hydrogels containing a cell adhesion binding sequence [29], with localized growth factor delivery substituting for supplementation with TGF-β1 in the culture medium in cases with more challenging diffusion limitations.
5. Conclusion
The results in this study show the potential of using cytokine releasing, gelatin microspheres to improve the chondrogenic capabilities of hPDC micromasses as a way to circumvent exogenous supplementation with growth factors in the culture medium. As evaluated via microscopy images, biochemical assays, and histological analysis, the gelatin microspheres can be successfully incorporated within high-density hPDC micromass cultures. Furthermore, the addition of growth factor loaded microspheres helped to maintain in vitro chondrogenesis of hPDCs and, in some cases, seemed to provide very local stimulation, as shown by intense alcian blue staining near the TGF-β1 loaded microspheres in histological sections. Growth factor delivery via microspheres within the micromasses can provide a more advantageous culture system compared to exogenous medium based stimulation, and future studies to optimize growth factor dosage, microsphere degradation rate, etc. are warranted.
Acknowledgements
The authors acknowledge funding from the Research Foundation Flanders (FWO, grant no. G.0982.11N), the European Union’s Seventh Framework Programme (EU-FP7-REJOIND-RTD), National Institutes of Health’s National Institute of Arthritis and Musculoskeletal and Skin Diseases (R01AR063194), and the special research fund of the KU Leuven (grant no. IDO/13/016). We thank Sally Homsy for contributions to the initial experimental design as well as Dr. Luis Mendes and Dr. Laura-An Guns for help with the micromass protocols. We also thank Orely Vanborren and Kathleen Bosmans for performing the IHC staining and qPCR measurements.
Footnotes
Publisher's Disclaimer: This is a PDF file of an unedited manuscript that has been accepted for publication. As a service to our customers we are providing this early version of the manuscript. The manuscript will undergo copyediting, typesetting, and review of the resulting proof before it is published in its final citable form. Please note that during the production process errors may be discovered which could affect the content, and all legal disclaimers that apply to the journal pertain.
Conflict of Interest
The authors declare no conflict of interest.
Data Statement
Data will be made available on request.
References
- [1].Zhang L, Su P, Xu C, Yang J, Yu W, Huang D, Chondrogenic differentiation of human mesenchymal stem cells: a comparison between micromass and pellet culture systems, Biotechnol Lett 32(9) (2010) 1339–46. [DOI] [PubMed] [Google Scholar]
- [2].Mello MA, Tuan RS, High density micromass cultures of embryonic limb bud mesenchymal cells: an in vitro model of endochondral skeletal development, In Vitro Cell Dev Biol Anim 35(5) (1999) 262–9. [DOI] [PubMed] [Google Scholar]
- [3].Tuli R, Tuli S, Nandi S, Huang X, Manner PA, Hozack WJ, Danielson KG, Hall DJ, Tuan RS, Transforming growth factor-beta-mediated chondrogenesis of human mesenchymal progenitor cells involves N-cadherin and mitogen-activated protein kinase and Wnt signaling cross-talk, J Biol Chem 278(42) (2003) 41227–36. [DOI] [PubMed] [Google Scholar]
- [4].Johnstone B, Hering TM, Caplan AI, Goldberg VM, Yoo JU, In vitro chondrogenesis of bone marrow-derived mesenchymal progenitor cells, Exp Cell Res 238(1) (1998) 265–72. [DOI] [PubMed] [Google Scholar]
- [5].Oberlender SA, Tuan RS, Expression and functional involvement of N-cadherin in embryonic limb chondrogenesis, Development 120(1) (1994) 177–87. [DOI] [PubMed] [Google Scholar]
- [6].Denker AE, Nicoll SB, Tuan RS, Formation of cartilage-like spheroids by micromass cultures of murine C3H10T1/2 cells upon treatment with transforming growth factor-beta 1, Differentiation 59(1) (1995) 25–34. [DOI] [PubMed] [Google Scholar]
- [7].Watts AE, Ackerman-Yost JC, Nixon AJ, A comparison of three-dimensional culture systems to evaluate in vitro chondrogenesis of equine bone marrow-derived mesenchymal stem cells, Tissue Eng Part A 19(19–20) (2013) 2275–83. [DOI] [PMC free article] [PubMed] [Google Scholar]
- [8].Mueller MB, Tuan RS, Functional characterization of hypertrophy in chondrogenesis of human mesenchymal stem cells, Arthritis Rheum 58(5) (2008) 1377–88. [DOI] [PMC free article] [PubMed] [Google Scholar]
- [9].Tare RS, Howard D, Pound JC, Roach HI, Oreffo RO, Tissue engineering strategies for cartilage generation--micromass and three dimensional cultures using human chondrocytes and a continuous cell line, Biochem Biophys Res Commun 333(2) (2005) 609–21. [DOI] [PubMed] [Google Scholar]
- [10].Markway BD, Tan GK, Brooke G, Hudson JE, Cooper-White JJ, Doran MR, Enhanced chondrogenic differentiation of human bone marrow-derived mesenchymal stem cells in low oxygen environment micropellet cultures, Cell Transplant 19(1) (2010) 29–42. [DOI] [PubMed] [Google Scholar]
- [11].Bursac PM, Freed LE, Biron RJ, Vunjak-Novakovic G, Mass transfer studies of tissue engineered cartilage, Tissue Eng 2(2) (1996) 141–50. [DOI] [PubMed] [Google Scholar]
- [12].Leddy HA, Awad HA, Guilak F, Molecular diffusion in tissue-engineered cartilage constructs: effects of scaffold material, time, and culture conditions, J Biomed Mater Res B Appl Biomater 70(2) (2004) 397–406. [DOI] [PubMed] [Google Scholar]
- [13].Ahrens PB, Solursh M, Reiter RS, Stage-related capacity for limb chondrogenesis in cell culture, Dev Biol 60(1) (1977) 69–82. [DOI] [PubMed] [Google Scholar]
- [14].Scharstuhl A, Schewe B, Benz K, Gaissmaier C, Buhring HJ, Stoop R, Chondrogenic potential of human adult mesenchymal stem cells is independent of age or osteoarthritis etiology, Stem Cells 25(12) (2007) 3244–51. [DOI] [PubMed] [Google Scholar]
- [15].De Bari C, Dell’Accio F, Luyten FP, Human periosteum-derived cells maintain phenotypic stability and chondrogenic potential throughout expansion regardless of donor age, Arthritis Rheum 44(1) (2001) 85–95. [DOI] [PubMed] [Google Scholar]
- [16].Mendes LF, Tam WL, Chai YC, Geris L, Luyten FP, Roberts SJ, Combinatorial analysis of growth factors reveals the contribution of bone morphogenetic proteins to chondrogenic differentiation of human periosteal cells, Tissue Eng Part C Methods 22(5) (2016) 473–86. [DOI] [PubMed] [Google Scholar]
- [17].Eyckmans J, Lin GL, Chen CS, Adhesive and mechanical regulation of mesenchymal stem cell differentiation in human bone marrow and periosteum-derived progenitor cells, Biology Open 1(11) (2012) 1058. [DOI] [PMC free article] [PubMed] [Google Scholar]
- [18].O’Driscoll SW, Fitzsimmons JS, The role of periosteum in cartilage repair, Clin Orthop Relat Res (391 Suppl) (2001) S190–207. [DOI] [PubMed] [Google Scholar]
- [19].Lee RH, Kim B, Choi I, Kim H, Choi HS, Suh K, Bae YC, Jung JS, Characterization and expression analysis of mesenchymal stem cells from human bone marrow and adipose tissue, Cell Physiol Biochem 14(4–6) (2004) 311–24. [DOI] [PubMed] [Google Scholar]
- [20].Mackay AM, Beck SC, Murphy JM, Barry FP, Chichester CO, Pittenger MF, Chondrogenic differentiation of cultured human mesenchymal stem cells from marrow, Tissue Eng 4(4) (1998) 415–28. [DOI] [PubMed] [Google Scholar]
- [21].De Bari C, Dell’Accio F, Tylzanowski P, Luyten FP, Multipotent mesenchymal stem cells from adult human synovial membrane, Arthritis Rheum 44(8) (2001) 1928–42. [DOI] [PubMed] [Google Scholar]
- [22].Colnot C, Skeletal cell fate decisions within periosteum and bone marrow during bone regeneration, J Bone Miner Res 24(2) (2009) 274–82. [DOI] [PMC free article] [PubMed] [Google Scholar]
- [23].De Bari C, Dell’Accio F, Vanlauwe J, Eyckmans J, Khan IM, Archer CW, Jones EA, McGonagle D, Mitsiadis TA, Pitzalis C, Luyten FP, Mesenchymal multipotency of adult human periosteal cells demonstrated by single-cell lineage analysis, Arthritis Rheum 54(4) (2006) 1209–21. [DOI] [PubMed] [Google Scholar]
- [24].Hayashi O, Katsube Y, Hirose M, Ohgushi H, Ito H, Comparison of osteogenic ability of rat mesenchymal stem cells from bone marrow, periosteum, and adipose tissue, Calcif Tissue Int 82(3) (2008) 238–47. [DOI] [PubMed] [Google Scholar]
- [25].Sakaguchi Y, Sekiya I, Yagishita K, Muneta T, Comparison of human stem cells derived from various mesenchymal tissues: superiority of synovium as a cell source, Arthritis Rheum 52(8) (2005) 2521–9. [DOI] [PubMed] [Google Scholar]
- [26].Radtke CL, Nino-Fong R, Esparza Gonzalez BP, Stryhn H, McDuffee LA, Characterization and osteogenic potential of equine muscle tissue- and periosteal tissue-derived mesenchymal stem cells in comparison with bone marrow- and adipose tissue-derived mesenchymal stem cells, Am J Vet Res 74(5) (2013) 790–800. [DOI] [PubMed] [Google Scholar]
- [27].Mendes LF, Katagiri H, Tam WL, Chai YC, Geris L, Roberts SJ, Luyten FP, Advancing osteochondral tissue engineering: bone morphogenetic protein, transforming growth factor, and fibroblast growth factor signaling drive ordered differentiation of periosteal cells resulting in stable cartilage and bone formation in vivo, Stem cell research & therapy 9(1) (2018) 42–42. [DOI] [PMC free article] [PubMed] [Google Scholar]
- [28].Roberts SJ, van Gastel N, Carmeliet G, Luyten FP, Uncovering the periosteum for skeletal regeneration: the stem cell that lies beneath, Bone 70 (2015) 10–8. [DOI] [PubMed] [Google Scholar]
- [29].Kudva AK, Luyten FP, Patterson J, RGD-functionalized polyethylene glycol hydrogels support proliferation and in vitro chondrogenesis of human periosteum-derived cells, J Biomed Mater Res A 106(1) (2018) 33–42. [DOI] [PubMed] [Google Scholar]
- [30].Bolander J, Ji W, Geris L, Bloemen V, Chai YC, Schrooten J, Luyten FP, The combined mechanism of bone morphogenetic protein- and calcium phosphate-induced skeletal tissue formation by human periosteum derived cells, Eur Cell Mater 31 (2016) 11–25. [DOI] [PubMed] [Google Scholar]
- [31].Kudva AK, Luyten FP, Patterson J, In vitro screening of molecularly engineered polyethylene glycol hydrogels for cartilage tissue engineering using periosteum-derived and ATDC5 cells, International journal of molecular sciences 19(11) (2018) 3341. [DOI] [PMC free article] [PubMed] [Google Scholar]
- [32].Kudva AK, Luyten FP, Patterson J, Initiating human articular chondrocyte re-differentiation in a 3D system after 2D expansion, Journal of materials science. Materials in medicine 28(10) (2017) 156–156. [DOI] [PMC free article] [PubMed] [Google Scholar]
- [33].Solorio LD, Dhami CD, Dang PN, Vieregge EL, Alsberg E, Spatiotemporal regulation of chondrogenic differentiation with controlled delivery of transforming growth factor-beta1 from gelatin microspheres in mesenchymal stem cell aggregates, Stem Cells Transl Med 1(8) (2012) 632–9. [DOI] [PMC free article] [PubMed] [Google Scholar]
- [34].Solorio LD, Vieregge EL, Dhami CD, Dang PN, Alsberg E, Engineered cartilage via self-assembled hMSC sheets with incorporated biodegradable gelatin microspheres releasing transforming growth factor-beta1, J Control Release 158(2) (2012) 224–32. [DOI] [PMC free article] [PubMed] [Google Scholar]
- [35].Solorio LD, Fu AS, Hernandez-Irizarry R, Alsberg E, Chondrogenic differentiation of human mesenchymal stem cell aggregates via controlled release of TGF-beta1 from incorporated polymer microspheres, J Biomed Mater Res A 92(3) (2010) 1139–44. [DOI] [PMC free article] [PubMed] [Google Scholar]
- [36].Lee K, Silva EA, Mooney DJ, Growth factor delivery-based tissue engineering: general approaches and a review of recent developments, J R Soc Interface 8(55) (2011) 153–70. [DOI] [PMC free article] [PubMed] [Google Scholar]
- [37].Solorio L, Zwolinski C, Lund AW, Farrell MJ, Stegemann JP, Gelatin microspheres crosslinked with genipin for local delivery of growth factors, J Tissue Eng Regen Med 4(7) (2010) 514–23. [DOI] [PMC free article] [PubMed] [Google Scholar]
- [38].FDA, FDA announces final rule on bovine spongiform encephalopathy, 2016. https://www.fda.gov/food/newsevents/constituentupdates/ucm490542.htm. (Accessed 03 Apr 2018).
- [39].Opinion of the Scientific Panel on biological hazards (BIOHAZ) on the “Quantitative assessment of the human BSE risk posed by gelatine with respect to residual BSE”, EFSA Journal 4(1) (2006) 312. [Google Scholar]
- [40].Tsai CC, Huang RN, Sung HW, Liang HC, In vitro evaluation of the genotoxicity of a naturally occurring crosslinking agent (genipin) for biologic tissue fixation, J Biomed Mater Res 52(1) (2000) 58–65. [DOI] [PubMed] [Google Scholar]
- [41].Butler MF, Ng YF, Pudney PDA, Mechanism and kinetics of the crosslinking reaction between biopolymers containing primary amine groups and genipin, Journal of Polymer Science Part A: Polymer Chemistry 41(24) (2003) 3941–3953. [Google Scholar]
- [42].Liang HC, Chang WH, Liang HF, Lee MH, Sung HW, Crosslinking structures of gelatin hydrogels crosslinked with genipin or a water‐soluble carbodiimide, Journal of Applied Polymer Science 91(6) (2004) 4017–4026. [Google Scholar]
- [43].Yamamoto M, Ikada Y, Tabata Y, Controlled release of growth factors based on biodegradation of gelatin hydrogel, J Biomater Sci Polym Ed 12(1) (2001) 77–88. [DOI] [PubMed] [Google Scholar]
- [44].Patel ZS, Yamamoto M, Ueda H, Tabata Y, Mikos AG, Biodegradable gelatin microparticles as delivery systems for the controlled release of bone morphogenetic protein-2, Acta Biomater 4(5) (2008) 1126–38. [DOI] [PMC free article] [PubMed] [Google Scholar]
- [45].Eyckmans J, Roberts SJ, Schrooten J, Luyten FP, A clinically relevant model of osteoinduction: a process requiring calcium phosphate and BMP/Wnt signalling, J Cell Mol Med 14(6B) (2010) 1845–56. [DOI] [PMC free article] [PubMed] [Google Scholar]
- [46].Dikina AD, Strobel HA, Lai BP, Rolle MW, Alsberg E, Engineered cartilaginous tubes for tracheal tissue replacement via self-assembly and fusion of human mesenchymal stem cell constructs, Biomaterials 52 (2015) 452–62. [DOI] [PMC free article] [PubMed] [Google Scholar]
- [47].Lev R, Spicer SS, Specific staining of sulphate groups with alcian blue at low pH, J Histochem Cytochem 12 (1964) 309. [DOI] [PubMed] [Google Scholar]
- [48].Dayan D, Hiss Y, Hirshberg A, Bubis JJ, Wolman M, Are the polarization colors of picrosirius red-stained collagen determined only by the diameter of the fibers?, Histochemistry 93(1) (1989) 27–9. [DOI] [PubMed] [Google Scholar]
- [49].McBeath R, Pirone DM, Nelson CM, Bhadriraju K, Chen CS, Cell shape, cytoskeletal tension, and RhoA regulate stem cell lineage commitment, Dev Cell 6(4) (2004) 483–95. [DOI] [PubMed] [Google Scholar]
- [50].Chen S, Crawford M, Day RM, Briones VR, Leader JE, Jose PA, Lechleider RJ, RhoA modulates Smad signaling during transforming growth factor-beta-induced smooth muscle differentiation, J Biol Chem 281(3) (2006) 1765–70. [DOI] [PMC free article] [PubMed] [Google Scholar]
- [51].Nguyen LH, Kudva AK, Guckert NL, Linse KD, Roy K, Unique biomaterial compositions direct bone marrow stem cells into specific chondrocytic phenotypes corresponding to the various zones of articular cartilage, Biomaterials 32(5) (2011) 1327–38. [DOI] [PubMed] [Google Scholar]
- [52].Hayashi K, Tabata Y, Preparation of stem cell aggregates with gelatin microspheres to enhance biological functions, Acta Biomater 7(7) (2011) 2797–803. [DOI] [PubMed] [Google Scholar]
- [53].Ruettger A, Neumann S, Wiederanders B, Huber R, Comparison of different methods for preparation and characterization of total RNA from cartilage samples to uncover osteoarthritis in vivo, BMC Research Notes 3(1) (2010) 7. [DOI] [PMC free article] [PubMed] [Google Scholar]
- [54].Gehrsitz A, McKenna LA, Söder S, Kirchner T, Aigner T, Isolation of RNA from small human articular cartilage specimens allows quantification of mRNA expression levels in local articular cartilage defects, Journal of Orthopaedic Research 19(3) (2001) 478–481. [DOI] [PubMed] [Google Scholar]
- [55].Le Bleu HK, Kamal FA, Kelly M, Ketz JP, Zuscik MJ, Elbarbary RA, Extraction of high-quality RNA from human articular cartilage, Analytical biochemistry 518 (2017) 134–138. [DOI] [PMC free article] [PubMed] [Google Scholar]
- [56].Baelde HJ, Cleton-Jansen AM, van Beerendonk H, Namba M, Bovée JVMG, Hogendoorn PCW, High quality RNA isolation from tumours with low cellularity and high extracellular matrix component for cDNA microarrays: application to chondrosarcoma, Journal of Clinical Pathology 54(10) (2001) 778. [DOI] [PMC free article] [PubMed] [Google Scholar]
- [57].Mallein-Gerin F, Gouttenoire J, RNA extraction From cartilage, in: Sabatini M, Pastoureau P, De Ceuninck F (Eds.), Cartilage and Osteoarthritis: Volume 1: Cellular and Molecular Tools, Humana Press, Totowa, NJ, 2004, pp. 101–104. [DOI] [PubMed] [Google Scholar]
- [58].Smale G, Sasse J, RNA isolation from cartilage using density gradient centrifugation in cesium trifluoroacetate: An RNA preparation technique effective in the presence of high proteoglycan content, Analytical biochemistry 203(2) (1992) 352–356. [DOI] [PubMed] [Google Scholar]
- [59].McKenna LA, Gehrsitz A, Söder S, Eger W, Kirchner T, Aigner T, Effective isolation of high-quality total RNA from human adult articular cartilage, Analytical biochemistry 286(1) (2000) 80–85. [DOI] [PubMed] [Google Scholar]